Article

Preservative Effects of Gelatin Active Coating Containing Eugenol and Higher CO2 Concentration Modified Atmosphere Packaging on Chinese Sea bass (Lateolabrax maculatus) during Superchilling (−0.9 °C) Storage

1
College of Food Science and Technology, Shanghai Ocean University, Shanghai 201306, China
2
National Experimental Teaching Demonstration Center for Food Science and Engineering Shanghai Ocean University, Shanghai 201306, China
3
Shanghai Engineering Research Center of Aquatic Product Processing and Preservation, Shanghai 201306, China
4
Shanghai Professional Technology Service Platform on Cold Chain Equipment Performance and Energy Saving Evaluation, Shanghai 201306, China
*
Authors to whom correspondence should be addressed.
Molecules 2020, 25(4), 871; https://doi.org/10.3390/molecules25040871
Submission received: 8 January 2020 / Revised: 2 February 2020 / Accepted: 14 February 2020 / Published: 17 February 2020
(This article belongs to the Special Issue Recent Trends in Active Food Packaging)

Abstract

:
The purpose of this research was to explore the fresh keeping effect of modified atmosphere packaging (MAP) with different gas ratios combined with gelatin active coatings containing eugenol on Chinese sea bass stored at −0.9 °C for 36 days. The results showed that MAP3 (60% CO2/10% O2/30% N2), together with gelatin active coatings containing eugenol, could prevent water loss, which maintained high field NMR, MRI, and organoleptic evaluation results. This hurdle technology could also effectively delay the bacterial reproduction, protein degradation, and alkaline accumulation, so it showed the lowest K value, total volatile basic nitrogen, free amino acids, total viable count, Pseudomonas spp., and H2S-producing bacteria, which better maintain the quality of sea bass.

1. Introduction

Chinese sea bass (Lateolabrax maculatus) is an important economic aquaculture fish and is widely distributed in China. In the last several years, the annual output of sea bass culture has reached more than 100,000 tons [1]. The consumption of sea bass has also increased due to its nutritional characteristics as well as its benefits to consumer health [2]. However, fresh sea bass is high in protein and water and is prone to corruption and deterioration in the process of transportation, storage, processing, and marketing [3,4].
Superchilling is the process of lowering the temperature of a product just below its initial freezing temperature and the proportion of water frozen is approximately 5–30% preserved within the food product [5,6,7,8]. Superchilling has been used in fish processing to help significantly increase the shelf life and has been successfully applied in the preservation of Atlantic mackerel [9], hairtail [10], olive flounder [11], and seabream [12] as well as other seafood products. Aside from the temperature control, modified atmosphere packaging (MAP) could also inhibit the growth of spoilage microflora on fish [13,14]. Zhu et al. [15] reported that superchilling (−0.7 °C) with high-CO2 packaging (60% CO2/40% N2) could inhibit substantial inhibition of the biochemical and microbial deterioration of catfish (Clarias gariepinus) muscle during storage. Parlapani et al. [16] showed that 2 °C combined with 60% CO2/10% O2/30% N2 could slow down the increases of total volatile basic nitrogen (TVB-N) and trimethylamine nitrogen (TMA-N) and extend the shelf life by about four days. The gas component in the package delays the metabolic process of microorganisms and inhibits the growth and development of microorganisms to enable the microorganisms in a basically dormant or semi-dormant state, which achieves the purpose of extending the shelf life of packaged food [17]. He et al. [18] reported that MAP and enzyme inhibitors could reduce the protein oxidation of tilapia muscle during ice storage. Messina et al. [19] studied atmosphere packaging (80% CO2/20% N2) in combination with UV-C radiation (106.32 mJ/cm2), enhancing the shelf life of rainbow trout fillets by at least twice. Yew et al. [20] found that the higher concentration of CO2 could inhibit the formation of biogenic amines in Indian mackerel stored at 5 ± 1 °C.
Eugenol belongs to the group of phenolic components that possess strong antimicrobial and antioxidant capacity [21,22]. It kills cells by increasing the permeability of bacterial cell membranes, which leads to the leakage of substances in the cells [23]. In our previous research [24], the addition of 0.15% eugenol combined with superchilling (−0.9 °C) could maintain the moisture and freshness of sea bass and extend the shelf life. Therefore, the objective of our research was to explore the effect of different ratios of atmosphere proportion combined with a gelatin active coating enriched with a eugenol emulsion on Chinese sea bass at −0.9 °C.

2. Results and Discussions

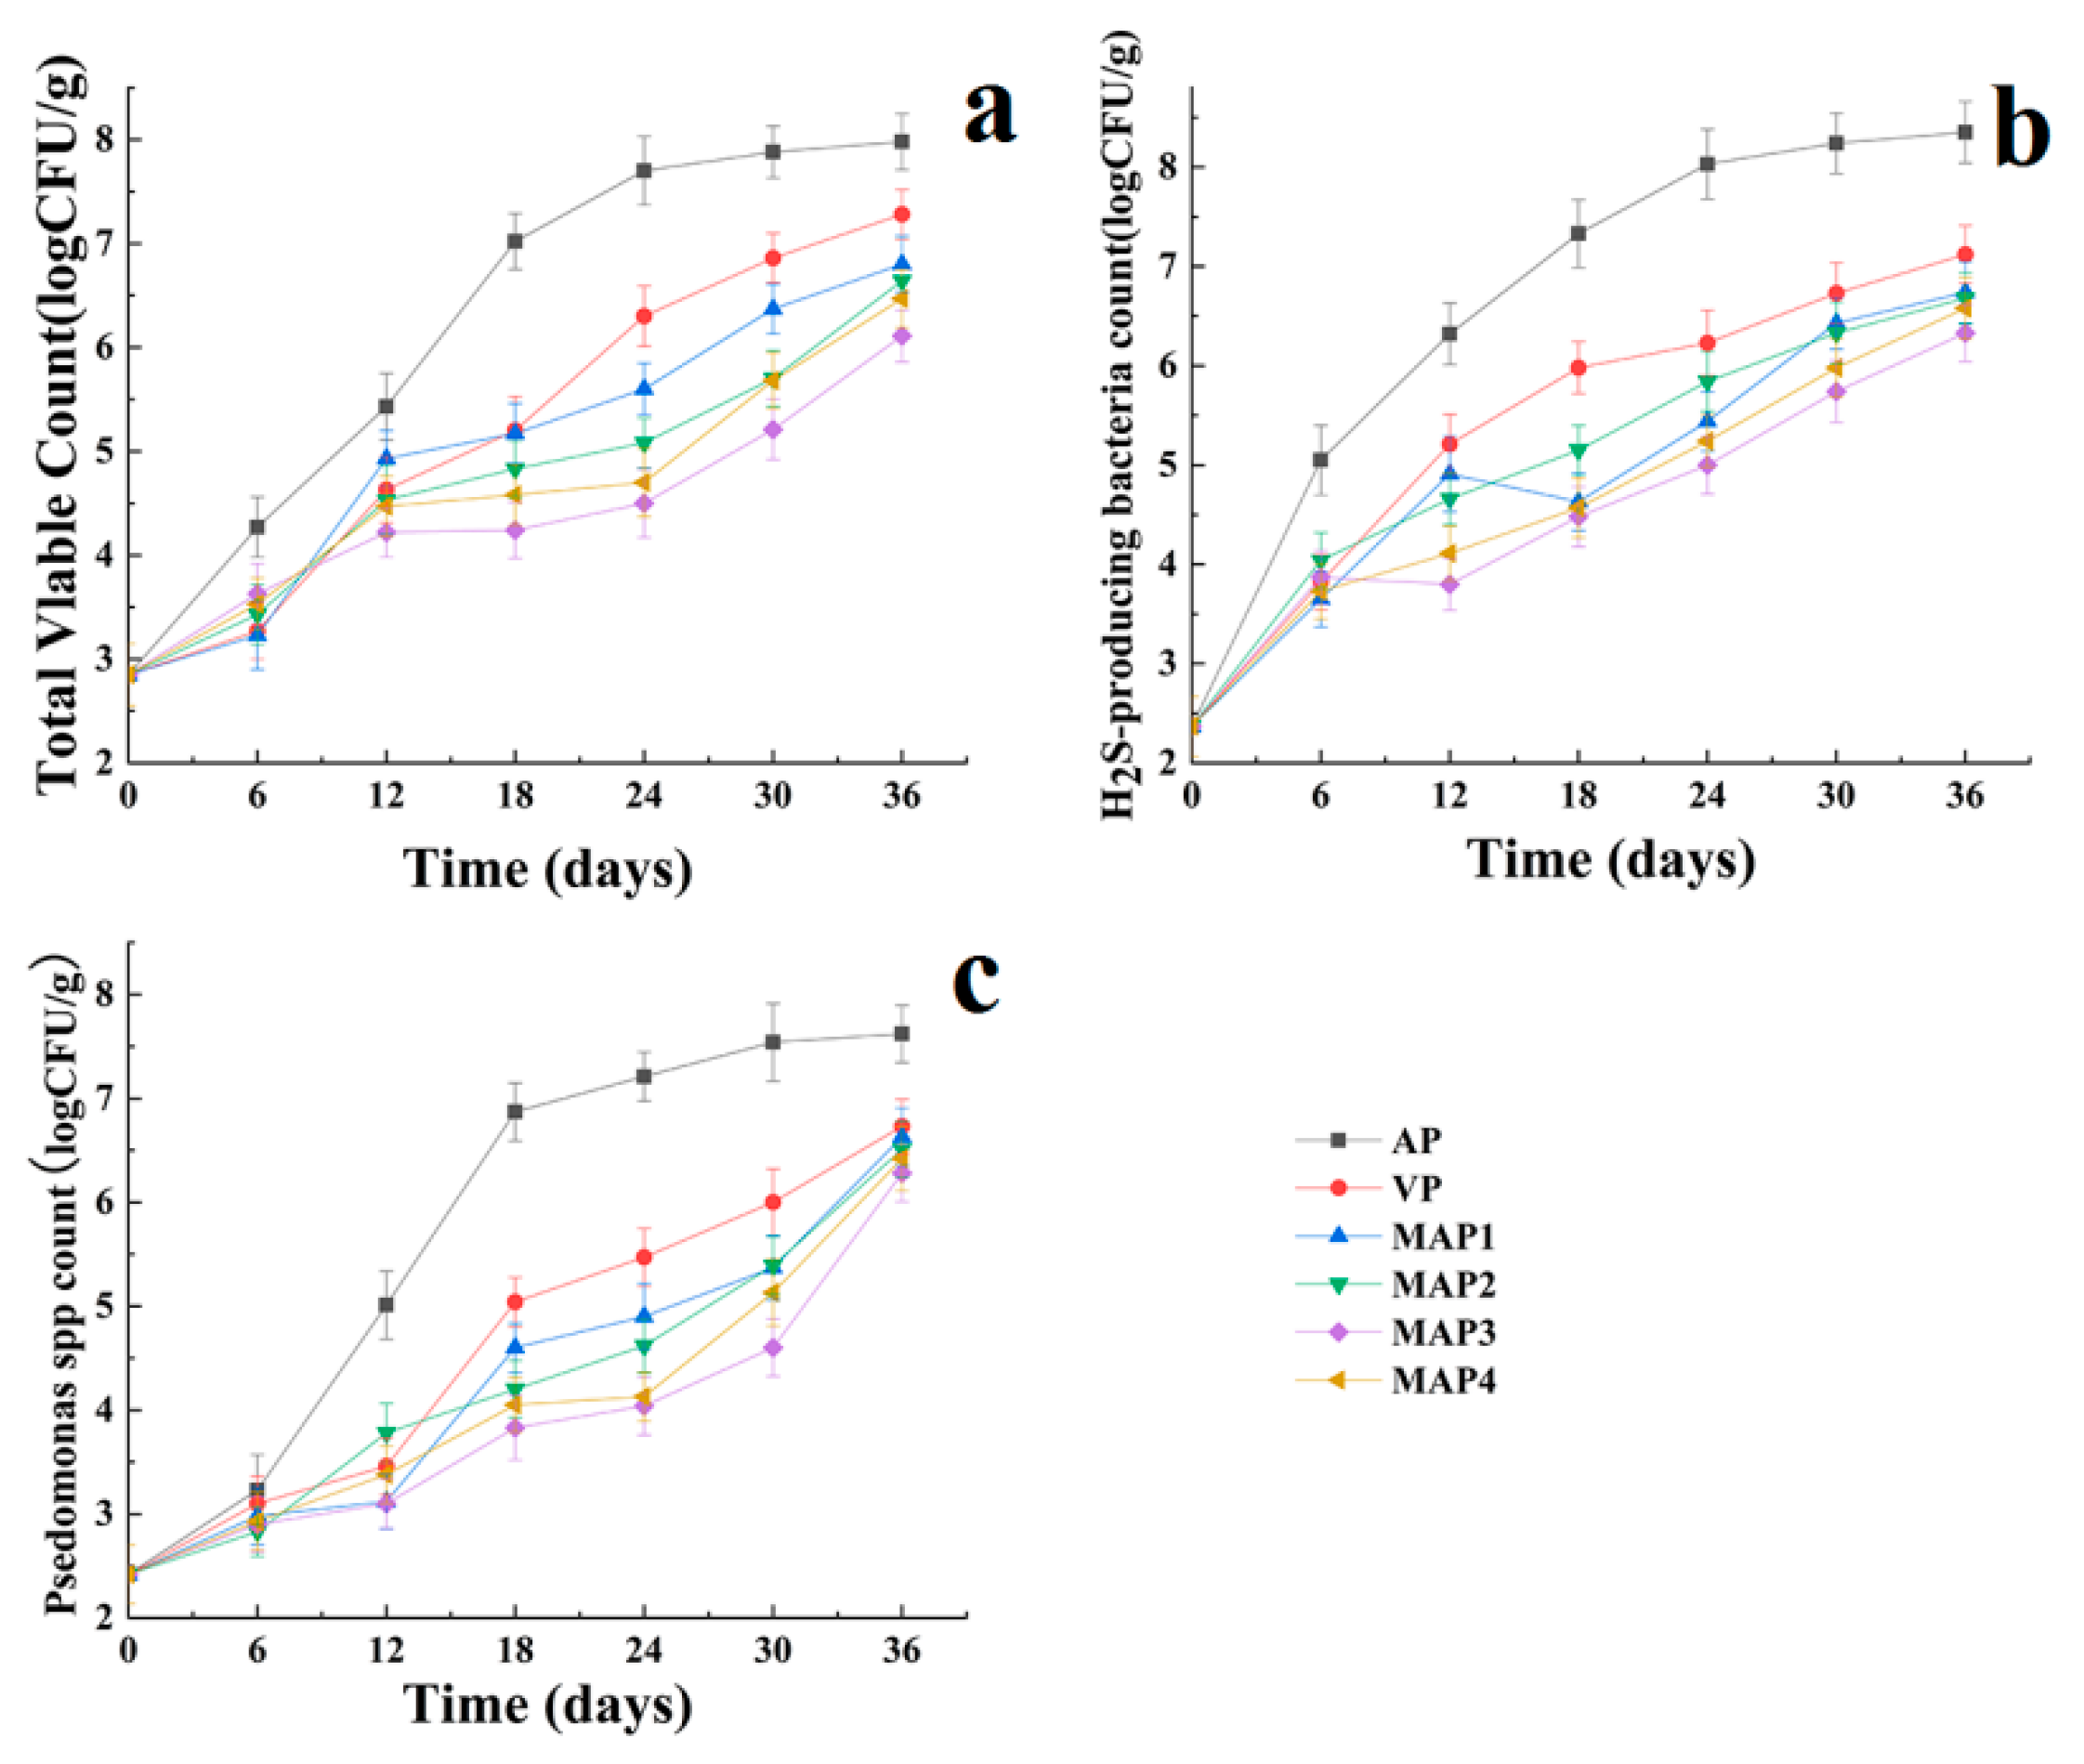
2.1. Microbiological Results
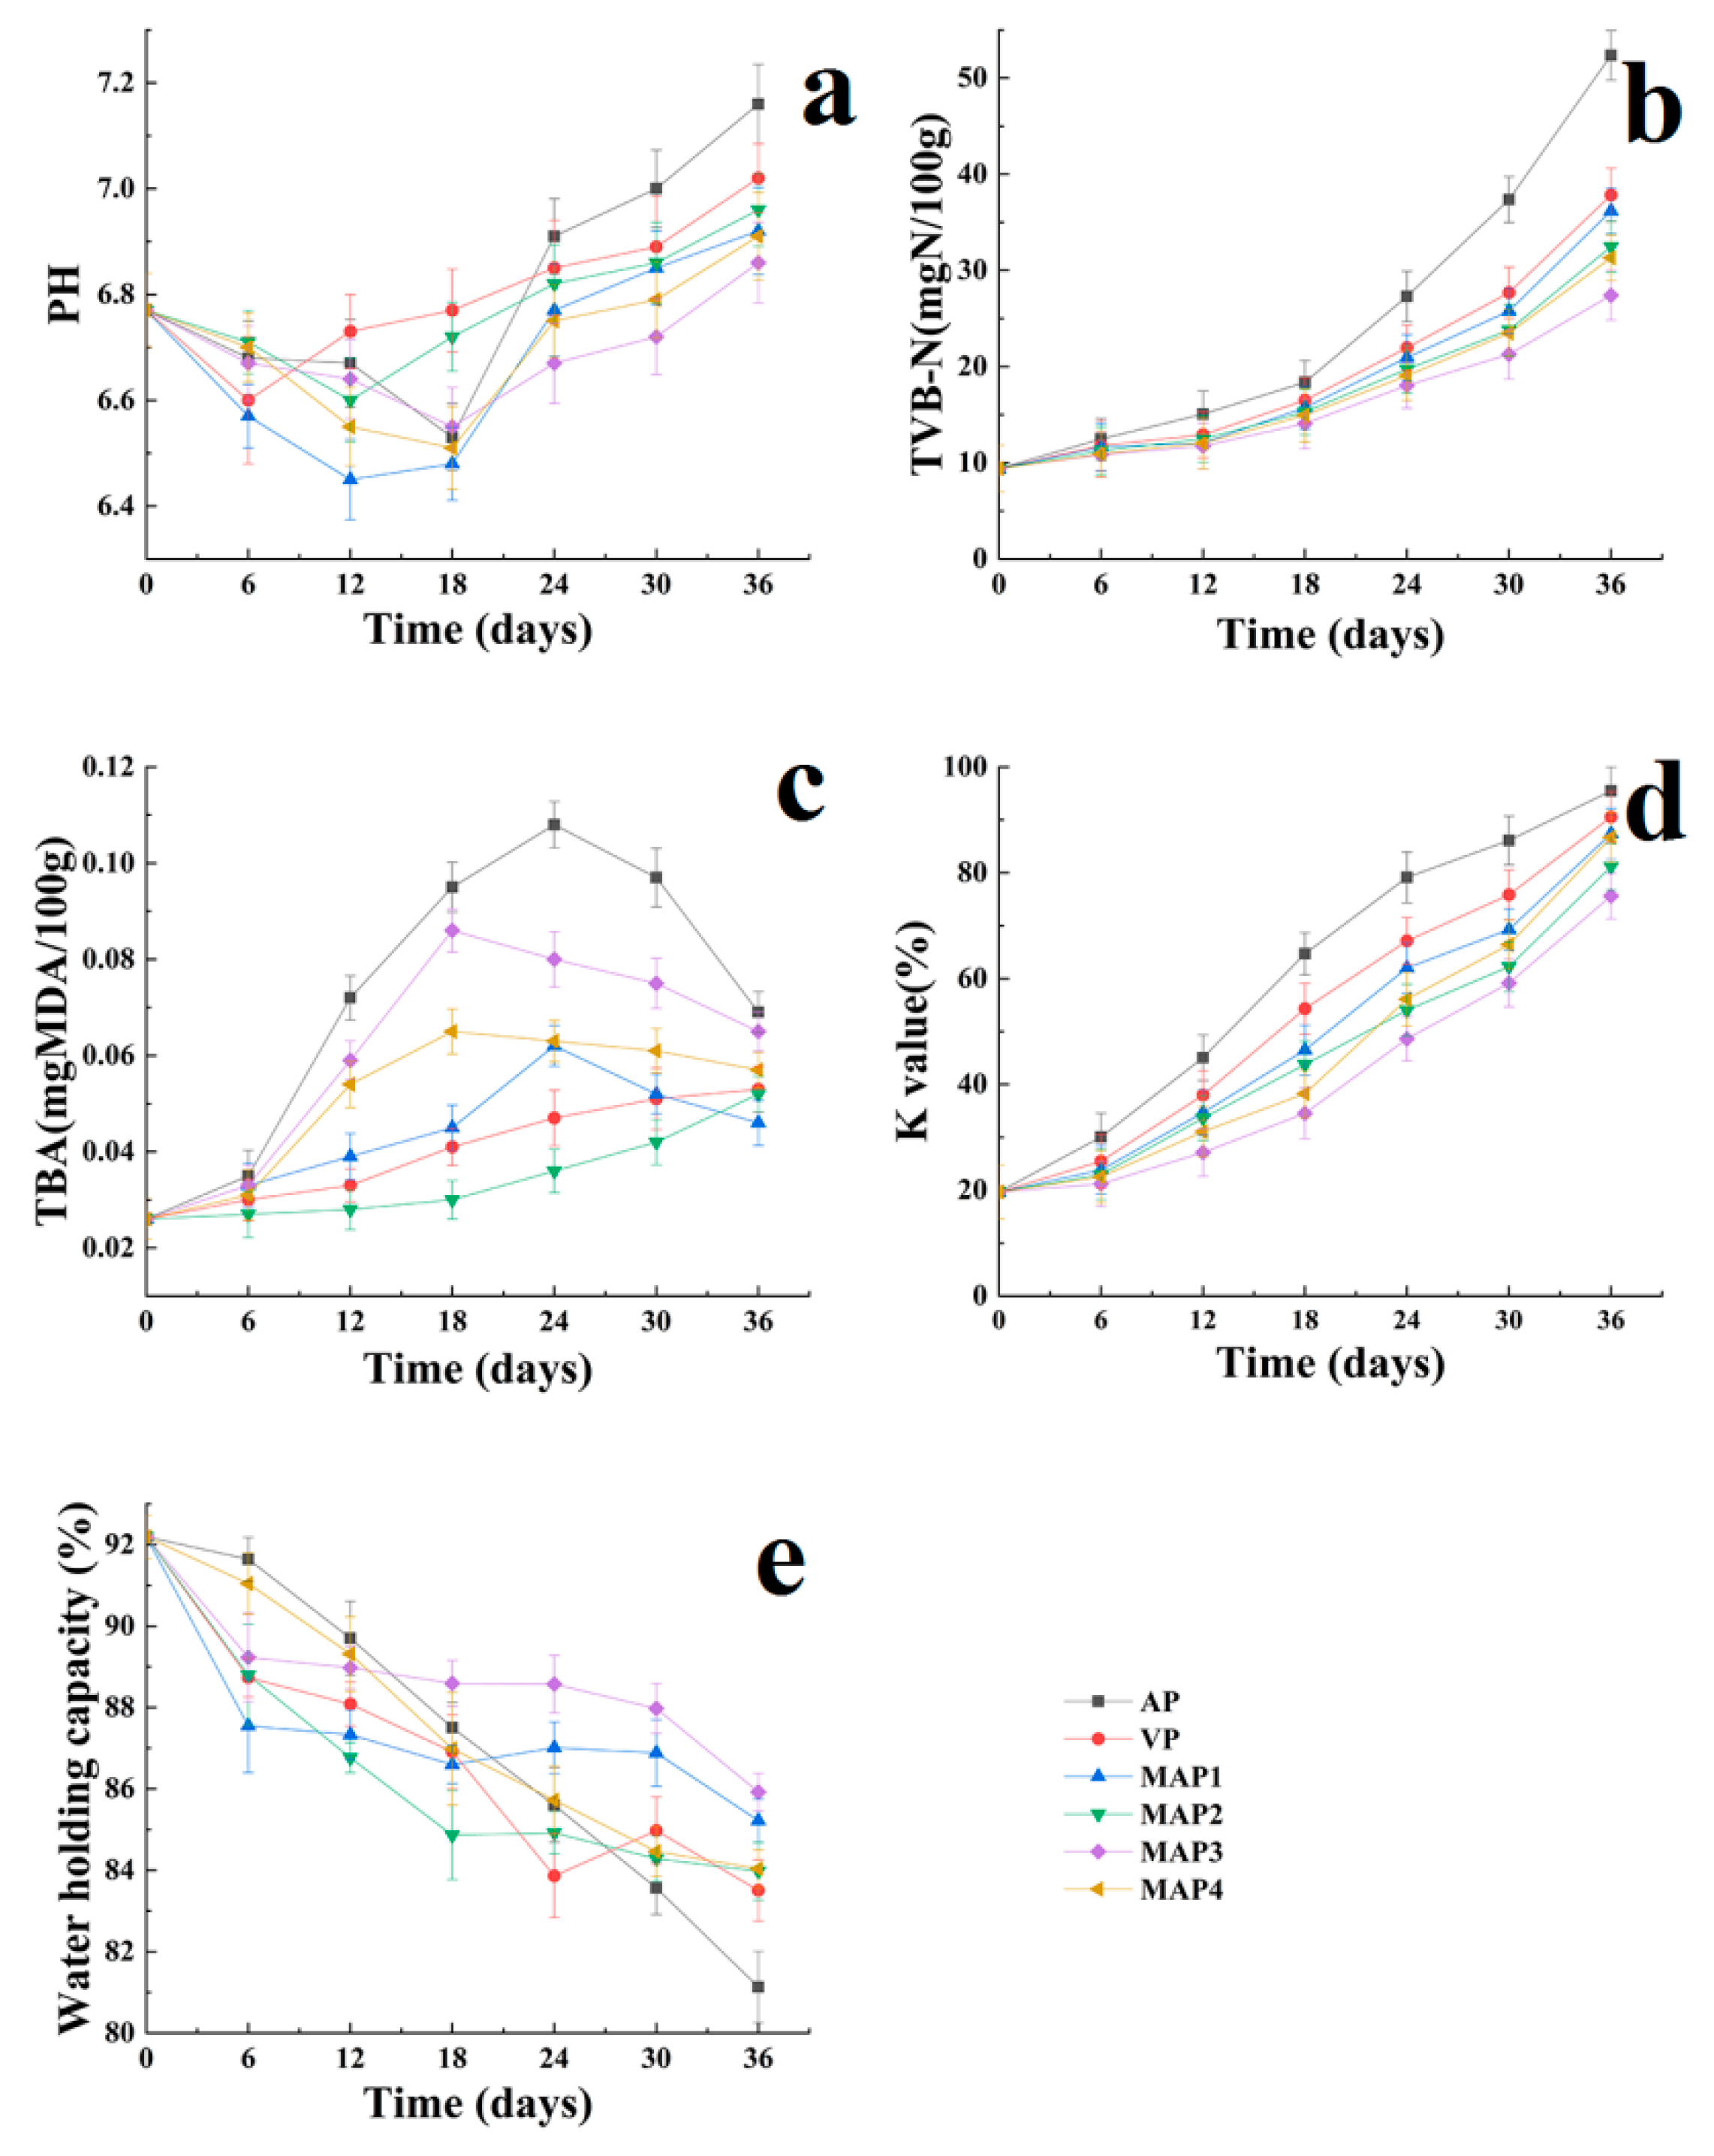
Figure 1 shows the data corresponding to the growth of total viable count (TVC) of Pseudomonas spp. and H2S-producing bacteria of Chinese sea bass samples during superchilling storage at −0.9 °C for 36 days. The TVC on day 0 was 2.84 log10 CFU/g and increased during superchilling storage. The air package (AP) treated sea bass samples are no longer edible on the 18th day because it reaches the “shelf-life” limit of 7.0 log10 CFU/g for marine fish [25]. High CO2 and lower O2 concentration could inhibit the microbial growth [26] and the gelatin active coating, acting as a barrier against oxygen transfer, could inhibit the growth of aerobic bacteria [27]. The lower O2 could inhibit the growth of aerobic spoilage bacteria and the decomposition of trimethylamine oxide (TMAO) into trimethylamine, which can form a strong antimicrobial barrier with high CO2. Furthermore, eugenol possesses “moderate-strong inhibitory” characteristics to inhibit the microbial growth to extend the shelf-life of fish during storage [28,29]. Compared with AP treated sea bass samples, the gelatin active coating containing eugenol and MAP treated samples significantly inhibited the microbial growth during superchilling storage at −0.9 °C. Marchese et al. [30] reported that eugenol showed a good antimicrobial effect on Gram-negative bacteria. Similar results were also obtained in the present research toward the increase of Pseudomonas spp. and H2S-producing bacteria, which are considered as common specific spoilage organisms (SSOs) in fish during cold storage [30,31,32]. The population of these two kinds of microbial communities increased with an increase in the storage time in all samples (Figure 1b,c). The growth pattern for Pseudomonas spp. (Figure 1b) was similar to that of total valble count (TVC). The count of Pseudomonas spp. was 2.37 log10 CFU/g on day 0 and increased to 8.13 log10 CFU/g at the end of storage for the AP treated samples. However, other sea bass samples were still under 7 log10 CFU/g on the 36th day. The growth of Pseudomonas spp. was favored by packaging in air and was effectively inhibited by high CO2 concentrations (60%) [26]. Additionally, the lower O2 concentration was also probably an important factor to inhibit Pseudomonas growth. The initial count of H2S-producing bacteria in sea bass samples was 2.42 log10 CFU/g and also had a similar trend with that of TVC (Figure 1c). The counts of H2S-producing bacteria increased to 8.35, 7.12, 6.74, 6.68, 6.33, and 6.58 log10 CFU/g, respectively, in AP, VP, MAP1, MAP2, MAP4, and MAP3 treated samples on the 36th day. H2S-producing bacteria could use electron acceptors including TMAO instead of oxygen to survive under oxygen or hypoxia conditions [33] and produced proteolytic and lipolytic enzymes that led to food spoilage, which could break down proteins and produce an off-flavor to degrade sea bass quality [34]. Mohan et al. [35] reported that MAP with 60% CO2 could inhibit the growth of aerobic spoilage microorganisms and lower the intracellular pH value. Provincial et al. [36] studied the effects of MAP with 40, 50, and 60% CO2 on sea bass storage and reported that 60% CO2 could effectively inhibit the growth of spoilage microorganisms during cold storage. The content of O2 in MAP is usually kept as 5 or 10%, which could inhibit the growth of aerobic spoilage bacteria and the decomposition of TMAO into trimethylamine.

2.2. pH Values

Microbial activity can also be measured indirectly by pH values [37]. The pH value of sea bass muscle on 0 day was 6.77 and showed a decreased tendency initially, and then increased (Figure 2a). It could be seen that the pH of AP treated sea bass samples was significantly (p < 0.05) higher than the other samples. The pH of the gelatin active coating containing eugenol and the MAP treated samples were at approximately 6.86–6.96, whereas the pH of the AP and VP treated samples increased drastically to pH 7.16 and 7.02 on the 36th day, respectively. The initial pH decrease was caused by the accumulation of lactic acid during glycolysis and the release of inorganic phosphates from ATP degradation [38]. However, the increase in pH values resulted from the production of volatile basic components such as biogenic amines, ammonia, and trimethylamines as a result of endogenous enzymes and bacterial propagation [39,40]. For the gelatin active coating containing eugenol and MAP treated sea bass samples, the degradation of amino acids resulting from the spoilage microorganisms was significantly inhibited and led to a decrease in the production of biogenic amines [41]. Therefore, the pH of the gelatin active coating containing eugenol and MAP treated sea bass samples was more stable than that of the AP treated samples, showing that the gelatin active coating containing eugenol and MAP treatments could help to maintain the quality of sea bass during superchilling storage.

2.3. Total Volatile Basic Nitrogen (TVB-N) Values

Notable TVB-N formation was also determined in Chinese sea bass samples in the present research (Figure 2b). The increase was especially obvious in AP treated sea bass samples. Higher TVB-N values in fish during storage demonstrated that nitrogenous materials accumulated from the degradation of nitrogen containing compounds including proteins and nucleic acids [42]. The TVB-N content of sea bass on 0 day was 9.4 mg in the N/100g sample, indicating the good quality of sea bass used in the present research [43]. TVB-N values increased for all samples during superchilling storage; however, this increase was faster at the later stages of storage due to storage conditions, endogenous enzymes, increased bacterial activity, and hygienic practices [44,45,46]. The AP treated sea bass samples exhibited a higher increase, reaching a value of 38.20 mg N/100g on day 30, which exceeded the maximum permissible level of 35 mg N/100 g for the spoilage initiation for fresh fish established by the European Commission [47]. The use of reduced oxygen atmosphere packaging such as VP and MAP could help in reducing the production of volatile basic components. The use of a gelatin active coating containing eugenol and MAP treatments showed significant effects on the TVB-N increase in sea bass samples during superchilling storage (p<0.05). At the end of storage, TVB-N values of 37.84, 36.18, 32.47, 31.32, and 27.41 mg N/100g were observed for the VP, MAP1, MAP2, MAP4, and MAP3 sea bass samples, respectively, which were still “high quality”. This protective effect of eugenol and a high CO2 concentration atmosphere could inhibit the growth of Gram-negative aerobic bacteria (Pseudomonas spp. and H2S-producing bacteria), which produced volatile compounds comparing to the AP treated sea bass samples [48,49].

2.4. Thiobarbituric Acid Reactive Substances (TBARS) Values

Thiobarbituric acid (TBA) is an indicator to evaluate the degree of lipid oxidation; TBARS were measured asmalonaldehyde (MDA) equivalent to determine the secondary oxidation products from polyunsaturated fatty acids [50]. The increase in TBA value mainly results from enzymatic hydrolysis and auto-oxidation during storage [51]. The TBARS value of sea bass samples on 0 day was 0.025 mg MDA/100 g sample (Figure 2c). Subsequently, the TBARS values of all samples showed upward trends during the early and mid-late stage, and then there were slight decreases in the AP and VP treated samples in the later stage because of the reaction of MDA with ketones and aldehydes [52]. Compared with AP treated sea bass samples, the TBARS values in the VP, MAP1, and MAP4 treated samples were relatively lower (p < 0.05). The concentrations of O2 inside these packages are about 0%, whereas that in AP is about 21%. However, the VP treated samples had no CO2 or O2, and had higher TBARS values than that of MAP4, indicating that not only the auto-oxidation of lipid, but also enzymatic hydrolysis might accelerate the increase in the TBARS value [53,54]. Meanwhile, TBARS values in MAP4 were higher than that in MAP1, which means that a higher CO2 concentration might have a certain promoting effect on enzymatic hydrolysis. Furthermore, on the basis of the TBARS results, the inhibiting effect of lipid oxidation may also be due to the presence of eugenol acting as an antioxidant [55].

2.5. Free Amino Acids (FAAs)Values

FAAs are precursors of volatile flavor compounds and are responsible for flavor development during storage [56]. In the present research, most of the FAAs showed upward trends in all Chinese sea bass samples during superchilling storage at −0.9 °C (Table 1). The major FAAs in sea bass samples were glycine, alanine, and lysine, accounting for 46.61–66.22% of total FAA content, which contribute to the desired tastes of fish [57,58]. Histidine was identified as an off-taste amino acid and accounted for 1.65–2.15% of total FAA content among all sea bass samples. On day 0, the content of histidine was 24.59 mg/100 g in the AP treated samples and decreased to 14.38 mg/100 g sea bass samples on day 36, however, the corresponding contents in MAP1, MAP2, MAP3, and MAP4 were 50.55, 48.71, 30.78, and 32.12 mg/100 g on day 30. Alanine, glycine, aspartic acid, and glutamic acid are responsible for the characteristic flavor of fish [59]. Glycine contents in AP treated samples decreased from 126.58 mg/100 g on 0 day to 58.32 mg/100 g on 36th day. Glycines content in the gelatin active coating containing eugenol and MAP treated sea bass samples had similar behaviors to the AP treated samples; however, their final contents were significantly (p < 0.05) lower than that of the AP treated samples. Sea bass samples treated with the gelatin active coating containing eugenol and MAP treatments also had significantly lower alanine contents during superchilling storage. In addition, the final total FAA level in the MAP treated samples was higher than that of the AP and VP treatments, which might be due to the reduction of water loss and spoilage organism counts by protective coatings and MAP treatments [60].

2.6. K Values

A K-value of lower than 20% is considered to be “sashimi” quality, and higher than 60% as the rejection level [61,62]. The K value in fresh sea bass samples was 19.78% and increased in all samples during superchilling storage (Figure 2d), however, the gelatin active coating containing eugenol and MAP treatments could significantly (p < 0.05) delay the increase in the K value, which had a similar behavior to that of the TVB-N values. The AP treated sea bass samples reached 64.68% on 18th day and MAP3 and MAP4 were still under the rejection value on 30th day, which was attributed to the higher CO2 concentration of MAP and the addition of eugenol. ATP and its related compounds degrade continuously after fish postmortem, where the convention from IMP to HxR is a critical reaction changing the K value under the effect of 5-nucleotidase enzymatic catalysis. Zhu et al. [53] reported that higher CO2 concentration inside the packaging bag could suppress the spoilage microbial activities, thus slowing down the breakdown of adenosine triphosphate. However, The K value of all the sea bass samples exceeded the rejection value at the end of storage.

2.7. Water Holding Capacity (WHC) Values

The WHC of fish is one the most important quality parameters affecting the weight change during storage and the tenderness and juiciness of the fish muscle [63]. WHC values of all sea bass samples decreased during superchilling storage, originating from the proteolytic activity in the muscle [64,65]. At the beginning, the decreased rate in the gelatin active coating containing eugenol and MAP treated samples was higher than that of the AP treated samples. However, at the mid-late stage of storage, the decline rate was slower and dropped from the initial value of 92.19% to about 81.13% for the VP treated samples and 83.97–85.92% for the gelatin active coating containing eugenol and MAP treated samples on day 36 (Figure 2e). The decrease in the WHC values reflected a decrease in the water protein interactions in fish muscle during superchilling storage [66].

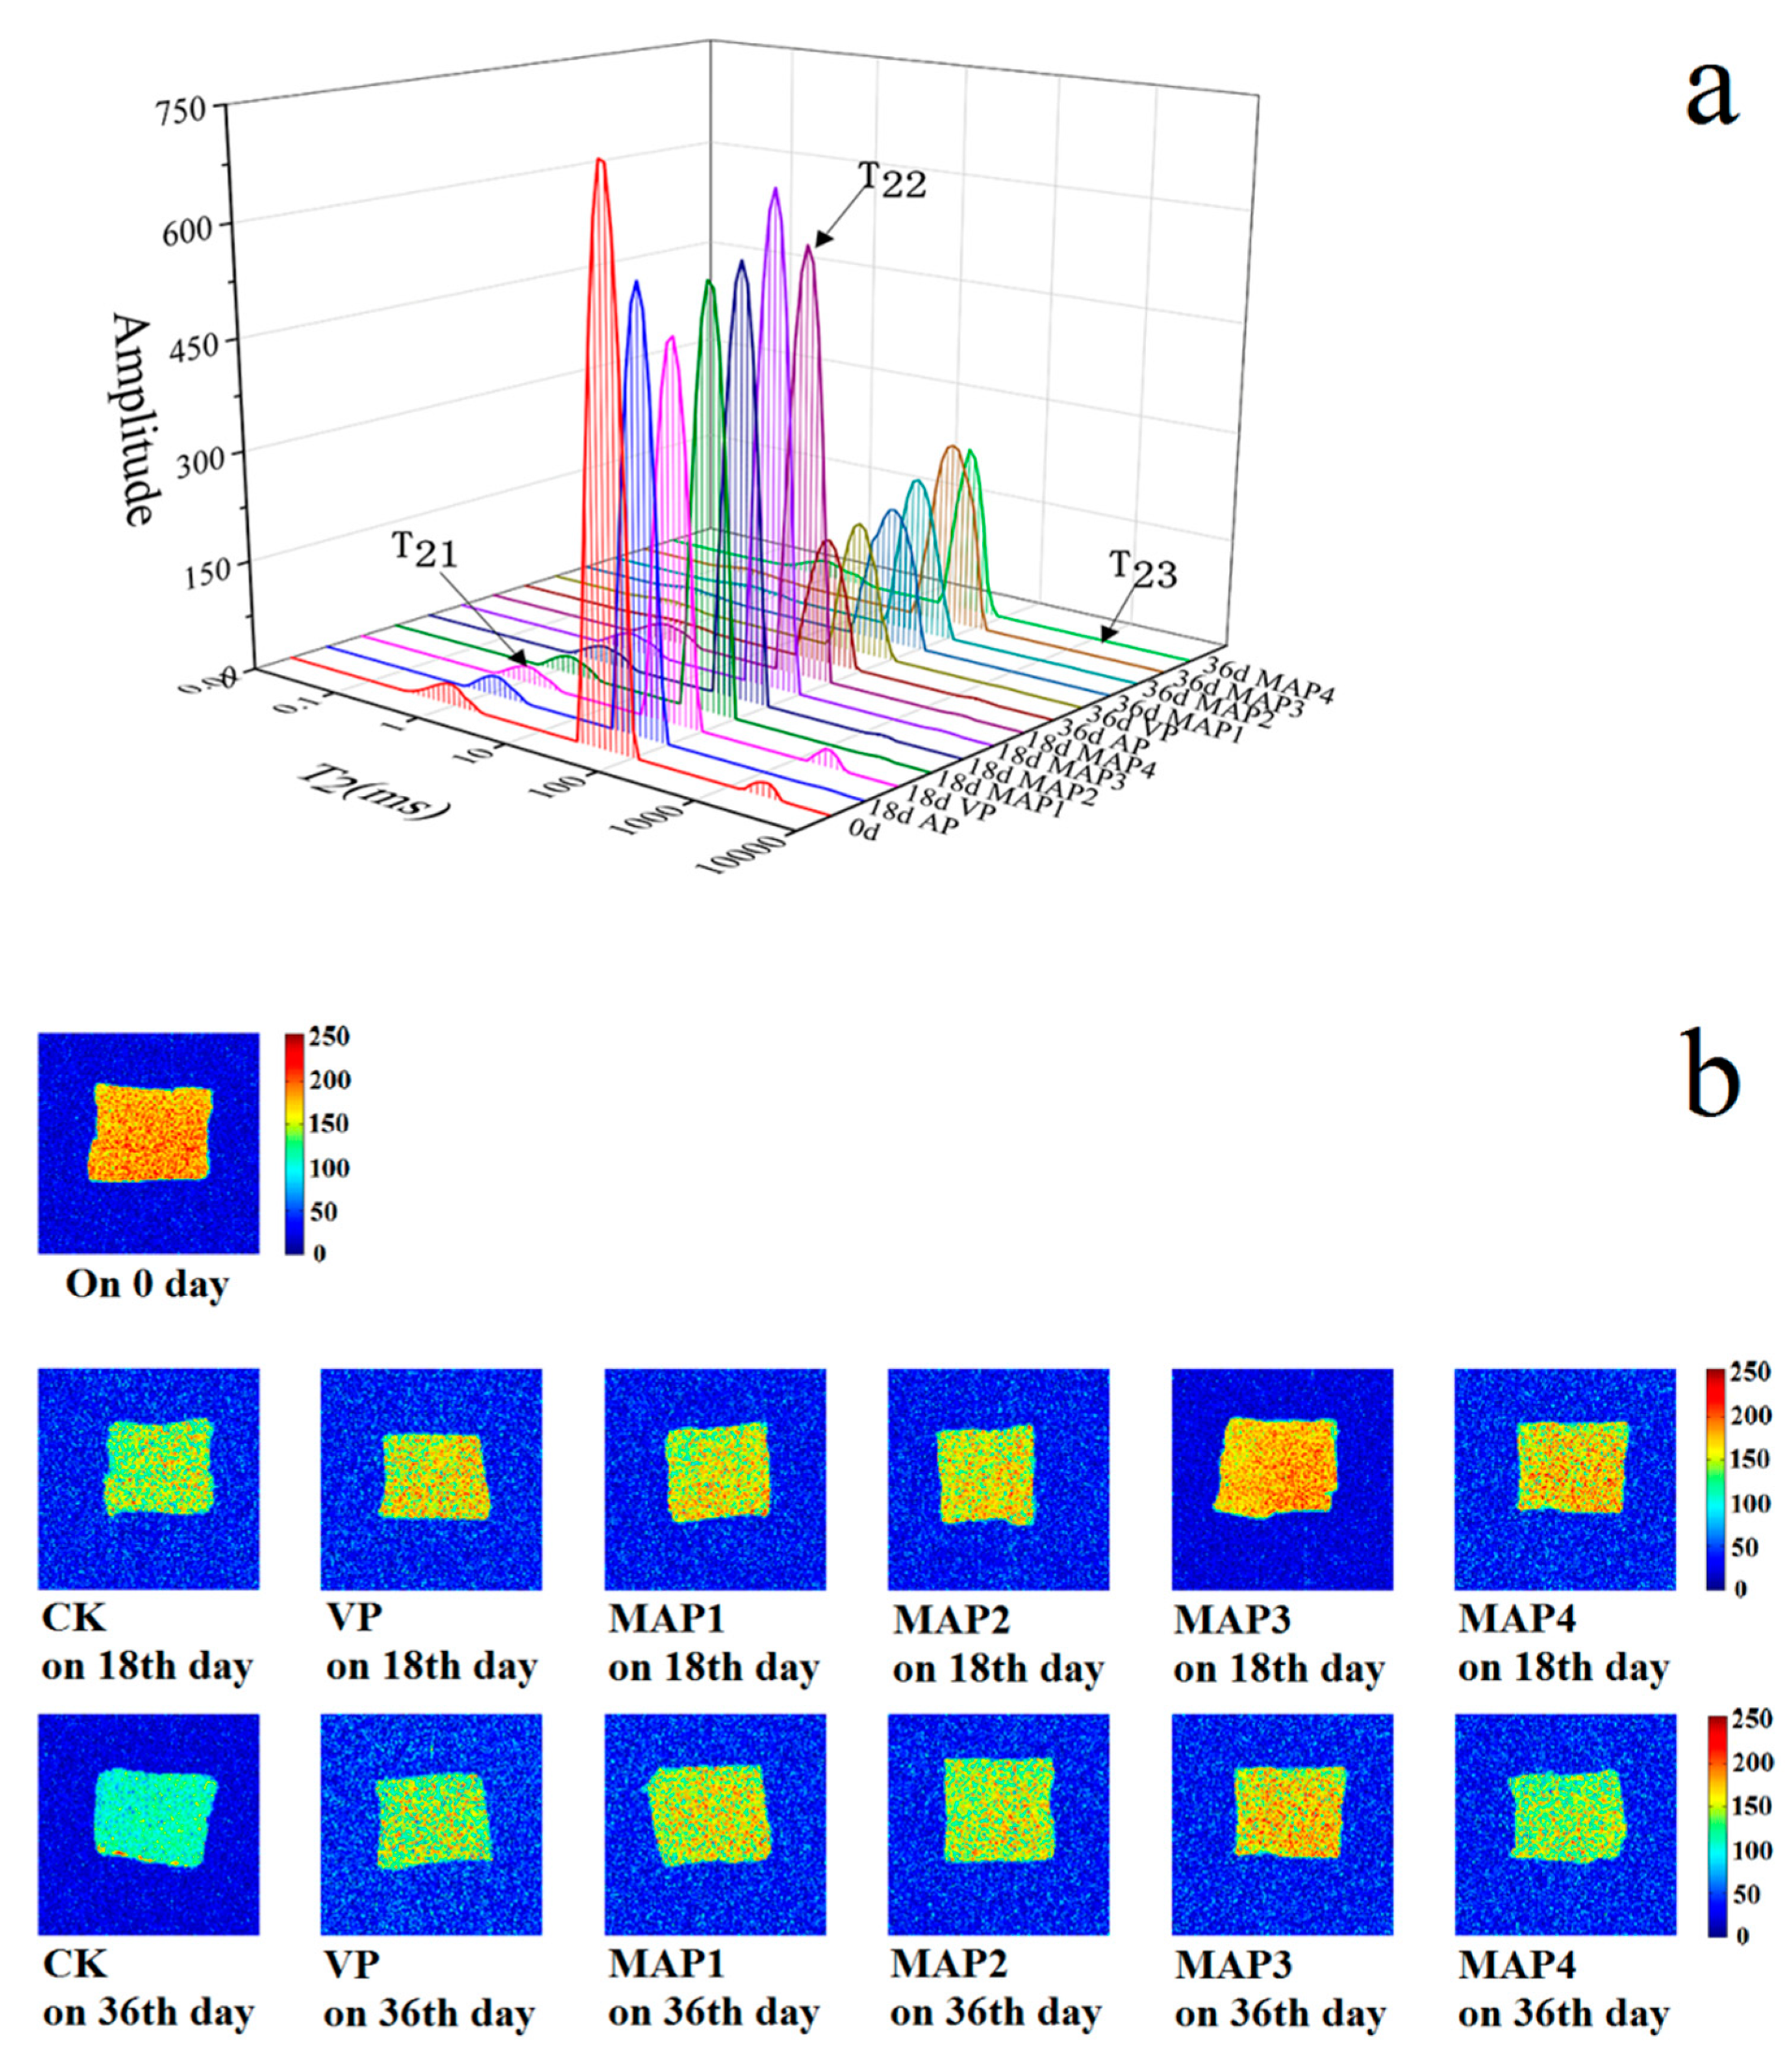
2.8. Water Distribution by Low Field Nuclear Magnetic Resonance (LF-NMR) Analysis

LF-NMR is an efficient technology to evaluate the freshness of fish, and magnetic resonance imaging (MRI) is also an assistive method for assessing water migration [67,68]. There is a regular reaction signal between hydrogen protons and sample water protons in low field NMR, which is closely related to the chemical reactions between proteins, lipids, and other cellular components [69]. The pT21, pT22, and pT23 correspond to the areas of relaxation time T21, T22, and T23. In this research, T21 showed that the bound water varied ranging from 0.79% to 1.01% during superchilling storage (Figure 3a). There was no significant difference (p > 0.05) among the gelatin active coating containing eugenol and the MAP treated sea bass samples during superchilling storage at −0.9 °C, indicting T21 could not be affected by the treated ways as well as storage time, which was due to the water entrapped within highly organized myofibril structures [70,71]. T22 was considered as immobile water within the myofibril [72] and pT22 diminished progressively during superchilling storage. T23 representing free water and pT23 increased constantly. The changes of free water in sea bass samples were more remarkable than those of bound and immobile water during superchilling storage. The AP treated sea bass samples had significant lower immobilized water (from 88.52% on 0 day to 48.53% on 36th day) than that of the MAP treated samples. MAP3 had the largest amounts of the immobilized water on 18th and 36th day, respectively, probably due to the conclusion that a higher CO2 concentration package decreased the diffusion rate of the immobile water to free water. Some researchers also demonstrated that water located within highly organized myofibril structures released or translated to free water based on the destruction of myofibril [69,73,74,75]. In addition, MAP treatments could retard this water migration and the change rates of T22 and T23 of sea bass samples during superchilling storage at −0.9 °C.
MRI could provide visual information of internal morphological organization and molecular distribution in fish [76]. As shown in Figure 3b, red represents a high proton density and blue represents a low proton density in the pesudo-color images. The signal intensity in each region of the sample was proportional to the content of water molecules, that is to say, the darker areas in the image meant that there were fewer water protons. There was no significant difference in the brightness of the image of sea bass samples on 0 day and the brightness was darker and bluer during superchilling storage. The color of the AP treated sea bass samples on 18th and 36th day were bluer than that of the MAP treated samples, indicating the degradation of myofibilin the AP treated sea bass samples during superchilling storage [68], while no significant visual difference was observed among the gelatin active coating containing eugenol and the MAP treated sea bass samples. The brightness of the MAP3 samples was redder compared to other samples, which demonstrated that the gelatin active coating containing eugenol combined with MAP3 treatment (60% CO2/10%O2/30% N2) was more suitable for quality maintenance of sea bass samples during superchilling storage and the result was in accord with the changes of LF-NMR transverse relaxation.

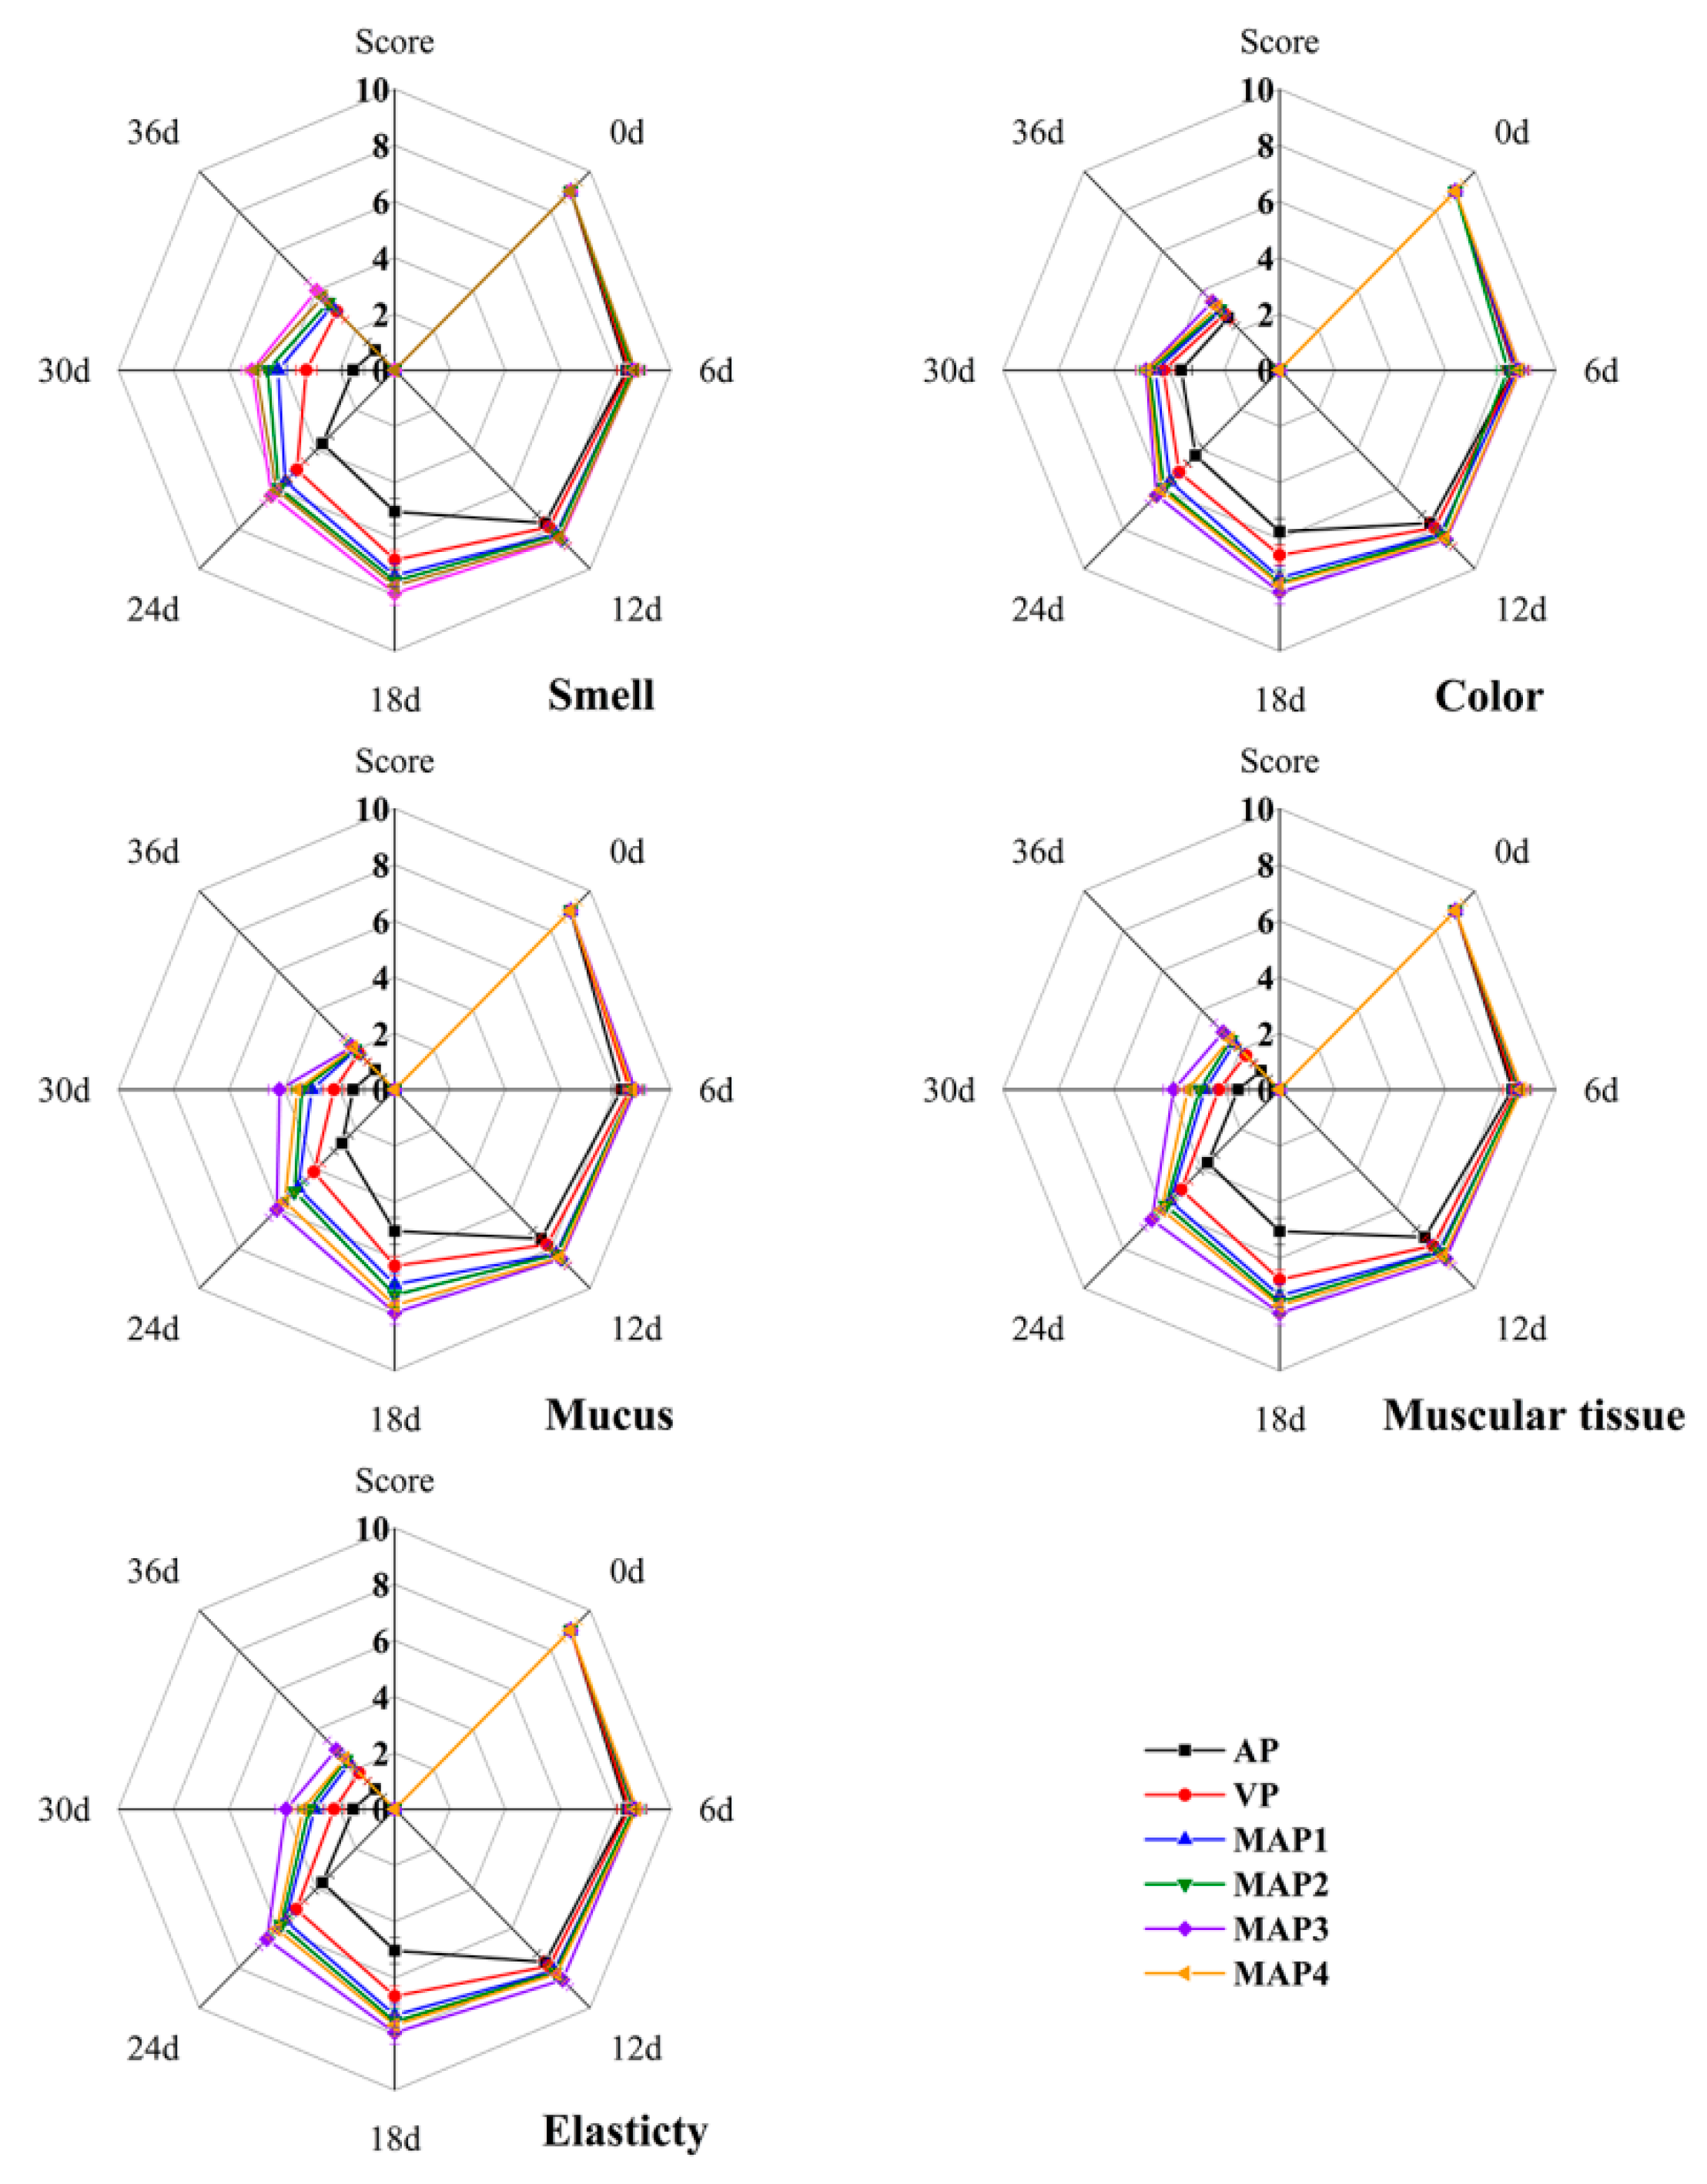
2.9. Organoleptic Properties

The organoleptic evaluation results including smell, color, mucus, muscular tissue, and elasticity of Chinese sea bass samples during superchilling storage at −0.9 °C for 36 days are presented in Figure 4. On 0 day, all samples had high organoleptic scores, indicating excellent quality. However, the quality of all sea bass samples decreased significantly (p < 0.05) with the increasing storage time. The organoleptic results showed that the gelatin active coating containing eugenol and the MAP treated sea bass samples had significantly higher scores than that of the AP and VP treated samples. On 18th day, the score of the AP treated samples was lower than 5, which was considered as an unacceptable value for sea bass samples in the present research. The gelatin active coating containing eugenol and the MAP treated sea bass samples exceeded the limitation on 30th day except for the MAP3 treated samples. Therefore, this method of treating with active coatings containing eugenol and MAP treatments could be an effective way to retard the quality deterioration and maintain the organoleptic quality of sea bass samples. Compared with the microbiological and chemical results, the organoleptic evaluation results showed some retardation in the quality evaluation of sea bass samples during superchilling storage. This was probably due to the organoleptic evaluation being subjective; and the quality deterioration appeared inside the sea bass samples first, which is usually difficult to observe in time by visual inspection [77,78]. Therefore, it should be suitable to examine the storage quality of sea bass samples by the comprehensive analysis of microbiological, chemical, and organoleptic evaluation.

3. Materials and Methods

3.1. Preparation of Gelatin Active Coatings Containing Eugenol Emulsions

In our previous research [24], the eugenol concentration used in the present research was 1.5% (v/v) and the microencapsulated emulsion was prepared according to Li et al. [79]. A total of 150 μL eugenol and 750 mg β-cyclodextrin (β-CD) were stirred mechanically in a beaker and then 5 g Tween-80 was added to make them homogeneously dispersed. Then, deionized water was added continuously to get a final volume of 100 mL and the emulsion was obtained by continuous stirring for another 6 h. The emulsion was homogenized with a rotor-stator homogenizer (HR-6, Huxi Industrial Co. Ltd., Shanghai, China) at 15,000 rpm for 5 minand the microencapsulated emulsion was obtained. Gelatin (6.0% w/w, bloom value at 240–270, BBI Life Science, Shanghai, China) and glycerol (1.5% v/w) were dissolved in prepared microencapsulated eugenol emulsions (3 L) at 50 °C and stirred for 4 h. Then, the mixture was ultrasonically treated (XEB-1000-P, Xiecheng Ultrasonic Equipment Co. Ltd., Shandong, China) at 800 W for 10 min and degassed under vacuum.

3.2. Preparation of Sea Bass and Sample Treatments

A total of 111 live sea bass with an average length of 40 ± 3 cm were obtained from a fish market in Nanhui new town (Shanghai, China), transported to the laboratory, and rested for two days in a tank supplied with oxygenated freshwater. After that, fish were slaughtered by using the ice slurry methods. After the fish were stunned by ice slurry methods, they were immediately gutted; the gill and viscera of the sea bass were removed and washed with sterilized 1% NaCl solutions. Three random sea bass samples were used to determine the basic quality profiles on 0 day. The remaining samples were immersed in the freshly prepared microencapsulated eugenol emulsions (ratio of solution to sea bass samples, 3:1, v/w) for 60 s, then allowed to drain at 4 °C around 45 min to form the active coatings on the sea bass surface. Then, the coated samples were divided into six batches and submitted to the following packages: (1) packaged in the presence of air (AP); (2) vacuum package (VP); (3) MAP1 (40% CO2/60% N2); (4) MAP2 (40% CO2/10% O2/30% N2); (5) MAP3 (60% CO2/10% O2/30% N2); and (6) MAP4 (60% CO2/40% N2). After that, all samples were stored at −0.9 ± 0.1 °C in a thermo tank (BPS-250CB, Yiheng Thermostatic Chamber, Shanghai, China). Sea bass samples were taken randomly for analysis on days 0, 6, 12, 24, 30, and 36, respectively.

3.3. Microbiological Analysis

Representative 10 g sea bass muscle was homogenized with 90 mL of stroke physiological saline solution and then subjected to serial dilutions. The total viable counts, Pseudomonas spp., and H2S-producing bacteria were cultivated on plate count agar medium, cetrimide agar medium, and iron agar medium, respectively, at 30 °C for 48 h [31].

3.4. pH Value Determination

For the determination of pH value, we referred to the method of Messina et al. [19]. Ten grams of sea bass muscle and 90 mL deionized water were homogenized at a speed of 5000 rpm for 5 min at 4 °C and then stood for 30 min. The supernatant was used to determine the pH value with a pH meter.

3.5. Water Distribution and Migration

The proton relaxation experiments were carried out according to Li et al. [73]. The dorsal part of the sea bass muscle was cut into cubes (2.5 × 2 × 1.3 cm, about 5 g) and wrapped in polyethylene films. Transverse relaxation T2 measurements were determined with a LF-NMR analyzer (Niumag MesoMR23-060H.I, Suzhou, China) with a proton resonance frequency of 20 MHz. MRI experiments were performed to gain pseudo-color images of the proton density weight of sea bass. The acquisition parameters were as follows: slice width was 3 mm, time repetition was 2000 times, and time echo was 15 ms.

3.6. WHC Determination

WHC values were determined as per the method of Zang et al. [80]. Three grams of sea bass muscle from the dorsal part was centrifuged at 3000 g for 10 min at 4 °C. The percentage of retained water after centrifugation was expressed as WHC.

3.7. TVB-N Values Determination

The TVB-N values were determined by the microtitration method [81] and expressed as mg N/100 g of sea bass muscle.

3.8. TBARS Value Determination

Lipid oxidation was monitored by the evaluation of TBARS [82] and expressed as mg of MDA/kg of sea bass muscle. Five grams of sea bass muscle was homogenized with 20 mL of 20% trichloroacetic acid solution, and rested for 1 h. After being centrifuged at 11,960 ×g for 10 min at 4 °C, 5 mL of the supernatant was mixed with 5 mL TBA solution (0.02 M) and heated in 100 °C for 40 min. Then, the mixture was cooled to room temperature with an ice bath and the absorbance was measured at 532 nm with a spectrophotometer (Evolution 220, Thermo Fisher Scientific, Waltham, MA, USA).

3.9. Determination of Adenosine Triphosphate (ATP) Related Compounds

ATP-related compounds were determined proposed by Wang et al. [83] with a reversed-phase high performance liquid chromatogram (RP-HPLC) method (Waters 2695, Milford, CT, USA). Sample preparation method was as follows: 5 g minced sea bass muscle homogenized with 10 mL10% perchloric acid (PCA) and centrifuged at 8000 g for 15 min at 4 °C. The precipitate was stirred with 10 mL 5% PCA and centrifuged at 8000 g for 10 min at 4 °C twice. The supernatant pH was adjusted to 6.5 after the supernatant was merged and added with 15 mL of distilled water. After 30 min, take the supernatant fixed in a 50 mL volumetric bottle with ultrapure water. Finally, the supernatant was filtered with a 0.22 µm membrane and applied to the RP-HPLC procedure. The chromatographic conditions were as follows: column: Shimadzu ODS–3 C18 (4.6 mm × 250 mm, 5 mm); mobile phase: A–20 mmol/L KH2PO4:20 mmol/L K2HPO4 (v/v 1:1), adjusted to pH 6.5 with phosphoric acid; B–Methanol; column temperature: 30; injection volume: 10 mL; detection wavelength: 254 nm; flow rate: 1.0 mL/min; gradient: 0–6 min 100%A, 6–15 min B increases linearly to 8%, 15–20 min B increases linearly to 35%, 20–22 min 35%B,22–24 min B decreases linearly to 0%, 24–30 min 100% A. The K value was calculated as follows:
K   value   ( % ) = HxR + Hx ATP + ADP + AMP + IMP + HxR + Hx   × 100  

3.10. FAA Analysis

FAAs were monitored by the method of Liu et al. [84] with some modifications. 5g of mashed sea bass muscle and 15 mL of 15% cold trichloroacetic acid were homogenized at 10,000 rpm for 5 min and left to stand at 4 °C for 2 h. After being centrifuged at 5980 ×g for 15 min at 4 °C, 5 mL of the supernatant was diluted with deionized water to 10mL. Then, the mixture was filtered through a 0.22 μm filter and analyzed by an amino acid analyzer (Hitachi L-8800, Tokyo, Japan). Parameter conditions of the automatic amino acid analyzer are as follows: separation column (4.6 mm × 60 mm); resin: cation exchange resin; separation column temperature: 57 °C; detection wavelength: 570 nm (proline: 440 nm); injection 20 μL; buffer flow rate: 0.35 mL/min; reaction solution: ninhydrin reagent; flow rate 0.35 mL/min; unit temperature 135 °C.

3.11. Organoleptic Properties

The Quality Index Method (QIM) developed by Lanzarin et al. [85] and Freitas et al. [86] was used for organoleptic evaluation with some modifications. The odor, color, mucus, elasticity, and muscle tissue of the sea bass were scored. Each parameter had 10 simple descriptors where 10 represented the best quality and a lower score indicated poorer quality. Twelve trained participators joined in the organoleptic evaluation. Organoleptic evaluation was done on each test day. At each sampling time, the participators were asked to state whether the sea bass samples were acceptable or not to determine the shelf life.

3.12. Statistical Analysis

The one-way analysis of variance (ANOVA) procedure was applied for multiple comparisons by SPSS 22.0, and the results were expressed as means ± standard deviation.

4. Conclusions

The gelatin active coating containing eugenol combined with MAP treatments were conducted to evaluate the effects on the quality improvement of Chinese sea bass samples during superchilling storage at −0.9 °C for 36 days. The results of physicochemical and microbiological analyses indicated that the MAP3 (60% CO2/10% O2/30% N2) treated sea bass samples maintained better quality results during superchilling storage, which was mainly due to the high CO2 and lower O2 concentrations of the MAP conditions that could effectively inhibit the growth of spoilage microorganisms to extend the shelf life. Furthermore, the gelatin active coating containing eugenol also promotes the shelf-life and safety of sea bass for its broad spectrum of antimicrobial activity and resistance to oxidation. Therefore, gelatin active coatings containing eugenol combined with 60% CO2/10% O2/30% N2 MAP treatments are suitable for maintaining the quality of Chinese sea bass samples during superchilling storage where an extended storage period may be required.

Author Contributions

Conceptualization, Q.Z.; Data curation, Q.Z. and P.L.; Formal analysis, P.L.; Funding acquisition, J.X.; Investigation, P.L. and S.F.; Methodology, Q.Z. and J.M.; Project administration, J.M. and J.X.; Software, Q.Z., S.F. and J.M.; Validation, J.X.; Writing—original draft, Q.Z.; Writing—review & editing, S.F. and J.X. All authors have read and agreed to the published version of the manuscript.

Funding

This research was funded by the China Agriculture Research System (CARS-47); the Shanghai Science and Technology Key Project on Agriculture from the Shanghai Municipal Agricultural Commission (2019-02-08-00-10-F01143); the National Key Research and Development Program (2016YFD0400106); and the Shanghai Science and Technology Commission Platform Capacity Construction Project (19DZ2284000).

Acknowledgments

The authors would like to express their profound gratitude to Weiqiang Qiu from the Instrumental Analysis Center of Shanghai Ocean University for his technical assistance.

Conflicts of Interest

The authors declare no conflicts of interest.

References

  1. Shen, Y.; He, Y.; Bi, Y.; Chen, J.; Zhao, Z.; Li, J.; Chen, X. Transcriptome analysis of gill from Lateolabrax maculatus and aqp3 gene expression. Aquaculture and Fisheries 2019, 4, 247–254. [Google Scholar] [CrossRef]
  2. Wang, W.; Dong, H.; Sun, Y.; Cao, M.; Duan, Y.; Li, H.; Liu, Q.; Gu, Q.; Zhang, J. The efficacy of eugenol and tricaine methanesulphonate as anesthetics for juvenile Chinese sea bass (Lateolabrax maculatus) during simulated transport. J. Appl. Ichthyol. 2019, 35, 551–557. [Google Scholar] [CrossRef]
  3. Fang, S.; Zhou, Q.; Hu, Y.; Liu, F.; Mei, J.; Xie, J. Antimicrobial carvacrol incorporated in flaxseed gum-sodium alginate active films to improve the quality attributes of Chinese sea bass (Lateolabrax maculatus) during cold storage. Molecules 2019, 24, 3292. [Google Scholar] [CrossRef] [PubMed] [Green Version]
  4. Cai, L.; Cao, A.; Bai, F.; Li, J. Effect of ε-polylysine in combination with alginate coating treatment on physicochemical and microbial characteristics of Japanese sea bass (Lateolabrax japonicas) during refrigerated storage. LWT-Food Sci. Technol. 2015, 62, 1053–1059. [Google Scholar] [CrossRef]
  5. Banerjee, R.; Maheswarappa, N.B. Superchilling of muscle foods: Potential alternative for chilling and freezing. Crit. Rev. Food Sci. 2019, 59, 1256–1263. [Google Scholar] [CrossRef] [PubMed]
  6. Kaale, L.D.; Eikevik, T.M.; Rustad, T.; Kolsaker, K. Superchilling of food: A review. J. Food Eng. 2011, 107, 141–146. [Google Scholar] [CrossRef]
  7. Stevik, A.M.; Claussen, I.C. Industrial superchilling, a practical approach. Procedia Food Sci. 2011, 1, 1265–1271. [Google Scholar] [CrossRef] [Green Version]
  8. Magnussen, O.M.; Haugland, A.; Hemmingsen, A.K.T.; Johansen, S.; Nordtvedt, T.S. Advances in superchilling of food-Process characteristics and product quality. Trends Food Sci.T. 2008, 19, 418–424. [Google Scholar] [CrossRef]
  9. Cropotova, J.; Mozuraityte, R.; Standal, I.B.; Grøvlen, M.S.; Rustad, T. Superchilled, chilled and frozen storage of Atlantic mackerel (Scomber scombrus) fillets–changes in texture, drip loss, protein solubility and oxidation. Int G Food Sci Tech. 2019, 54, 2228–2235. [Google Scholar] [CrossRef] [Green Version]
  10. Luan, L.; Fu, S.; Yuan, C.; Ishimura, G.; Chen, S.; Chen, J.; Hu, Y. Combined effect of superchilling and tea polyphenols on the preservation quality of hairtail (Trichiurus haumela). Int. J. Food Prop. 2017, 20, S992–S1001. [Google Scholar] [CrossRef] [Green Version]
  11. Xu, Y.; Li, T.; Zhang, C.; Li, X.; Yi, S.; Li, J.; Sun, X. Protein degradation of olive flounder (Paralichthys olivaceus) muscle after postmortem superchilled and refrigerated storage. Int. J. Food Prop. 2018, 21, 1911–1922. [Google Scholar] [CrossRef] [Green Version]
  12. Tsironi, T.N.; Taoukis, P.S. Effect of storage temperature and osmotic pre-treatment with alternative solutes on the shelf-life of gilthead seabream (Sparus aurata) fillets. Acquaculture and Fisheries 2017, 2, 39–47. [Google Scholar] [CrossRef] [Green Version]
  13. Zotta, T.; Parente, E.; Ianniello, R.G. Dynamics of bacterial communities and interaction networks in thawed fish fillets during chilled storage in air. Int. J. Food Microbiol. 2019, 293, 102–113. [Google Scholar] [CrossRef] [PubMed]
  14. Carrión-Granda, X.; Fernández-Pan, I.; Rovira, J.; Maté, J. I Effect of antimicrobial edible coatings and modified atmosphere packaging on the microbiological quality of cold stored hake (Merluccius merluccius) fillets. J. Food Quality 2018, 2018, 6194906. [Google Scholar] [CrossRef] [Green Version]
  15. Zhu, Y.; Ma, L.; Yang, H.; Xiao, Y.; Xiong, Y.L. Super-chilling (-0.7 oC) with high-CO2 packaging inhibits biochemical changes of microbial origin in catfish (Clarias gariepinus) muscle during storage. Food Chem. 2016, 206, 182–190. [Google Scholar] [CrossRef] [PubMed]
  16. Parlapani, F.F.; Haroutounian, S.A.; Nychas, G.-J.E.; Boziaris, I.S. Microbiological spoilage and volatiles production of gutted European sea bass stored under air and commercial modified atmosphere package at 2 °C. Food Microbiol. 2015, 50, 44–53. [Google Scholar] [CrossRef] [PubMed]
  17. De Witt, C.; Oliveira, A. Modified atmosphere systems and shelf life extension of fish and fishery products. Foods 2016, 5, 48. [Google Scholar] [CrossRef] [PubMed] [Green Version]
  18. He, Y.; Huang, H.; Li, L.; Yang, X.; Hao, S.; Chen, S.; Deng, J. The effects of modified atmosphere packaging and enzyme inhibitors on protein oxidation of tilapia muscle during iced storage. LWT-Food Sci. Technol. 2018, 87, 186–193. [Google Scholar] [CrossRef]
  19. Messina, C.M.; Bono, G.; Renda, G.; La Barbera, L.; Santulli, A. Effect of natural antioxidants and modified atmosphere packaging in preventing lipid oxidation and increasing the shelf-life of common dolphin fish (Coryphaena hippurus) fillets. LWT-Food Sci. and Technol. 2015, 62, 271–277. [Google Scholar] [CrossRef]
  20. Yew, C.C.; Bakar, F.A.; Rahman, R.A.; Bakar, J.; Zaman, M.Z.; Velu, S.; Shariat, M. Effects of modified atmosphere packaging with various carbon dioxide composition on biogenic amines formation in Indian mackerel (Rastrelliger kanagurta) stored at 5 ± 1 °C. Packag. Technol. Sci. 2014, 27, 249–254. [Google Scholar] [CrossRef]
  21. Milinčić, D.D.; Popović, D.A.; Lević, S.M.; Kostić, A.Ž.; Tešić, Ž.L.; Nedović, V.A.; Pešić, M.B. Application of polyphenol-loaded nanoparticles in food industry. Nanomaterials 2019, 9, 1629. [Google Scholar] [CrossRef] [PubMed] [Green Version]
  22. Melo, R.S.; Azevedo, A.L.A.; Pereira, A.M.G.; Rocha, R.R.; Cavalcante, R.M.B.; Matos, M.N.C.; Lopes, P.H.R.; Gomes, G.A.; Rodrigues, T.H.S.; dos Santos, H.S.; et al. Chemical composition and antimicrobial effectiveness of Ocimum gratissimum L. essential oil against multidrug-resistant isolates of Staphylococcus aureus and Escherichia coli. Molecules 2019, 24, 3864. [Google Scholar] [CrossRef] [PubMed] [Green Version]
  23. Talón, E.; Lampi, A.-M.; Vargas, M.; Chiralt, A.; Jouppila, K.; González-Martínez, C. Encapsulation of eugenol by spray-drying using whey protein isolate or lecithin: Release kinetics, antioxidant and antimicrobial properties. Food Chem. 2019, 295, 588–598. [Google Scholar] [CrossRef] [PubMed]
  24. Zhou, Q.; Li, P.; Fang, S.; Liu, W.; Mei, J.; Xie, J. Preservative effects of gelatin active coating enriched with eugenol emulsion on Chinese seabass (Lateolabrax maculatus) during superchilling (−0.9 °C) storage. Coatings 2019, 9, 489. [Google Scholar] [CrossRef] [Green Version]
  25. Raeisi, S.; Ojagh, S.M.; Sharifi-Rad, M.; Sharifi-Rad, J.; Quek, S.Y. Evaluation of Allium paradoxum (M.B.) G. Don. and Eryngium caucasicum trauve. Extracts on the shelf-life and quality of silver carp (Hypophthalmichthys molitrix) fillets during refrigerated storage. J. Food Safety 2017, 37, e12321. [Google Scholar] [CrossRef]
  26. Kuuliala, L.; Al Hage, Y.; Ioannidis, A.G.; Sader, M.; Kerckhof, F.M.; Vanderroost, M.; Boon, N.; De Bates, B.; De Meulenaer, B.; Ragaert, P.; et al. Microbiological, chemical and sensory spoilage analysis of raw Atlantic cod (Gadus morhua) stored under modified atmospheres. Food Microbiol. 2018, 70, 232–244. [Google Scholar] [CrossRef]
  27. Nowzari, F.; Shábanpour, B.; Ojagh, S.M. Comparison of chitosan-gelatin composite and bilayer coating and film effect on the quality of refrigerated rainbow trout. Food Chem. 2013, 141, 1667–1672. [Google Scholar] [CrossRef]
  28. Sanla-Ead, N.; Jangchud, A.; Chonhenchob, V.; Suppakul, P. Antimicrobial activity of cinnamaldehyde and eugenol and their activity after incorporation into cellulose-based packaging films. Packag. Technol Sci. 2012, 25, 7–17. [Google Scholar] [CrossRef]
  29. Dimitrijević, M.; Grković, N.; Bošković, M.; Baltić, M.Ž.; Dojčinović, S.; Karabasil, N.; Vasilev, D.; Teodorović, V. Inhibition of Listeria monocytogenes growth on vacuum packaged rainbow trout (Oncorhynchus mykiss) with carvacrol and eugenol. J. Food Safety 2019, 39, e12553. [Google Scholar] [CrossRef] [Green Version]
  30. Marchese, A.; Barbieri, R.; Coppo, E.; Orhan, I.E.; Daglia, M.; Nabavi, S.F.; Izadi, M.; Abdollahi, M.; Nabavi, S.M.; Ajami, M. Antimicrobial activity of eugenol and essential oils containing eugenol: A mechanistic viewpoint. Crit. Rev. Microbiol. 2017, 43, 668–689. [Google Scholar] [CrossRef]
  31. Bono, G.; Okpala, C.O.R.; Vitale, S.; Ferrantelli, V.; Di Noto, A.; Costa, A.; Di Bella, C.; Lo Monaco, D. Effects of different ozonized slurry-ice treatments and superchilling storage (−1 °C) on microbial spoilage of two important pelagic fish species. Food Sci. Nutr. 2017, 5, 1049–1056. [Google Scholar] [CrossRef] [PubMed] [Green Version]
  32. Parlapani, F.F.; Verdos, G.I.; Haroutounian, S.A.; Boziaris, I.S. The dynamics of Pseudomonas and volatilome during the spoilage of gutted sea bream stored at 2 °C. Food Control 2015, 55, 257–265. [Google Scholar] [CrossRef]
  33. Otero, L.; Pérez-Mateos, M.; Holgado, F.; Márquez-Ruiz, G.; López-Caballero, M.E.; Technologies, E. Hyperbaric cold storage: Pressure as an effective tool for extending the shelf-life of refrigerated mackerel (Scomber scombrus, L.). Innov Food Sci Emerg. 2019, 51, 41–50. [Google Scholar] [CrossRef] [Green Version]
  34. Patel, S. Plant essential oils and allied volatile fractions as multifunctional additives in meat and fish-based food products: A review. Food Addi. Contam. A 2015, 32, 1049–1064. [Google Scholar] [CrossRef] [PubMed]
  35. Mohan, C.; Ravishankar, C. Active and intelligent packaging systems-Application in seafood. World J. Aquac. Res. Dev. 2019, 1, 1003. [Google Scholar]
  36. Provincial, L.; Gil, M.; Guillén, E.; Alonso, V.; Roncalés, P.; Beltrán, J.A. Effect of modified atmosphere packaging using different CO2 and N2 combinations on physical, chemical, microbiological and sensory changes of fresh sea bass (Dicentrarchus labrax) fillets. J. Food Sci. Ttech. Mys. 2010, 45, 1828–1836. [Google Scholar] [CrossRef]
  37. Jia, S.; Liu, X.; Huang, Z.; Li, Y.; Zhang, L.; Luo, Y. Effects of chitosan oligosaccharides on microbiota composition of silver carp (Hypophthalmichthys molitrix) determined by culture-dependent and independent methods during chilled storage. Int. J. Food Microbiol. 2018, 268, 81–91. [Google Scholar] [CrossRef]
  38. Hong, H.; Regenstein, J.M.; Luo, Y. The importance of ATP-related compounds for the freshness and flavor of post-mortem fish and shellfish muscle: A review. Crit. Rev. Food Sci. 2017, 57, 1787–1798. [Google Scholar] [CrossRef]
  39. Feng, X.; Ng, V.K.; Mikš-Krajnik, M.; Yang, H. Effects of fish gelatin and tea polyphenol coating on the spoilage and degradation of myofibril in fish fillet during cold storage. Food Bioprocess Tech. 2017, 10, 89–102. [Google Scholar] [CrossRef]
  40. Wang, Z.; Hu, S.; Gao, Y.; Ye, C.; Wang, H. Effect of collagen-lysozyme coating on fresh-salmon fillets preservation. LWT-Food Sci. Technol. 2017, 75, 59–64. [Google Scholar] [CrossRef]
  41. Feng, X.; Bansal, N.; Yang, H. Fish gelatin combined with chitosan coating inhibits myofibril degradation of golden pomfret (Trachinotus blochii) fillet during cold storage. Food Chem. 2016, 200, 283–292. [Google Scholar] [CrossRef] [PubMed]
  42. Volpe, M.; Siano, F.; Paolucci, M.; Sacco, A.; Sorrentino, A.; Malinconico, M.; Varricchio, E. Active edible coating effectiveness in shelf-life enhancement of trout (Oncorhynchus mykiss) fillets. LWT-Food Sci. Technol. 2015, 60, 615–622. [Google Scholar] [CrossRef]
  43. Qiao, X.; Yang, L.; Gao, Q.; Yang, S.; Li, Z.; Xu, J.; Xue, C. Oxidation evaluation of free astaxanthin and astaxanthin esters in Pacific white shrimp during iced storage and frozen storage. J. Sci. Food Agr. 2019, 99, 2226–2235. [Google Scholar] [CrossRef]
  44. Ruiz-Rico, M.; Fuentes, A.; Masot, R.; Alcañiz, M.; Fernández-Segovia, I.; Barat, J.M. Use of the voltammetric tongue in fresh cod (Gadus morhua) quality assessment. Innov. Food Sci. Emerg. 2013, 18, 256–263. [Google Scholar] [CrossRef]
  45. Yazgan, H.; Ozogul, Y.; Durmuş, M.; Balikçi, E.; Gökdoğan, S.; Uçar, Y.; Aksun, E.T. Effects of oil-in-water nanoemulsion based on sunflower oil on the quality of farmed sea bass and gilthead sea bream stored at chilled temperature (2 ± 2 °C). J. Aquat. Food Prod. T. 2017, 26, 979–992. [Google Scholar] [CrossRef]
  46. Zhuang, S.; Li, Y.; Jia, S.; Hong, H.; Liu, Y.; Luo, Y. Effects of pomegranate peel extract on quality and microbiota composition of bighead carp (Aristichthys nobilis) fillets during chilled storage. Food Microbiol. 2019, 82, 445–454. [Google Scholar] [CrossRef]
  47. Kazemi, S.M.; Rezaei, M. Antimicrobial effectiveness of gelatin–alginate film containing oregano essential oil for fish preservation. J. Food Safety 2015, 35, 482–490. [Google Scholar] [CrossRef]
  48. De Lima Veeck, A.P.; Daniel, A.P.; Klein, B.; Quatrin, A.; de Souza Rezer, A.P.; Milani, L.G.; Zeppenfeld, C.C.; da Cunha, M.A.; Heldwein, C.G.; Heinzmann, B.M.; et al. Chemical, microbiological, and sensory parameters during the refrigerated storage of silver catfish (Rhamdia quelen) exposed in vivo to the essential oil of Lippia alba. J. Food Sci. Ttech. Mys. 2018, 55, 1416–1425. [Google Scholar] [CrossRef] [PubMed]
  49. Severino, R.; Ferrari, G.; Vu, K.D.; Donsì, F.; Salmieri, S.; Lacroix, M. Antimicrobial effects of modified chitosan based coating containing nanoemulsion of essential oils, modified atmosphere packaging and gamma irradiation against Escherichia coli O157: H7 and Salmonella Typhimurium on green beans. Food Control 2015, 50, 215–222. [Google Scholar] [CrossRef]
  50. Özpolat, E.; Patir, B. Determination of shelf life for sausages produced from some freshwater fish using two different smoking methods. J. Food Saf. 2016, 36, 69–76. [Google Scholar] [CrossRef]
  51. Wang, L.; Liu, Z.; Yang, H.; Huang, L.; Zeng, M. Optimal modified atmosphere for packaging and its effects on quality and shelf-life of pacific white shrimp (Litopenaeus vannamei) under controlled freezing-point storage at -0.8oC. Food Sci. Technol. R. 2016, 22, 173–183. [Google Scholar] [CrossRef] [Green Version]
  52. Da Silva, S.B.; Ferreira, D.; Pintado, M.; Sarmento, B. Chitosan-based nanoparticles for rosmarinic acid ocular delivery-In vitro tests. Int. J. Biol. Macromol. 2016, 84, 112–120. [Google Scholar] [CrossRef] [PubMed]
  53. Zhu, Z.; Gao, H.; Gao, T.; Sun, D.-W. Quality comparison of grass carp and salmon fillets packaged in modified atmosphere with different composite films. J. Food Process Eng. 2018, 41, e12803. [Google Scholar] [CrossRef]
  54. De Abreu, D.P.; Losada, P.P.; Maroto, J.; Cruz, J.M. Evaluation of the effectiveness of a new active packaging film containing natural antioxidants (from barley husks) that retard lipid damage in frozen Atlantic salmon (Salmo salar L.). Food Res. Int. 2010, 43, 1277–1282. [Google Scholar] [CrossRef]
  55. Hassoun, A.; Çoban, Ö.E. Essential oils for antimicrobial and antioxidant applications in fish and other seafood products. Trends Food Sci. Tech. 2017, 68, 26–36. [Google Scholar] [CrossRef]
  56. Li, N.; Mei, J.; Shen, Y.; Xie, J. Quality improvement of half-smooth tongue sole (Cynoglossus Semilaevis) fillets by chitosan coatings containing rosmarinic acid during storage. CyTA – J. Food 2018, 16, 1018–1029. [Google Scholar] [CrossRef] [Green Version]
  57. Takahashi, M.; Hirose, N.; Ohno, S.; Arakaki, M.; Wada, K. Flavor characteristics and antioxidant capacities of hihatsumodoki (Piper retrofractum Vahl) fresh fruit at three edible maturity stages. J. Food Sci. Ttech. Mys. 2018, 55, 1295. [Google Scholar] [CrossRef]
  58. Chalamaiah, M.; Hemalatha, R.; Jyothirmayi, T. Fish protein hydrolysates: Proximate composition, amino acid composition, antioxidant activities and applications: A review. Food Chem. 2012, 135, 3020–3038. [Google Scholar] [CrossRef]
  59. Tan, X.; Qi, L.; Fan, F.; Guo, Z.; Wang, Z.; Song, W.; Du, M. Analysis of volatile compounds and nutritional properties of enzymatic hydrolysate of protein from cod bone. Food Chem. 2018, 264, 350–357. [Google Scholar] [CrossRef] [PubMed]
  60. Yu, D.; Xu, Y.; Regenstein, J.M.; Xia, W.; Yang, F.; Jiang, Q.; Wang, B. The effects of edible chitosan-based coatings on flavor quality of raw grass carp (Ctenopharyngodon idellus) fillets during refrigerated storage. Food Chem. 2018, 242, 412–420. [Google Scholar] [CrossRef]
  61. He, Q.; Xiao, K. The effects of tangerine peel (Citri reticulatae pericarpium) essential oils as glazing layer on freshness preservation of bream (Megalobrama amblycephala) during superchilling storage. Food Control 2016, 69, 339–345. [Google Scholar] [CrossRef]
  62. Laly, S.J.; Ashok Kumar, K.N.; Sankar, T.V.; Lalitha, K.V.; Ninan, G. Quality of monosex tilapia under ice storage: Gutting effects on the formation of biogenic amines, biochemical, and microbiological characteristics. Int. J. Food Prop. 2017, 20, 1368–1377. [Google Scholar] [CrossRef] [Green Version]
  63. Ghalati, L.N.; Khodanazary, A.; Hosseini, S.M.; Matroodi, S. combination effect of phosphate and vacuum packaging on quality parameters of refrigerated Aurigequula fasciata fillets. J. Packag. Technol. Res. 2017, 1, 101–112. [Google Scholar] [CrossRef]
  64. Merlo, T.C.; Contreras-Castillo, C.J.; Saldaña, E.; Barancelli, G.V.; Dargelio, M.D.B.; Yoshida, C.M.P.; Junior, E.E.R.; Massarioli, A.; Venturini, A.C. Incorporation of pink pepper residue extract into chitosan film combined with a modified atmosphere packaging: Effects on the shelf life of salmon fillets. Food Res. Int. 2019, 125, 108633. [Google Scholar] [CrossRef] [PubMed]
  65. Olsson, G.B.; Ofstad, R.; Lødemel, J.B.; Olsen, R.L. Changes in water-holding capacity of halibut muscle during cold storage. LWT-Food Sci. Technol. 2003, 36, 771–778. [Google Scholar] [CrossRef]
  66. Wang, S.; Xiang, W.; Fan, H.; Xie, J.; Qian, Y.-F. Study on the mobility of water and its correlation with the spoilage process of salmon (Salmo solar) stored at 0 and 4 °C by low-field nuclear magnetic resonance (LF NMR 1 H). J. Food Sci. Ttech. Mys. 2018, 55, 173–182. [Google Scholar] [CrossRef]
  67. Patel, K.K.; Khan, M.A.; Kar, A. Recent developments in applications of MRI techniques for foods and agricultural produce-an overview. J. Food Sci. Ttech. Mys. 2015, 52, 1–26. [Google Scholar] [CrossRef]
  68. Li, N.; Liu, W.; Shen, Y.; Mei, J.; Xie, J. Coating effects of ε-polylysine and rosmarinic acid combined with chitosan on the storage quality of fresh half-smooth tongue sole (Cynoglossus semilaevis Günther) fillets. Coatings 2019, 9, 273. [Google Scholar] [CrossRef] [Green Version]
  69. Huang, L.; Cheng, S.; Song, Y.; Xia, K.; Xu, X.; Zhu, B.-W.; Tan, M. Non-destructive analysis of caviar compositions using low-field nuclear magnetic resonance technique. J. Food Meas. Charact. 2017, 11, 621–628. [Google Scholar] [CrossRef]
  70. Qin, N.; Zhang, L.; Zhang, J.; Song, S.; Wang, Z.; Regenstein, J.M.; Luo, Y. Influence of lightly salting and sugaring on the quality and water distribution of grass carp (Ctenopharyngodon idellus) during super-chilled storage. J. Food Eng. 2017, 215, 104–112. [Google Scholar] [CrossRef]
  71. Reza, M.S.; Bapary, M.A.; Ahasan, C.T.; Islam, M.N.; Kamal, M. Shelf life of several marine fish species of Bangladesh during ice storage. Int. J. Food Sci. Tech. 2009, 44, 1485–1494. [Google Scholar] [CrossRef]
  72. Li, D.-Y.; Huang, Y.; Wang, K.-X.; Dong, X.-P.; Yu, D.; Ge, L.-H.; Zhou, D.-Y.; Yu, C.-X. Microstructural characteristics of turbot (Scophthalmus maximus) muscle: Effect of salting and processing. Int. J. Food Prop. 2018, 21, 1291–1302. [Google Scholar] [CrossRef] [Green Version]
  73. Li, N.; Shen, Y.; Liu, W.; Mei, J.; Xie, J. Low-field NMR and MRI to analyze the effect of edible coating incorporated with map on qualities of half-smooth tongue sole (Cynoglossus semilaevis Günther) fillets during refrigerated storage. Appl. Sci. 2018, 8, 1391. [Google Scholar] [CrossRef] [Green Version]
  74. Albertos, I.; Martin-Diana, A.; Cullen, P.J.; Tiwari, B.; Ojha, K.S.; Bourke, P.; Rico, D. Shelf-life extension of herring (Clupea harengus) using in-package atmospheric plasma technology. Innov. Food Sci. Emerg. 2019, 53, 85–91. [Google Scholar] [CrossRef]
  75. Sun, X.H.; Xiao, L.; Lan, W.Q.; Liu, S.C.; Wang, Q.; Yang, X.H.; Zhang, W.J.; Xie, J. Effects of temperature fluctuation on quality changes of large yellow croaker (Pseudosciaena crocea) with ice storage during logistics process. J. Food Process. Pres. 2018, 42, e13505. [Google Scholar] [CrossRef]
  76. Wang, Z.; Herremans, E.; Janssen, S.; Cantre, D.; Verboven, P.; Nicolaï, B. Visualizing 3D food microstructure using tomographic methods: Advantages and disadvantages. Annu. Rev. Food Sci. T. 2018, 9, 323–343. [Google Scholar] [CrossRef]
  77. Xuan, X.-T.; Fan, Y.-F.; Ling, J.-G.; Hu, Y.-Q.; Liu, D.-H.; Chen, S.-G.; Ye, X.-Q.; Ding, T. Preservation of squid by slightly acidic electrolyzed water ice. Food Control 2017, 73, 1483–1489. [Google Scholar] [CrossRef]
  78. Lather, P.; Mohanty, A.K.; Jha, P.; Garsa, A.K.; Sood, S.K. Changes associated with cell membrane composition of Staphylococcus aureus on acquisition of resistance against class IIa bacteriocin and its in vitro substantiation. Eur. Food Res. Technol. 2015, 240, 101–107. [Google Scholar] [CrossRef]
  79. Li, P.; Peng, Y.; Mei, J.; Xie, J. Effects of microencapsulated eugenol emulsions on microbiological, chemical and organoleptic qualities of farmed Japanese sea bass (Lateolabrax japonicus) during cold storage. LWT-Food Sci. Technol. 2020, 118, 108831. [Google Scholar] [CrossRef]
  80. Zang, J.; Xu, Y.; Xia, W.; Jiang, Q. The impact of desmin on texture and water-holding capacity of ice-stored grass carp (Ctenopharyngodon idella) fillet. Int. J. Food Sci. Tech. 2017, 52, 464–471. [Google Scholar] [CrossRef]
  81. Zhao, X.; Wu, J.e.; Chen, L.; Yang, H. Effect of vacuum impregnated fish gelatin and grape seed extract on metabolite profiles of tilapia (Oreochromis niloticus) fillets during storage. Food Chem. 2019, 293, 418–428. [Google Scholar] [CrossRef] [PubMed]
  82. Ehsani, A.; Hashemi, M.; Afshari, A.; Aminzare, M.; Raeisi, M.; Zeinali, T. Effect of different types of active biodegradable films containing lactoperoxidase system or sage essential oil on the shelf life of fish burger during refrigerated storage. LWT-Food Sci. Technol. 2020, 117, 108633. [Google Scholar] [CrossRef]
  83. Wang, X.-Y.; Xie, J. Study on the volatile organic compounds and its correlation with water dynamics of bigeye tuna (Thunnus obesus) during cold storage. Molecules 2019, 24, 3119. [Google Scholar] [CrossRef] [Green Version]
  84. Liu, W.; Shen, Y.; Li, N.; Mei, J.; Xie, J. Application of gelatin incorporated with red pitaya peel methanol extract as edible coating for quality enhancement of crayfish (Procambarus clarkii) during refrigerated storage. J Food Quality 2019, 1715946. [Google Scholar] [CrossRef] [Green Version]
  85. Lanzarin, M.; Ritter, D.; Novaes, S.; Monteiro, M.; Almeida Filho, E.; Marsico, E.; Franco, R.; Conte, C., Jr.; Freitas, M.Q. Quality Index Method (QIM) for ice stored gutted Amazonian Pintado (Pseudoplatystoma fasciatum× Leiarius marmoratus) and estimation of shelf life. LWT-Food Sci. Technol. 2016, 65, 363–370. [Google Scholar] [CrossRef]
  86. Freitas, J.; Vaz-Pires, P.; Câmara, J.S. Freshness assessment and shelf-life prediction for Seriola dumerili from aquaculture based on the quality index method. Molecules 2019, 24, 3530. [Google Scholar] [CrossRef] [Green Version]
Sample Availability: Samples of the compounds eugenol are available from the authors.
Figure 1. Changes in total viable count (a), Pseudomonas spp. (b), and H2S-producing bacteria (c) of Chinese sea bass during superchilling storage at −0.9 °C. AP: air package; VP: vacuum package; MAP1: modified atmosphere packaging with 40% CO2/60% N2; MAP2: modified atmosphere packaging with 40% CO2/10% O2/30% N2; MAP3: modified atmosphere packaging with 60% CO2/10% O2/30% N2; MAP4: modified atmosphere packaging with 60% CO2/40% N2.
Molecules 25 00871 g001
Figure 2. Changes in pH values (a), total volatile basic nitrogen (TVB-N) values (b), thiobarbituric acid reactive substances (TBARS) values (c), K values (d), and water holding capacity (WHC) values (e) of Chinese sea bass during superchilling storage at −0.9 °C. AP: air package; VP: vacuum package; MAP1: modified atmosphere packaging with 40% CO2/60% N2; MAP2: modified atmosphere packaging with 40% CO2/10% O2/30% N2; MAP3: modified atmosphere packaging with 60% CO2/10% O2/30% N2; MAP4: modified atmosphere packaging with 60% CO2/40% N2.
Molecules 25 00871 g002
Figure 3. Changes in water distribution (a) and magnetic resonance imaging (b) of Chinese sea bass during superchilling storage at −0.9 °C. AP: air package; VP: vacuum package; MAP1: modified atmosphere packaging with 40% CO2/60% N2; MAP2: modified atmosphere packaging with 40% CO2/10% O2/30% N2; MAP3: modified atmosphere packaging with 60% CO2/10% O2/30% N2; MAP4: modified atmosphere packaging with 60% CO2/40% N2.
Molecules 25 00871 g003
Figure 4. Changes in smell, color, mucus, muscular tissue, and elasticity of Chinese sea bass during superchilling storage at −0.9 °C. AP: air package; VP: vacuum package; MAP1: modified atmosphere packaging with 40% CO2/60% N2; MAP2: modified atmosphere packaging with 40% CO2/10% O2/30% N2; MAP3: modified atmosphere packaging with 60% CO2/10% O2/30% N2; MAP4: modified atmosphere packaging with 60% CO2/40% N2.
Molecules 25 00871 g004
Table 1. Changes in the free amino acid content of Chinese sea bass during superchilling storage at −0.9 °C.
TimeSamplesFree Amino Acids
Aspartic AcidThreonineSerineGlutamic AcidGlycineAlanine
On day 0 3.71 ± 0.3612.36 ± 0.7525.32 ± 0.8811.79 ± 0.43126.58 ± 0.9981.80 ± 0.62
On 18th dayAP4.33 ± 0.26b29.45 ± 0.96ab27.4 ± 0.82b17.86 ± 0.53e72.45 ± 0.67e87.62 ± 1.77c
VP1.88 ± 0.22d26.04 ± 0.81bc24.28 ± 0.76c19.82 ± 0.65d78.58 ± 0.78d90.14 ± 0.83c
MAP13.20 ± 0.41c33.10 ± 0.87a28.10 ± 0.73b23.34 ± 0.59c82.24 ± 0.64c94.01 ± 1.85b
MAP23.46 ± 0.19c30.71 ± 0.83a30.14 ± 0.81a23.94 ± 0.38c88.32 ± 0.98b95.54 ± 0.83b
MAP36.54 ± 0.38a30.87 ± 0.58a22.12 ± 0.72d27.34 ± 0.43a99.30 ± 0.49a103.14 ± 0.88a
MAP44.37 ± 0.25b22.47 ± 0.61c25.49 ± 0.73c25.65 ± 0.65b89.64 ± 1.26b97.75 ± 2.93b
On 36th dayAP3.81 ± 0.14d16.89 ± 0.43d11.47 ± 2.2e20.87 ± 2.7c58.32 ± 1.07e59.10 ± 3.43f
VP4.07 ± 0.55d20.06 ± 0.58c18.40 ± 1.7d27.70 ± 4.8ac71.77 ± 3.75d70.81 ± 1.52e
MAP15.04 ± 0.35d33.90 ± 0.55a70.29 ± 5.3a38.06 ± 4.5b97.23 ± 2.6c87.85 ± 2.08d
MAP210.23 ± 0.68b33.67 ± 0.84a54.81 ± 6.2b41.90 ± 6.33b101.08 ± 3.09c100.81 ± 1.72c
MAP313.49 ± 0.62a28.48 ± 0.61b39.60 ± 7.3c55.83 ± 5.32a153.56 ± 0.62a117.46 ± 1.89a
MAP48.96 ± 0.58c33.36 ± 0.71a43.27 ± 5.2c51.89 ± 6.84a134.75 ± 1.72b106.86 ± 2.17b
ValineMethionineIsoleucineLeucineTyrosinePhenylalanine
On day 0 7.66 ± 0.254.48 ± 0.375.52 ± 0.288.76 ± 0.294.30 ± 0.214.68 ± 0.28
On 18th dayAP11.59 ± 0.52b6.51 ± 0.50b7.20 ± 0.24bc11.61 ± 0.32b7.65 ± 0.18d7.25 ± 0.23d
VP9.51 ± 0.46e4.83 ± 0.36c6.20 ± 0.75d9.74 ± 0.43d5.44 ± 0.36a5.68 ± 0.46e
MAP113.28 ± 0.19a6.71 ± 0.16b8.91 ± 0.29a10.59 ± 0.28c9.56 ± 0.17b9.60 ± 0.26b
MAP210.34 ± 0.34d7.17 ± 0.63ab7.12 ± 0.88bc10.95 ± 0.25c7.87 ± 0.23b7.09 ± 0.31d
MAP311.05 ± 0.27bc7.69 ± 0.82a7.25 ± 0.27bc12.73 ± 0.31a8.47 ± 0.25c9.67 ± 0.27b
MAP410.56 ± 0.22cd6.58 ± 0.27b8.17 ± 0.18ab12.36 ± 0.28a10.22 ± 0.31a9.88 ± 0.35a
On 36th dayAP11.14 ± 0.27d6.42 ± 0.32d6.70 ± 1.57c10.1 ± 0.34d5.01 ± 0.29b7.03 ± 0.48d
VP10.26 ± 0.33e6.33 ± 0.48d7.84 ± 1..32c10.01 ± 0.65d9.75 ± 0.36a5.96 ± 0.44e
MAP120.44 ± 0.23b11.85 ± 0.37c17.21 ± 1.59a28.54 ± 0.44a19.98 ± 0.54b15.28 ± 0.48a
MAP219.87 ± 0.2912.13 ± 0.31bc13.84 ± 1.39b23.45 ± 0.63b16.58 ± 0.65b12.81 ± 0.39b
MAP323.08 ± 0.18a15.32 ± 0.35a12.84 ± 0.96b21.63 ± 0.48c13.59 ± 0.53b11.18 ± 0.57c
MAP418.22 ± 0.28c12.74 ± 0.31b17.56 ± 1.84a28.84 ± 0.61a18.54 ± 0.6215.55 ± 0.48a
LysineHistidineArginineProlineTotal
On day 0 78.26 ± 0.4424.59 ± 0.4514.20 ± 0.328.09 ± 0.26432.90 ± 3.37
On 18th dayAP36.49 ± 2.758c29.84 ± 0.77a15.24 ± 0.35c7.61 ± 0.58b410.82 ± 4.76d
VP31.68 ± 0.47d25.63 ± 0.32b12.14 ± 0.43e5.82 ± 0.83c380.99 ± 5.84e
MAP145.94 ± 0.98b23.84 ± 0.58c17.19 ± 0.48a10.23 ± 0.24a450.25 ± 3.28b
MAP236.23 ± 0.37c22.96 ± 0.38c13.13 ± 0.35d9.55 ± 0.85a434.04 ± 4.98c
MAP347.96 ± 2.01a17.23 ± 0.53d16.28 ± 0.23b8.02 ± 0.67b462.27 ± 4.22a
MAP428.04 ± 0.29e18.33 ± 0.66c11.64 ± 0.42e5.42 ± 0.33c415.27 ± 5.25d
On 36th dayAP34.21 ± 0.74e14.38 ± 0.63e8.25 ± 1.35 d5.60 ± 0.64d326.17 ± 4.18e
VP29.51 ± 0.87f14.66 ± 0.59e9.87 ± 0.94d6.28 ± 0.68d344.17 ± 5.34d
MAP181.22 ± 0.56c50.55 ± 0.46a33.46 ± 0.69a23.88 ± 0.72a648.66 ± 4.52c
MAP2103.46 ± 1.04a48.71 ± 0.63b27.48 ± 0.73b21.36 ± 0.83b655.09 ± 5.83bc
MAP391.46 ± 0.73b30.78 ± 0.58d23.87 ± 0.53c18.43 ± 0.77c682.33 ± 5.07a
MAP475.19 ± 0.87d32.12 ± 0.52c28.52 ± 0.81b22.01 ± 0.68b660.26 ± 4.78b
Different lower case letters in different groups from same day indicate significant differences (p < 0.05). AP: air package; VP: vacuum package; MAP1: modified atmosphere packaging with 40% CO2/60% N2; MAP2: modified atmosphere packaging with 40% CO2/10% O2/30% N2; MAP3: modified atmosphere packaging with 60% CO2/10% O2/30% N2; MAP4: modified atmosphere packaging with 60% CO2/40% N2.

