1H NMR Metabolic Profile of Scyphomedusa Rhizostoma pulmo (Scyphozoa, Cnidaria) in Female Gonads and Somatic Tissues: Preliminary Results

 ,
,  ,
,  ,
,  ,
,  and
and 
Abstract
:1. Introduction
2. Results
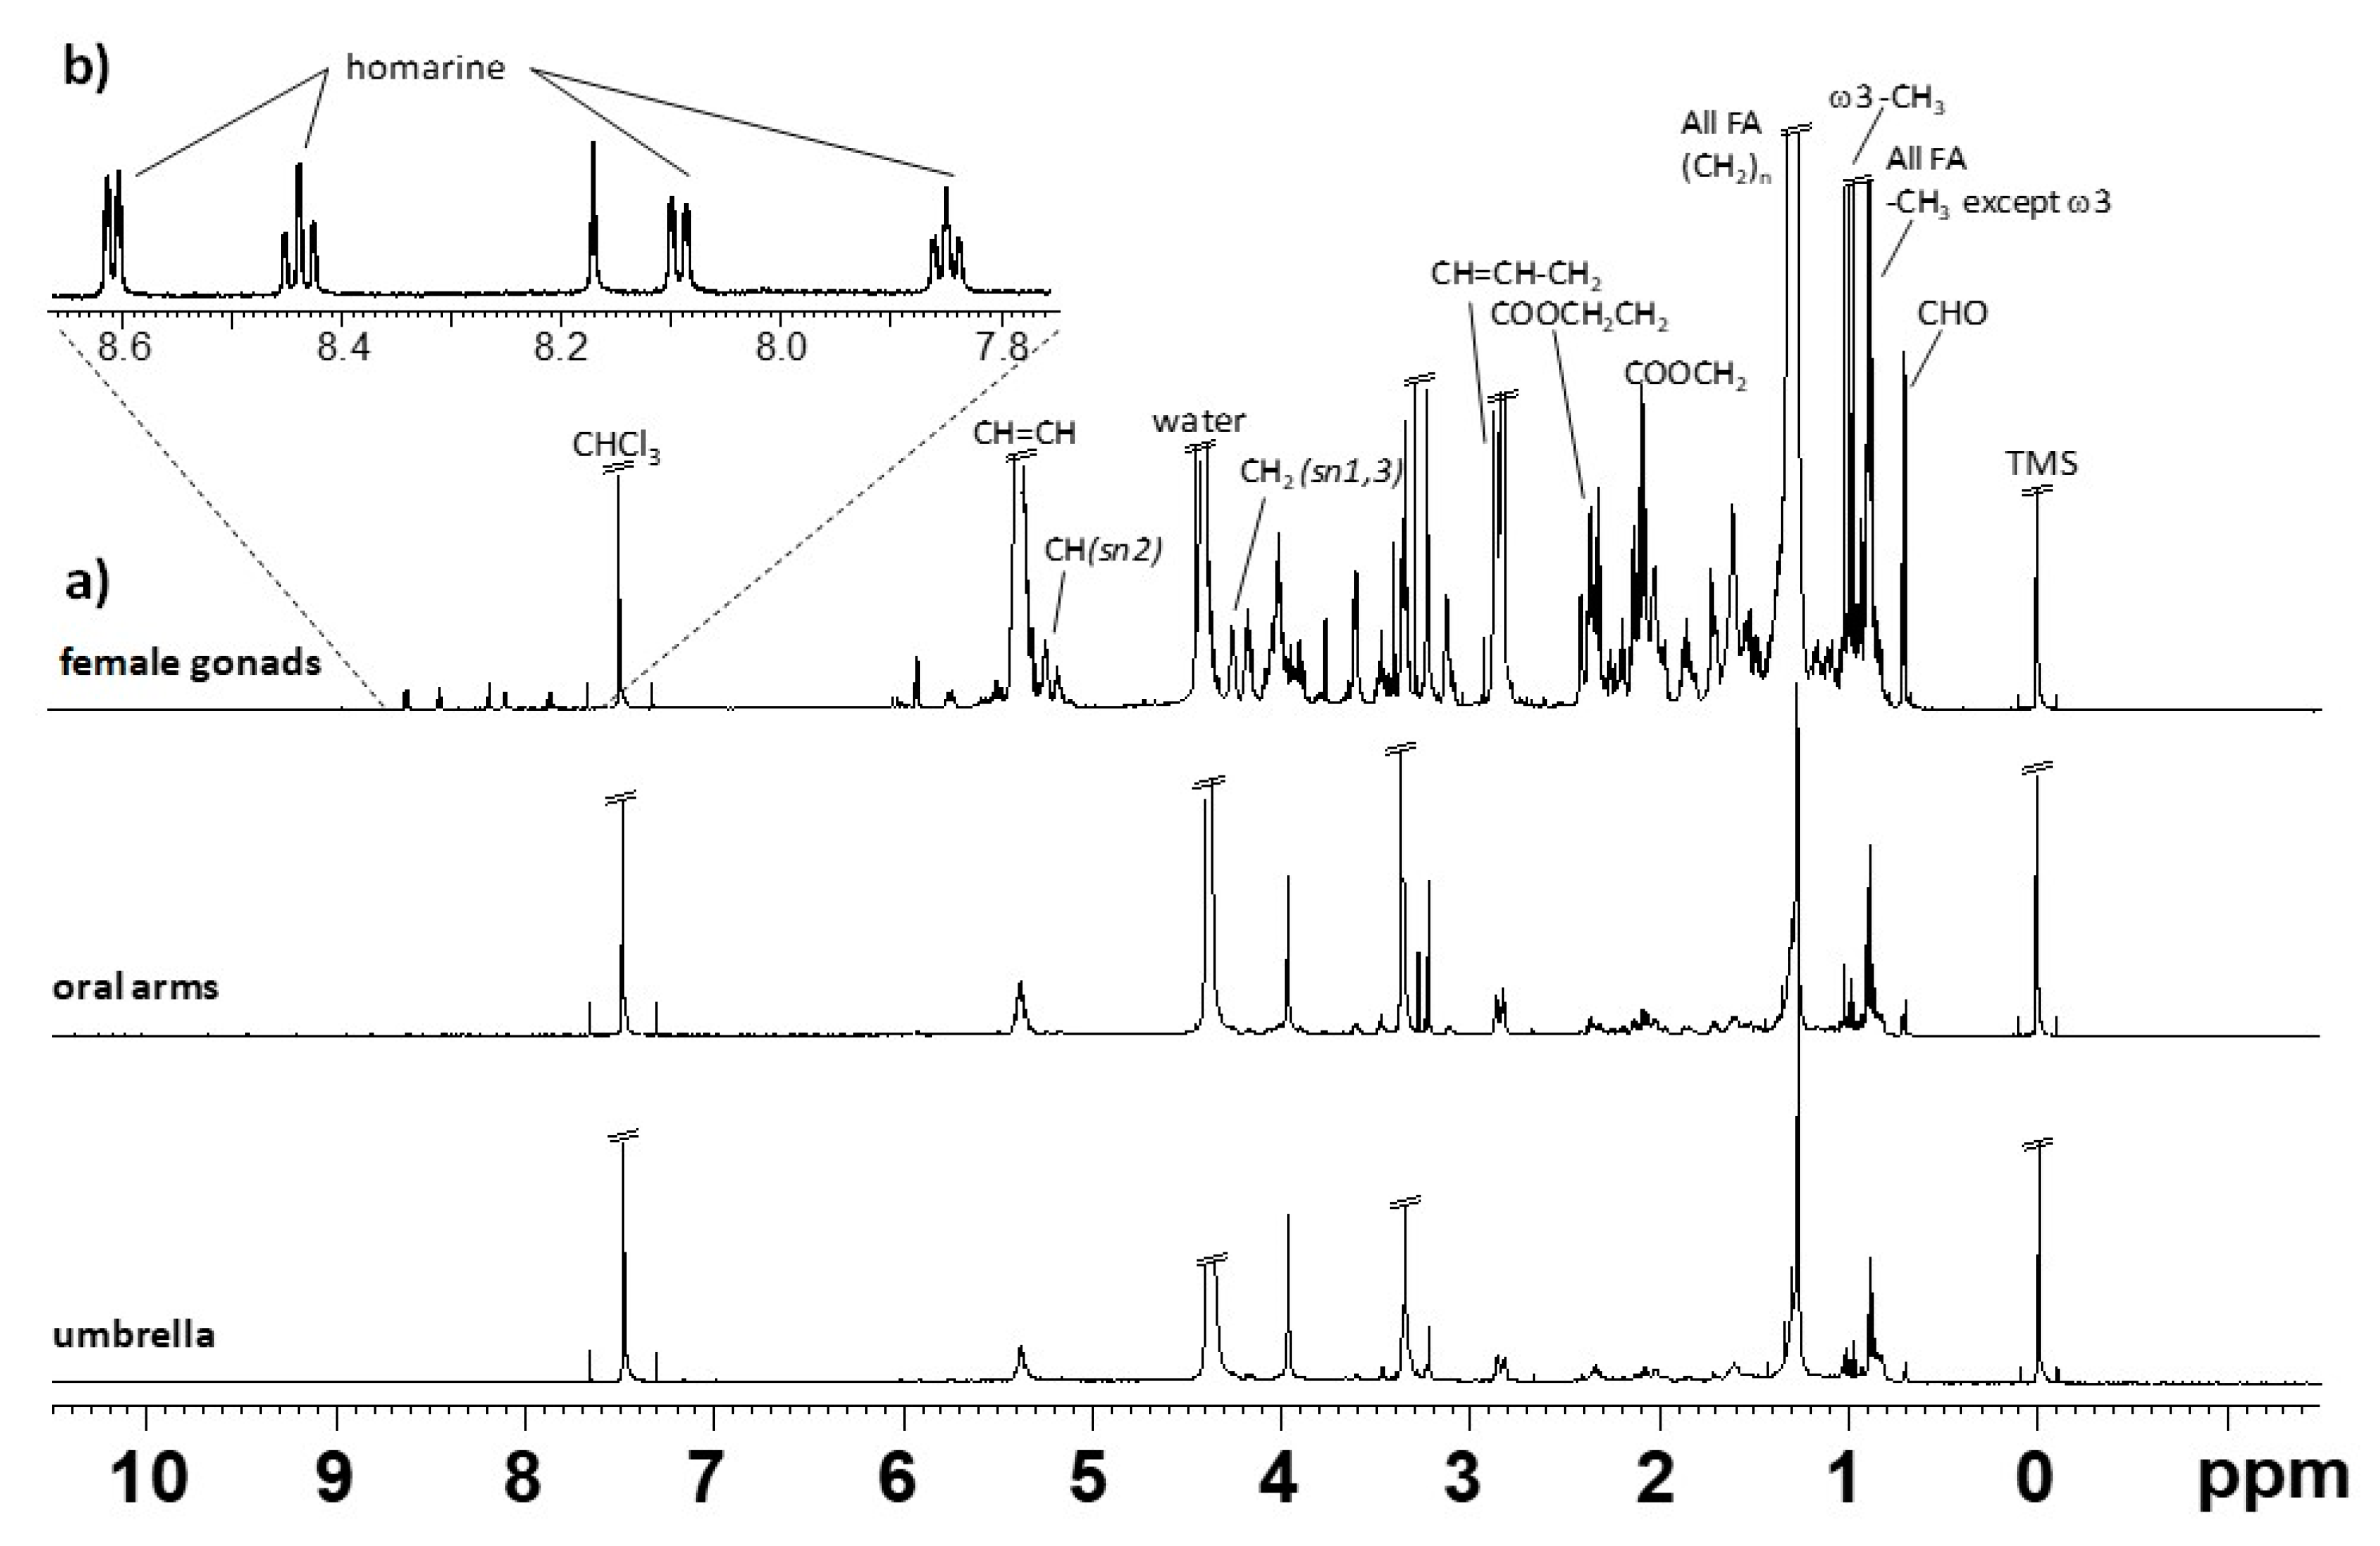
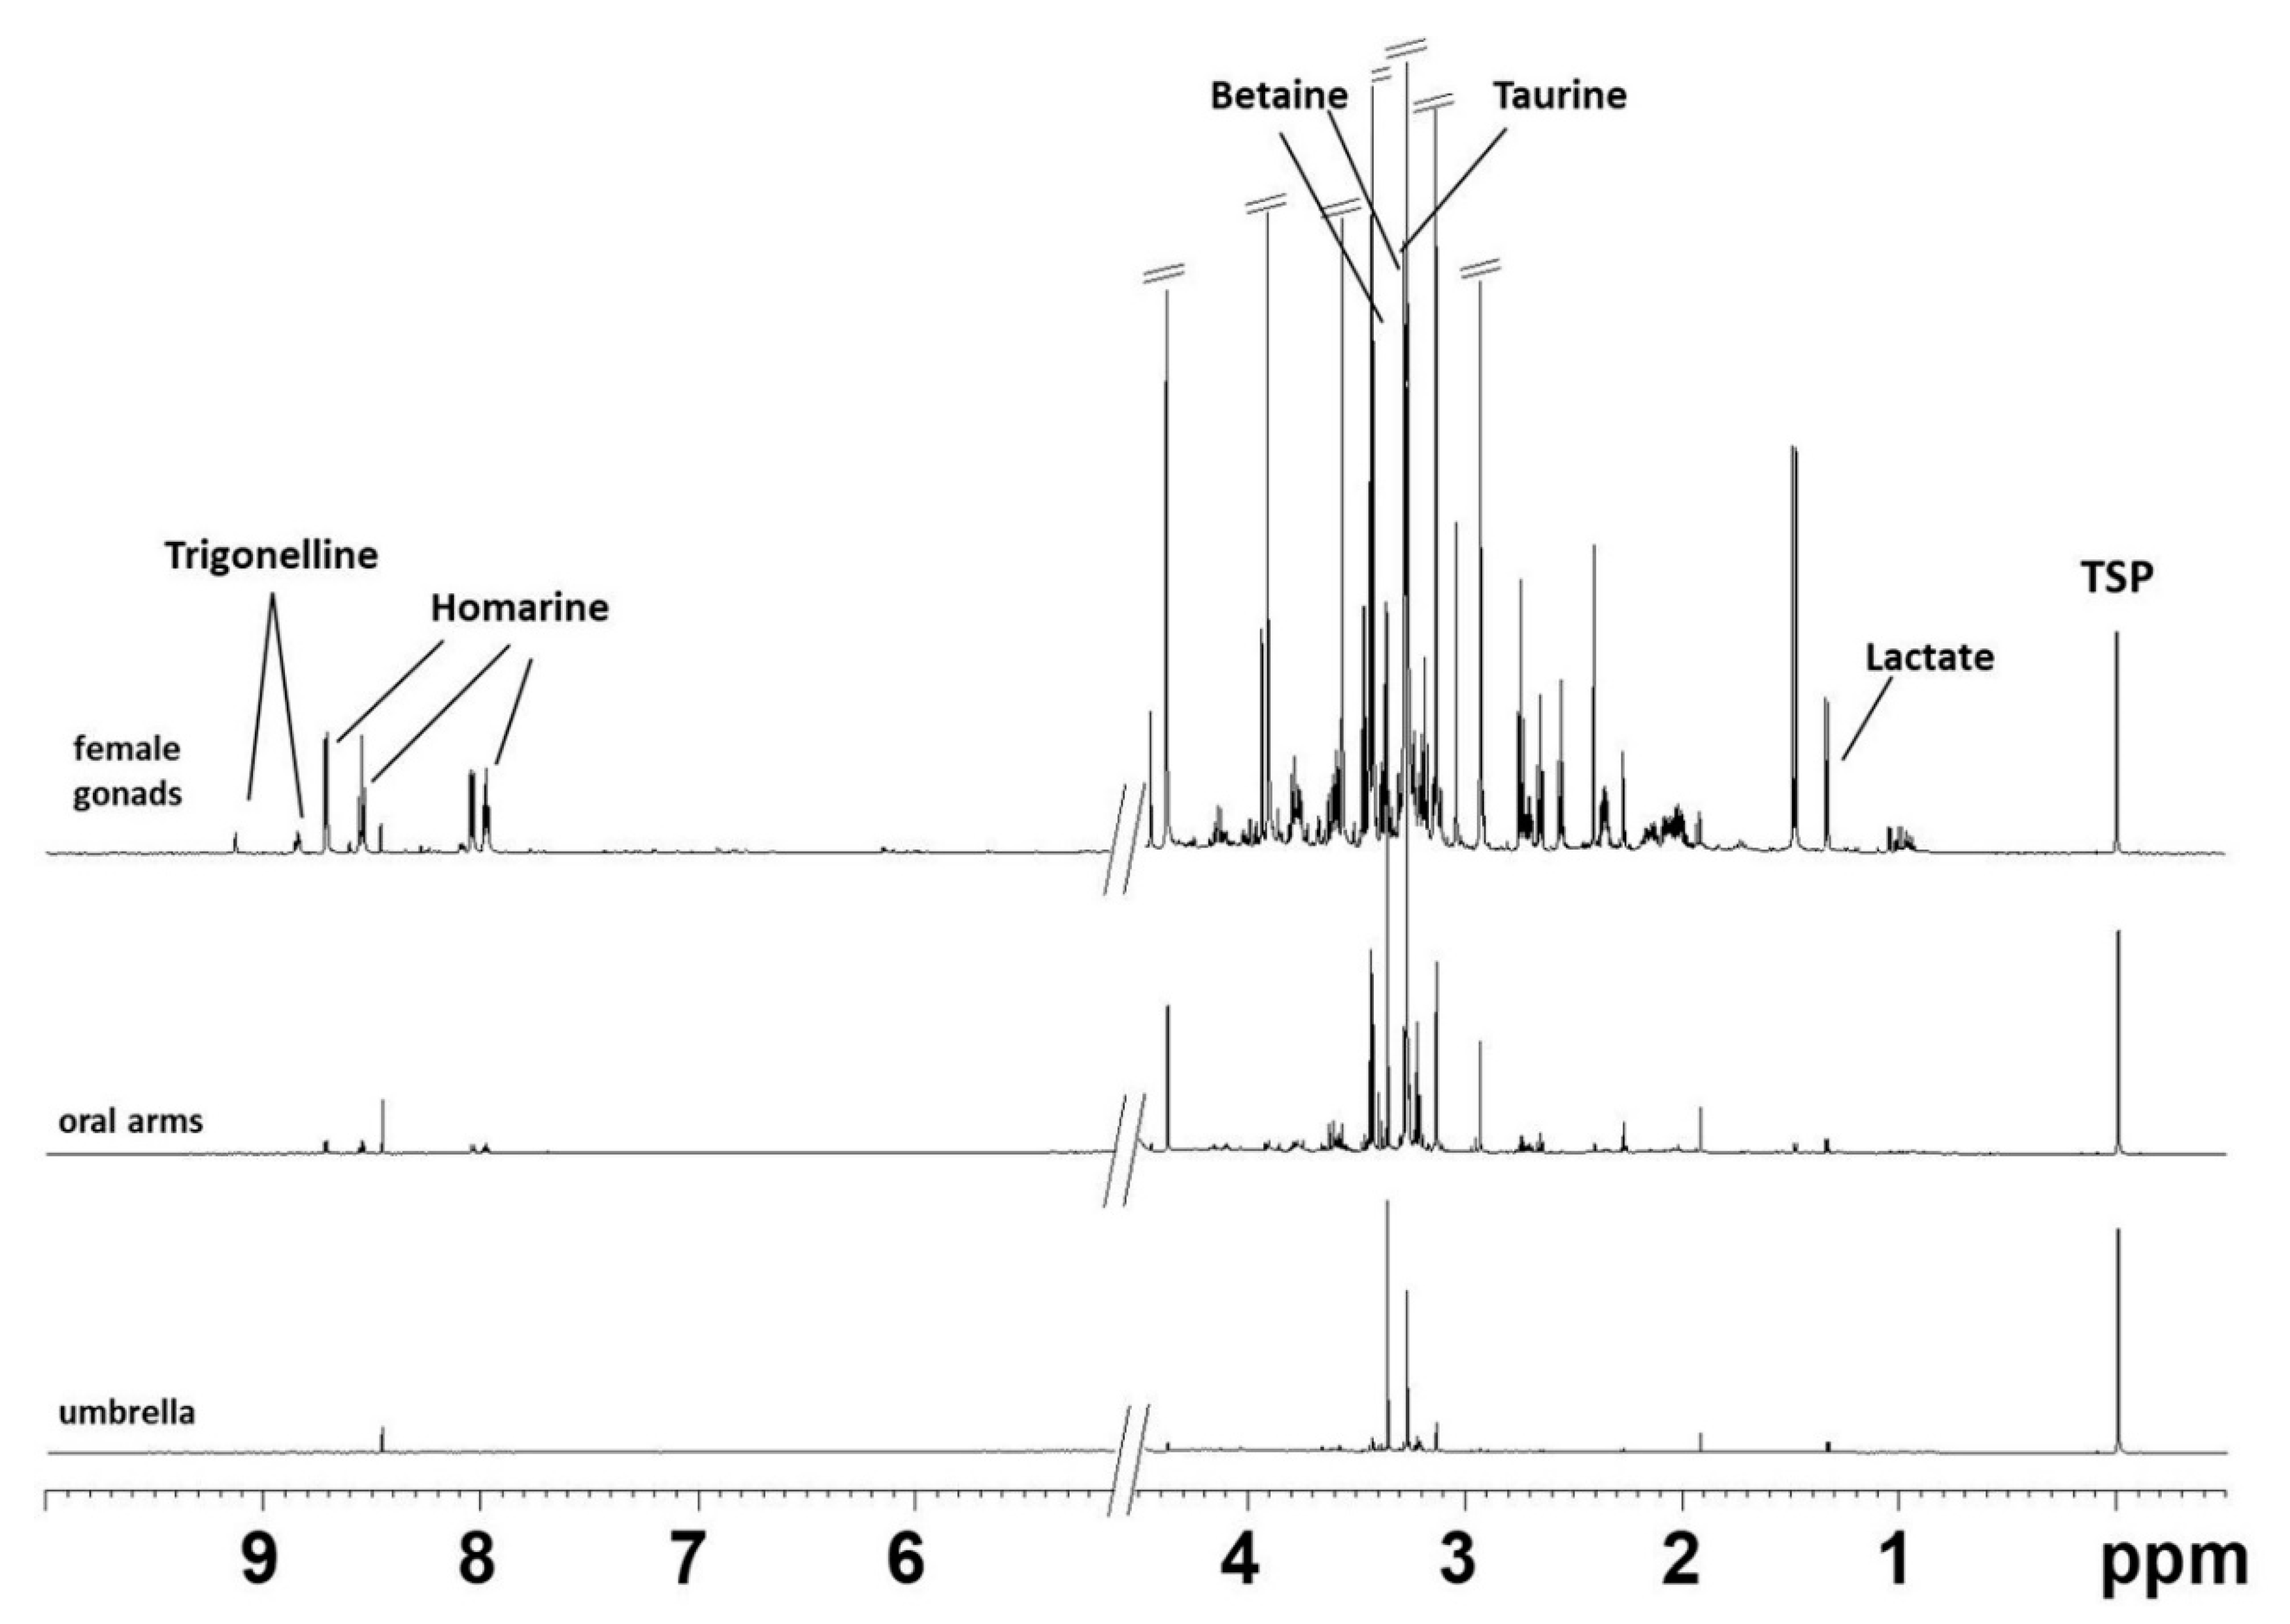
2.1. NMR Spectroscopy
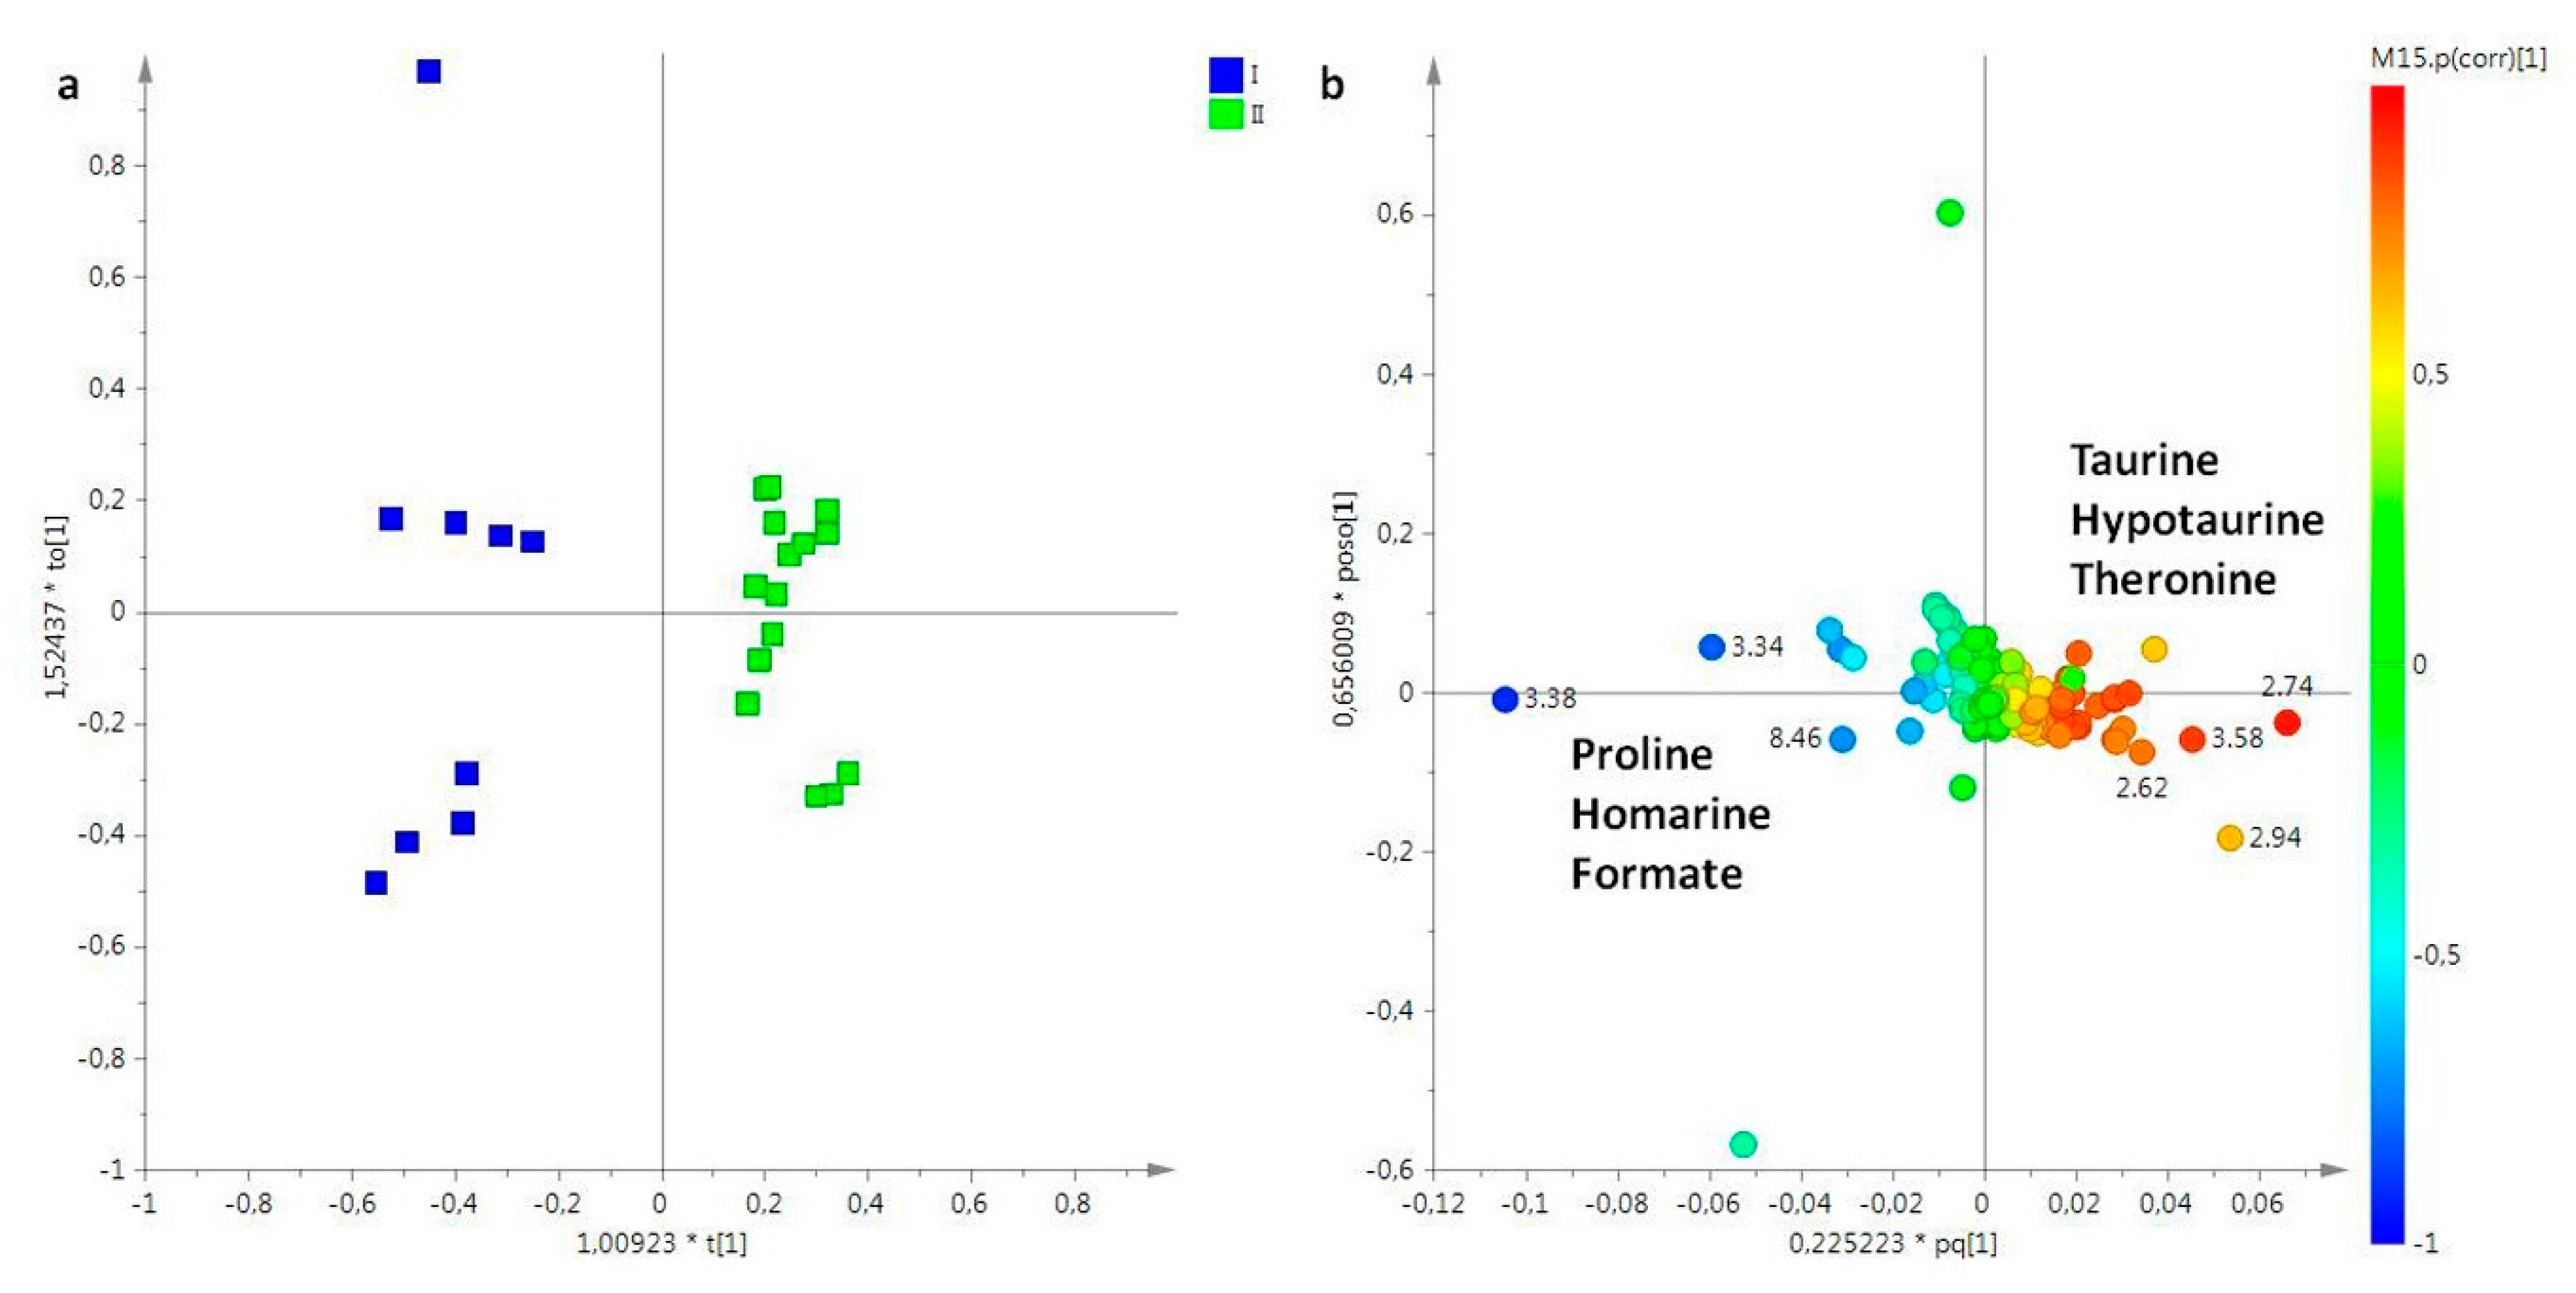
2.2. Statistical Analysis
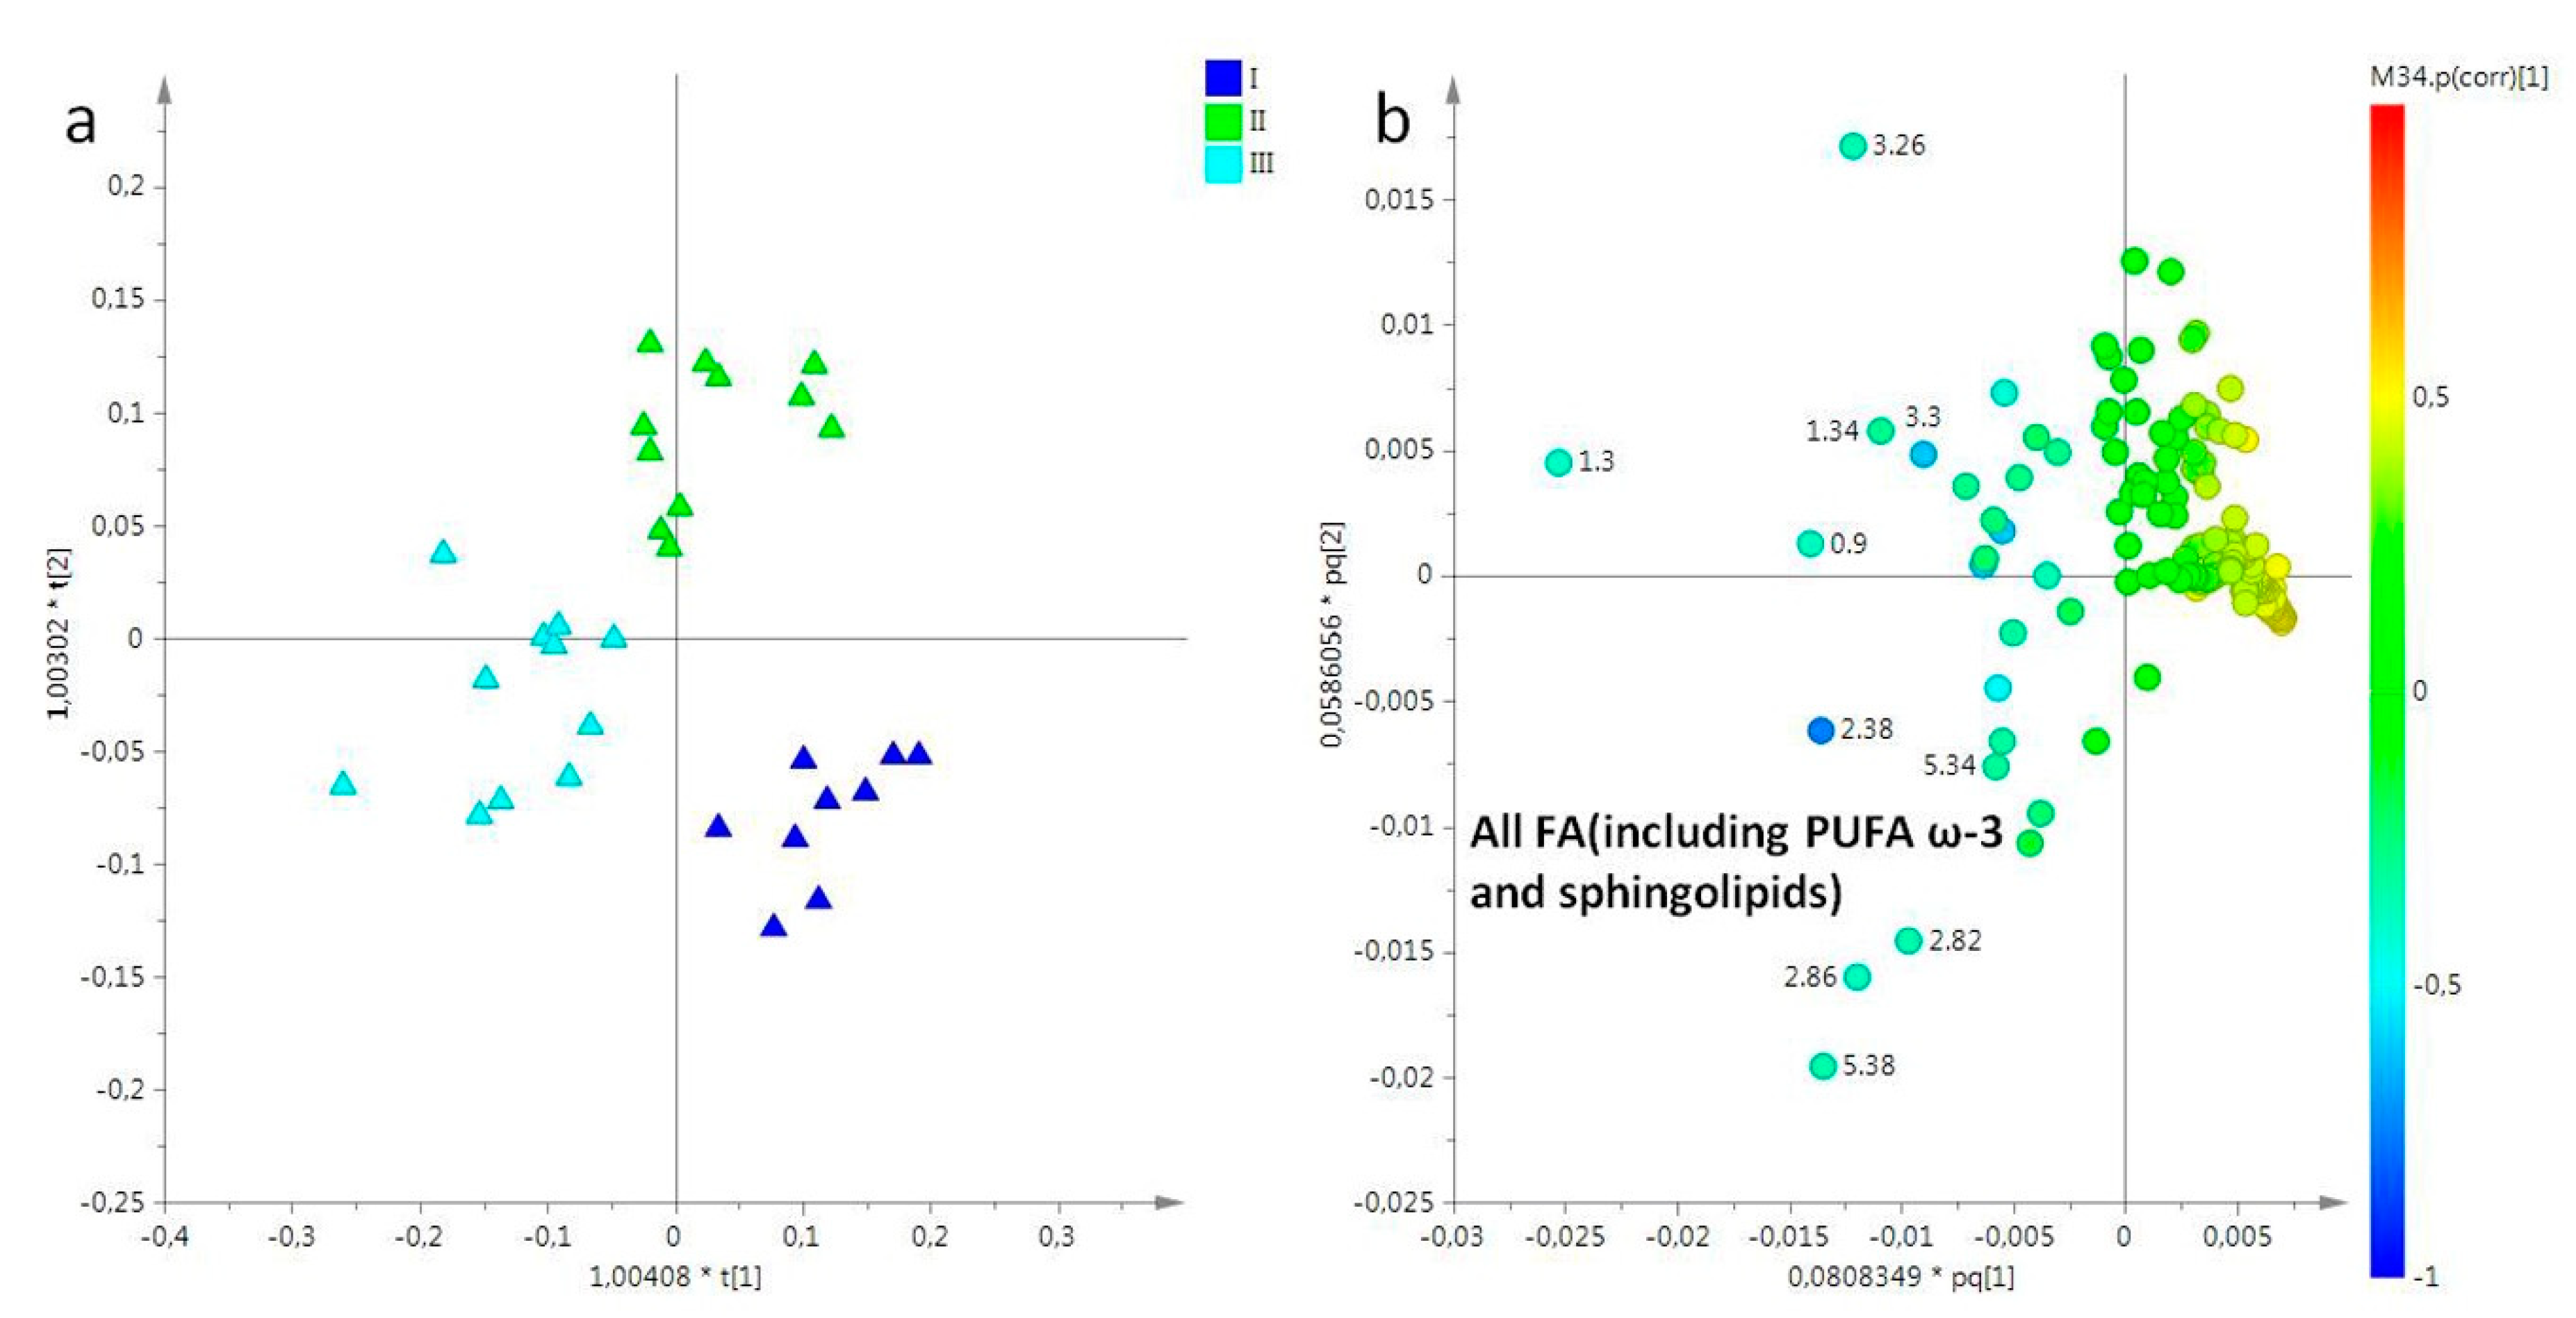
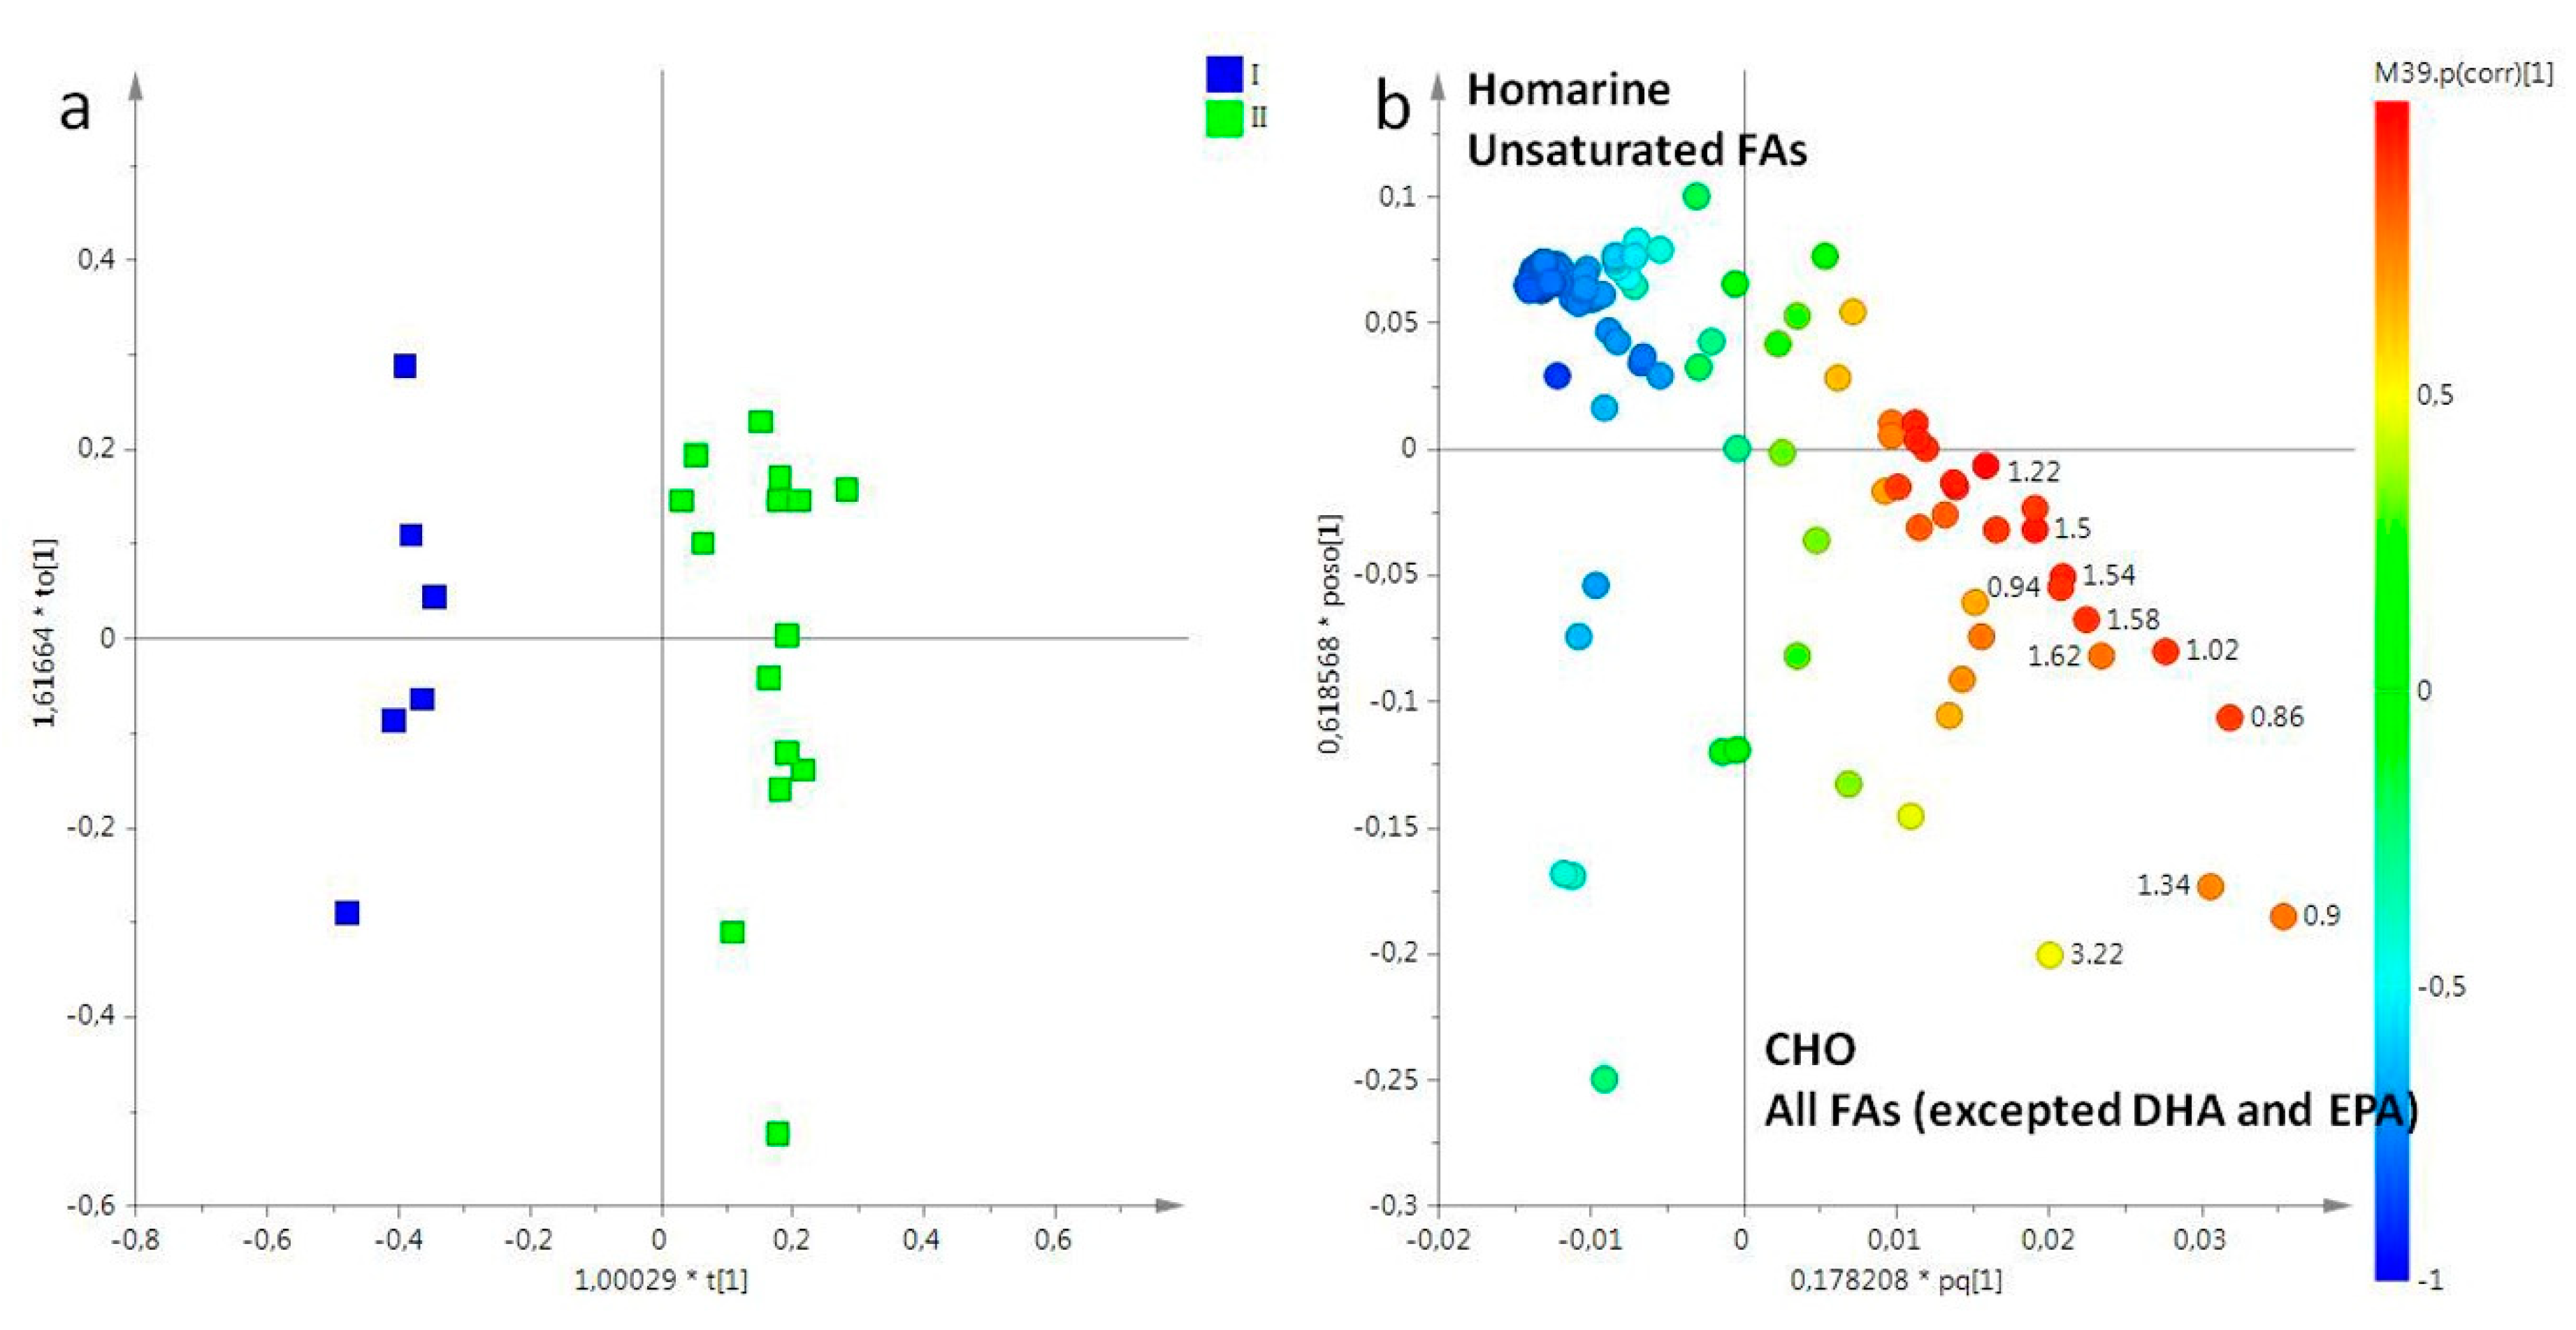
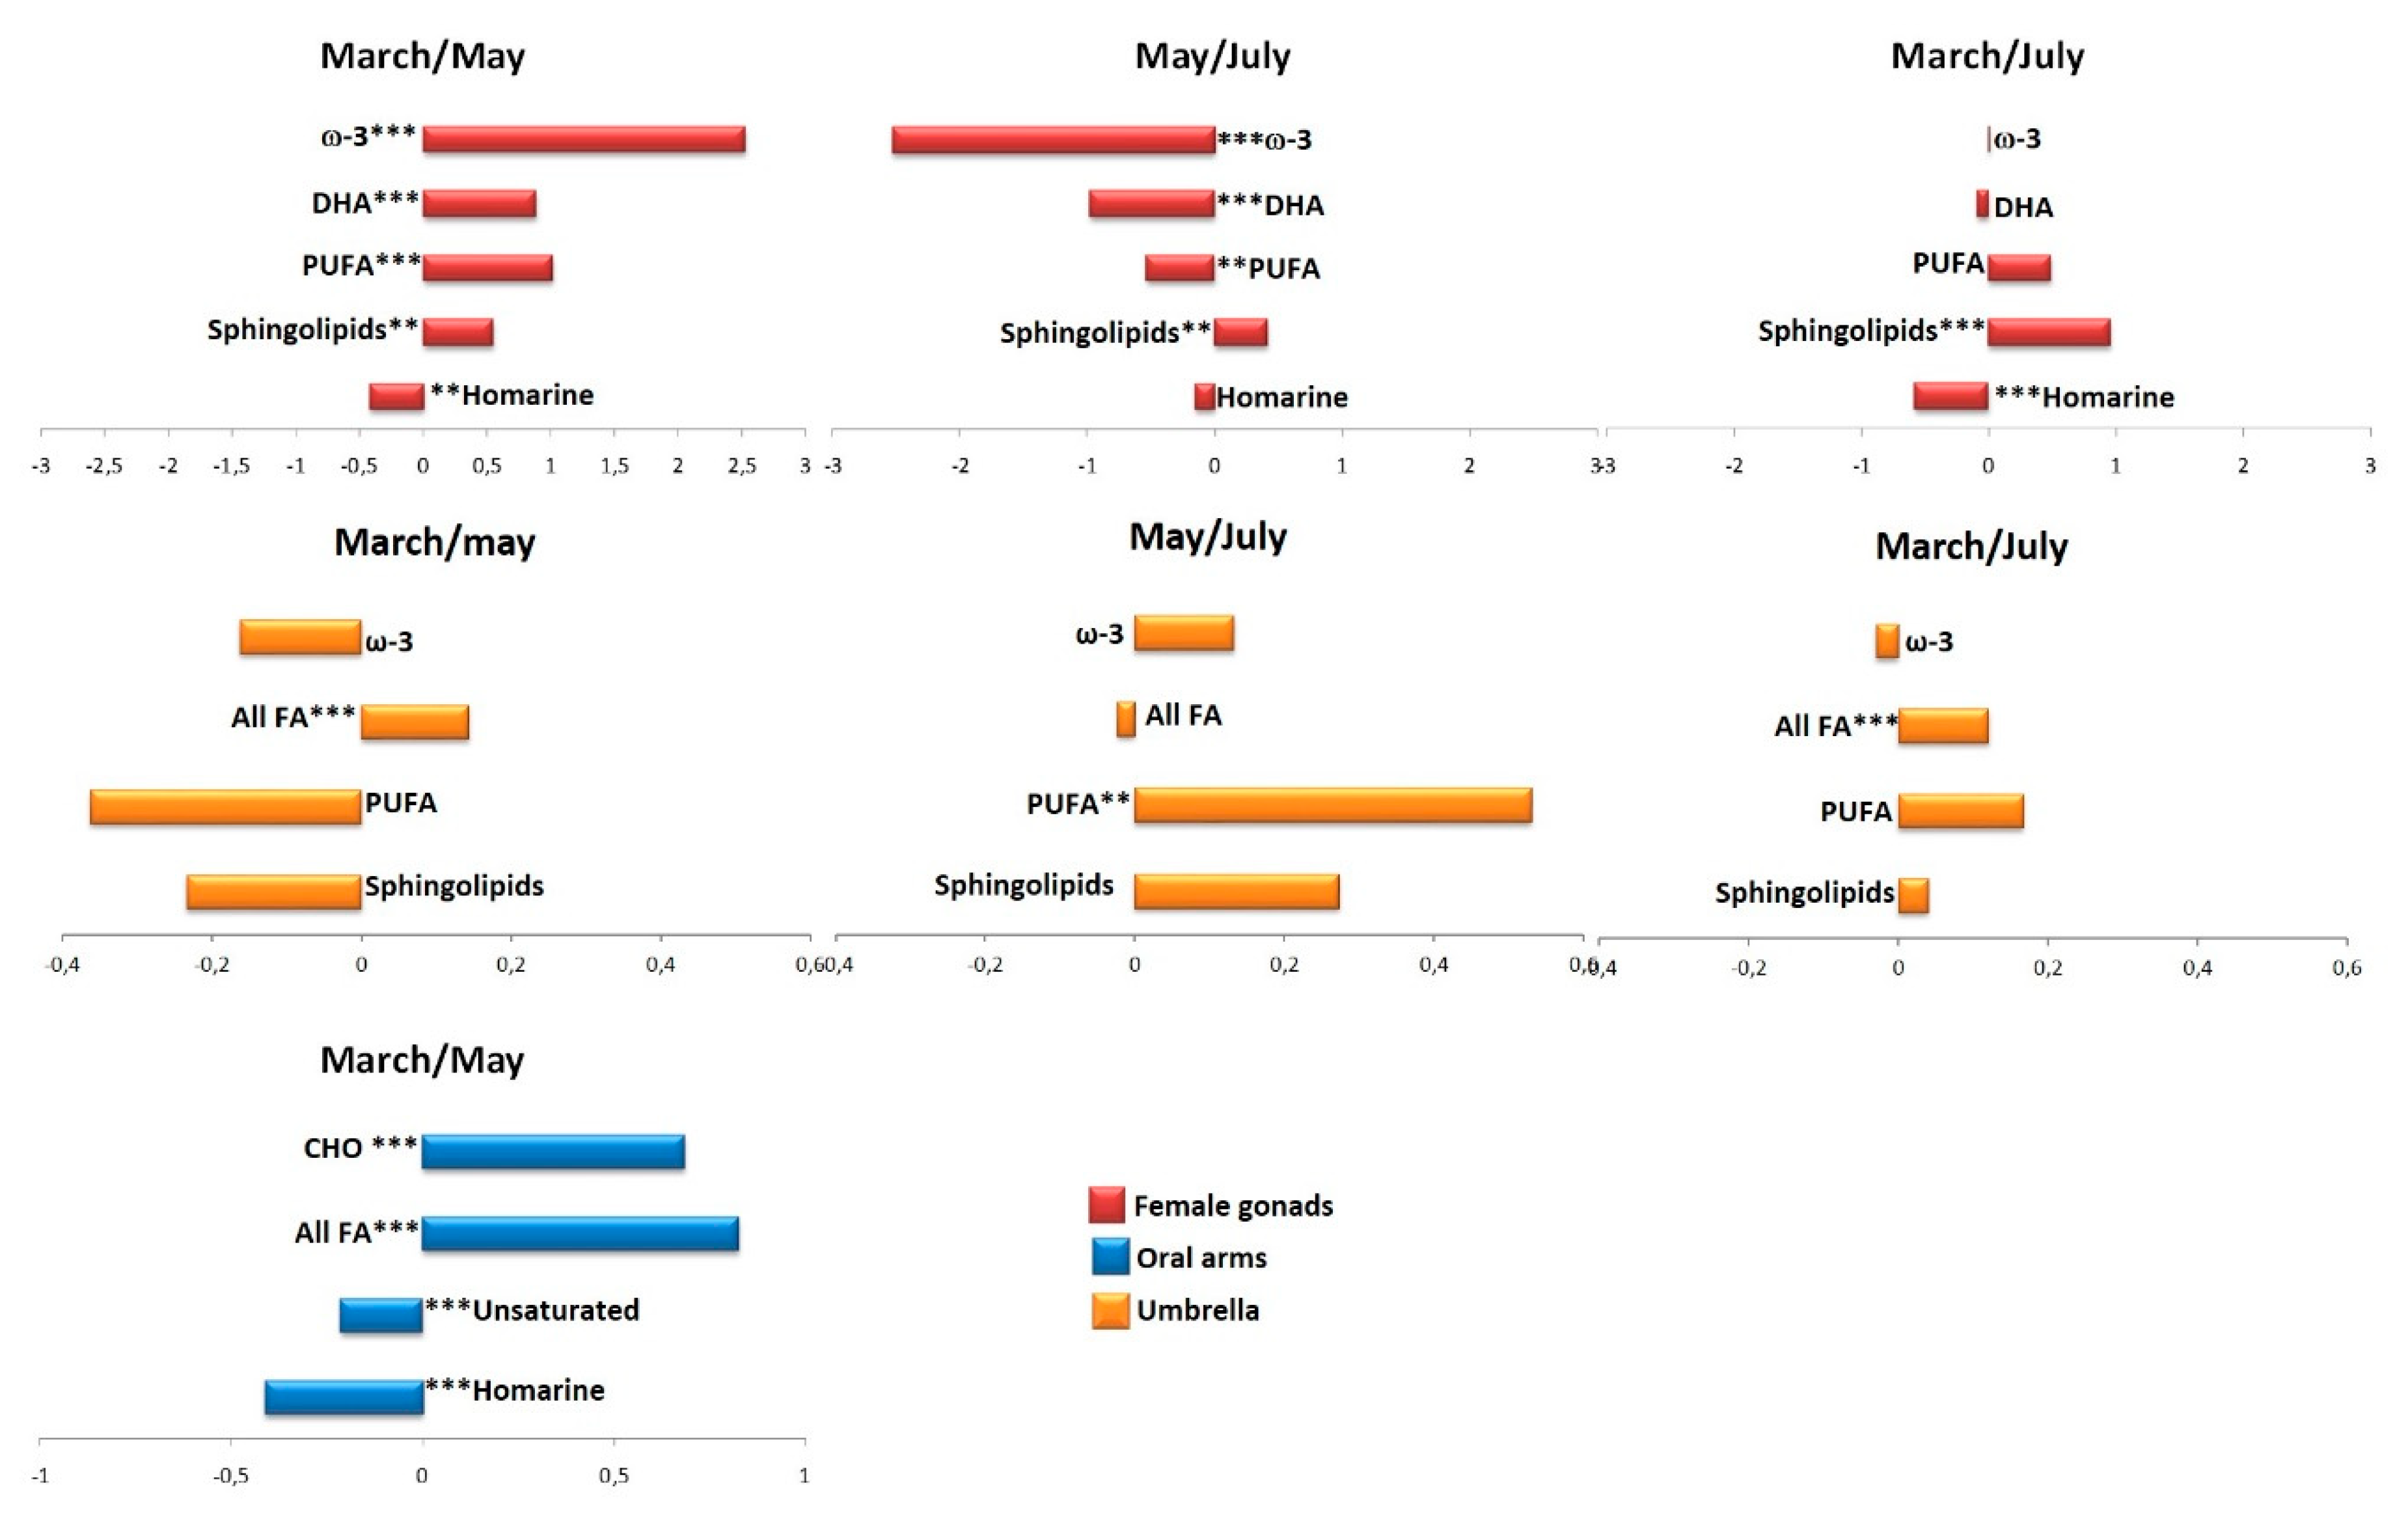
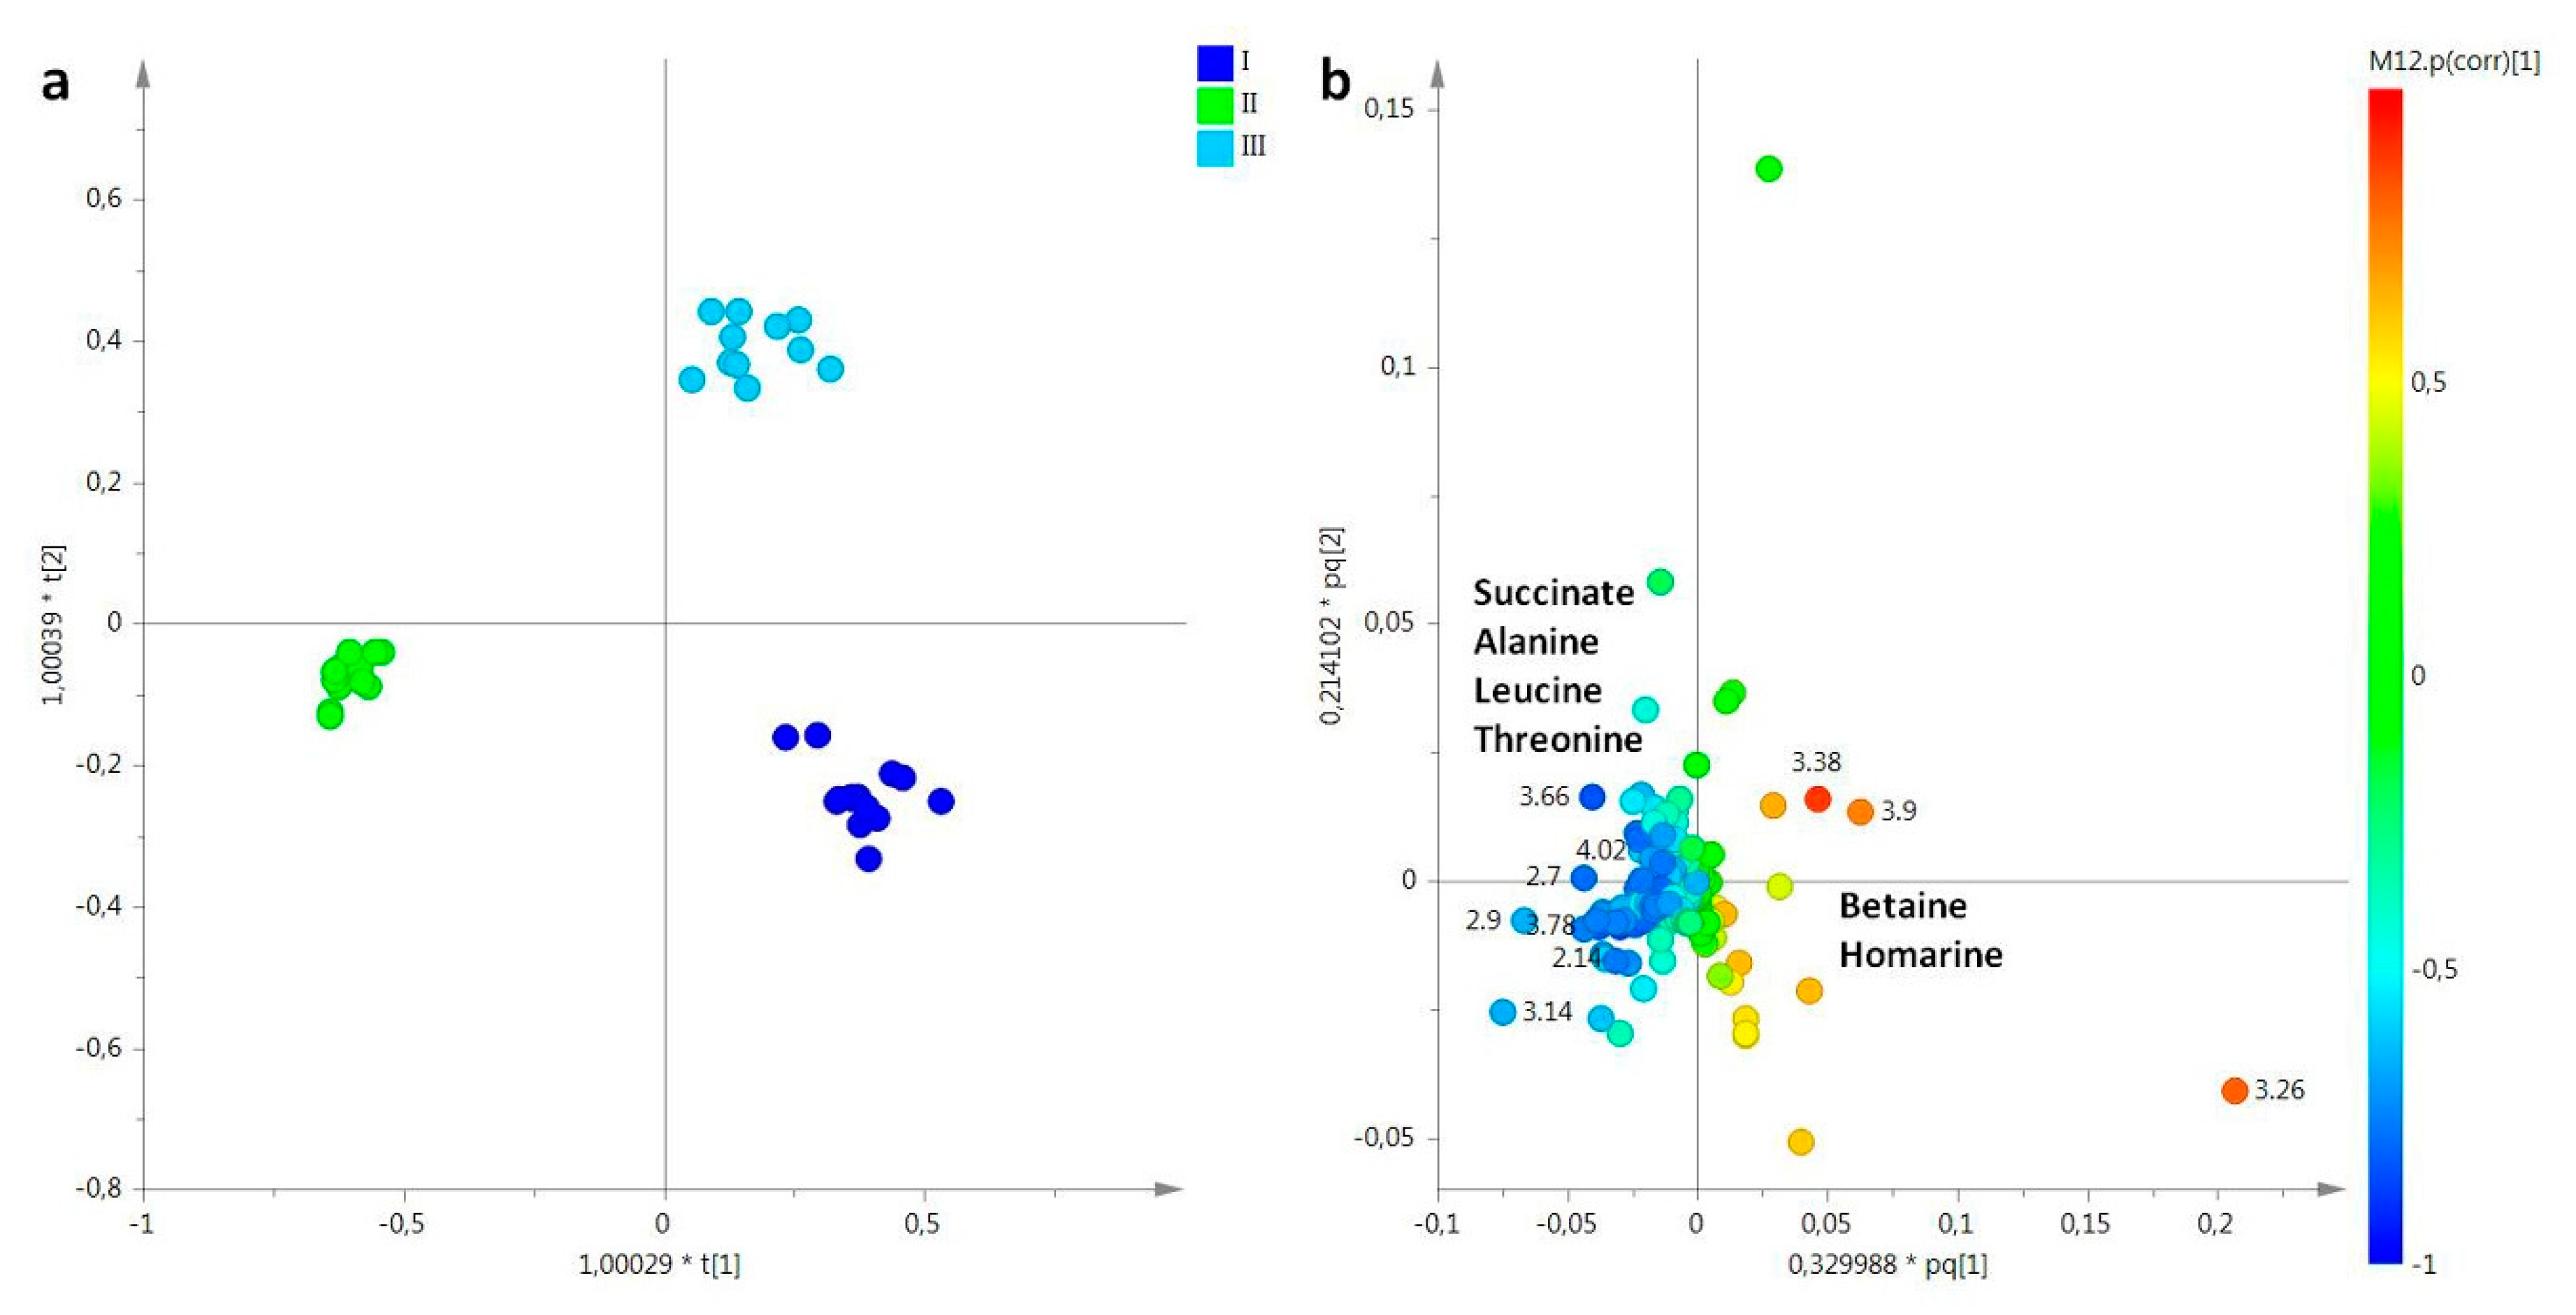
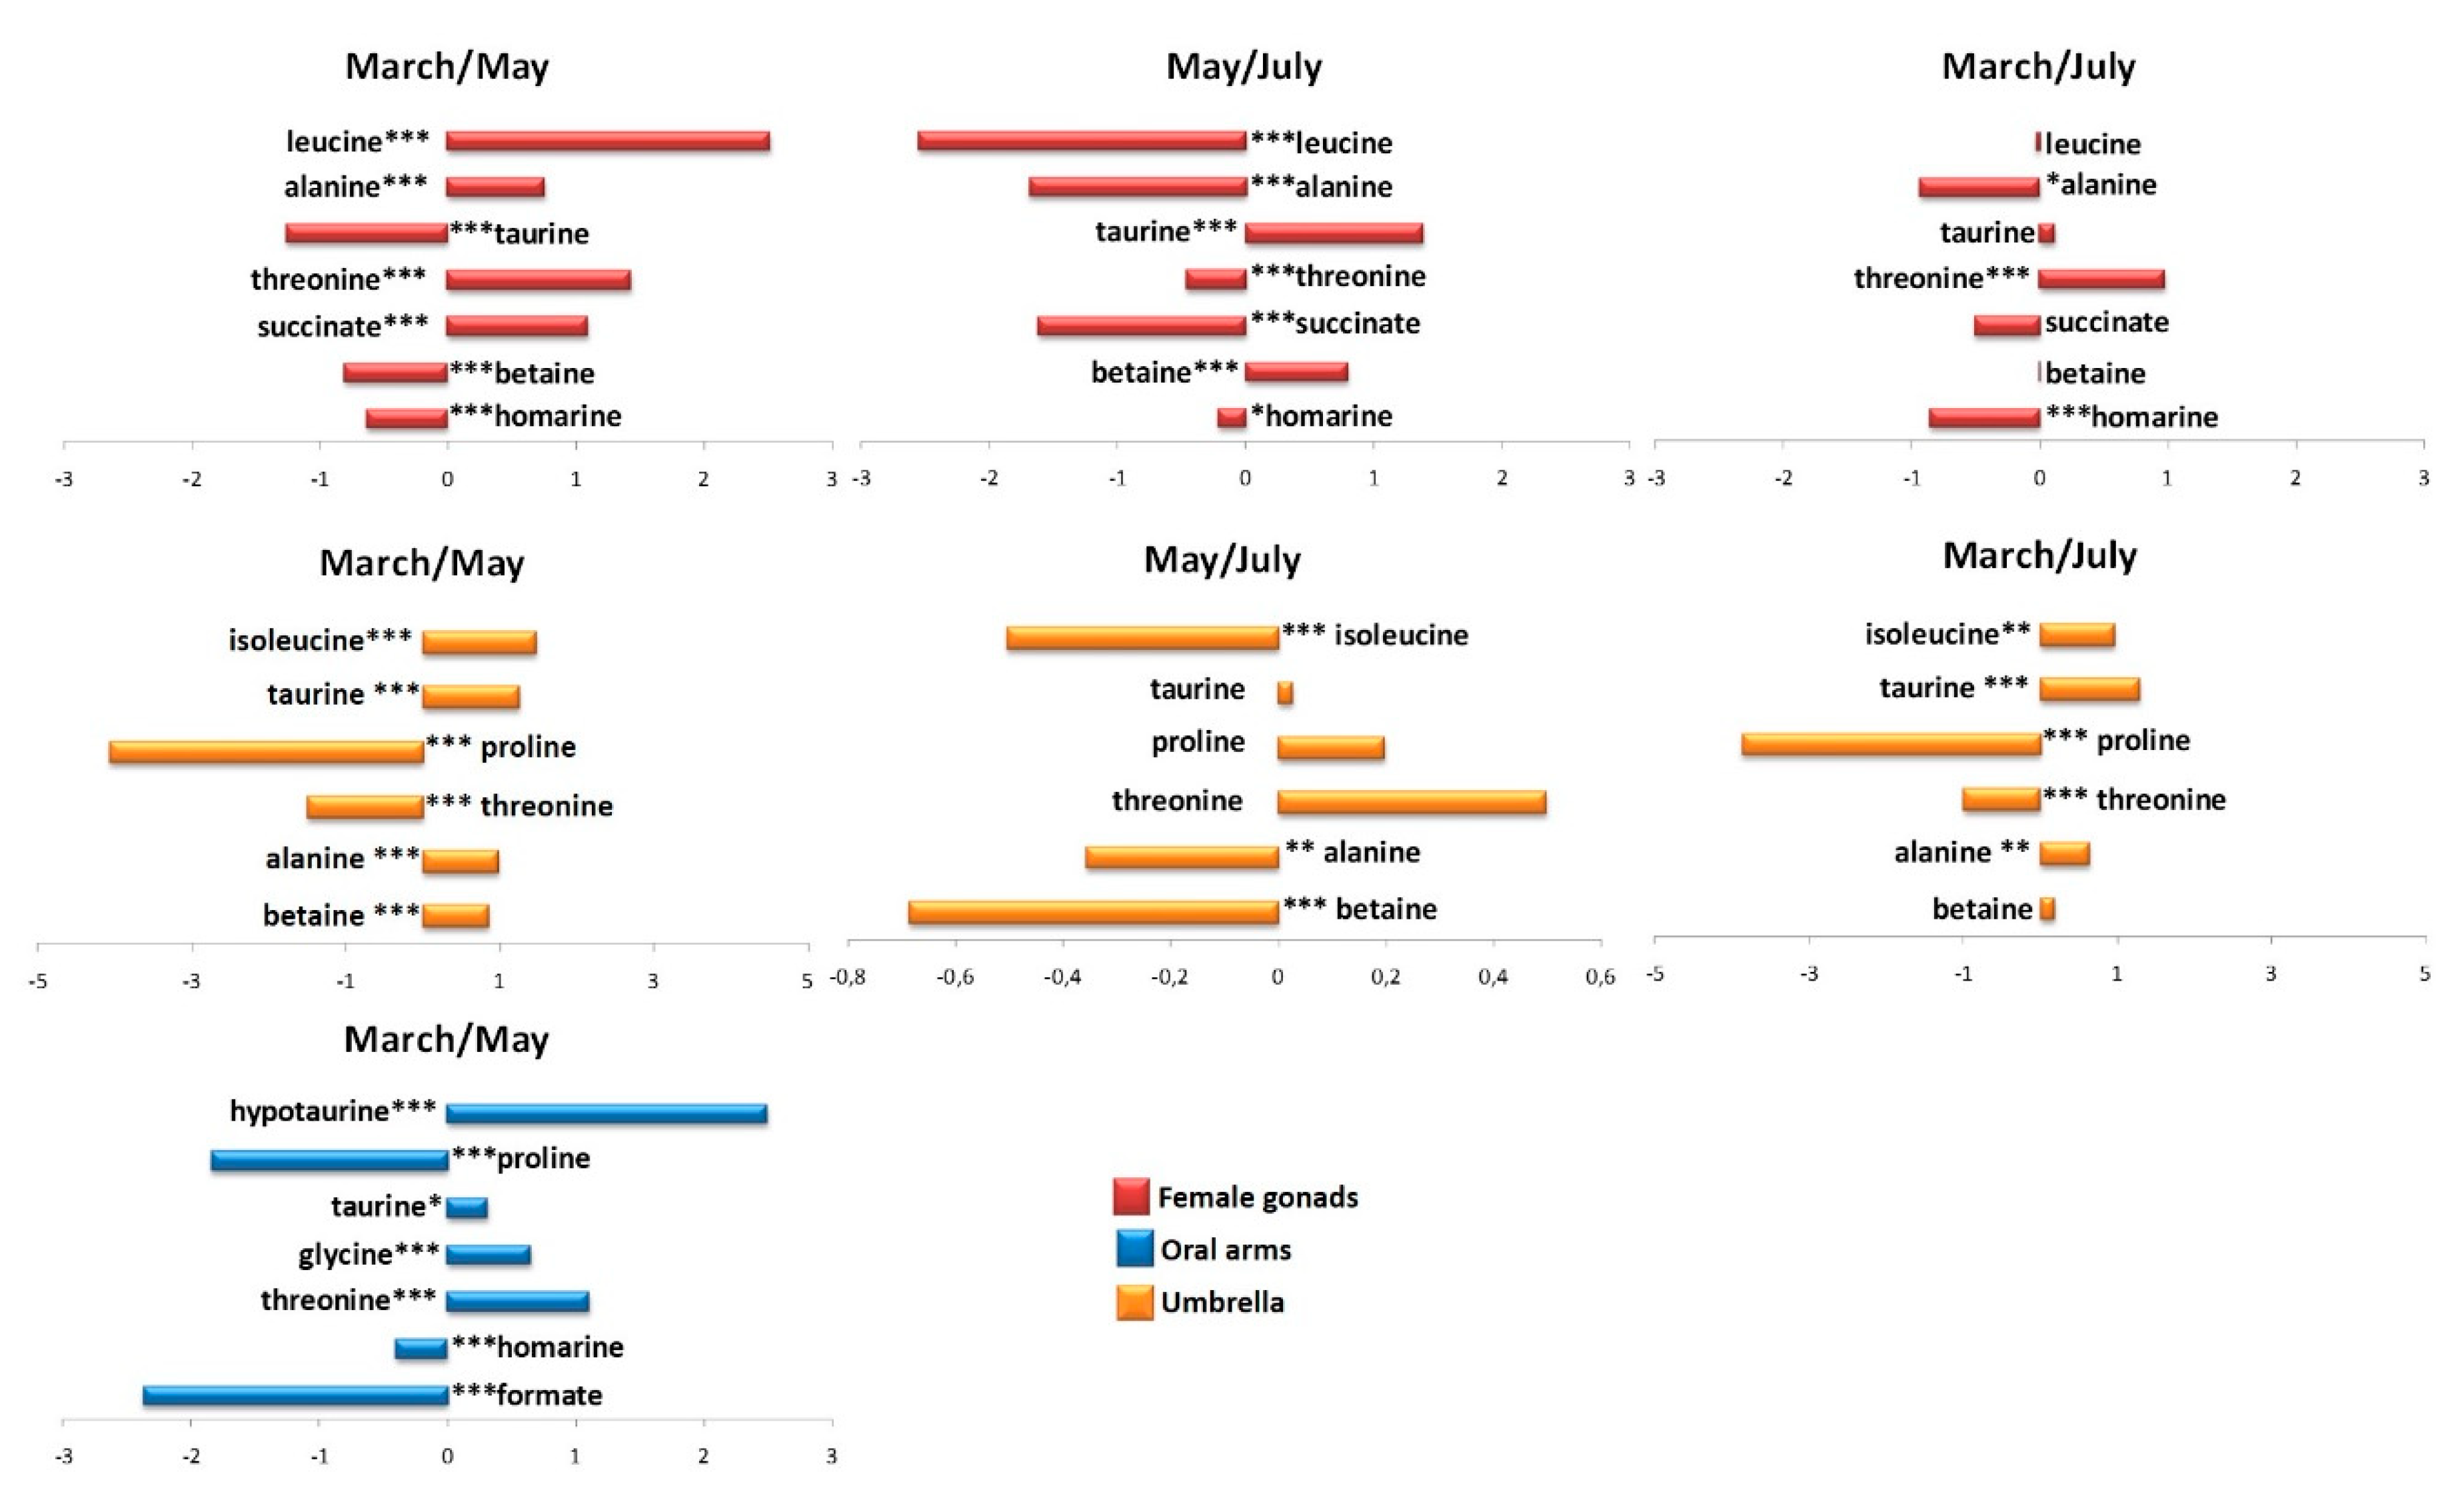
2.2.1. The Potential Effect of Sampling Period on R. pulmo Metabolomic Profile
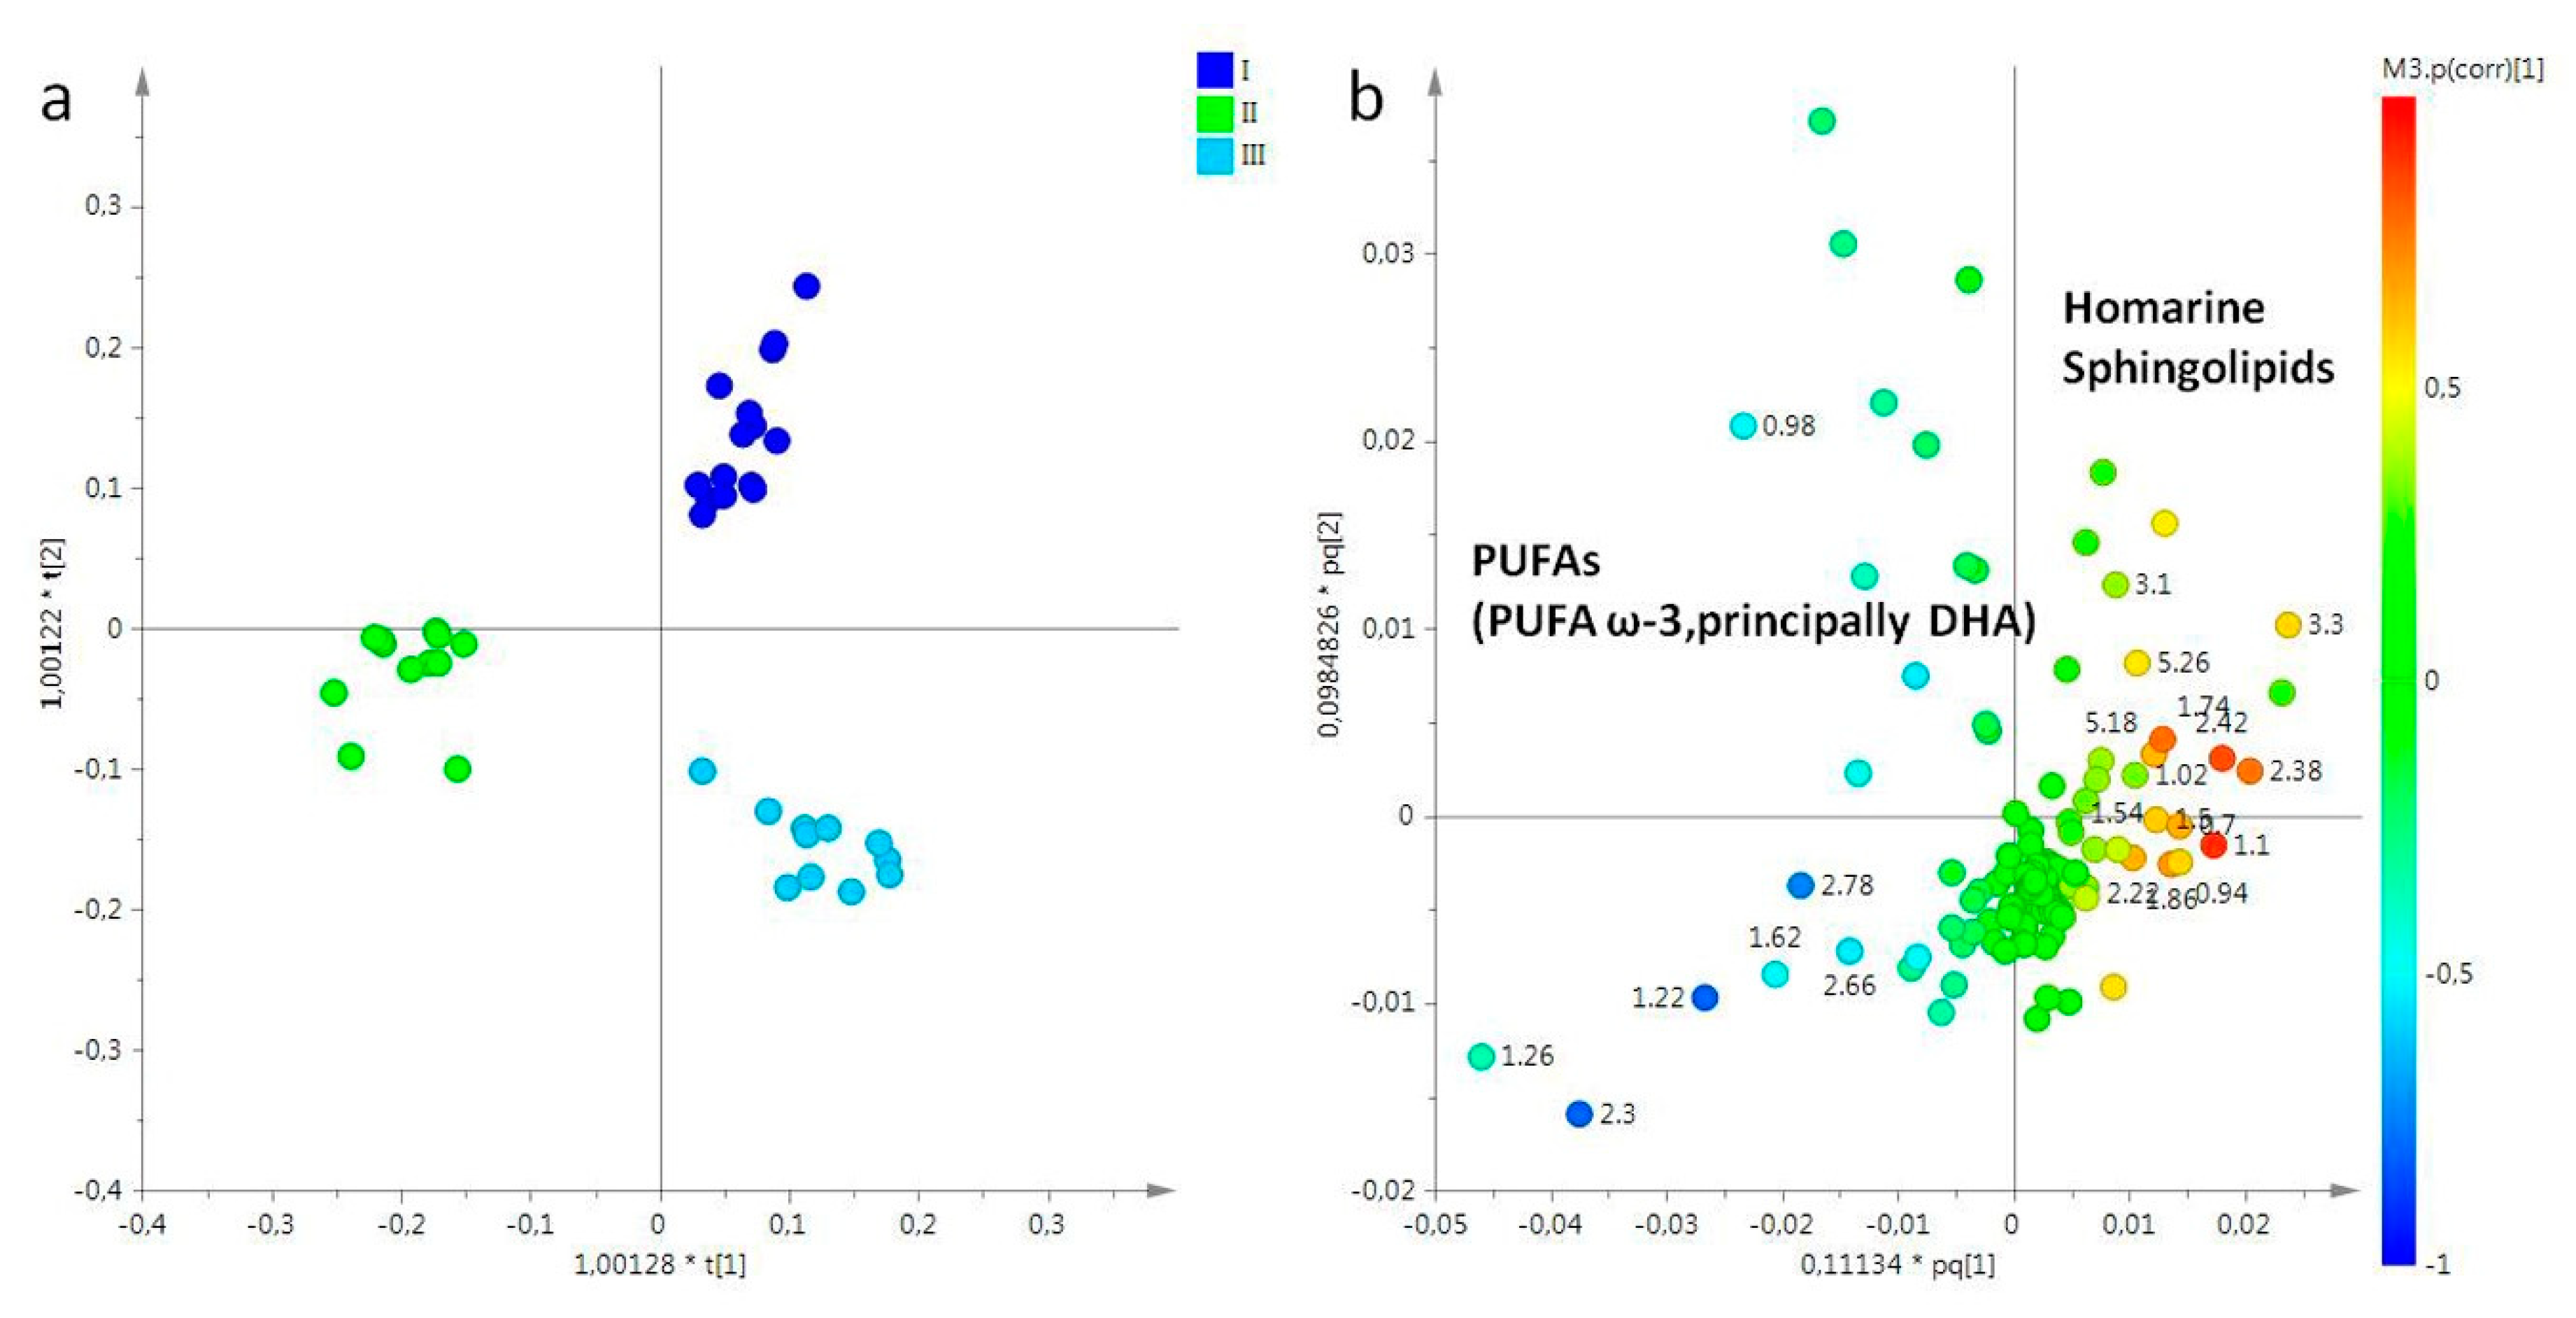
Lipid Extracts
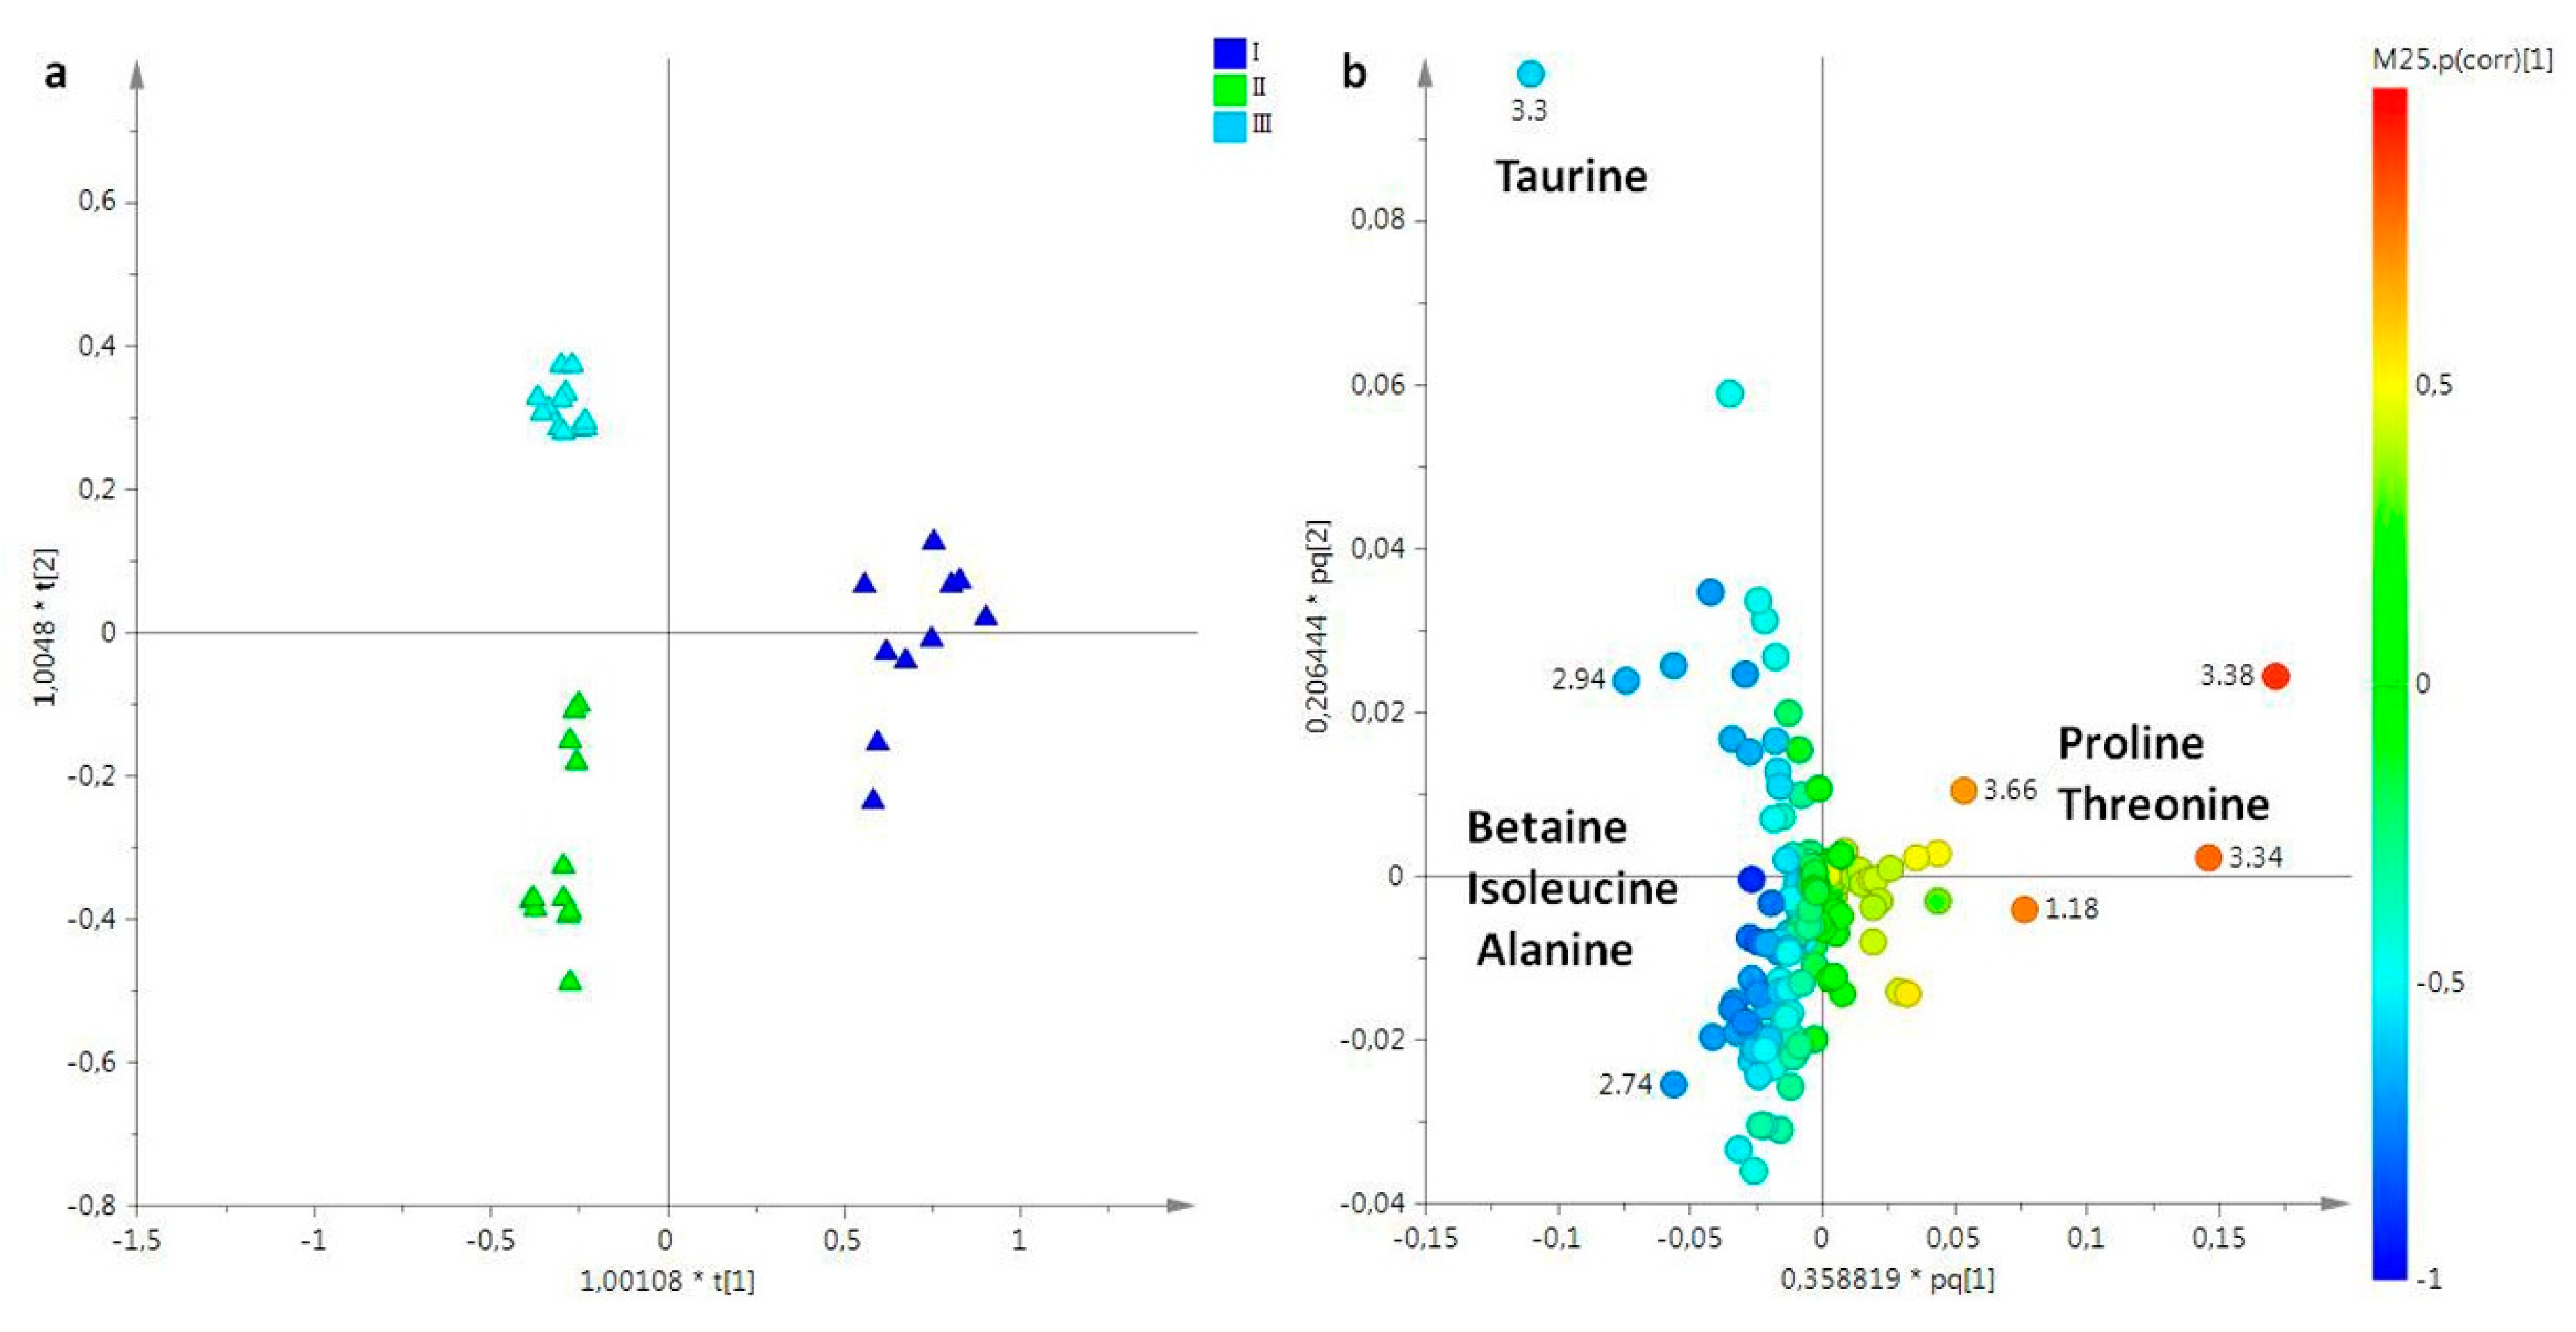
Aqueous Extracts
3. Discussion
4. Materials and Methods
4.1. Chemicals
4.2. Sampling
4.3. NMR Measurements
4.4. Statistical Analysis
5. Conclusions
Supplementary Materials
Author Contributions
Funding
Conflicts of Interest
Abbreviations
| FA | fatty acid |
| SFA | saturated fatty acid |
| MUFA | mono unsaturated fatty acid |
| DUFA | di-unsaturated fatty acid |
| PUFA | polyunsaturated fatty acid |
| TG | triglycerides |
| CHO | cholesterol |
| PC | phosphatidycholine |
| PE | phosphatidylethanolamine |
| EPA | eicosapentaenoic acid |
| DHA | docosahexaenoic acid |
| 1,2 DAG | 1,2 diacylglycerols |
| TMAO | trimethylamine-N-oxide |
| PCA | principal component analysis |
| OPLS-DA | orthogonal partial least squares discriminant analysis |
References
- Boero, F. Review of jellyfish blooms in the Mediterranean and Black Sea. Rome. FAO Fish. Rep. 2013, 92, 64. [Google Scholar]
- Richardson, A.J.; Bakun, A.; Hays, G.C.; Gibbons, M.J. The jellyfish joyride: Causes, consequences and management responses to a more gelatinous future. Trends Ecol. Evol. 2009, 24, 312–322. [Google Scholar] [CrossRef]
- Leone, A.; Lecci, R.M.; Durante, M.; Meli, F.; Piraino, S. The Bright Side of Gelatinous Blooms: Nutraceutical Value and Antioxidant Properties of Three Mediterranean Jellyfish (Scyphozoa). Mar. Drugs 2015, 13, 4654–4681. [Google Scholar] [CrossRef] [Green Version]
- Stabili, L.; Rizzo, L.; Fanizzi, F.P.; Angilè, F.; Del Coco, L.; Girelli, C.R.; Lomartire, S.; Piraino, S.; Basso, L. The Jellyfish Rhizostoma pulmo (Cnidaria): Biochemical Composition of Ovaries and Antibacterial Lysozyme-like Activity of the Oocyte Lysate. Mar. Drugs 2019, 17, 17. [Google Scholar] [CrossRef] [Green Version]
- Mariottini, G.L.; Pane, L. Mediterranean Jellyfish Venoms: A Review on Scyphomedusae. Mar. Drugs 2010, 8, 1122–1152. [Google Scholar] [CrossRef] [Green Version]
- Purcell, J.; Mianzan, H.; Frost, J.R. Temperature effects on asexual reproduction rates of scyphozoan species from the northwest Mediterranean Sea. In Jellyfish Blooms IV; Springer: Dordrecht, The Netherlands, 2012; pp. 169–180. [Google Scholar] [CrossRef]
- Mariottini, G.L.; Grice, I.D. Antimicrobials from Cnidarians. A New Perspective for Anti-Infective Therapy? Mar. Drugs 2016, 14, 48. [Google Scholar] [CrossRef] [Green Version]
- Rocha, J.; Peixe, L.; Gomes, N.C.M.; Calado, R. Cnidarians as a Source of New Marine Bioactive Compounds—An Overview of the Last Decade and Future Steps for Bioprospecting. Mar. Drugs 2011, 9, 1860–1886. [Google Scholar] [CrossRef]
- Hsieh, Y.-H.P. Use of Jellyfish Collagen (Type II) in the Treatment of Rheumatoid Arthritis. U.S. Application US10/007,716, 17 May 2005. [Google Scholar]
- Addad, S.; Exposito, J.-Y.; Faye, C.; Ricard-Blum, S.; Lethias, C. Isolation, Characterization and Biological Evaluation of Jellyfish Collagen for Use in Biomedical Applications. Mar. Drugs 2011, 9, 967–983. [Google Scholar] [CrossRef] [PubMed] [Green Version]
- Zhuang, Y.; Sun, L.; Zhao, X.; Wang, J.; Hou, H.; Li, B. Antioxidant and melanogenesis-inhibitory activities of collagen peptide from jellyfish (Rhopilema esculentum). J. Sci. Food Agric. 2009, 89, 1722–1727. [Google Scholar] [CrossRef]
- Effects of Collagen and Collagen Hydrolysate from Jellyfish (Rhopilema esculentum) on Mice Skin Photoaging Induced by UV Irradiation. J. Food Sci. 2009, 74, H183–H188. [CrossRef] [PubMed]
- Zhuang, Y.; Sun, L.; Zhang, Y.; Liu, G. Antihypertensive effect of long-term oral administration of jellyfish (Rhopilema esculentum) collagen peptides on renovascular hypertension. Mar. Drugs 2012, 10, 417–426. [Google Scholar] [CrossRef] [PubMed]
- Hsieh, Y.P.; Rudloe, J. Potential of utilizing jellyfish as food in Western countries. Trends Food Sci. Technol. 1994, 5, 225–229. [Google Scholar] [CrossRef]
- Liu, X.; Zhang, M.; Zhang, C.; Liu, C. Angiotensin converting enzyme (ACE) inhibitory, antihypertensive and antihyperlipidaemic activities of protein hydrolysates from Rhopilema esculentum. Food Chem. 2012, 134, 2134–2140. [Google Scholar] [CrossRef] [PubMed]
- Hoyer, B.; Bernhardt, A.; Lode, A.; Heinemann, S.; Sewing, J.; Klinger, M.; Notbohm, H.; Gelinsky, M. Jellyfish collagen scaffolds for cartilage tissue engineering. Acta Biomater. 2014, 10, 883–892. [Google Scholar] [CrossRef]
- De Domenico, S.; De Rinaldis, G.; Paulmery, M.; Piraino, S.; Leone, A. Barrel jellyfish (Rhizostoma pulmo) as source of antioxidant peptides. Mar. Drugs 2019, 17, 134. [Google Scholar] [CrossRef] [Green Version]
- Miyajima, Y.; Masuda, R.; Kurihara, A.; Kamata, R.; Yamashita, Y.; Takeuchi, T. Juveniles of threadsail filefish, Stephanolepis cirrhifer, can survive and grow by feeding on moon jellyfish Aurelia aurita. Fish. Sci. 2011, 77, 41–48. [Google Scholar] [CrossRef]
- Armani, A.; Giusti, A.; Castigliego, L.; Rossi, A.; Tinacci, L.; Gianfaldoni, D.; Guidi, A. Pentaplex PCR as screening assay for jellyfish species identification in food products. J. Agric. Food Chem. 2014, 62, 12134–12143. [Google Scholar] [CrossRef]
- Khong, N.M.; Yusoff, F.M.; Jamilah, B.; Basri, M.; Maznah, I.; Chan, K.W.; Nishikawa, J. Nutritional composition and total collagen content of three commercially important edible jellyfish. Food Chem. 2016, 196, 953–960. [Google Scholar] [CrossRef]
- Del Coco, L.; Felline, S.; Girelli, C.R.; Angilè, F.; Magliozzi, L.; Almada, F.; D’Aniello, B.; Mollo, E.; Terlizzi AFanizzi, F.P. 1H NMR Spectroscopy and MVA to evaluate the effects of caulerpin-based diet on Diplodus sargus lipid profiles. Mar. Drugs 2018, 16, 390. [Google Scholar] [CrossRef] [Green Version]
- Fan, T.W.-M. Metabolite profiling by one-and two-dimensional NMR analysis of complex mixtures. Prog. Nucl. Magn. Reson. Spectrosc. 1996, 28, 161–219. [Google Scholar] [CrossRef]
- Mannina, L.; Sobolev, A.P.; Capitani, D.; Iaffaldano, N.; Rosato, M.P.; Ragni, P.; Reale, A.; Sorrentino, E.; D’Amico, I.; Coppola, R. NMR metabolic profiling of organic and aqueous sea bass extracts: Implications in the discrimination of wild and cultured sea bass. Talanta 2008, 77, 433–444. [Google Scholar] [CrossRef]
- Shumilina, E.; Ciampa, A.; Capozzi, F.; Rustad, T.; Dikiy, A. NMR approach for monitoring post-mortem changes in Atlantic salmon fillets stored at 0 and 4 C. Food Chem. 2015, 184, 12–22. [Google Scholar] [CrossRef] [Green Version]
- Milisenda, G.; Rossi, S.; Vizzini, S.; Fuentes, V.L.; Purcell, J.E.; Tilves, U.; Piraino, S. Seasonal variability of diet and trophic level of the gelatinous predator Pelagia noctiluca (Scyphozoa). Sci. Rep. 2018, 8, 12140. [Google Scholar] [CrossRef]
- Jellyfish as Prey: Frequency of Predation and Selective Foraging of Boops boops (Vertebrata, Actinopterygii) on the Mauve Stinger Pelagia noctiluca (Cnidaria, Scyphozoa). PLoS ONE 2014, 11, e94600. [CrossRef] [Green Version]
- Tikunov, A.P.; Johnson, C.B.; Lee, H.; Stoskopf, M.K.; Macdonald, J.M. Metabolomic investigations of American oysters using 1H-NMR spectroscopy. Mar. Drugs 2010, 8, 2578–2596. [Google Scholar] [CrossRef] [PubMed] [Green Version]
- Zotti, M.; De Pascali, S.A.; Del Coco, L.; Migoni, D.; Carrozzo, L.; Mancinelli, G.; Fanizzi, F.P. 1H NMR metabolomic profiling of the blue crab (Callinectes sapidus) from the Adriatic Sea (SE Italy): A comparison with warty crab (Eriphia verrucosa), and edible crab (Cancer pagurus). Food Chem. 2016, 196, 601–609. [Google Scholar] [CrossRef] [PubMed]
- Burg, M.B.; Ferraris, J.D. Intracellular organic osmolytes: Function and regulation. J. Biol. Chem. 2008, 283, 7309–7313. [Google Scholar] [CrossRef] [PubMed] [Green Version]
- Yu, H.; Li, R.; Liu, S.; Xing, R.; Chen, X.; Li, P. Amino acid composition and nutritional quality of gonad from jellyfish Rhopilema esculentum. Biomed. Prev. Nutr. 2014, 4, 399–402. [Google Scholar] [CrossRef]
- Monroig, Ó.; Tocher, D.R.; Navarro, J.C. Biosynthesis of Polyunsaturated Fatty Acids in Marine Invertebrates: Recent Advances in Molecular Mechanisms. Mar. Drugs 2013, 11, 3998–4018. [Google Scholar] [CrossRef] [Green Version]
- Besnard, J.-Y. Etude Des Constituants Lipidiques Dans la Gonade Femelle et Les Larves de Pecten Maximus L: (Mollusque lamellibranche). Ph.D. Thesis, Université de Caen, Caen, France, 1988. [Google Scholar]
- Izquierdo, M.S.; Fernández-Palacios, H.; Tacon, A.G.J. Effect of broodstock nutrition on reproductive performance of fish. Aquaculture 2001, 197, 25–42. [Google Scholar] [CrossRef]
- Tulli, F.; Tibaldi, E. Changes in amino acids and essential fatty acids during early larval rearing of dentex. Aquac. Int. 1997, 5, 229–236. [Google Scholar] [CrossRef]
- Pernet, V.; Gavino, V.; Gavino, G.; Anctil, M. Variations of lipid and fatty acid contents during the reproductive cycle of the anthozoan Renilla koellikeri. J. Comp. Physiol. B 2002, 172, 455–465. [Google Scholar]
- Miliou, H.; Fintikaki, M.; Tzitzinakis, M.; Kountouris, T.; Verriopoulos, G. Fatty acid composition of the common octopus, Octopus vulgaris, in relation to rearing temperature and body weight. Aquaculture 2006, 256, 311–322. [Google Scholar] [CrossRef]
- Milisenda, G.; Martínez-Quintana, A.; Fuentes, V.; Bosch-Belmar, M.; Aglieri, G.; Boero, F.; Piraino, S. Reproductive and bloom patterns of Pelagia noctiluca in the Strait of Messina, Italy. Estuar. Coast. Shelf Sci. 2018, 201, 29–39. [Google Scholar] [CrossRef]
- Abdullah, A.; Nurjanah, N.; Hidayat, T.; Aji, D.U. Fatty acid profile of jellyfish (Aurelia aurita) as a source raw material of aquatic result rich beneft. Int. J. Chem. Biol. Sci. 2015, 1, 12–16. [Google Scholar]
- Nichols, P.D.; Danaher, K.T.; Koslow, J.A. Occurrence of high levels of tetracosahexaenoic acid in the jellyfish Aurelia sp. Lipids 2003, 38, 1207–1210. [Google Scholar] [CrossRef]
- Song, C.; Zhao, S. Omega-3 fatty acid eicosapentaenoic acid. A new treatment for psychiatric and neurodegenerative diseases: A review of clinical investigations. Expert Opin. Investig. Drugs 2007, 16, 1627–1638. [Google Scholar] [CrossRef]
- Song, C.; Phillips, A.G.; Leonard, B. Interleukin 1 beta enhances conditioned fear memory in rats: Possible involvement of glucocorticoids. Eur. J. Neurosci. 2003, 18, 1739–1743. [Google Scholar] [CrossRef]
- Lucas, C.H. Reproduction and life history strategies of the common jellyfish, Aurelia aurita, in relation to its ambient environment. In Jellyfish Blooms: Ecological and Societal Importance; Springer: Dordrecht, The Netherlands, 2001; pp. 229–246. [Google Scholar] [CrossRef]
- Fuentes, V.; Straehler-Pohl, I.; Atienza, D.; Franco, I.; Tilves, U.; Gentile, M.; Acevedo, M.; Olariaga, A.; Gili, J. Life cycle of the jellyfish Rhizostoma pulmo (Scyphozoa: Rhizostomeae) and its distribution, seasonality and inter-annual variability along the Catalan coast and the Mar Menor (Spain, NW Mediterranean). Mar. Biol. 2011, 158, 2247–2266. [Google Scholar] [CrossRef]
- Ikegami, S. Light-controlled production of spawning-inducing substance in jellyfish ovary. Nature 1978, 272, 611–612. [Google Scholar] [CrossRef]
- Freeman, G. The role of oocyte maturation in the ontogeny of the fertilization site in the hydrozoan Hydractinia echinata. Rouxs Arch. Dev. Biol. 1987, 196, 83–92. [Google Scholar] [CrossRef] [PubMed]
- Artigas, G.Q.; Deguchi, R. A gonad-expressed opsin mediates light- induced spawning in the jellyfish Clytia. eLife 2018, 7, e29555. [Google Scholar] [CrossRef] [PubMed] [Green Version]
- Bligh, E.G.; Dyer, W.J. A rapid method of total lipid extraction and purification. Can. J. Biochem. Physiol. 1959, 37, 911–917. [Google Scholar] [CrossRef] [PubMed] [Green Version]
- Wu, H.; Southam, A.D.; Hines, A.; Viant, M.R. High-throughput tissue extraction protocol for NMR-and MS-based metabolomics. Anal. Biochem. 2008, 372, 204–212. [Google Scholar] [CrossRef]
- Van den Berg, R.A.; Hoefsloot, H.C.; Westerhuis, J.A.; Smilde, A.K.; van der Werf, M.J. Centering, scaling, and transformations: Improving the biological information content of metabolomics data. BMC Genom. 2006, 7, 142. [Google Scholar] [CrossRef] [Green Version]
- Trygg, J.; Wold, S. Orthogonal projections to latent structures (O-PLS). J. Chemom. J. Chemom. Soc. 2002, 16, 119–128. [Google Scholar] [CrossRef]
- Jackson, J.E. A User’s Guide to Principal Components; John Wiley & Sons: Hoboken, NJ, USA, 2005; Volume 587. [Google Scholar]
- Lindon, J.C.; Nicholson, J.K.; Holmes, E. The Handbook of Metabonomics and Metabolomics; Elsevier: Amsterdam, The Netherlands, 2011. [Google Scholar]
- De Pascali, S.A.; Gambacorta, L.; Oswald, I.P.; Del Coco, L.; Solfrizzo, M.; Fanizzi, F.P. 1H NMR and MVA metabolomic profiles of urines from piglets fed with boluses contaminated with a mixture of five mycotoxins. Biochem. Biophys. Rep. 2017, 11, 9–18. [Google Scholar]
- Consonni, R.; Cagliani, L.R.; Benevelli, F.; Spraul, M.; Humpfer, E.; Stocchero, M. NMR and chemometric methods: A powerful combination for characterization of balsamic and traditional balsamic vinegar of Modena. Anal. Chim. Acta 2008, 611, 31–40. [Google Scholar] [CrossRef]
- Boccard, J.; Rutledge, D.N. A consensus orthogonal partial least squares discriminant analysis (OPLS-DA) strategy for multiblock Omics data fusion. Anal. Chim. Acta 2013, 769, 30–39. [Google Scholar] [CrossRef]
- Holmes, E.; Loo, R.L.; Stamler, J.; Bictash, M.; Yap, I.K.S.; Chan, Q.; Ebbels, T.; De Iorio, M.; Brown, I.J.; Veselkov, K.A.; et al. Human metabolic phenotype diversity and its association with diet and blood pressure. Nature 2008, 453, 396–400. [Google Scholar] [CrossRef]
- Triba, M.N.; le Moyec, L.; Amathieu, R.; Goossens, C.; Bouchemal, N.; Nahon, P.; Rutledge, D.N.; Savarin, P. PLS/OPLS models in metabolomics: The impact of permutation of dataset rows on the K-fold cross-validation quality parameters. Mol. Biosyst. 2015, 11, 13–19. [Google Scholar] [CrossRef] [PubMed]
- Eriksson, L.; Byrne, T.; Johansson, E.; Trygg, J.; Vikström, C. Multi-and Megavariate Data Analysis Basic Principles and Applications; Umetrics Academy: Malmö, Sweden, 2013; Volume 1. [Google Scholar]
- Eastment, H.T.; Krzanowski, W.J. Cross-validatory choice of the number of components from a principal component analysis. Technometrics 1982, 24, 73–77. [Google Scholar] [CrossRef]
- Girelli, C.R.; Del Coco, L.; Fanizzi, F.P. 1H NMR spectroscopy and multivariate analysis as possible tool to assess cultivars, from specific geographical areas, in EVOOs. Eur. J. Lipid Sci. Technol. 2016, 118, 1380–1388. [Google Scholar] [CrossRef]
- Girelli, C.R.; Accogli, R.; del Coco, L.; Angilè, F.; de Bellis, L.; Fanizzi, F.P. 1H-NMR-based metabolomic profiles of different sweet melon (Cucumis melo L.) Salento varieties: Analysis and comparison. Food Res. Int. 2018, 114, 81–89. [Google Scholar] [CrossRef] [PubMed]
- R: A Language and Environment for Statistical Computing; R Foundation for Statistical Computing: Vienna, Austria, 2013; Available online: https://www.gbif.org/tool/81287/r-a-language-and-environment-forstatistical-computing (accessed on 19 November 2019).
Sample Availability: Samples of the compounds are not available from the authors. |


| Compound | Assignment | 1H (ppm, Multiplicity) |
|---|---|---|
| Cholesterol (CHO) | -CH3-18 | 0.68–0.69 (s) |
| -CH3-21 | 0.92 (d) | |
| -CH3-19 | 1.01 (s) | |
| All fatty acids (STA, MUFA, DUFA) except ω-3 FA | -CH3 | 0.80–0.91 (t) |
| ω-3 PUFAs | -CH3 | 0.98 (t) |
| All fatty acids | -(CH2)n- | 1.22–1.34 (m) |
| All fatty chains except DHA and EPA | COOCH2CH2- | 1.57–1.66 (m) |
| EPA | COOCH2CH2- | 1.67–1.74 (m) |
| All fatty acids except DHA | -CH=CH-CH2- | 1.99–2.17 (m) |
| All fatty acids except DHA | COOCH2- | 2.27–2.32 (t) |
| DHA | COOCH2CH2- | 2.38 (dd) |
| DUFA/PUFA | -CH=CH-CH2--CH=CH- | 2.77 (t) |
| PUFA (DHA, EPA) | -CH=CH-CH2--CH=CH- | 2.80–2.85 (t) |
| PE | -CH2-N | 3.03 (s) |
| PC and Sphingolipids | -(CH3)3-N | 3.22 (overlapped s) |
| TG | -CH2- (sn-1,3) | 4.11–4.14 (dd) |
| -CH- (sn-2) | 5.24 (m) | |
| All MUFAs, DUFAs, PUFAs | -CH=CH- | 5.28–5.43 (m) |
| 1,2-DAGs | -CH- | 5.26–5.13 (m) |
| -CH2- | 4.28–4.12 (m) | |
| Homarine | -C3H- | 8.61 (d) |
| -C5H- | 8.44 (dd) | |
| -C6H- | 8.09 (d) | |
| C4H- | 7.85 (dd) |
| Compound | Assignment | 1H (ppm, Multiplicity) |
|---|---|---|
| Leucine a | -CH3 | 0.96 (d) |
| -CH- | 1.70 (m) | |
| Isoleucine a | -CH3 | 1.01 (d) |
| -CH- | 1.97 (m) | |
| Valine a | -CH3 | 1.05 (d) |
| -CH- | 2.29 (m) | |
| Lactate | -CH3 | 1.33 (d) |
| -CH- | 4.16 (q) | |
| Threonine a | -CH3 | 1.33 (d) |
| -CH- | 3.68 (m) | |
| -CH- | 4.29 (m) | |
| Alanine | -CH3 | 1.48 (d) |
| -CH- | 3.79 (m) | |
| Acetate | CH3 | 1.92 (s) |
| Proline | -CH2- | 2.1–2 (m) |
| -CH2- | 2.32–2.36 (m) | |
| -CH2- | 3.3–3.4 (m) | |
| -CH- | 4.10–4.14 (m) | |
| Glutamate | -CH2- | 2.07 (m) |
| -CH2- | 2.36 (m) | |
| Succinate | -CH2- | 2.41 (s) |
| β-Alanine | -CH2- | 2.56 (t) |
| -CH2- | 3.20 (t) | |
| Hypotaurine | -CH2NH | 3.27 (s) |
| -CH2SO3 | 3.90 (s) | |
| Unknown | 2.73 | |
| 3.45 | ||
| Unknown | 2.92 | |
| 4.7 | ||
| Betaine | -N(CH3)3 | 3.27 (s) |
| -CH2- | 3.90 (s) | |
| TMAO | N(CH3) | 3.27 (s) |
| Taurine | -CH2NH | 3.27 (t) |
| -CH2SO3 | 3.41 (t) | |
| Glycine | -CH | 3.57 (s) |
| Homarine | -N(CH3)3 | 4.37 (s) |
| -C4H- | 7.97 (dd) | |
| -C6H- | 8.04 (d) | |
| -C5H- | 8.55 (dd) | |
| -C3H- | 8.71 (d) | |
| Tyrosine | -C3,5H- ring | 6.90 (d) |
| -C2,6H- ring | 7.19 (d) | |
| Trigonelline | -C4H- | 8.08 (dd) |
| -C3H- and -C5H- | 8.84 (dd) | |
| -C2H- | 9.13 (s) | |
| Formate | -CH | 8.46 (s) |
© 2020 by the authors. Licensee MDPI, Basel, Switzerland. This article is an open access article distributed under the terms and conditions of the Creative Commons Attribution (CC BY) license (http://creativecommons.org/licenses/by/4.0/).
Share and Cite
Angilè, F.; Del Coco, L.; Girelli, C.R.; Basso, L.; Rizzo, L.; Piraino, S.; Stabili, L.; Fanizzi, F.P. 1H NMR Metabolic Profile of Scyphomedusa Rhizostoma pulmo (Scyphozoa, Cnidaria) in Female Gonads and Somatic Tissues: Preliminary Results. Molecules 2020, 25, 806. https://doi.org/10.3390/molecules25040806
Angilè F, Del Coco L, Girelli CR, Basso L, Rizzo L, Piraino S, Stabili L, Fanizzi FP. 1H NMR Metabolic Profile of Scyphomedusa Rhizostoma pulmo (Scyphozoa, Cnidaria) in Female Gonads and Somatic Tissues: Preliminary Results. Molecules. 2020; 25(4):806. https://doi.org/10.3390/molecules25040806
Chicago/Turabian StyleAngilè, Federica, Laura Del Coco, Chiara Roberta Girelli, Lorena Basso, Lucia Rizzo, Stefano Piraino, Loredana Stabili, and Francesco Paolo Fanizzi. 2020. "1H NMR Metabolic Profile of Scyphomedusa Rhizostoma pulmo (Scyphozoa, Cnidaria) in Female Gonads and Somatic Tissues: Preliminary Results" Molecules 25, no. 4: 806. https://doi.org/10.3390/molecules25040806
APA StyleAngilè, F., Del Coco, L., Girelli, C. R., Basso, L., Rizzo, L., Piraino, S., Stabili, L., & Fanizzi, F. P. (2020). 1H NMR Metabolic Profile of Scyphomedusa Rhizostoma pulmo (Scyphozoa, Cnidaria) in Female Gonads and Somatic Tissues: Preliminary Results. Molecules, 25(4), 806. https://doi.org/10.3390/molecules25040806