Article

The Effect of Mg, Fe(II), and Al Doping on CH4: Adsorption and Diffusion on the Surface of Na-Kaolinite (001) by Molecular Simulations

1
College of Mining Engineering, Taiyuan University of Technology, Taiyuan 030024, China
2
Key Laboratory of In-Situ Property-Improving Mining of the Ministry of Education, Taiyuan University of Technology, Taiyuan 030024, China
*
Author to whom correspondence should be addressed.
Molecules 2020, 25(4), 1001; https://doi.org/10.3390/molecules25041001
Submission received: 18 January 2020 / Revised: 21 February 2020 / Accepted: 21 February 2020 / Published: 24 February 2020
(This article belongs to the Section Computational and Theoretical Chemistry)

Abstract

:
Because kaolinite includes a large range of defect elements, the effects of Mg, Fe(II), and Al doping on the CH4 adsorption and diffusion on the surface of Na-kaolinite (001) were investigated by molecular simulations. The simulation results illustrate that ion doping can significantly reduce the amount of CH4 adsorbed by kaolinite, but the type of doped ions has little effect on the amount of adsorption. The specific surface area of kaolinite and the interaction energy between CH4 and the kaolinite’s surface are two key factors that can determine CH4 adsorption capacity. The first peak value of the radial distribution functions (RDFs) between CH4 and the pure kaolinite is larger than that between Mg-, Fe(II)-, and Al-doped kaolinite, which indicates that ion doping can reduce the strength of the interactions between CH4 and the kaolinite’s surface. Besides hydrogen and oxygen atoms, interlayer sodium ions are also strong adsorption sites for CH4 and lead to a weakened interaction between CH4 and the kaolinite’s surface, as well as a decrease in CH4 adsorption. Contrary to the adsorption results, ion doping facilitates the diffusion of CH4, which is beneficial for actual shale gas extraction.

1. Introduction

Presently, as a promising clean energy source, shale gas has become a global research hot spot. [1,2,3]. The United States has 7.2 billion cubic meters of shale gas, while China has 3.6 billion cubic meters and Mexico has about 15.4 trillion cubic meters [4]. Shale is composed of organic matter and inorganic matter. In addition to organic matter, clay minerals have also proven to be another major factor in determining CH4 adsorption and diffusion [5]. Therefore, studying the interactions between CH4 and clay minerals is necessary for researchers in the field of shale gas.
Clay minerals include many types, such as montmorillonites, illites, kaolinites, etc. In recent years, due to China having richest kaolinite content worldwide [6,7], some studies have been conducted on kaolinite’s interactions with CH4. Ji et al. [8] experimentally investigated the sorption isotherms, heat of adsorption, and standard entropy of CH4 in kaolinite and found that the CH4 sorption isotherms at different temperatures can be fitted well by the Langmuir function; the heat of adsorption is 9.6 kJ/mol, and the standard entropy of CH4 in kaolinite is −65.3 J/mol. Liu et al. [9] studied the CH4 adsorption capacity and mechanism of kaolinite at 60 °C and at pressures up to 18.0 MPa, finding that the Langmuir maximum adsorption capacity was 3.88 cm3/g. In addition to experiments, Zhang et al. [10,11,12] used a molecular simulation to systematically study the interactions between CH4 and kaolinite and explained the mechanism of CH4 adsorption and diffusion from a microscopic perspective.
However, as indicated by Hinckley, with indexes ranging from 1.44 to 0.18, nature kaolinite includes a large range of defect elements [13]. The primary contaminant cations are Mg, Fe(II), and Al, whose concentration ranges are 0.07–0.71 wt%, 0.14–0.54 wt%, and 0.07–0.31 wt%, respectively [14]. Molecular simulation is an effective tool that can determine the adsorption properties of complex and complicated systems under a few extreme conditions [15], such as the influence of cations where experiments are difficult to implement. Mignon et al. [16] used molecular dynamics to study the influence of isomorphic substitution on the hydration/adsorption behavior during the swelling process of montmorillonite. However, to our knowledge, the influences of Mg, Fe(II), and Al doping on the interaction between CH4 and kaolinite have not yet been determined.
Thus, in this paper, the molecular simulation method was utilized to investigate the effects of Mg doping, Fe(II) doping, and Al doping on CH4 adsorption and diffusion on Na-kaolinite’s (001) surface. We expected that this research will not only offer a deeper understanding of the adsorption and diffusion properties of the pure, Mg-doped, Fe(II)-doped, and Al-doped kaolinite but will also serve as a foundation for further studies on CH4 storage and exploration in shale reservoirs.

2. Simulation Details
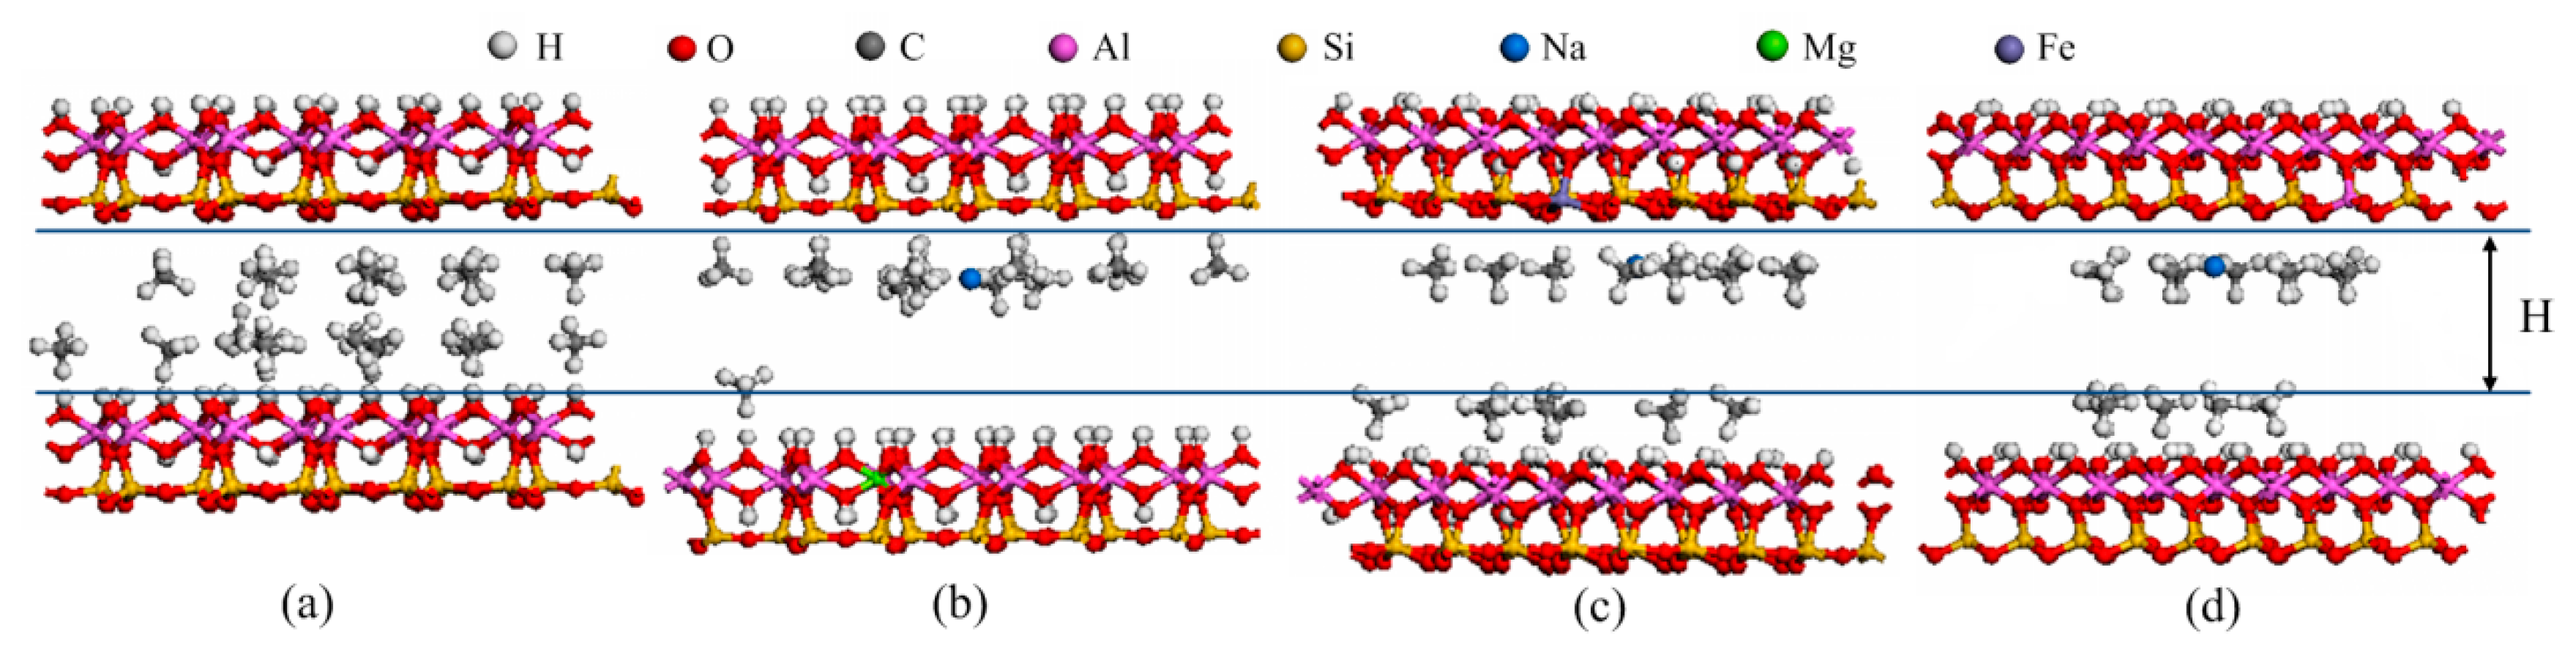
2.1. Models

Kaolinite is one of the most abundant clay minerals in the world. A structural model and supercell model of kaolinite, as well as an all-atom model of CH4, were successfully built and applied in a previous study [17], as shown in Figure 1.
Based on the supercell model of kaolinite and the nature isomorphic substitution in kaolinite, doped kaolinite models, where the Mg, Fe(II), and Al concentrations are as low as 0.184 mol%, were built in two different ways. To build the Mg-, Ca-doped kaolinite models, we substituted 1 Al3+ with Mg2+/Fe2+ every 64 Al3+ in the aluminum octahedron layer in the same location [18]. However, to build the Al-doped kaolinite model, we substituted 1 Si4+ with Al3+ every 64 Si4+ in the silicon–oxygen tetrahedron layer [19]. The negative charge caused by lattice substitution is compensated by interlayer Na+ [20].

2.2. Grand Canonical Monte Carlo Simulation

The Grand Canonical Monte Carlo simulation (GCMC) has been identified as one of the most effective ways to study gas adsorption behaviors [21,22]. Therefore, GCMC also used in this article. In CGMC, fugacity is often calculated by the Peng–Robinson equation of state to reflect the effective pressure of the gas [23]. The Lennard–Jones equation, with a cut-off radius of 0.72 nm [24,25], was used to calculate the van der Waals interactions between the kaolinite atoms and CH4. The long-range electrostatic interactions and Coulomb interactions were both obtained by three-dimensional Ewald methods, with the accuracy of 4.186 × 10³ kJ/mol [26]. The Dreiding force field [27] was utilized to reflect the atoms’ LJ parameters and charges. Moreover, we applied energy changes to decide whether the CH4 molecule is accepted, rejected, or displaced in the output via the Metropolis arithmetic rule [28]. The periodic boundary condition was selected for operation. Then, for each study, a total of 1 × 10⁷ configurations were output, half of which were utilized for the system to reach equilibrium, while the other half were utilized for production. Finally, these configurations were applied as the initial models for molecular dynamics (MD) simulations [29].

2.3. Molecular Dynamic Simulation

First, the initial configurations of the MD simulations (the final configurations of the GCMC simulation) are minimized by the conjugate gradient and the steepest descent method [21]. Then, 5 ns NVT (T = 293.15 K) MD simulations (1.0 fs time step) were used to reach an equilibrium state. Finally, 5 ns NPT MD simulations (1.0 fs time step) were used to calculate the diffusion coefficients and radial distribution function (RDF). These MD simulations were also applied according to the Dreiding force field and the Velocity Verlet algorithm integrations [30]. The above simulations all conducted by the Sorption and Forcite modules of the Materials Studio package [31].

3. Results and Discussion

We compared the results of our previous studies with experimental data from multiple simulation factors, such as adsorption isotherms, lattice vectors, pore volumes, and diffusion coefficients [11,12]. These data verify that the force field and model utilized in this paper can continue to be used to study the adsorption and diffusion of CH4 in kaolinite by ion doping.

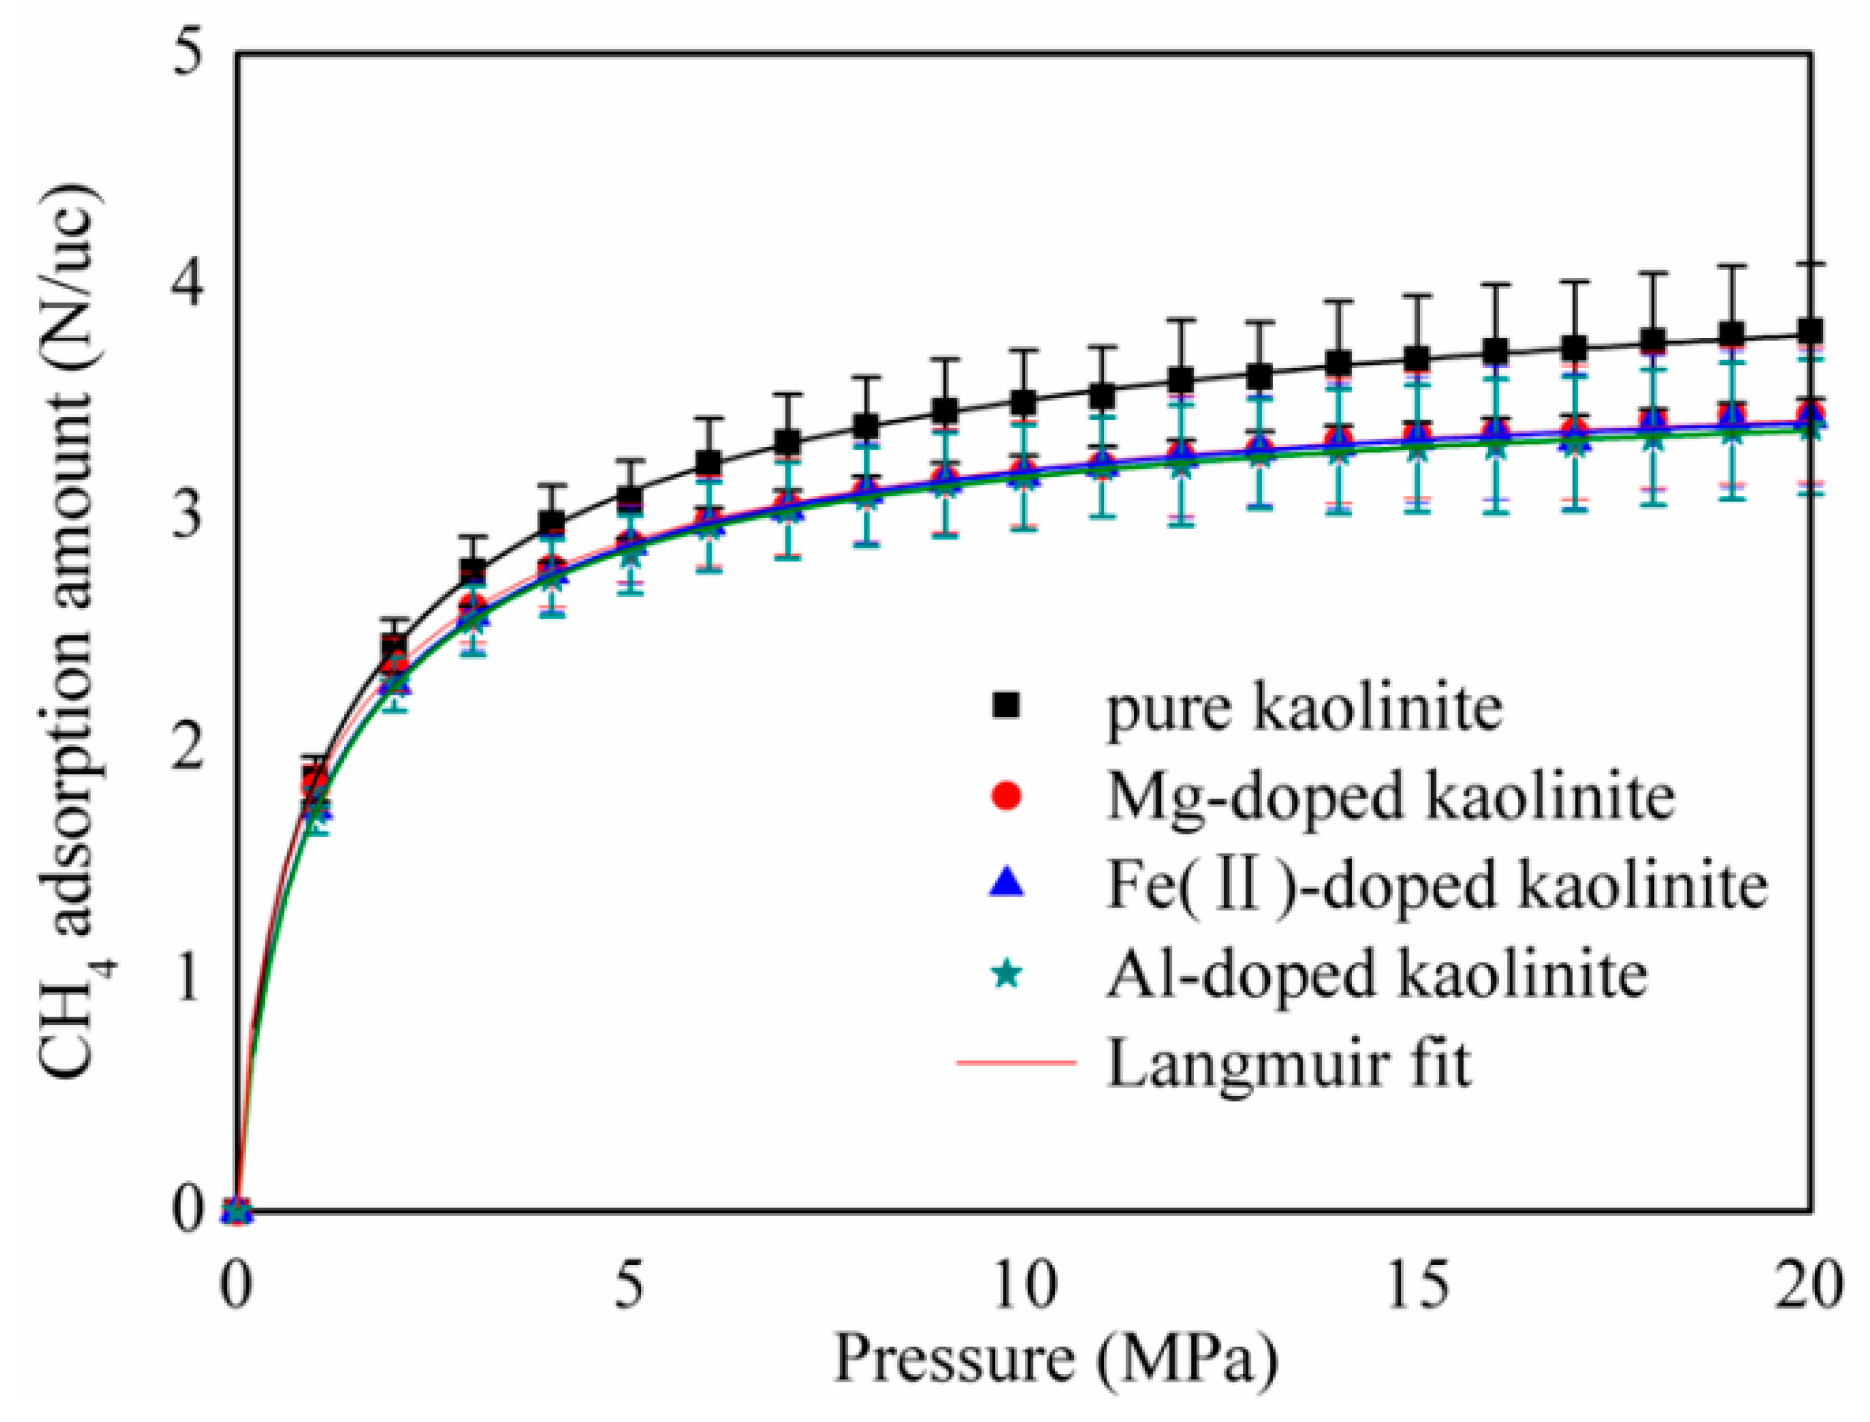
3.1. CH4 Adsorption Amount

Figure 2 shows the absolute adsorption amount of CH4 on pure and Mg, Fe(II), and Al-doped kaolinite at a temperature of 293.15 K up to 20 MPa. The results illustrate that, under the same pressure and temperature conditions, ion doping can significantly reduce the amount of CH4 adsorbed by kaolinite. However, the type of doped ions has little effect on the amount of adsorption. In order to fit the absolute rate, the Langmuir model [32] was utilized to analyze the simulated rate. The Langmuir model can be displayed as follows:
N = N L P ( P L + P )
where N is the absolute adsorption capacity of the CH4 in molecules/unit cell; NL is the Maximum adsorption capacity of the CH4 in molecules/unit cell; PL is the Langmuir pressure (MPa); and P is the present pressure in MPa. This model has been identified as one of the most effective ways to study gas adsorption behaviors, from macroscopic to microscopic [33].
Table 1 lists the Langmuir constants obtained by fitting the Langmuir model to the absolute adsorption amount of CH4 on pure and Mg-, Fe(II)-, and Al-doped kaolinite at 293.15 K. From Table 1, we can see that the saturated adsorption of CH4 on the surface of the pure kaolinite is significantly larger than that after doping. However, the type of doped ions has also little effect on the saturated adsorption of CH4 on the surface of the kaolinite. In addition, the Langmuir pressure PL can reflect the affinity of the absorbent for CH4 and the feasibility of CH4 desorption under the reservoir pressure. A lower PL value indicates that CH4 is more easily adsorbed and that desorption is more difficult to achieve. The CH4 Langmuir pressure of the doped kaolinite also becomes larger, which indicates that doping ions may improve the desorption efficiency of CH4.

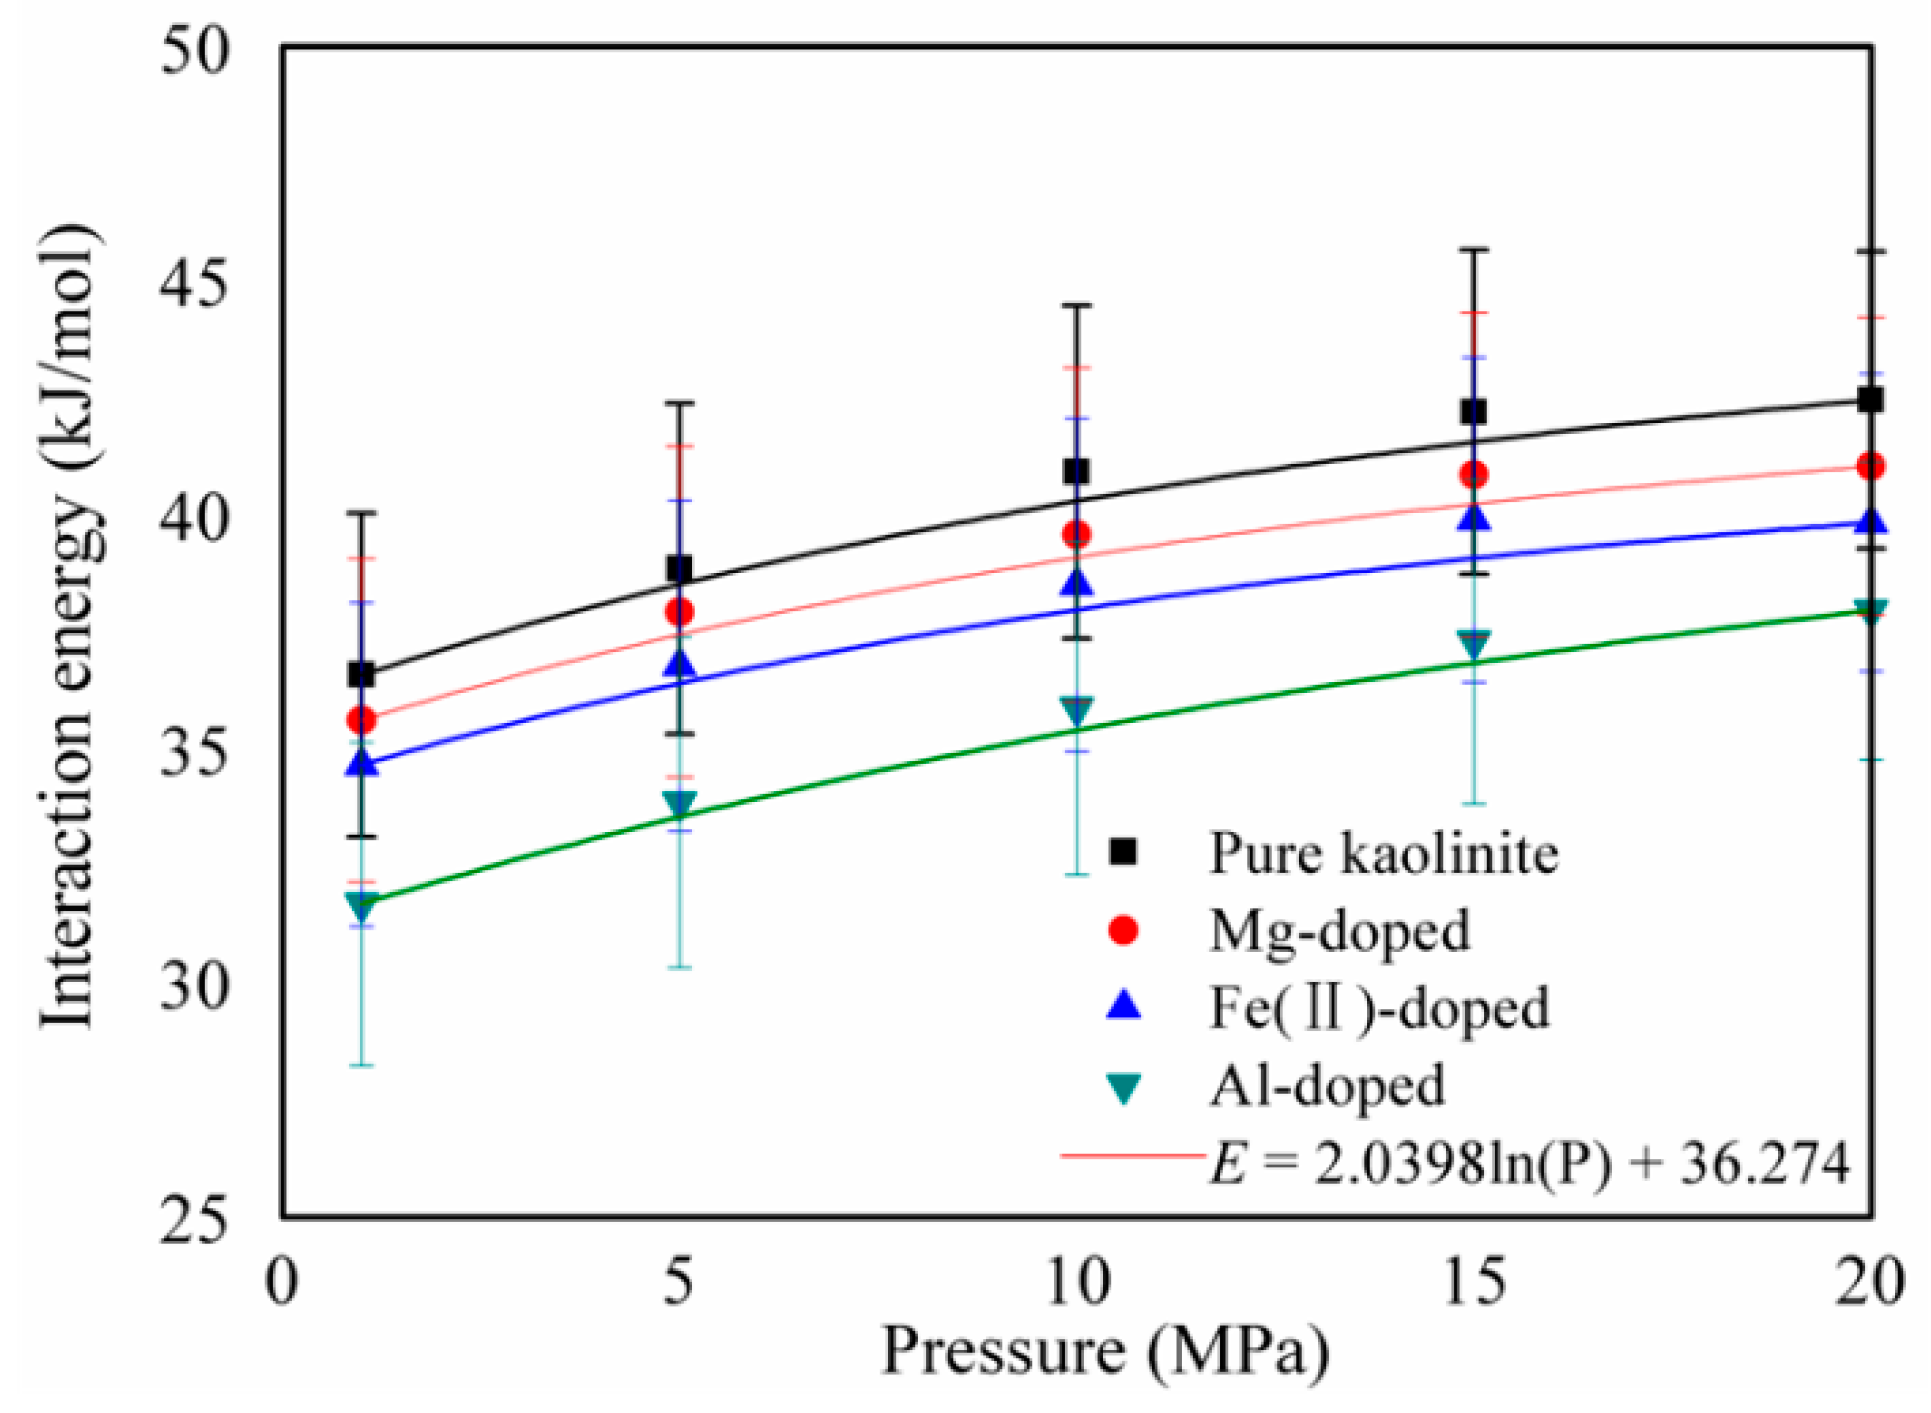
3.2. Specific Surface Area and Interaction Energy

According to the studies of Frost et al. [34], Sui and Yao [35], Thomas [36], and Zhang et al. [10], the specific surface area and interaction energy can determine the adsorption capacity of the adsorbate on the adsorbent. This is because the former can determine the adsorption space and the latter can determine the adsorption strength. Thus, in this research, we also used these two key parameters to analyze the effect of ion doping on the adsorption mechanism of CH4 on the surface of kaolinite.
The Connolly surface area was used to reflect the specific surface area of kaolinite, which has been widely used in molecular simulation studies [37,38]. The Connolly surface area is the area traced out by the contact surface of the probe molecule as it freely rolls over the kaolinite. This is also called the solvent accessible area [39]. We used the non-adsorbed helium gas as the probe molecule, with a van der Waals radius of 1.0 Å.
Figure 3 shows the histogram of the specific surface area of pure and Mg-, Fe(II)-, and Al-doped kaolinite. The data show that ion doping can significantly reduce the specific surface area of kaolinite. The specific surface area of pure kaolinite and Mg-doped, Fe(II)-doped, and Al-doped kaolinite were 2026.37, 1829.12, 1829.13, and 1828.98 m2/g, respectively. Compared to pure kaolinite, the specific surface area of the kaolinite after ion doping reduces by approximately 9.69%. Interestingly, the effect of ion type on the specific surface area of the kaolinite is not significant.
The interaction energies between CH4 and pure and Mg-, Fe(II)-, and Al-doped kaolinite were obtained by
E int e r a c t i o n = E C H 4 k a o l i n i t e ( E C H 4 + E k a o l i n i t e ) .
where ECH4−kaolinite is the energy of CH4 and the pure and Mg-, Fe(II)-, and Al-doped kaolinite complex; ECH4 and Ekaolinite are the energies of CH4 and the pure and Mg-, Fe(II)-, and Al-doped kaolinite isolates, which were obtained from a single point [40,41]. Figure 4 displays the interaction energies of CH4 adsorption on pure and Mg-, Fe(II)-, and Al-doped kaolinite at different pressures. The results show that the interaction energy of CH4 adsorption on pure and doped kaolinite all increased logarithmically with increasing pressure according to E = 2.0398ln(p) + 36.274. Under the same pressure conditions, the interaction energy between CH4 and pure kaolinite is larger than the interaction energy between CH4 and Mg-, Fe(II)-, and Al-doped kaolinite. In addition to the specific surface area, this is another reason CH4 adsorbs more on the surface of pure kaolinite than on the surface of doped kaolinite. In terms of the interaction energy with CH4, pure kaolinite > Mg-doped kaolinite > Fe(II)-doped kaolinite > Al-doped kaolinite. This observation is consistent with the CH4 adsorption shown in Figure 2.

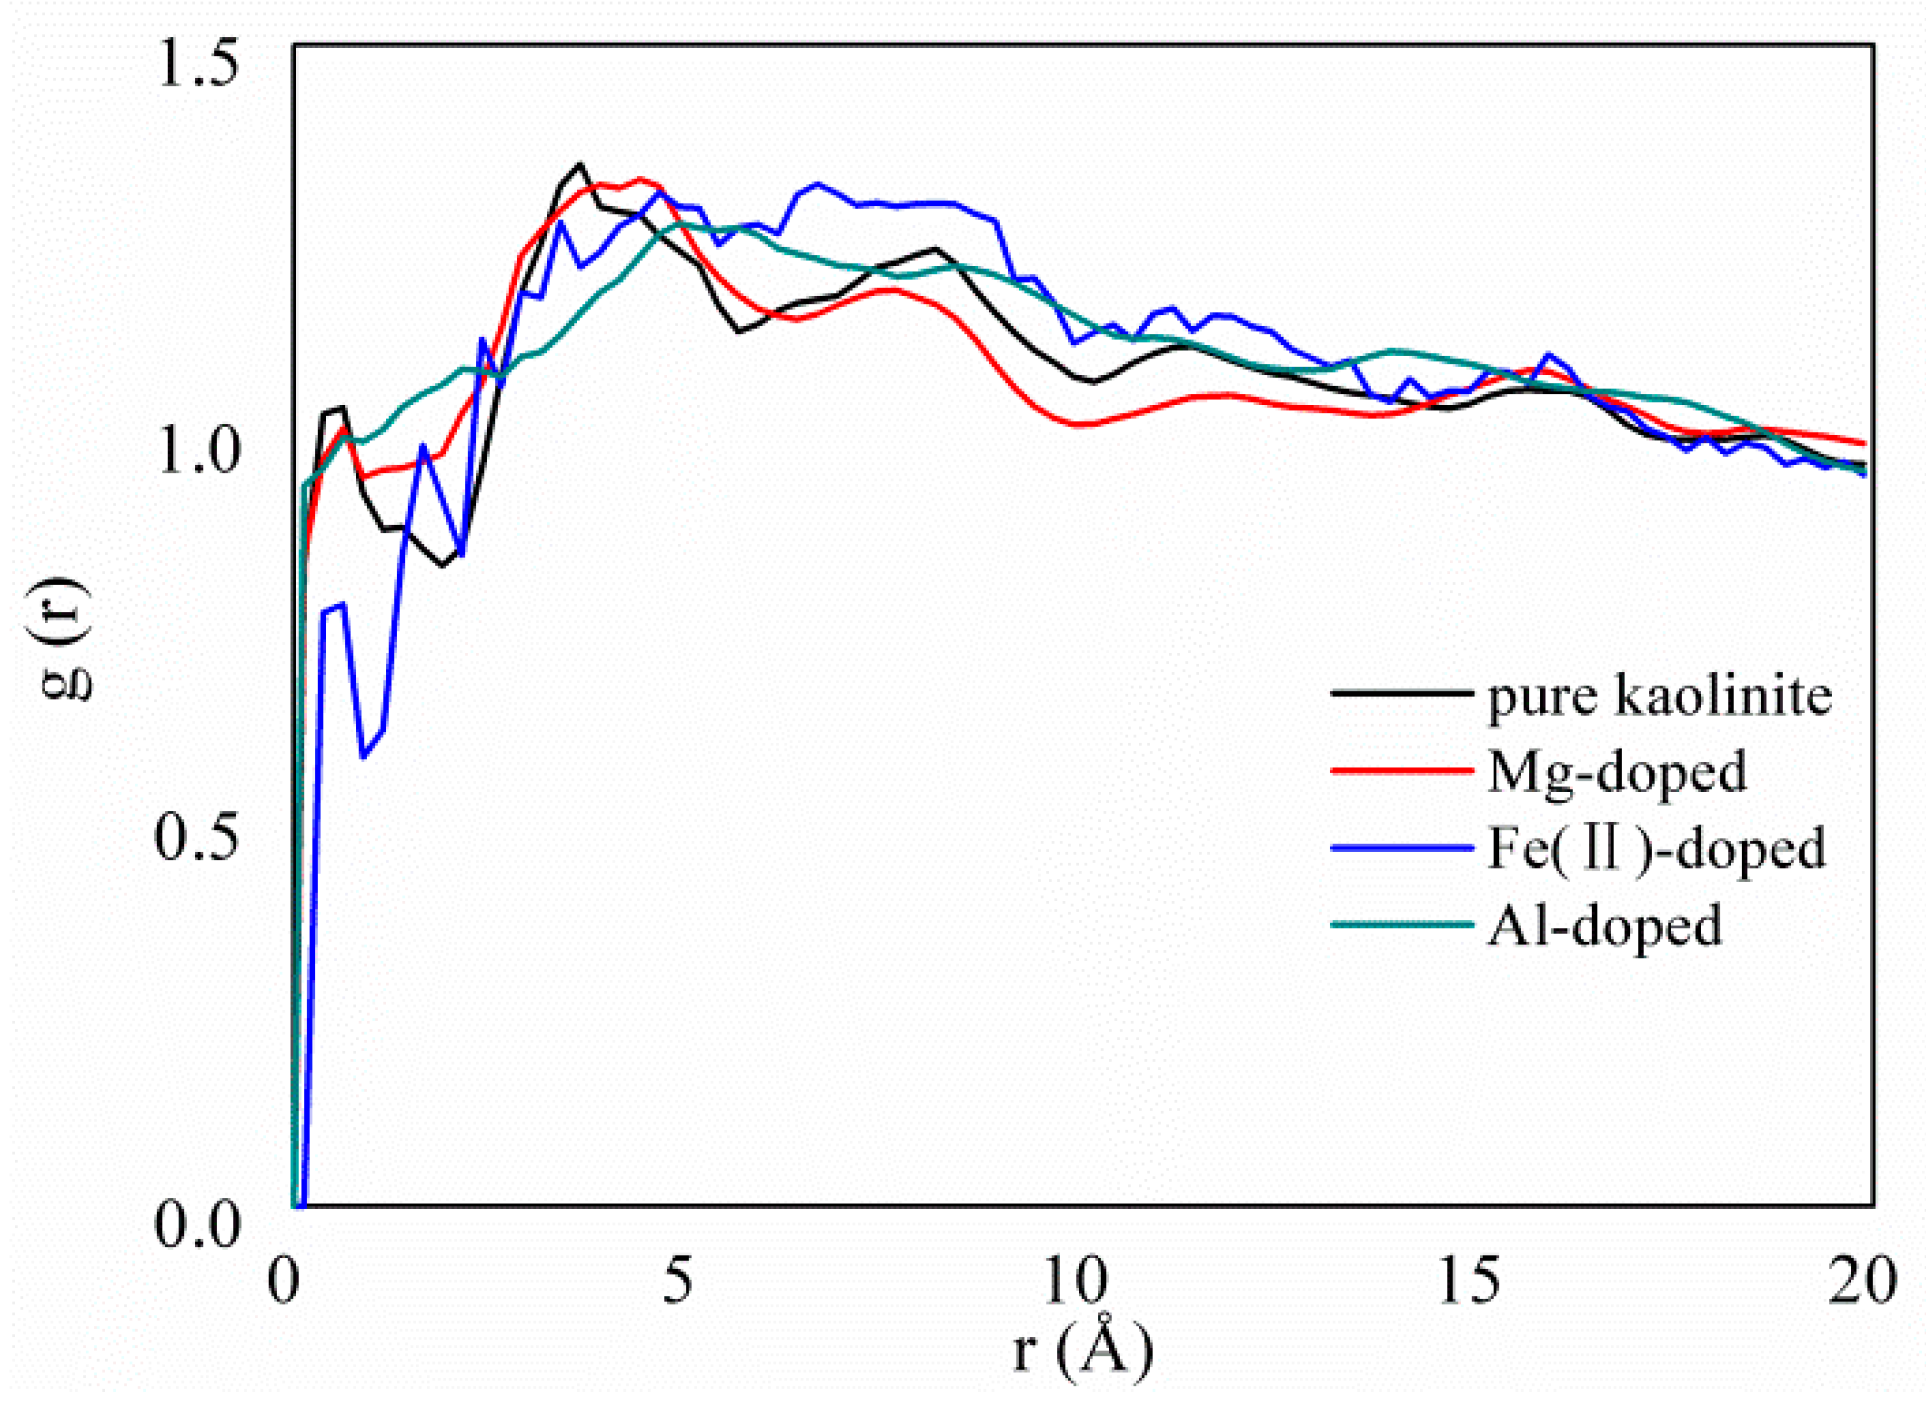
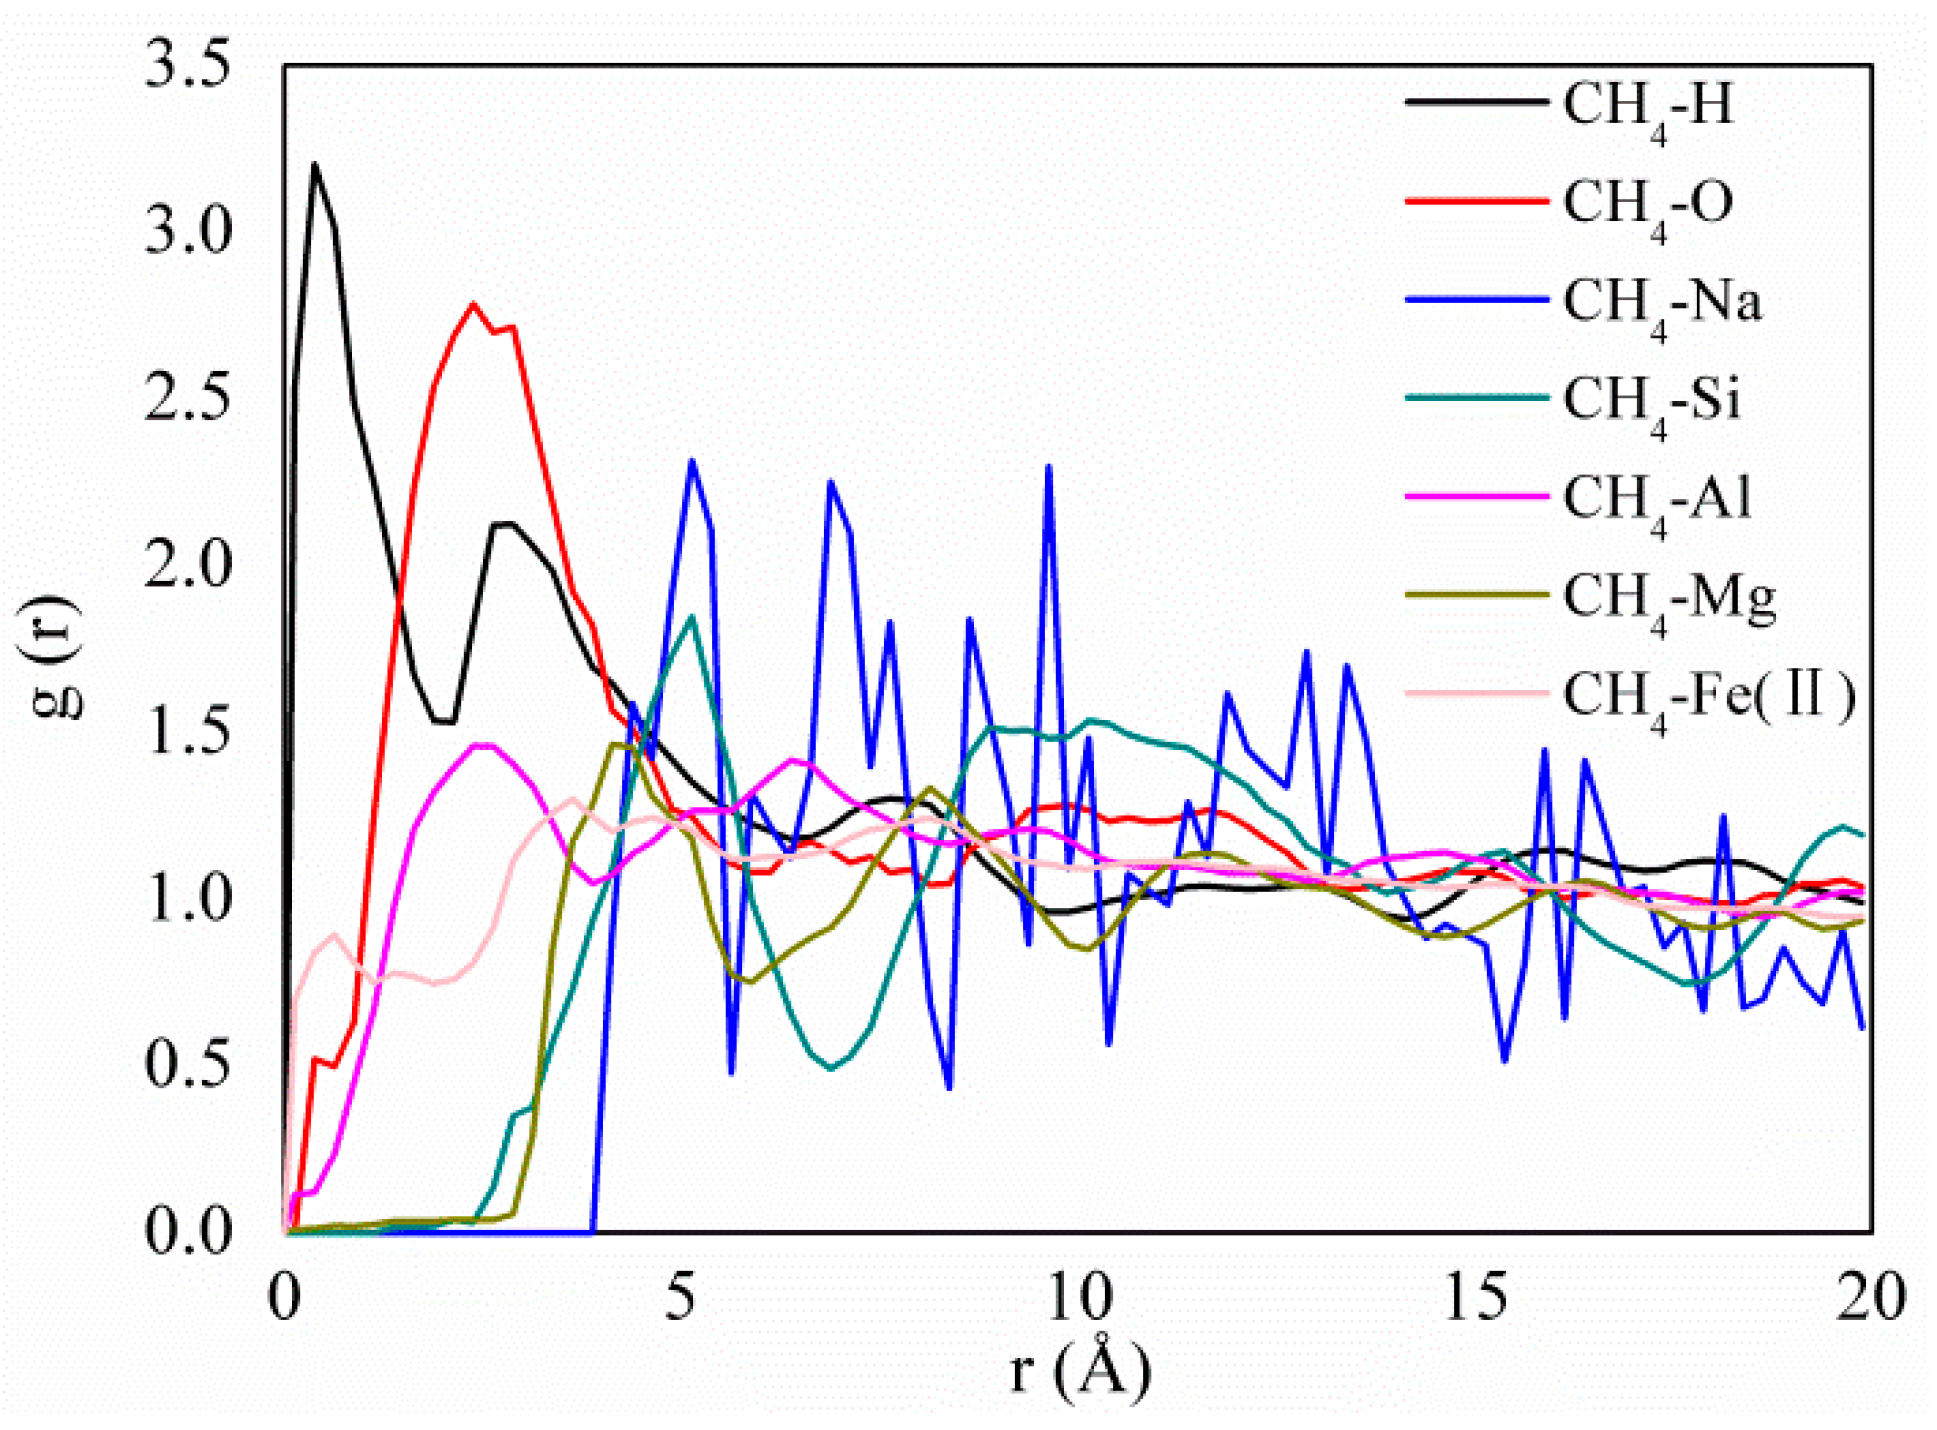
3.3. Adsorption Strength and Adsorption Site

There are numerous studies that have successfully used radial distribution functions (RDFs) to analyze the adsorption strength and adsorption sites of adsorbates on adsorbents [42,43,44,45]. In this study, RDFs were used to analyze the adsorption strength and adsorption site between CH4 and atoms of pure and doped kaolinite.
Figure 5 shows the radial distribution functions (RDFs) between CH4 and the pure, Mg-, Fe(II)-, and Al-doped kaolinite surface at 293.15 K and 20 MPa. For greater clarity, the first peak portion has been partially enlarged. The results show that the first peak values are 1.35, 1.33, 1.31, and 1.27 with an adsorption distance of 3.624, 4.375, 4.625, and 4.875 Å, corresponding to the pure, Mg-doped, Fe(II), and Al-doped kaolinite surface, respectively. This illustrates that it is 1.35, 1.32, 1.31, and 1.30 times more likely that CH4 would be adsorbed at this separation. The first peak value between CH4 and the pure kaolinite is larger than that between the Mg-, Fe(II)-, and Al-doped kaolinite, which indicates that ion doping can reduce the strength of the interactions between the CH4 and kaolinite surfaces. This is consistent with the conclusions in Figure 4. There are some uncertainties in the simulation results, which are mainly related to the hardness of the potential repulsion nucleus between the kaolinite molecules and the CH4 molecules [46].
Figure 6 displays the RDFs between the CH4 and the different atoms of pure and doped kaolinite. The results show that the first peaks of RDFs between the CH4 and H atoms and between CH4 and O atoms are sharper and stronger than those between the CH4 and Si atoms, between the CH4 and Al atoms, between the CH4 and Mg atoms, and between the CH4 and Fe(II) atoms in the kaolinite. This illustrates that the hydrogen and oxygen atoms of kaolinite are a strong adsorption site for CH4, which is consistent with the results of our previous study [11]. Interestingly, in addition to hydrogen and oxygen atoms, CH4 can strongly adsorb at the sites of the sodium atoms between the two surfaces of kaolinite, as shown in Figure 7. Figure 7 shows snapshots of CH4 adsorption in pure, Mg-doped, Fe(II)–doped, and Al-doped kaolinite. It can be clearly seen that, after ion doping, CH4 is strongly adsorbed around sodium ions and has a larger pore size change. After doping, the overall structure of kaolinite will be negatively charged, so sodium ions are used for compensation [20]. Thus, the structural formula of kaolinite has changed, which can cause an increase in the basal spacing of kaolinite [47,48]. This will lead to weakened interactions between the CH4 and kaolinite surfaces and a decrease in CH4 adsorption.

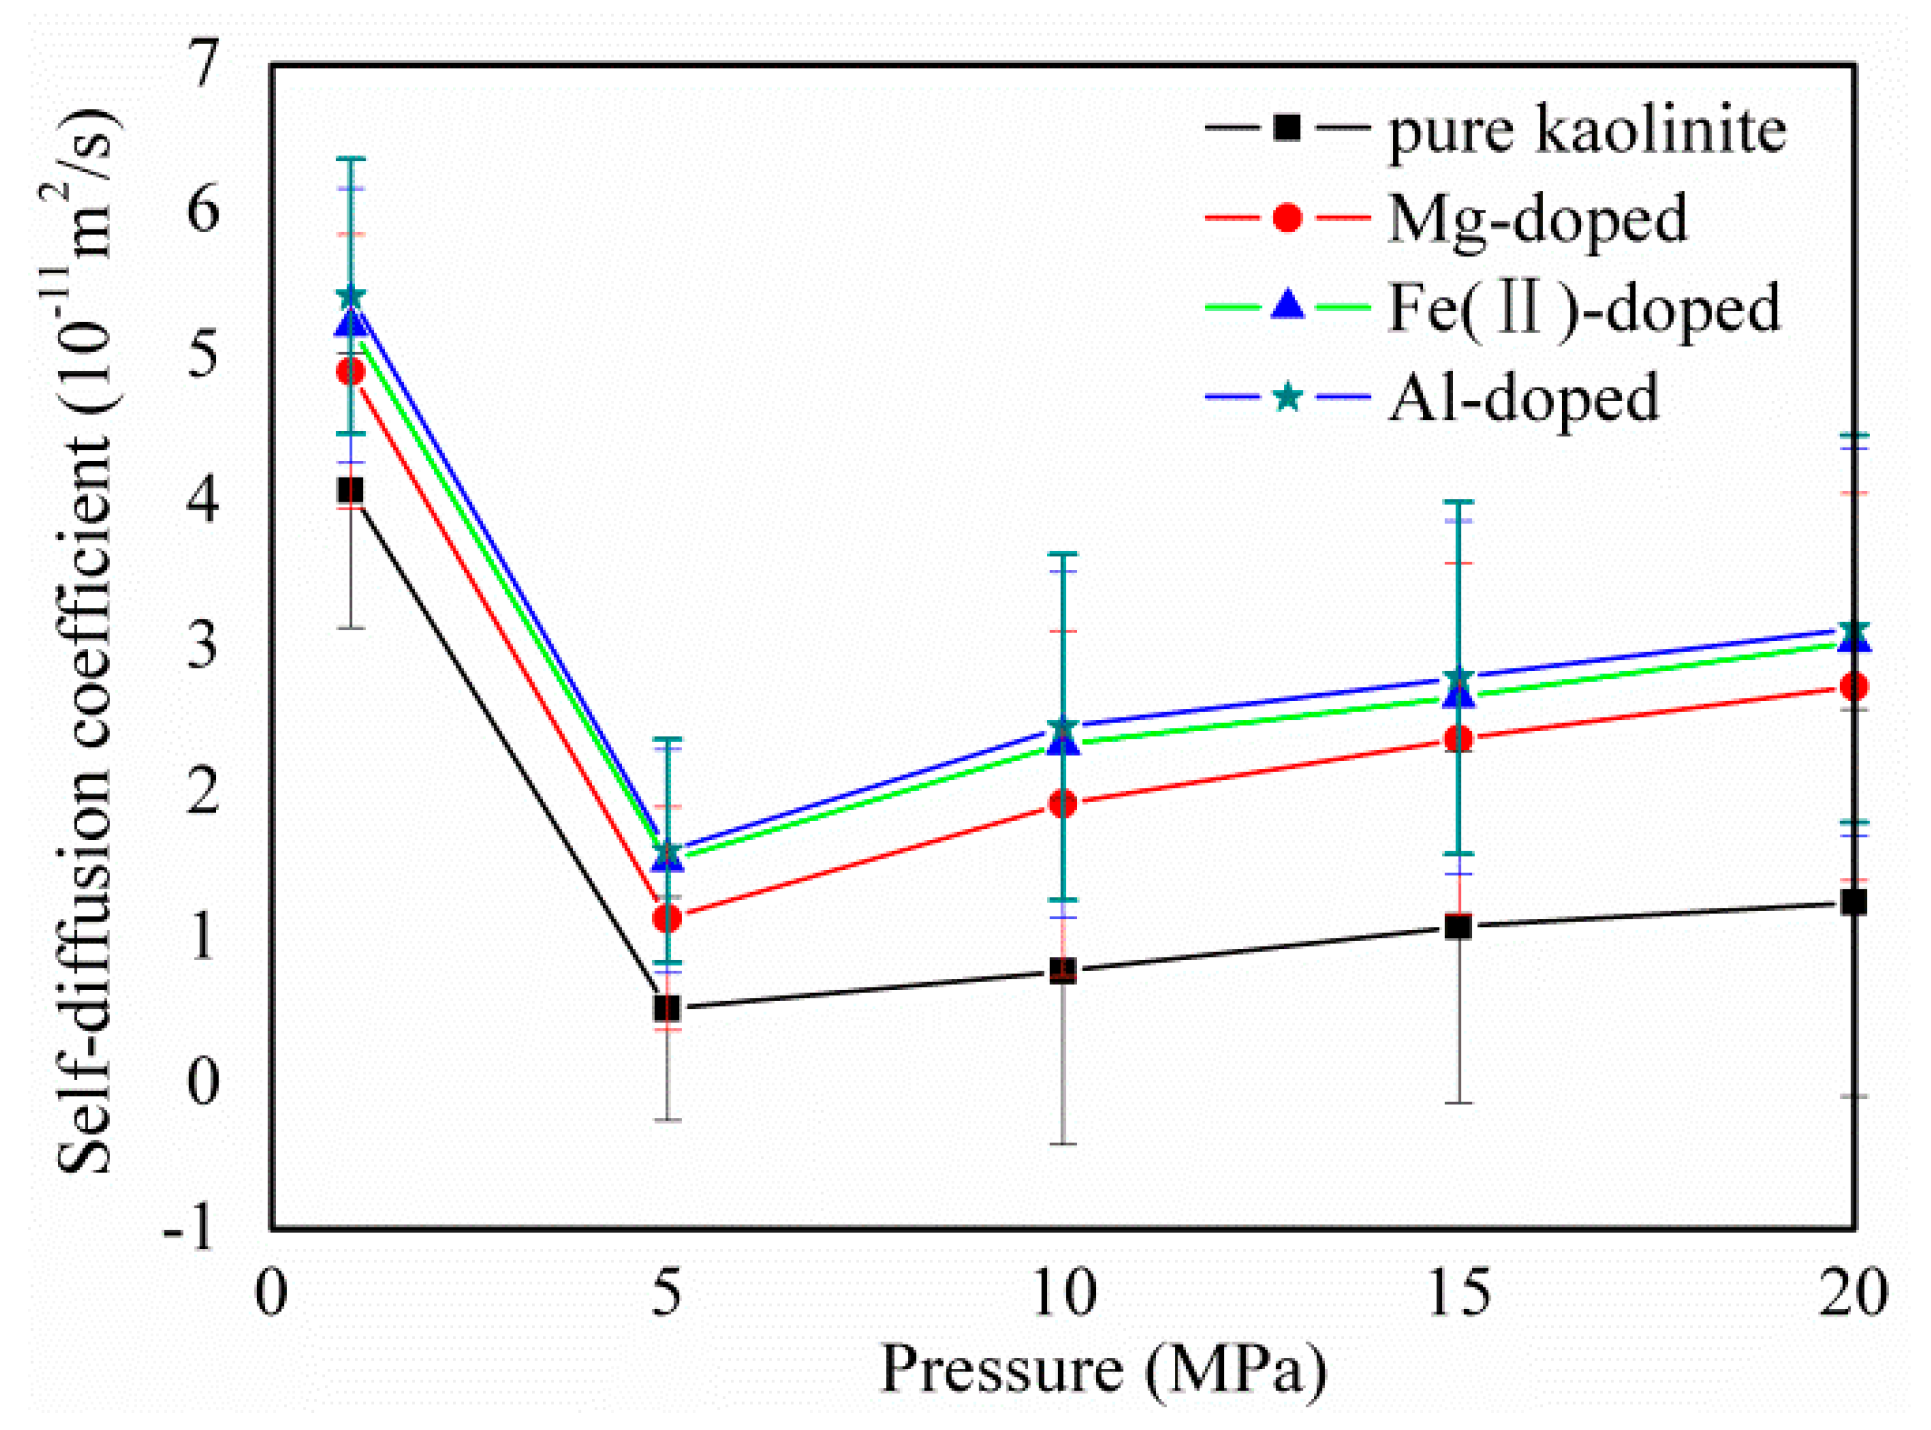
3.4. CH4 diffusion Coefficients

The Einstein diffusion law [49] was used to calculate the CH4 diffusion coefficients on the pure and Mg-, Fe(II)-, and Al-doped kaolinite by averaging the mean squared displacement (MSD) of a single molecule over time:
D s = 1 6 N lim t d d t t = 1 N [ r i ( t ) r 0 ( t ) ] 2 .
where denotes the number of the overall average properties, N is the amount of diffusion molecules, and ri (t) is the distance vector of the ith molecule at time t.
Figure 8 displays the self-diffusion coefficients of CH4 on pure and Mg, Fe(II), and Al-doped kaolinite at different pressures. With an increase in pressure, the diffusion coefficient decreases sharply and then increases slowly. This is the result of a combination of mechanical compression and swelling caused by the adsorption of CH4 [50]. It is interesting that the diffusion coefficient of CH4 after doping is larger than that of pure kaolinite. This is due to the fact that ion doping can increase the pore size of kaolinite, which can further affect the CH4 diffusion coefficient. The CH4 diffusion coefficient increased exponentially with the pore size [12]. This means that ion doping facilitates the diffusion of CH4, which is beneficial for actual shale gas extraction.

4. Conclusions

Molecular simulations were utilized to investigate the CH4 adsorption and diffusion in pure and Mg-, Fe(II)-, and Al-doped kaolinite. The results demonstrate that the saturated adsorption of CH4 on the surface of pure kaolinite is significantly larger than that after doping. In terms of the relative CH4 sorption capacity, pure kaolinite > Mg-doped kaolinite > Fe(II)-doped kaolinite > Al-doped kaolinite. Compared with pure kaolinite, the specific surface area of kaolinite after ion doping is reduced by approximately 9.69%. The interaction energies of CH4 adsorption on the pure and doped kaolinite all increased logarithmically with an increase in pressure according to E = 2.0398ln(p) + 36.274. The first peak value between CH4 and the pure kaolinite is larger than that between the Mg-, Fe(II)-, and Al-doped kaolinite, which indicates that ion doping can reduce the strength of the interactions between CH4 and the kaolinite’s surface. The diffusion coefficient of CH4 after doping is larger than that of pure kaolinite. This means that ion doping facilitates the diffusion of CH4, which is beneficial for actual shale gas extraction. Molecular simulations are thus an efficient means to investigate the influence of ion doping on gas adsorption and diffusion characteristics.

Author Contributions

Project administration, B.Z.; software, T.K.; writing—original draft preparation, B.Z. and K.W.; writing—review and editing, B.Z.; funding acquisition, T.K., K.W. and B.Z. All authors have read and agreed to the published version of the manuscript.

Funding

This research was supported financially by the National Natural Science Foundation of China (U1810102, 51974194) and the Applied Basic Research Program of Shanxi Province (201901D211033).

Acknowledgments

The use of the Materials Studio software package, which was supported by the Key Laboratory of Coal Science and Technology of the Ministry of Education and Taiyuan University of Technology, is gratefully acknowledged.

Conflicts of Interest

The authors declare no conflict of interest.

References

  1. Vengosh, A.; Jackson, R.B.; Warner, N.; Darrah, T.H.; Kondash, A. A critical review of the risks to water resources from unconventional shale gas development and hydraulic fracturing in the United States. Environ. Sci. Technol. 2014, 48, 8334–8348. [Google Scholar] [CrossRef]
  2. Zou, C.; Dong, D.; Wang, S.; Li, J.; Li, X.; Wang, Y.; Li, D.; Cheng, K. Geological characteristics and resource potential of shale gas in China. Pet. Explor. Dev. 2010, 37, 641–653. [Google Scholar] [CrossRef]
  3. Weijermars, R. Economic appraisal of shale gas plays in continental Europe. Appl. Energy 2013, 106, 100–115. [Google Scholar] [CrossRef]
  4. Huo, R.; Duan, K.B. Conditions of Shale Gas Accumulation and Exploration Practices in China. Adv. Mater. Res. 2014, 978, 161–164. [Google Scholar] [CrossRef]
  5. Yuan, W.; Pan, Z.; Li, X.; Yang, Y.; Zhao, C.; Connell, L.D.; Li, S.; He, J. Experimental study and modelling of methane adsorption and diffusion in shale. Fuel 2014, 117, 509–519. [Google Scholar] [CrossRef]
  6. Zhao, L.; Ward, C.R.; French, D.; Graham, I.T.; Dai, S.; Yang, C.; Xie, P.; Zhang, S. Origin of a kaolinite-nh4-illite-pyrophyllite-chlorite assemblage in a marine-influenced anthracite and associated strata from the Jincheng coalfield, Qinshui basin, Northern China. Int. J. Coal Geol. 2018, 185, 61–78. [Google Scholar] [CrossRef]
  7. Cai, Y.; Liu, D.; Pan, Z.; Yao, Y.; Li, C. Mineral occurrence and its impact on fracture generation in selected Qinshui basin coals: An experimental perspective. Int. J. Coal Geol. 2015, 150, 35–50. [Google Scholar] [CrossRef]
  8. Ji, L.; Zhang, T.; Milliken, K.L.; Qu, J.; Zhang, X. Experimental investigation of main controls to methane adsorption in clay-rich rocks. Appl. Geochem. 2012, 27, 2533–2545. [Google Scholar] [CrossRef]
  9. Liu, D.; Yuan, P.; Liu, H.; Li, T.; Tan, D.; Yuan, W.; He, H. High-pressure adsorption of methane on Montmorillonite, Kaolinite and Illite. Appl. Clay Sci. 2013, 85, 25–30. [Google Scholar] [CrossRef]
  10. Zhang, B.; Kang, J.; Kang, T. Monte Carlo simulations of methane adsorption on kaolinite as a function of pore size. J. Nat. Gas Sci. Eng. 2018, 49, 410–416. [Google Scholar] [CrossRef]
  11. Zhang, B.; Kang, J.; Kang, T. Molecular simulation of methane adsorption and its effect on kaolinite swelling as functions of pressure and temperature. Mol. Simul. 2018, 44, 789–796. [Google Scholar] [CrossRef]
  12. Zhang, B.; Kai, W.; Kang, T.; Kang, G.; Zhao, G. Effect of the basal spacing on ch4 diffusion in kaolinite. Chem. Phys. Lett. 2019, 732, 136639. [Google Scholar] [CrossRef]
  13. Plançon, A.; Giese, R.; Snyder, R.; Drits, V.; Bookin, A. Stacking faults in the kaolin-group minerals: Defect structures of kaolinite. Clays Clay Miner. 1989, 37, 203–210. [Google Scholar] [CrossRef]
  14. Frost, R.L.; Horváth, E.; Makó, É.; Kristóf, J. Modification of low-and high-defect kaolinite surfaces: Implications for kaolinite mineral processing. J. Colloid Interface Sci. 2004, 270, 337–346. [Google Scholar] [CrossRef] [Green Version]
  15. Zhang, J.; Clennell, M.; Dewhurst, D.; Liu, K. Combined monte carlo and molecular dynamics simulation of methane adsorption on dry and moist coal. Fuel 2014, 122, 186–197. [Google Scholar] [CrossRef]
  16. Mignon, P.; Ugliengo, P.; Sodupe, M.; Hernandez, E.R. Ab initio molecular dynamics study of the hydration of Li+, Na+ and K+ in a montmorillonite model. Influence of isomorphic substitution. Phys. Chem. Chem. Phys. 2010, 12, 688–697. [Google Scholar] [CrossRef]
  17. Zhang, B.; Kang, J.; Kang, T. Effect of water on methane adsorption on the kaolinite (0 0 1) surface based on molecular simulations. Appl. Surf. Sci. 2018, 439, 792–800. [Google Scholar] [CrossRef]
  18. He, M.-C.; Zhao, J. Effects of Mg, Ca, and Fe(II) doping on the kaolinite (001) surface with H2O adsorption. Clays Clay Miner. 2012, 60, 330–337. [Google Scholar] [CrossRef]
  19. Hong, H.; Min, X.; Zhou, Y. Orbital calculations of kaolinite surface: On substitution of Al3+ for Si4+ in the tetrahedral sites. J. Wuhan Univ. Technol.-Mater. Sci. Ed. 2007, 22, 661–666. [Google Scholar] [CrossRef]
  20. Rand, B.; Melton, I.E. Particle interactions in aqueous kaolinite suspensions: I. Effect of ph and electrolyte upon the mode of particle interaction in homoionic sodium kaolinite suspensions. J. Colloid Interface Sci. 1977, 60, 308–320. [Google Scholar] [CrossRef]
  21. Hu, H.; Li, X.; Fang, Z.; Wei, N.; Li, Q. Small-molecule gas sorption and diffusion in coal: Molecular simulation. Energy 2010, 35, 2939–2944. [Google Scholar] [CrossRef]
  22. Mosher, K.; He, J.; Liu, Y.; Rupp, E.; Wilcox, J. Molecular simulation of methane adsorption in micro-and mesoporous carbons with applications to coal and gas shale systems. Int. J. Coal Geol. 2013, 109, 36–44. [Google Scholar] [CrossRef]
  23. Peng, D.-Y.; Robinson, D.B. A new two-constant equation of state. Ind. Eng. Chem. Fundam. 1976, 15, 59–64. [Google Scholar] [CrossRef]
  24. Coles, C.A.; Yong, R.N. Aspects of kaolinite characterization and retention of pb and cd. Appl. Clay Sci. 2002, 22, 39–45. [Google Scholar] [CrossRef] [Green Version]
  25. Yariv, S.; Lapides, I.; Nasser, A.; Lahav, N.; Brodsky, I.; Michaelian, K. Infrared study of the intercalation of potassium halides in kaolinite. Clays Clay Miner. 2000, 48, 10–18. [Google Scholar] [CrossRef]
  26. Yeh, I.-C.; Berkowitz, M.L. Ewald summation for systems with slab geometry. J. Chem. Phys. 1999, 111, 3155–3162. [Google Scholar] [CrossRef]
  27. Mayo, S.L.; Olafson, B.D.; Goddard, W.A. Dreiding: A generic force field for molecular simulations. J. Phys. Chem. 1990, 94, 8897–8909. [Google Scholar] [CrossRef]
  28. Metropolis, N.; Rosenbluth, A.W.; Rosenbluth, M.N.; Teller, A.H.; Teller, E. Equation of state calculations by fast computing machines. J. Chem. Phys. 1953, 21, 1087–1092. [Google Scholar] [CrossRef] [Green Version]
  29. Xiang, Z.; Cao, D. Porous covalent–organic materials: Synthesis, clean energy application and design. J. Mater. Chem. A 2013, 1, 2691–2718. [Google Scholar] [CrossRef]
  30. Fan, H.B.; Yuen, M.M. Material properties of the cross-linked epoxy resin compound predicted by molecular dynamics simulation. Polymer 2007, 48, 2174–2178. [Google Scholar] [CrossRef]
  31. Accelrys, I. Materials Studio; Accelrys Software Inc.: San Diego, CA, USA, 2010. [Google Scholar]
  32. Lan, Q.; Bassi, A.S.; Zhu, J.-X.J.; Margaritis, A. A modified langmuir model for the prediction of the effects of ionic strength on the equilibrium characteristics of protein adsorption onto ion exchange/affinity adsorbents. Chem. Eng. J. 2001, 81, 179–186. [Google Scholar] [CrossRef]
  33. Sun, B.; Kayal, S.; Chakraborty, A. Study of HKUST (Copper benzene-1,3,5-tricarboxylate, Cu-BTC MOF)-1 metal organic frameworks for CH4 adsorption: An experimental Investigation with GCMC (grand canonical Monte-carlo) simulation. Energy 2014, 76, 419–427. [Google Scholar] [CrossRef]
  34. Frost, H.; Düren, T.; Snurr, R.Q. Effects of surface area, free volume, and heat of adsorption on hydrogen uptake in metal− organic frameworks. J. Phys. Chem. B 2006, 110, 9565–9570. [Google Scholar] [CrossRef] [PubMed]
  35. Sui, H.; Yao, J. Effect of surface chemistry for CH4/CO2 adsorption in kerogen: A molecular simulation study. J. Nat. Gas Sci. Eng. 2016, 31, 738–746. [Google Scholar] [CrossRef]
  36. Thomas, K.M. Hydrogen adsorption and storage on porous materials. Catal. Today 2007, 120, 389–398. [Google Scholar] [CrossRef]
  37. Kumar, K.; Kumar, A. Adsorptive separation of carbon dioxide from flue gas using mesoporous MCM-41: A molecular simulation study. Korean J. Chem. Eng. 2018, 35, 535–547. [Google Scholar] [CrossRef]
  38. Akkermans, R.L.; Spenley, N.A.; Robertson, S.H. Monte carlo methods in materials studio. Mol. Simul. 2013, 39, 1153–1164. [Google Scholar] [CrossRef]
  39. Yang, J.Z.; Liu, Q.L.; Wang, H.T. Analyzing adsorption and diffusion behaviors of ethanol/water through silicalite membranes by molecular simulation. J. Membr. Sci. 2007, 291, 1–9. [Google Scholar] [CrossRef]
  40. Wang, K.; Zhang, B.; Kang, T. Effect of geological depths on CH4 adsorption, diffusion and swelling in kaolinite by molecular simulations. Energy Fuels 2020, 34, 1620–1626. [Google Scholar] [CrossRef]
  41. García-Serrano, L.; Flores-Sandoval, C.; Zaragoza, I. Theoretical study of the adsorption of isobutane over h-mordenite zeolite by ab initio and dft methods. J. Mol. Catal. A Chem. 2003, 200, 205–212. [Google Scholar] [CrossRef]
  42. Zhang, J.; Liu, K.; Clennell, M.; Dewhurst, D.; Pervukhina, M. Molecular simulation of CO2–CH4 competitive adsorption and induced coal swelling. Fuel 2015, 160, 309–317. [Google Scholar] [CrossRef]
  43. Chen, G.; Lu, S.; Zhang, J.; Xue, Q.; Han, T.; Xue, H.; Tian, S.; Li, J.; Xu, C.; Pervukhina, M. Research of CO2 and N2 adsorption behavior in k-illite slit pores by gcmc method. Sci. Rep. 2016, 6, 37579. [Google Scholar] [CrossRef] [PubMed]
  44. Chen, G.; Zhang, J.; Lu, S.; Pervukhina, M.; Liu, K.; Xue, Q.; Tian, H.; Tian, S.; Li, J.; Clennell, M. Adsorption behavior of hydrocarbon on illite. Energy Fuels 2016, 30, 9114–9121. [Google Scholar] [CrossRef]
  45. Muniz-Miranda, F.; Lodesani, F.; Tavanti, F.; Presti, D.; Malferrari, D.; Pedone, A. Supercritical CO2 confined in palygorskite and sepiolite minerals: A classical molecular dynamics investigation. J. Phys. Chem. C 2016, 120, 26945–26954. [Google Scholar] [CrossRef]
  46. Soper, A. The radial distribution functions of water and ice from 220 to 673 k and at pressures up to 400 mpa. Chem. Phys. 2000, 258, 121–137. [Google Scholar] [CrossRef]
  47. Czímerová, A.; Bujdák, J.; Dohrmann, R. Traditional and novel methods for estimating the layer charge of smectites. Appl. Clay Sci. 2006, 34, 2–13. [Google Scholar] [CrossRef]
  48. An, J.-H.; Dultz, S. Adsorption of tannic acid on chitosan-montmorillonite as a function of ph and surface charge properties. Appl. Clay Sci. 2007, 36, 256–264. [Google Scholar] [CrossRef]
  49. Einstein, A. Investigations on the theory of the brownian movement. Ann. D. Phys. 1905, 17, 549. [Google Scholar] [CrossRef] [Green Version]
  50. Kang, J.; Zhang, B.; Kang, T. Monte carlo and molecular dynamic simulations of CH4 diffusion in kaolinite as functions of pressure and temperature. J. Nat. Gas Sci. Eng. 2018, 54, 65–71. [Google Scholar] [CrossRef]
Sample Availability: Not available.
Figure 1. The 4 × 2 × 2 kaolinite (001) surface super model (a) and CH4 molecular model (b) [17].
Molecules 25 01001 g001
Figure 2. Absolute adsorption amount of CH4 on pure and Mg-, Fe(II)-, and Al-doped kaolinite at a temperature of 293.15 K. Error bars indicate the standard deviations.
Molecules 25 01001 g002
Figure 3. The histogram of the specific surface area of pure and Mg-, Fe(II)-, and Al-doped kaolinite. Error bars indicate the standard deviations.
Molecules 25 01001 g003
Figure 4. Interaction energies of CH4 adsorption on pure and Mg-, Fe(II)-, and Al-doped kaolinite at different pressures. Error bars indicate the standard deviations.
Molecules 25 01001 g004
Figure 5. Radial distribution functions (RDFs) between the CH4 and the pure, Mg-, Fe(II)-, and Al-doped kaolinite surface at 293.15 K and 20 MPa.
Molecules 25 01001 g005
Figure 6. RDFs between the CH4 and different atoms of pure and doped kaolinite.
Molecules 25 01001 g006
Figure 7. The snapshots of CH4 adsorption. (a) pure kaolinite; (b) Mg-doped kaolinite; (c) Fe(II)-doped kaolinite; (d) Al-doped kaolinite.
Molecules 25 01001 g007
Figure 8. The self-diffusion coefficients of CH4 on pure and Mg-, Fe(II)-, and Al-doped kaolinite at different pressures. Error bars indicate the standard deviations.
Molecules 25 01001 g008
Table 1. Langmuir constants obtained by fitting the Langmuir model to the absolute adsorption amount of CH4 on pure and Mg-, Fe(II)-, and Al-doped kaolinite at 293.15 K.
SurfaceVL (molecules/uc)PL (MPa)Correlation Coefficient R2
Kaolinite (001)3.910.950.992
Mg-doped3.541.010.991
Fe(II)-doped3.511.050.996
Al-doped3.501.060.997

