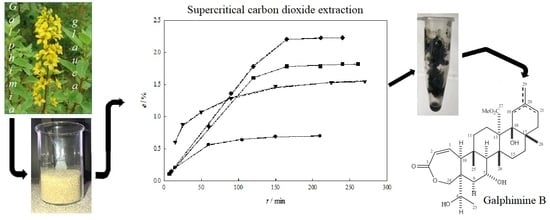
Extraction of Galphimines from Galphimia glauca with Supercritical Carbon Dioxide

 ,
,  ,
,  , and
, and
Abstract
1. Introduction
2. Results and Discussion
2.1. Extraction Behavior
2.2. Modeling
2.3. Quantification of Galphimine B
3. Materials and Methods
3.1. Material Plant
3.2. Chemicals
3.3. Apparatus and Procedure
3.4. Analyses
3.5. Mathematical Modeling
4. Conclusions
Supplementary Materials
Author Contributions
Funding
Acknowledgments
Conflicts of Interest
Abbreviations
| A | Variable in the model of Papamichail et al. (min−1) |
| AUG-B | Response area of galphimine B (absorbance2) |
| a | Interfacial area (m−1) |
| B | Variable in the model of Papamichail et al. (dimensionless) |
| CG-B | Concentration of galphimine B (μg·mL−1) |
| dp | Particle size (μm) |
| E | Mass of extract (g) |
| e | Extraction yield (dimensionless) |
| G | Grinding efficiency (dimensionless) |
| h | Coordinate in the model of Sovová (dimensionless) |
| K | Equilibrium constant in the model of Papamichail et al. (dimensionless) |
| k | Mass transfer coefficient (m·min−1) |
| N | Mass of solid charged in the extractor (g) |
| n | Number of datum |
| P | Pressure (MPa) |
| Q | Mass flow rate (g·min−1) |
| QV | Volumetric flow rate (L·min−1) |
| T | Temperature (K) |
| t | Time (min) |
| x | Concentration in the solid phase (dimensionless) |
| Y | Variable in the model of Sovová (dimensionless) |
| y | Concentration in the fluid phase (dimensionless) |
| y0 | Solubility in the model of Papamichail et al. (gextract·gCO2−1) |
| yr | Solubility in the model of Sovová (gextract·gCO2−1) |
| Z | Variable in the model of Sovová (dimensionless) |
| Greek letters | |
| ε | Bed porosity (dimensionless) |
| Ψ | Dimensionless time in the model of Sovová (dimensionless) |
| ρ | Density (kg·m−3) |
| Superscripts | |
| ̅ | Boundary of extraction periods in the model of Papamichail et al. |
| * | Equilibrium condition |
| ̇ | Specific variable |
| calc | Calculated |
| exp | Experimental |
| Subscripts | |
| 0 | Initial condition |
| f | Fluid phase |
| k | Boundary of extraction periods in the model of Sovová. |
| s | Solid-phase |
References
- Argueta, A.; Cano, L.M.; Rodarte, M.E. Atlas de las Plantas de la Medicina Tradicional Mexicana, 1st ed.; Instituto Nacional Indigenista: Mexico City, Mexico, 1994. [Google Scholar]
- Villarreal, M.L.; Cardoso-Taketa, A.; Ortíz, A.; Sharma, A. Biotecnología para producir medicinas de plantas mexicanas; Revista Digital Universitaria—UNAM: Mexico City, Mexico, 2014. [Google Scholar]
- Sharma, A.; Angulo-Bejarano, P.I.; Madariaga-Navarrete, A.; Oza, G.; Iqbal, H.M.N.; Cardoso-Taketa, A.; Villarreal, M.L. Multidisciplinary Investigations on Galphimia glauca: A Mexican Medicinal Plant with Pharmacological Potential. Molecules 2018. [Google Scholar] [CrossRef] [PubMed]
- Gutiérrez, S.L.G.; Chilpa, R.R.; Jaime, H.B. Medicinal plants for the treatment of “nervios”, anxiety, and depression in Mexican Traditional Medicine. Braz. J. Pharm. 2014, 24, 591–608. [Google Scholar] [CrossRef]
- López-Rubalcava, C.; Estrada-Camarena, E. Mexican medicinal plants with anxiolytic or antidepressant activity: Focus on preclinical research. J. Ethnopharmacol. 2016, 186, 377–391. [Google Scholar] [CrossRef] [PubMed]
- Patrón-González, D.; Hermenegildo-Rosas, H.D.; Flores-Nicolas, J.C.; Bello-Martinez, J. Actividad antioxidante de Galphimia glauca Cav de la comunidad de Ahuacatlán Guerrero. Foro de estudios sobre Guerrero 2013–2014, 1, 472–475. [Google Scholar]
- González-Cortazar, M.; Herrera-Ruiz, M.; Zamilpa, A.; Jiménez-Ferrer, E.; Marquina, S.; Álvarez, L.; Tortoriello, J. Anti-inflammatory activity and chemical profile of Galphimia glauca. Planta Med. 2014, 80, 90–96. [Google Scholar] [CrossRef]
- Taketa, A.T.C.; Lozada-Lechuga, J.; Fragoso-Serrano, M.; Villarreal, M.L.; Pereda-Miranda, R. Isolation of Nor-secofriedelanes from the Sedative Extracts of Galphimia glauca. J. Nat. Prod. 2004, 67, 644–649. [Google Scholar] [CrossRef]
- Herrera-Ruiz, M.; González-Cortázar, M.; Jiménez-Ferrer, E.; Zamilpa, A.; Alvarez, L.; Ramirez, G.; Tortoriello, J. Anxiolytic Effect of Natural Galphimines from Galphimia glauca and their Chemical Derivatives. J. Nat. Prod. 2006, 69, 59–61. [Google Scholar] [CrossRef]
- Toscano, R.A.; Maldonado, E.; Lozoya, X.; Tortoriello, J.; Ortega, A.; Gaviño, R. Structure of galphimine B. Acta Crystallogr. Sect. C Cryst. Struct. Commun. 1993, 49, 774–776. [Google Scholar] [CrossRef]
- Santillán-Urquiza, M.A.; Herrera-Ruíz, M.; Zamilpa, A.; Jiménez-Ferrer, E.; Roman-Ramos, R.; Tortoriello, J. Pharmacological interaction of Galphimia glauca extract and natural galphimines with Ketamine and Haloperidol on different behavioral tests. Biomed. Pharmacother. 2018, 103, 879–888. [Google Scholar] [CrossRef]
- Romero-Cerecero, O.; Islas-Garduño, A.L.; Zamilpa, A.; Pérez-García, M.D.; Tortoriello, J. Therapeutic Effectiveness of Galphimia glauca in Young People with Social Anxiety Disorder: A Pilot Study. Evidence-Based Complement. Altern. Med. 2018, 2018, 1–8. [Google Scholar] [CrossRef] [PubMed]
- Herrera-Arellano, A.; Jiménez-Ferrer, E.; Zamilpa, A.; Morales-Valdéz, M.; García-Valencia, C.; Tortoriello, J. Efficacy and Tolerability of a Standardized Herbal Product from Galphimia glauca on Generalized Anxiety Disorder. A Randomized, Double-Blind Clinical Trial Controlled with Lorazepam. Planta Med. 2007, 73, 713–717. [Google Scholar] [CrossRef] [PubMed]
- Herrera-Arellano, A.; Jiménez-Ferrer, J.; Zamilpa, A.; García-Alonso, G.; Herrera-Alvarez, S.; Tortoriello, J. Therapeutic Effectiveness of Galphimia glauca vs. Lorazepam in Generalized Anxiety Disorder. A Controlled 15-Week Clinical Trial. Planta Med. 2012, 78, 1529–1535. [Google Scholar] [CrossRef] [PubMed]
- Tortoriello, J.; Lozoya, X. Effect of Galphimia glauca Methanolic Extract on Neuropharmacological Tests. Planta Med. 1992, 58, 234–236. [Google Scholar] [CrossRef] [PubMed]
- Kviecinski, M.R.; Benelli, P.; Felipe, K.; Correia, J.; Pich, C.; Ferreira, S.R.S.; Pedrosa, R. SFE from Bidens pilosa Linné to obtain extracts rich in cytotoxic polyacetylenes with antitumor activity. J. Supercrit. Fluids 2011, 56, 243–248. [Google Scholar] [CrossRef]
- Williams, J.R.; Clifford, A.A. Introduction to Supercritical Fluids and Their Applications. In Supercritical Fluid Methods and Protocols; Williams, J.R., Clifford, A.A., Eds.; Humana Press: New Jersey, NJ, USA, 2000; pp. 1–16. [Google Scholar]
- Özkal, S.; Yener, M.; Bayındırlı, L.; Bayindirli, L. Mass transfer modeling of apricot kernel oil extraction with supercritical carbon dioxide. J. Supercrit. Fluids 2005, 35, 119–127. [Google Scholar] [CrossRef]
- Nikolovski, B.G.; Sovilj, M.N.; Đokić, M.Z.; Vidović, S.S. Kinetika i modelovanje ekstrakcije ulja iz semena lana (Linum usitatissimum L.) natkritičnim ugljendioksidom. Hem. Ind. 2008, 62, 283–292. [Google Scholar] [CrossRef]
- Maksimović, S.; Ivanovic, J.; Skala, D. Supercritical Extraction of Essential Oil from Mentha and Mathematical Modelling—The Influence of Plant Particle Size. Procedia Eng. 2012, 42, 1767–1777. [Google Scholar] [CrossRef]
- Stamenic, M.; Žižović, I. The mathematics of modelling the supercritical fluid extraction of essential oils from glandular trichomes. Comput. Chem. Eng. 2013, 48, 89–95. [Google Scholar] [CrossRef]
- Devi, V.; Khanam, S.; Vibha, D.; Shabina, K. Development of generalized and simplified models for supercritical fluid extraction: Case study of papaya (Carica papaya) seed oil. Chem. Eng. Res. Des. 2019, 150, 341–358. [Google Scholar] [CrossRef]
- Pavlić, B.; Pezo, L.; Marić, B.; Peić Tukuljac, L.; Zeković, Z.; Bodroža Solarovc, M.; Teslić, N. Supercritical fluid extraction of raspberry seed oil: Experiments and modelling. J. Supercrit. Fluids 2020. [Google Scholar] [CrossRef]
- Sovova, H. Rate of the vegetable oil extraction with supercritical CO2—I. Modelling of extraction curves. Chem. Eng. Sci. 1994, 49, 409–414. [Google Scholar] [CrossRef]
- Ciftci, O.N.; Calderon, J.; Temelli, F. Supercritical Carbon Dioxide Extraction of Corn Distiller’s Dried Grains with Solubles: Experiments and Mathematical Modeling. J. Agric. Food Chem. 2012, 60, 12482–12490. [Google Scholar] [CrossRef] [PubMed]
- Papamichail, I.; Louli, V.; Magoulas, K. Supercritical fluid extraction of celery seed oil. J. Supercrit. Fluids 2000, 18, 213–226. [Google Scholar] [CrossRef]
- Rai, A.; Mohanty, B.; Bhargava, R. Fitting of broken and intact cell model to supercritical fluid extraction (SFE) of sunflower oil. Innov. Food Sci. Emerg. Technol. 2016, 38, 32–40. [Google Scholar] [CrossRef]
- Kuvendziev, S.; Lisichkov, K.; Zeković, Z.; Marinkovski, M.; Musliu, Z.H. Supercritical fluid extraction of fish oil from common carp (Cyprinus carpio L.) tissues. J. Supercrit. Fluids 2018, 133, 528–534. [Google Scholar] [CrossRef]
- Wrona, O.; Rafińska, K.; Możeński, C.; Buszewski, B. Supercritical carbon dioxide extraction of Solidago gigantea Ait.: Optimization at quarter-technical scale and scale up the process to half-technical plant. Ind. Crop. Prod. 2019, 130, 316–324. [Google Scholar] [CrossRef]
- Glišić, S.B.; Popadić, S.V.; Skala, D.U. Kantarion (Hypericum perforatum L.) – Natkritična ekstrakcija, antimikrobna I antidepresivna aktivnost ekstrakta I pojedinih komponenti. Hem. Ind. 2006, 60, 61–71. [Google Scholar] [CrossRef]
- Hamid, I.A.A.; Ismail, N.; Rahman, N.A. Supercritical Carbon Dioxide Extraction of Selected Herbal Leaves: An Overview. IOP Conf. Series Mater. Sci. Eng. 2018. [Google Scholar] [CrossRef]
- Demirkoz, A.B.; Karakaş, M.; Bayramoğlu, P.; Uner, M. Analysis of volatile flavour components by dynamic headspace analysis/gas chromatography-mass spectrometry in roasted pistachio extracts using supercritical carbon dioxide extraction and sensory analysis. Int. J. Food Prop. 2018, 21, 973–982. [Google Scholar] [CrossRef]
- Sidaoui, F.; Igueld, S.B.; Yemmen, M.; Mraihi, F.; Barth, D.; Trabelsi-Ayadi, M.; Cherif, J.K. Chemical and functional characterization of tunisian artemisia absinthium volatiles and non-volatile extracts obtained by supercritical fluid procedure. Int. J. Pharm. Clin. Res. 2016, 8, 1178–1185. [Google Scholar]
- Jahangir, M.A.; Shehzad, A.; Butt, M.S.; Bashir, S.; Ahmar, J.M.; Aamir, S.; Muhammad, S.M.S.B.A. Influence of supercritical fluid extract of Cinnamomum zeylanicum bark on physical, bioactive and sensory properties of innovative cinnamaldehyde-enriched chocolates. Czech J. Food Sci. 2018, 36, 28–36. [Google Scholar] [CrossRef]
- Haghayegh, M.; Zabihi, F.; Eikani, M.H.; Moghadas, B.K.; Yazdi, S.A.V. Supercritical Fluid Extraction of Flavonoids and Terpenoids from Herbal compounds: Experiments and Mathematical modeling. J. Essent. Oil Bear. Plants 2015, 18, 1253–1265. [Google Scholar] [CrossRef]
- Maksimovic, S.; Tadic, V.; Ivanovic, J.; Radmanovic, T.; Milovanovic, S.; Stankovic, M.; Zizovic, I. Utilization of the integrated process of supercritical extraction and impregnation for incorporation of Helichrysum italicum extract into corn starch xerogel. Chem. Ind. Chem. Eng. Q. 2018, 24, 191–200. [Google Scholar] [CrossRef]
- Venskutonis, P.; Jonušaitė, K. High pressure biorefinery of essential oil yielding plants into valuable ingredients. Acta Hortic. 2016. [Google Scholar] [CrossRef]
- Basa’Ar, O.; Fatema, S.; Alrabie, A.; Mohsin, M.; Farooqui, M. Supercritical carbon dioxide extraction of Triognella foenum graecum Linn seeds: Determination of bioactive compounds and pharmacological analysis. Asian Pac. J. Trop. Biomed. 2017, 7, 1085–1091. [Google Scholar] [CrossRef]
- Olubi, O.; Felix-Minnaar, J.; Jideani, V. Physicochemical and fatty acid profile of egusi oil from supercritical carbon dioxide extraction. Heliyon 2019. [Google Scholar] [CrossRef]
- Vladić, J.; Zeković, Z.; Jokić, S.; Svilović, S.; Kovačević, S.; Vidović, S. Winter savory: Supercritical carbon dioxide extraction and mathematical modeling of extraction process. J. Supercrit. Fluids 2016, 117, 89–97. [Google Scholar] [CrossRef]
- Filip, S.; Vidović, S.; Adamovic, D.; Zeković, Z. Fractionation of non-polar compounds of basil (Ocimum basilicum L.) by supercritical fluid extraction (SFE). J. Supercrit. Fluids 2014, 86, 85–90. [Google Scholar] [CrossRef]
- Wagner, M.E.; French, J.; Rizvi, S.S. Supercritical fluid extraction of oil from potato chips: Two scale comparison and mathematical modeling. J. Food Eng. 2013, 118, 100–107. [Google Scholar] [CrossRef]
- Ruslan, M.S.H.; Idham, Z.; Zaini, M.A.A.; Yian, L.Y.; Yunus, M.A.C. Kinetic Modeling of Supercritical Fluid Extraction of Betel Nut. Int. J. Automot. Mech. Eng. 2018, 15, 5273–5284. [Google Scholar] [CrossRef]
- American Society of Agricultural and Biological Engineers. Method of Determining and Expressing Fineness of Feed Materials by Sieving; A.S.A.E. Standards: St. Joseph, MI, USA, 2003. [Google Scholar]
- Armstrong, N.A.; Minchom, C.M.; Patel, V.J. Density Determination of Powders by Liquid Displacement Methods. Drug Dev. Ind. Pharm. 1989, 15, 549–559. [Google Scholar] [CrossRef]
- Span, R.; Wagner, W. A New Equation of State for Carbon Dioxide Covering the Fluid Region from the Triple-Point Temperature to 1100 K at Pressures up to 800 MPa. J. Phys. Chem. Ref. Data 1996. [Google Scholar] [CrossRef]
- Šťastová, J.; Jeẑ, J.; Bartlova, M.; Sovová, H. Rate of the vegetable oil extraction with supercritical CO2—III. Extraction from sea buckthorn. Chem. Eng. Sci. 1996, 51, 4347–4352. [Google Scholar] [CrossRef]
- Perrut, M.; Clavier, J.Y.; Poletto, M.; Reverchon, E. Mathematical Modeling of Sunflower Seed Extraction by Supercritical CO2. Ind. Eng. Chem. Res. 1997, 36, 430–435. [Google Scholar] [CrossRef]
Sample Availability: Samples of the purified extract of galphimines and the supercritical carbon dioxide extracts of Galphimia glauca are available from the authors. |


| P (MPa) | e (%) | Concentration G-B (mg·g extract−1) | Relative area G-B (%) | Relative area G-E (%) |
|---|---|---|---|---|
| 15.00 | 0.70 | 18.1 ± 2.3 | 85.24 | 14.76 |
| 21.25 | 1.55 | 28.1 ± 8.3 | 88.06 | 11.94 |
| 27.50 | 1.82 | 21.6 ± 1.5 | 86.11 | 13.89 |
| 33.75 | 2.22 | 20.3 ± 2.6 | 86.02 | 13.98 |
| T (K) | e (%) | Concentration G-B (mg·g Extract−1) | Relative Area G-B (%) | Relative Area G-E (%) |
|---|---|---|---|---|
| 313.15 | 0.92 | 11.5 ± 2.6 | 91.38 | 8.62 |
| 318.15 | 0.79 | 29.1 ± 2.2 | 84.92 | 15.08 |
| 323.15 | 1.82 | 21.6 ± 1.5 | 86.11 | 13.89 |
| 328.15 | 1.96 | 11.7 ± 1.2 | 80.49 | 19.51 |
| dp (μm) | e (%) | Concentration G-B (mg·g Extract−1) | Relative Area G-B (%) | Relative Area G-E (%) |
|---|---|---|---|---|
| 224 | 2.16 | 21.4 ± 2.7 | 79.56 | 20.44 |
| 326 | 1.82 | 21.6 ± 1.5 | 86.11 | 13.89 |
| 461 | 1.76 | 17.5 ± 1.8 | 79.54 | 20.46 |
| 548 | 0.78 | 19.0 ± 2.3 | 84.13 | 15.87 |
| QV (L·min−1) | e (%) | Concentration G-B (mg·g Extract−1) | Relative Area G-B (%) | Relative Area G-E (%) |
|---|---|---|---|---|
| 1 | 0.91 | 19.5 ± 1.5 | 83.56 | 16.44 |
| 2 | 1.30 | 19.1 ± 3.1 | 85.79 | 14.21 |
| 3 | 1.82 | 21.6 ± 1.5 | 86.11 | 13.89 |
| 4 | 1.40 | 10.4 ± 1.3 | 82.31 | 17.69 |
| Average dp (μm) | Apparent Density (kg·m−3) | True Density (kg·m−3) |
|---|---|---|
| 224 | 291 | 1157 |
| 326 | 266 | 1117 |
| 461 | 250 | 1091 |
| 548 | 194 | 994 |
© 2020 by the authors. Licensee MDPI, Basel, Switzerland. This article is an open access article distributed under the terms and conditions of the Creative Commons Attribution (CC BY) license (http://creativecommons.org/licenses/by/4.0/).
Share and Cite
Verónico Sánchez, F.J.; Elizalde Solis, O.; Zamilpa, A.; García Morales, R.; Pérez García, M.D.; Jiménez Ferrer, J.E.; Tortoriello, J. Extraction of Galphimines from Galphimia glauca with Supercritical Carbon Dioxide. Molecules 2020, 25, 477. https://doi.org/10.3390/molecules25030477
Verónico Sánchez FJ, Elizalde Solis O, Zamilpa A, García Morales R, Pérez García MD, Jiménez Ferrer JE, Tortoriello J. Extraction of Galphimines from Galphimia glauca with Supercritical Carbon Dioxide. Molecules. 2020; 25(3):477. https://doi.org/10.3390/molecules25030477
Chicago/Turabian StyleVerónico Sánchez, Francisco Javier, Octavio Elizalde Solis, Alejandro Zamilpa, Ricardo García Morales, Ma. Dolores Pérez García, Jesús E. Jiménez Ferrer, and Jaime Tortoriello. 2020. "Extraction of Galphimines from Galphimia glauca with Supercritical Carbon Dioxide" Molecules 25, no. 3: 477. https://doi.org/10.3390/molecules25030477
APA StyleVerónico Sánchez, F. J., Elizalde Solis, O., Zamilpa, A., García Morales, R., Pérez García, M. D., Jiménez Ferrer, J. E., & Tortoriello, J. (2020). Extraction of Galphimines from Galphimia glauca with Supercritical Carbon Dioxide. Molecules, 25(3), 477. https://doi.org/10.3390/molecules25030477