Development of Advanced Chemometric-Assisted Spectrophotometric Methods for the Determination of Cromolyn Sodium and Its Alkaline Degradation Products
Abstract
1. Introduction
2. Methods
2.1. Instrumentation, Chemicals and Reagents
2.2. Preparation of the CS Alkaline Degradation Products
2.3. Procedures
2.3.1. Procedure for MCR Method
2.3.2. Procedure for PCR and PLS-2
2.3.3. Assay of Pharmaceutical Formulation (Epicrom Eye Drop)
3. Results and Discussion
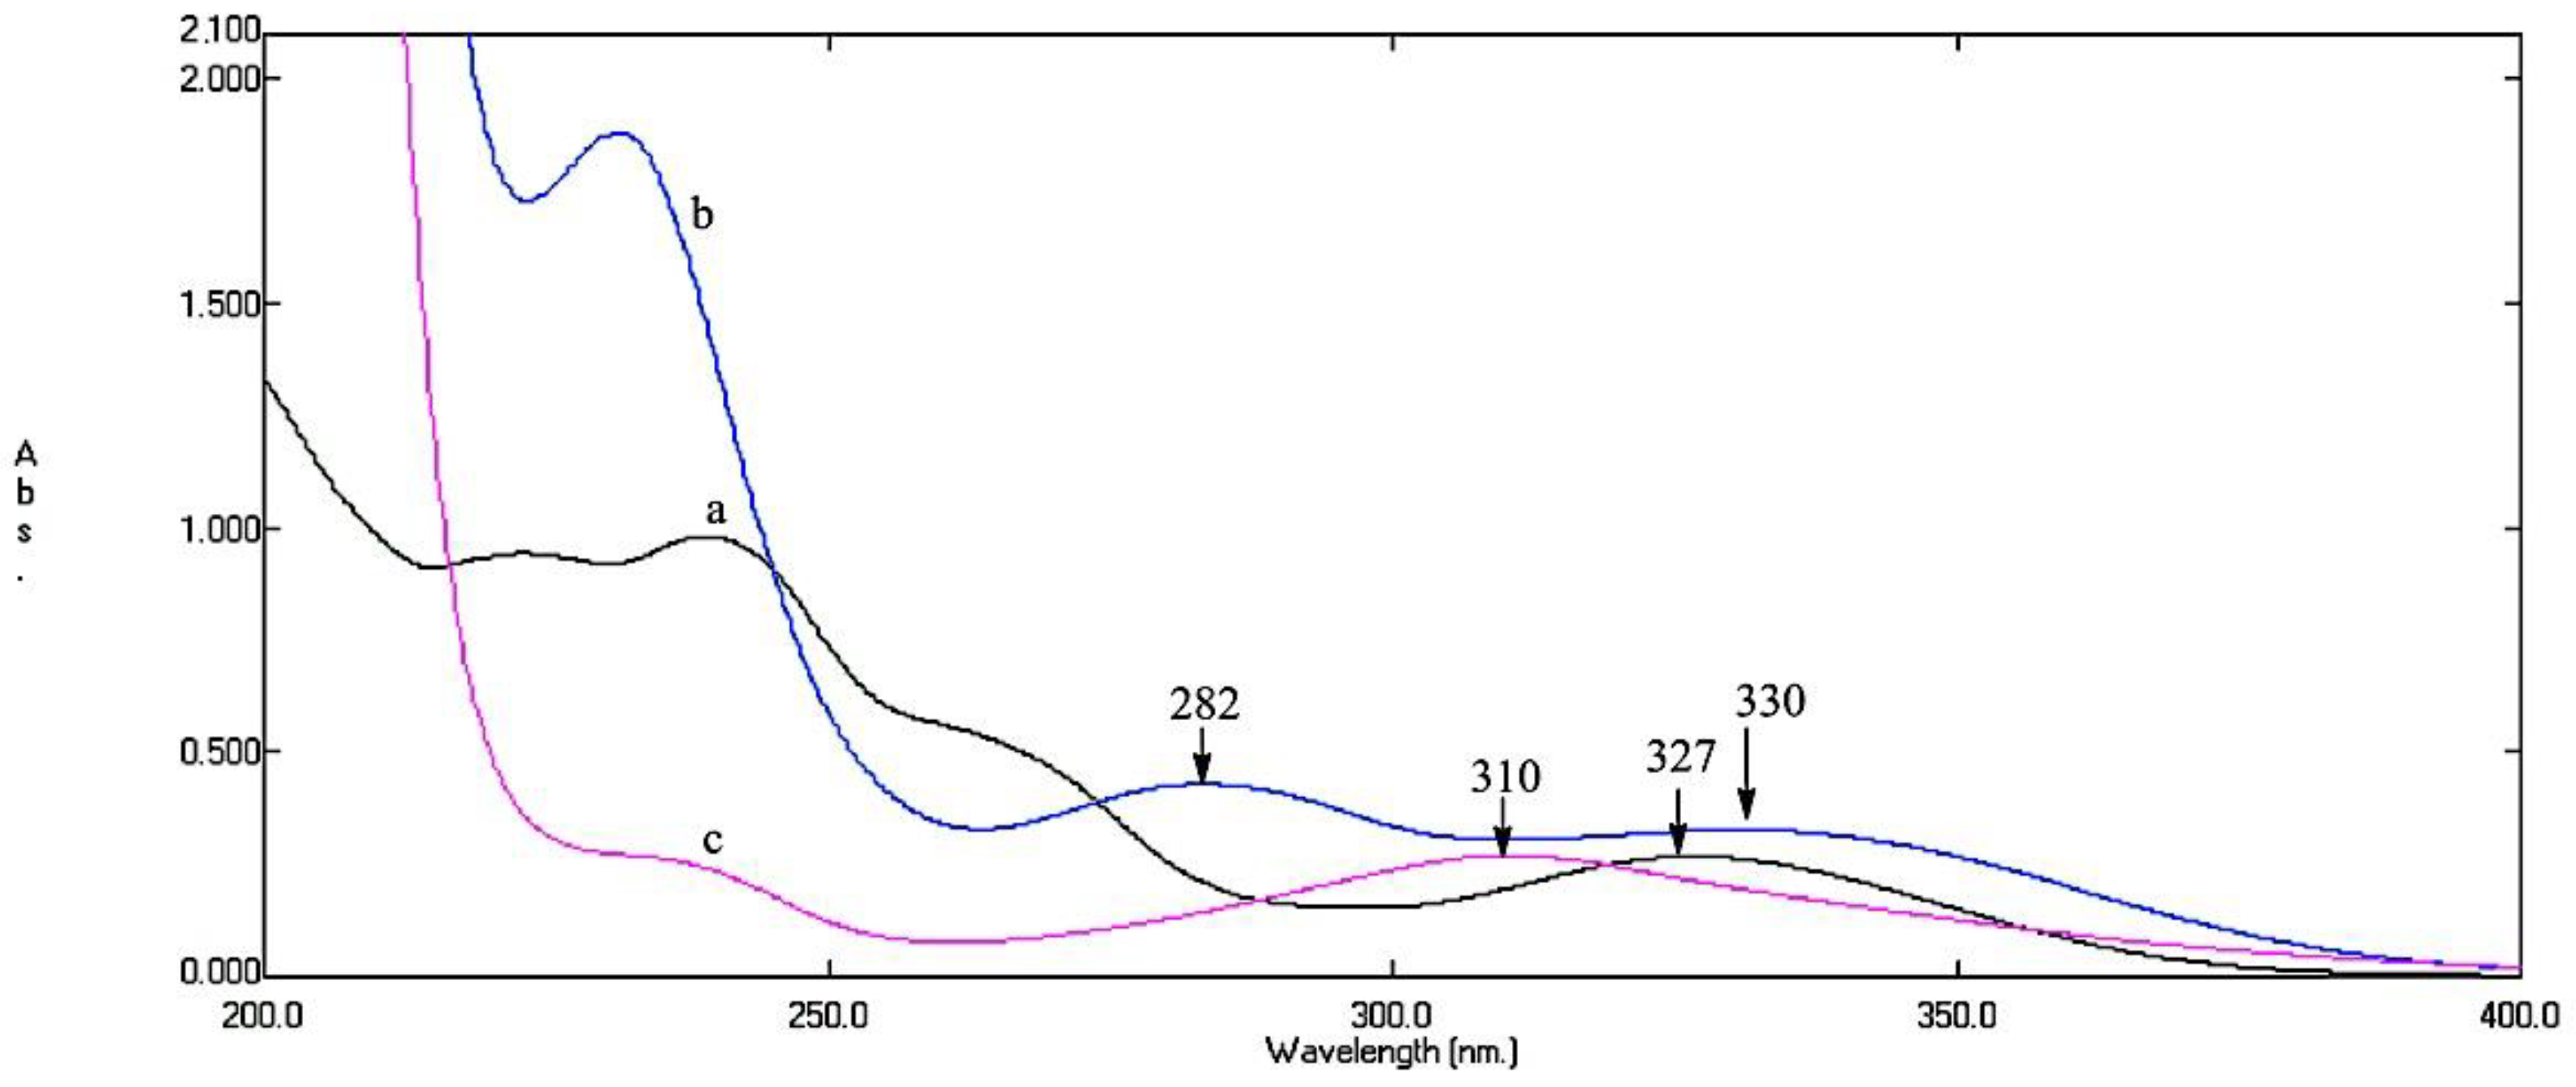
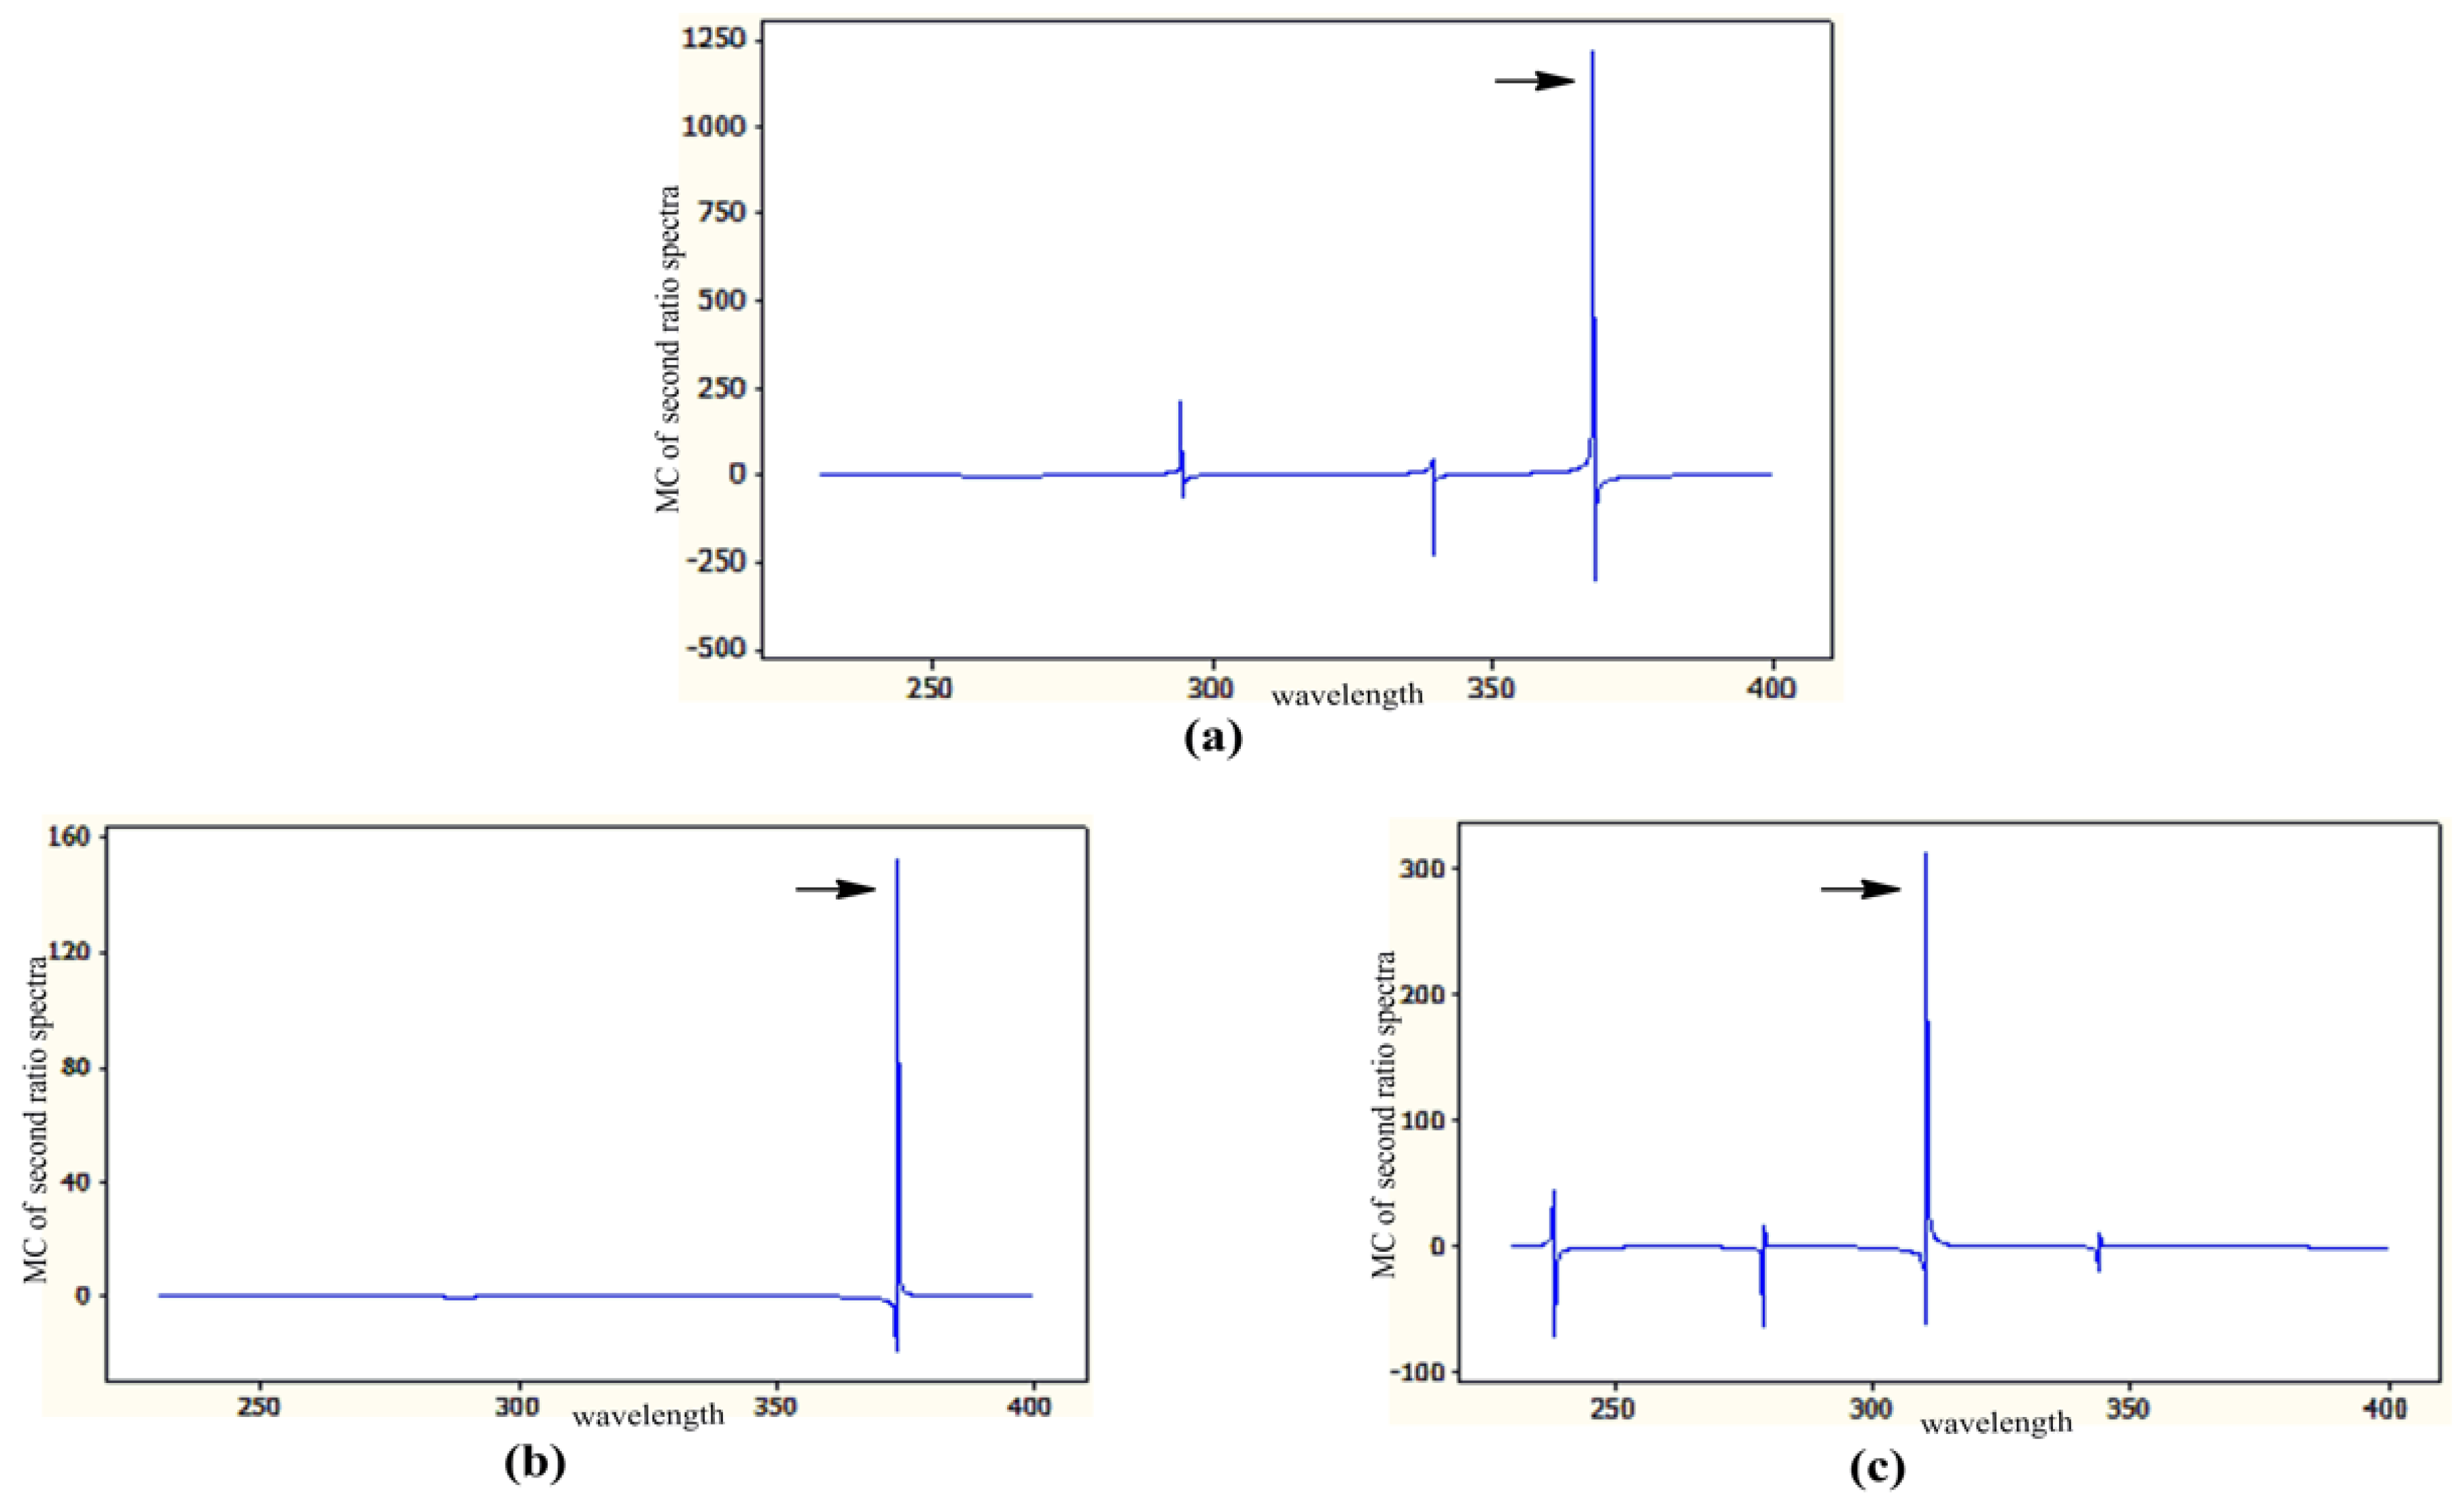
3.1. MCR Method
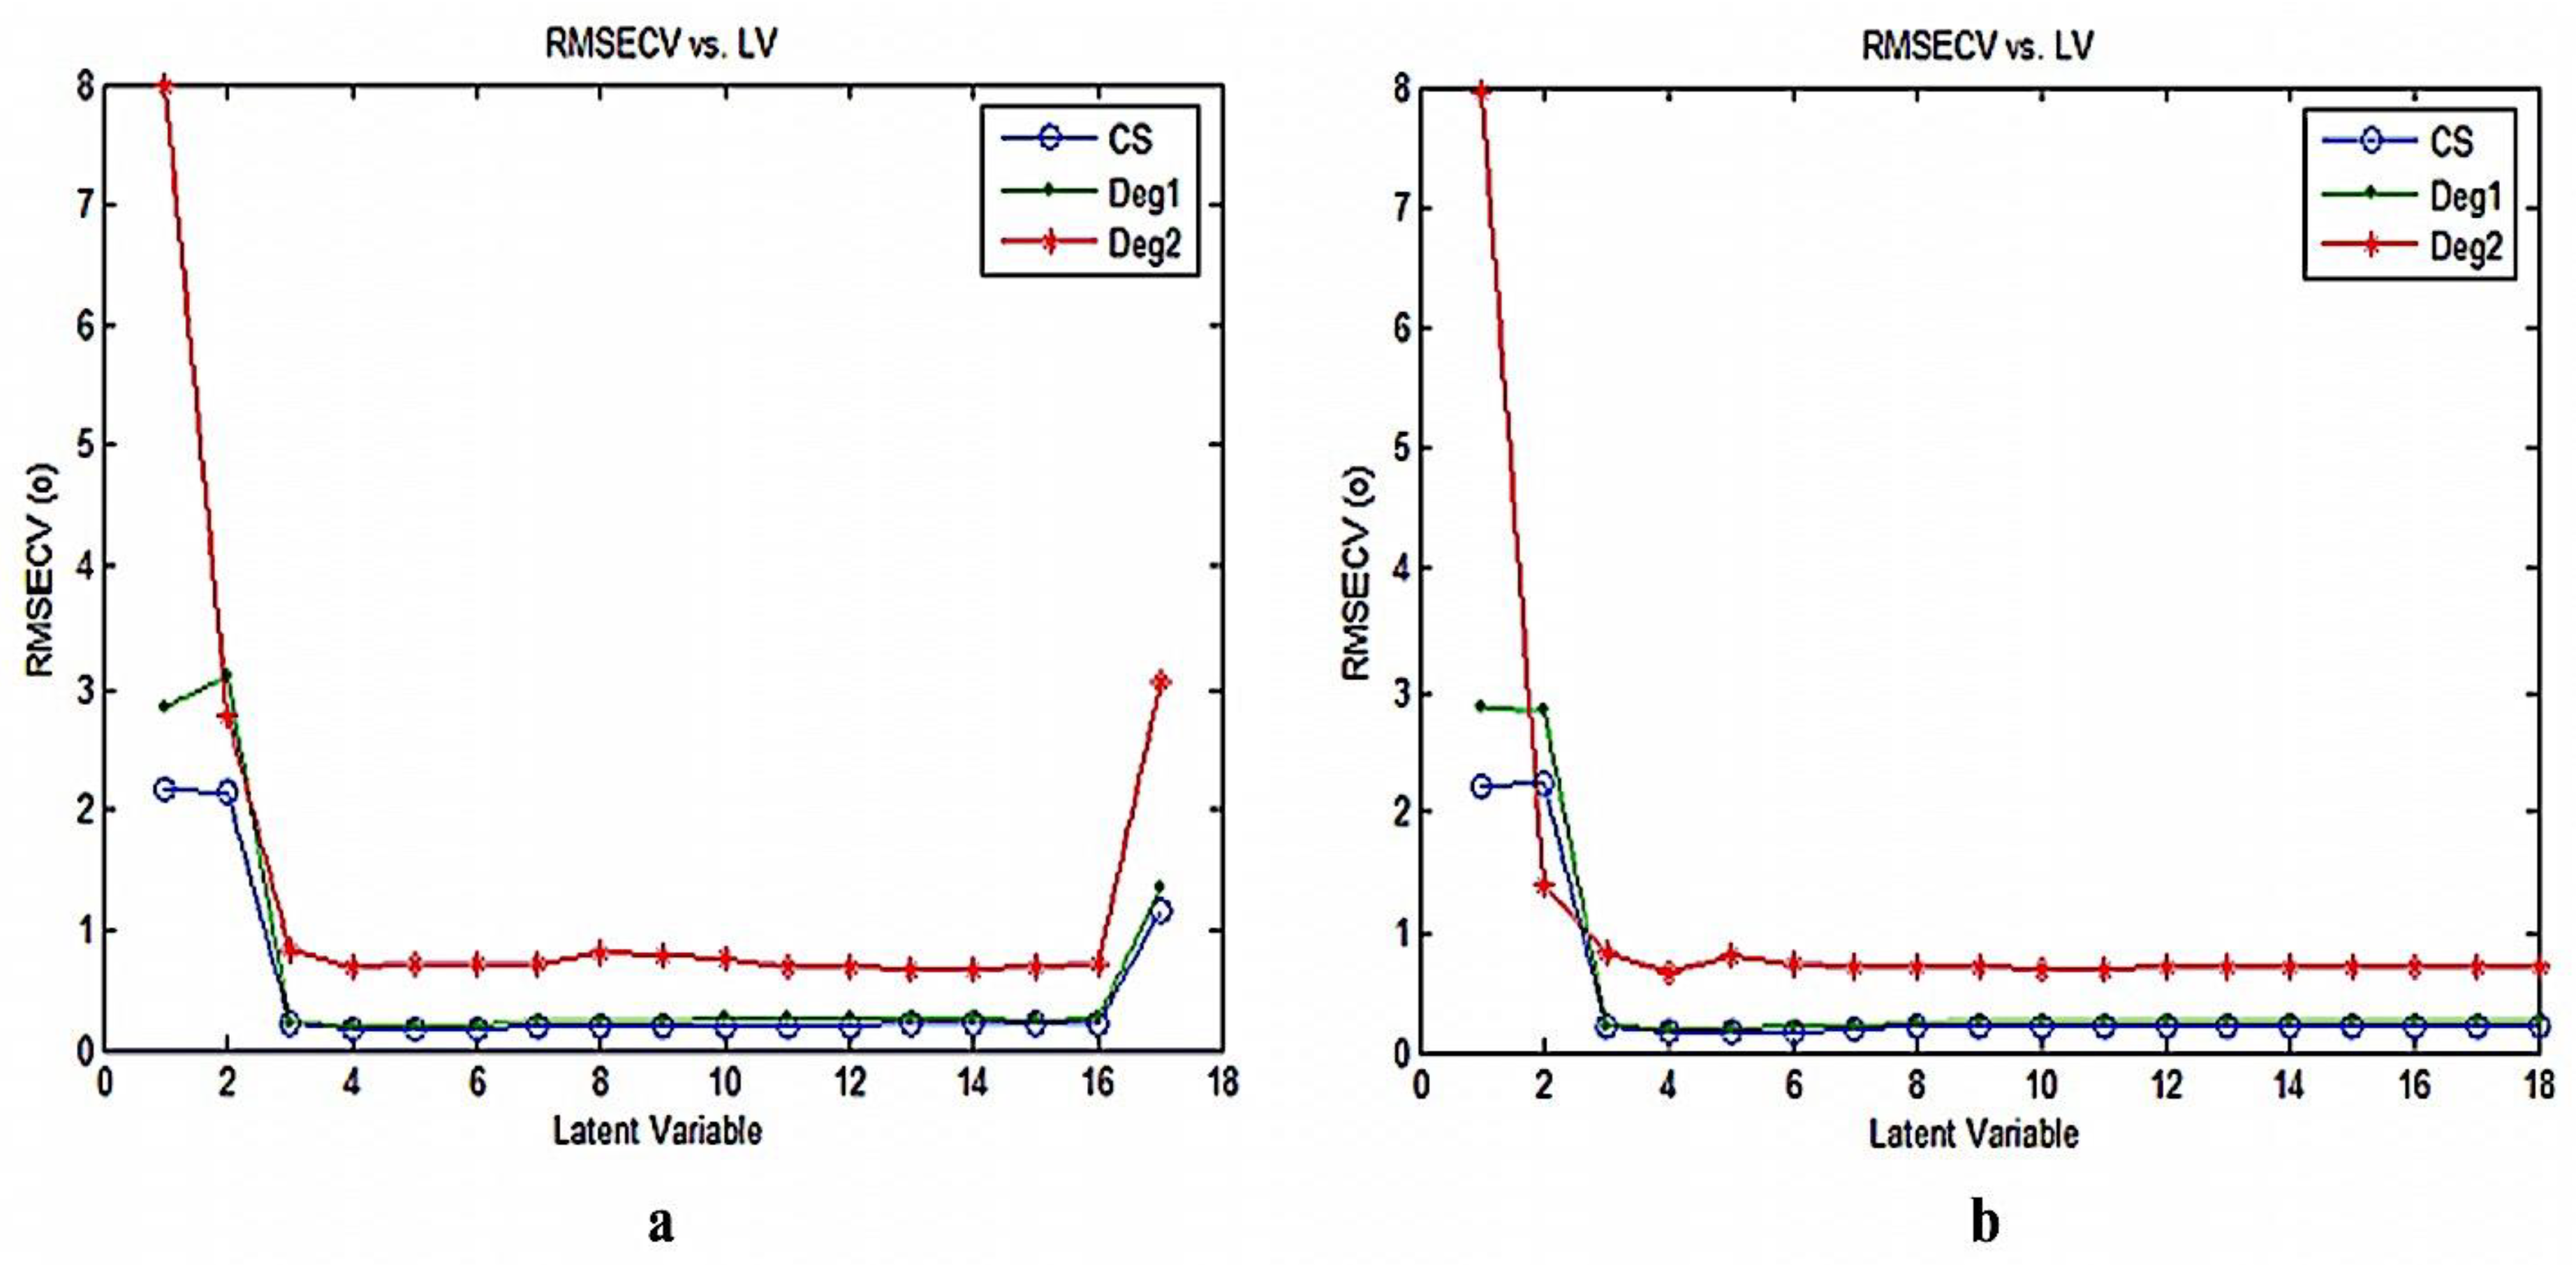
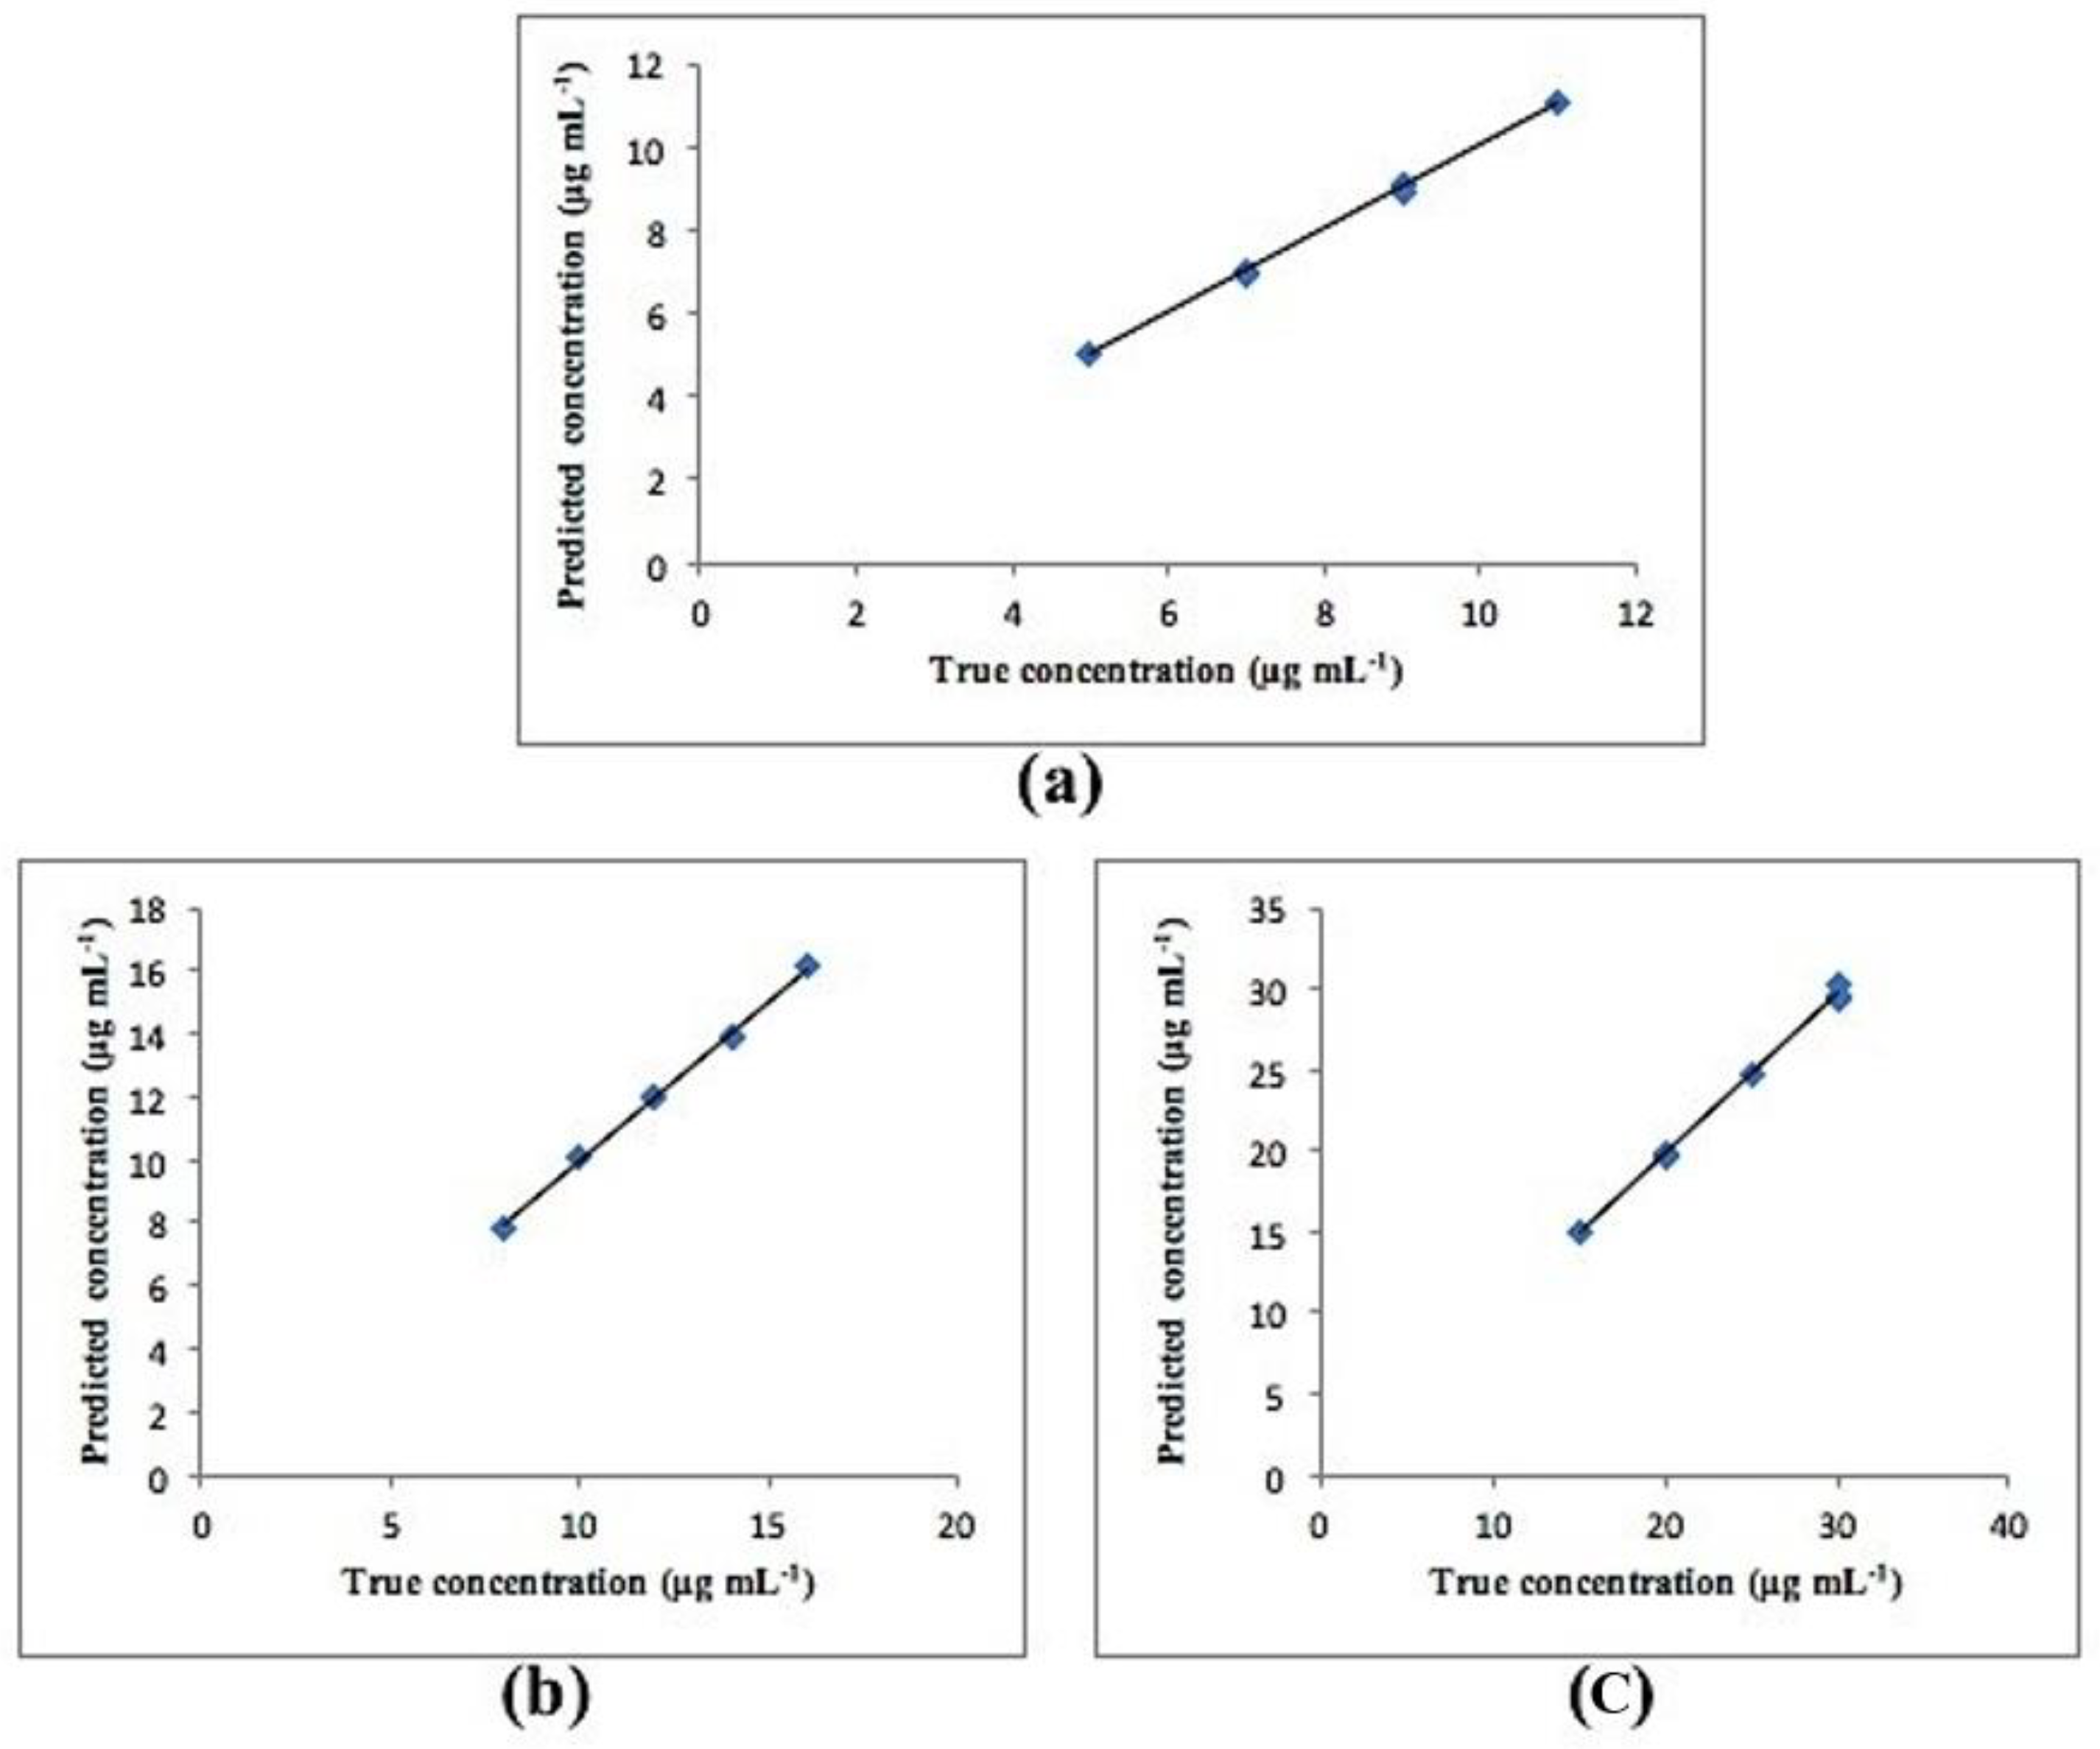
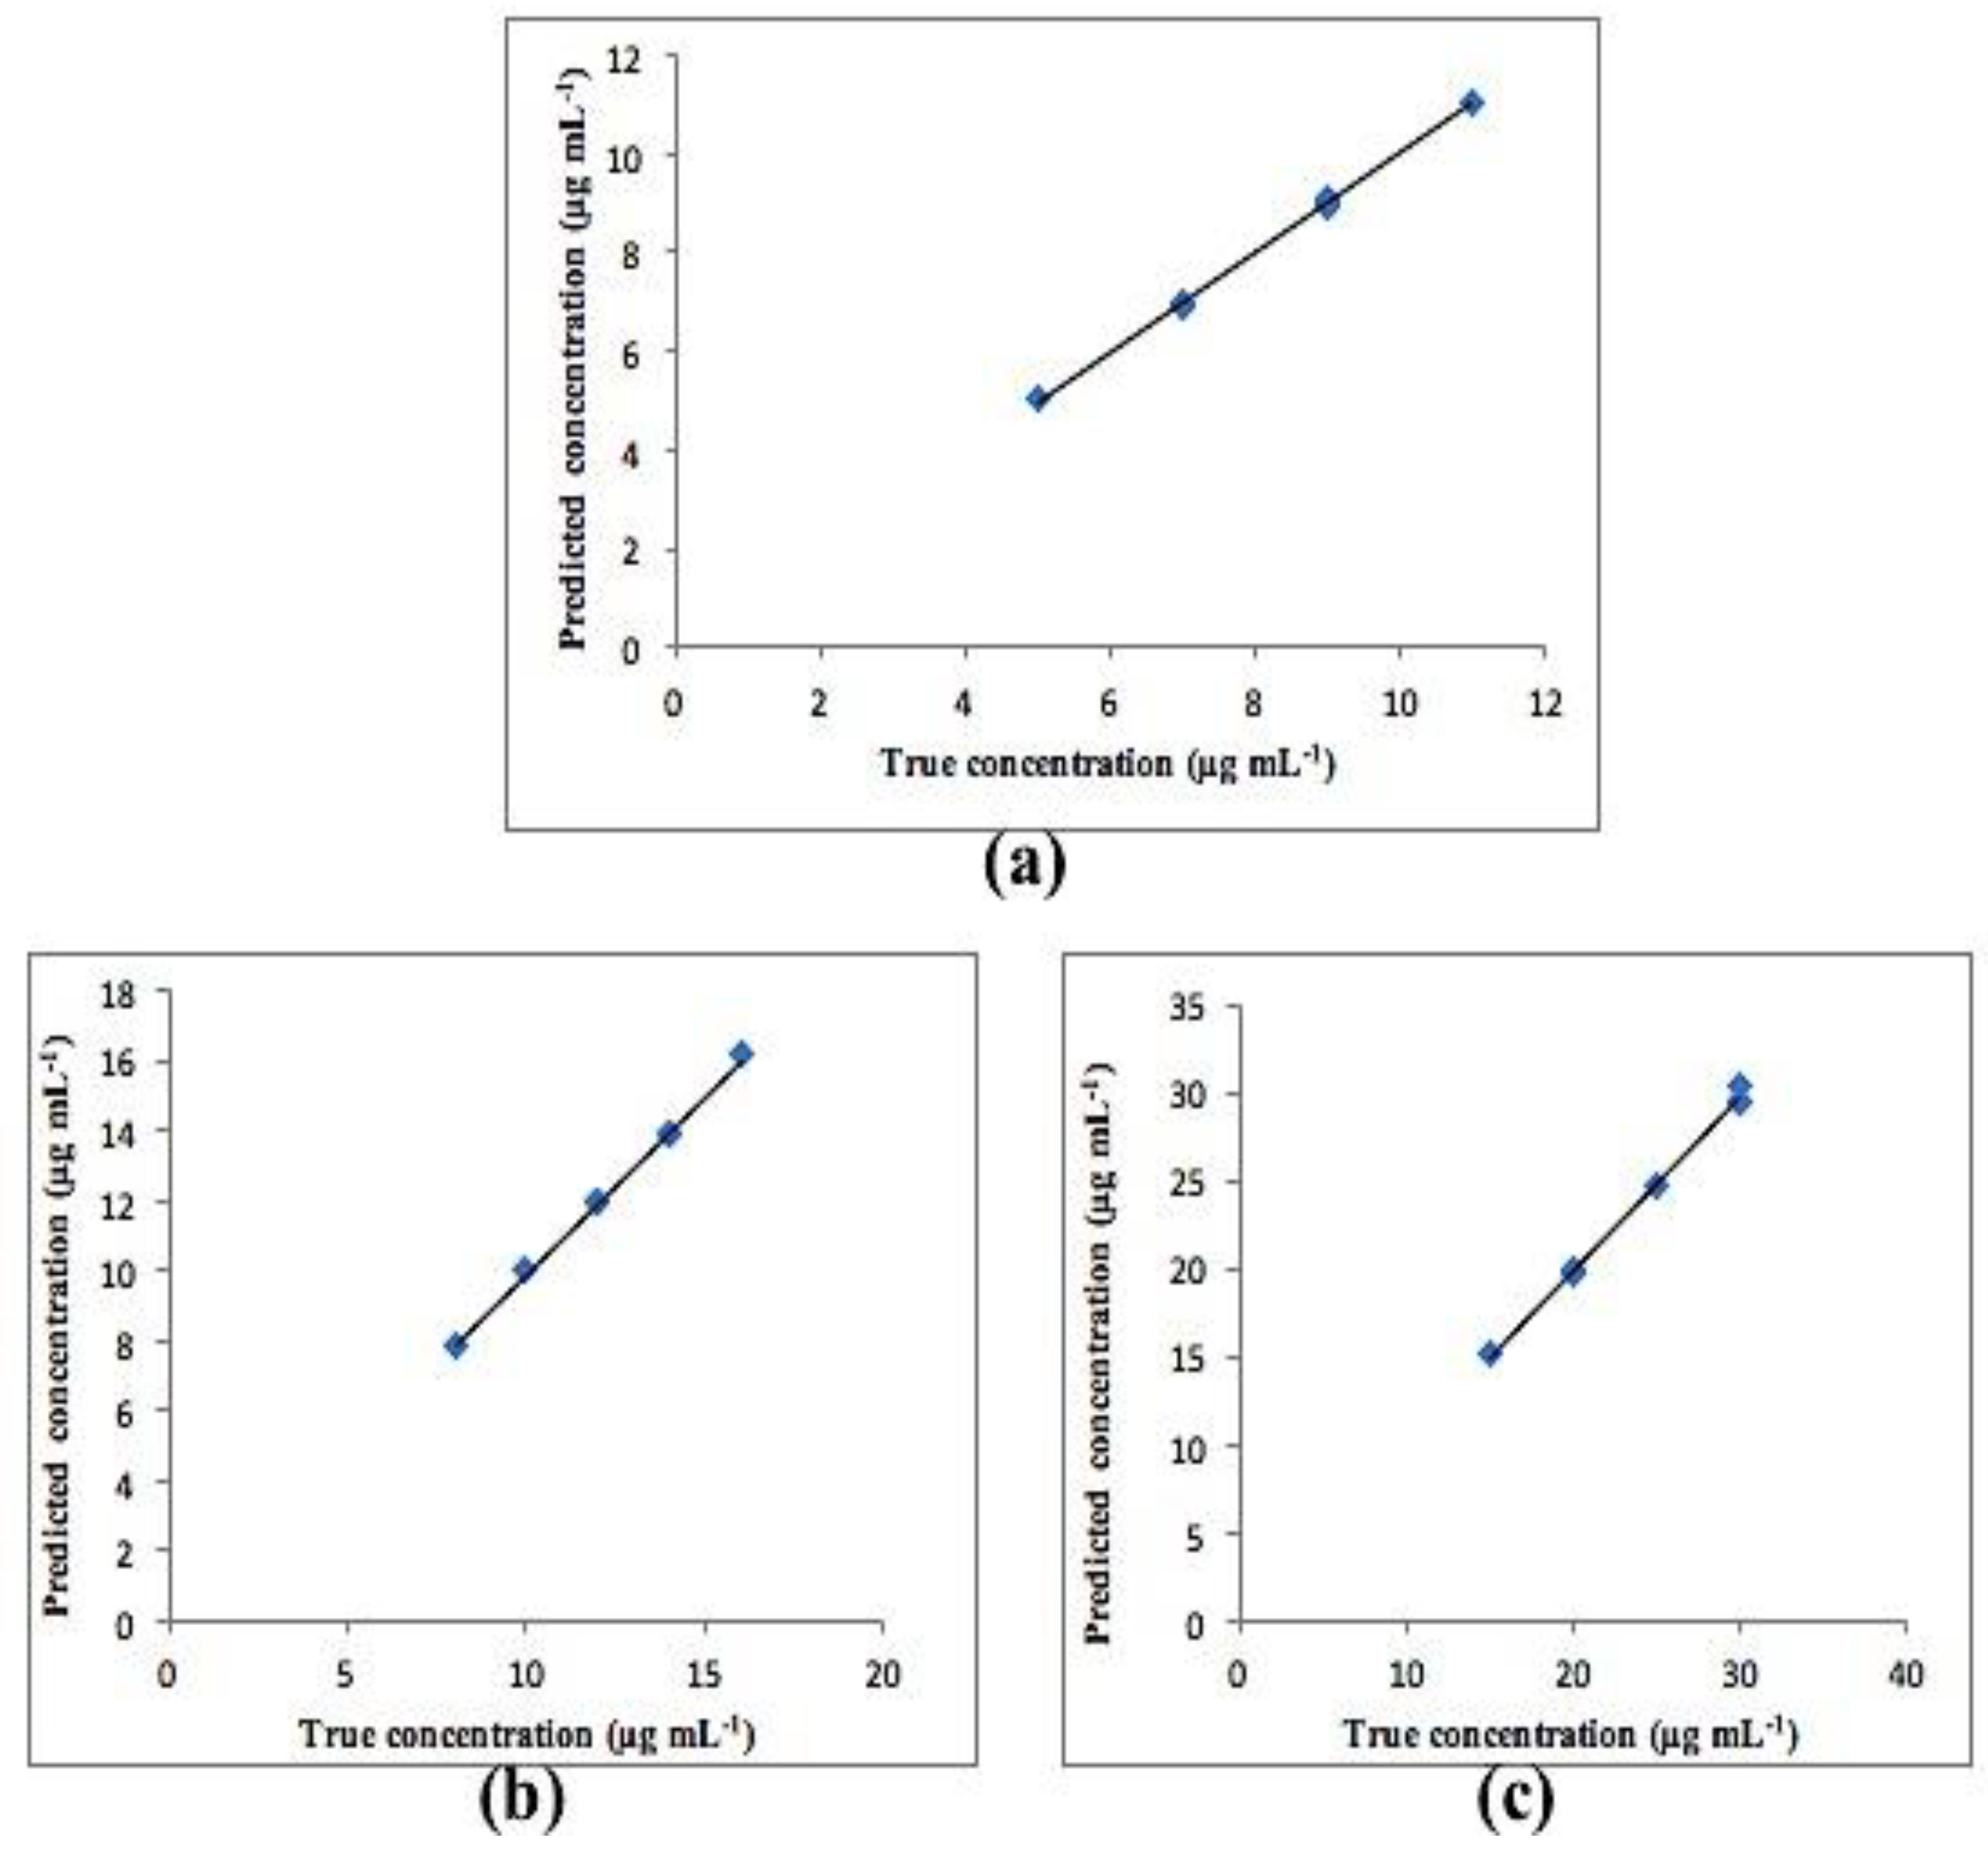
3.2. Chemometric PCR and PLS Methods
3.3. Application on Epicrom Eye Drops
4. Conclusions
Author Contributions
Funding
Conflicts of Interest
References
- Kelly, W. Cromolyn sodium: A review of mechanisms and clinical use in asthma. Drug Intell. Clin. Pharm. 1987, 21, 22–35. [Google Scholar]
- Granucci, E.J.; Griciuc, A.; Mueller, K.A.; Mills, A.N.; Le, H.; Dios, A.M.; McGinty, D.; Pereira, J.; Elmaleh, D.; Berry, J.D.; et al. Cromolyn sodium delays disease onset and is neuroprotective in the SOD1G93A Mouse Model of amyotrophic lateral sclerosis. Sci. Rep. 2019, 9, 17728. [Google Scholar] [CrossRef]
- Jiang, L.; Fang, P.; Septer, S.; Apte, U.; Pritchard, M.T. Inhibition of mast cell degranulation with cromolyn sodium exhibits organ-specific effects in polycystic kidney (PCK) rats. Int. J. Toxicol. 2018, 37, 308–326. [Google Scholar] [CrossRef]
- Hassib, S.T.; El-Zaher, A.A.; Fouad, M.A. Validated stability-indicating derivative and derivative ratio methods for the determination of some drugs used to alleviate respiratory tract disorders and their degradation products. Drug Test Anal. 2011, 3, 306–318. [Google Scholar] [CrossRef]
- Hassib, S.T.; El-Zaher, A.A.; Fouad, M.A. Development and validation of RP-HPLC stability-indicating methods for the determination of butamirate citrate and sodium cromoglycate. J. Chem. Pharm. Res. 2011, 3, 243–258. [Google Scholar]
- The European Pharmacopoeia (EuP), 5th ed.; The Council of Europe: Strasbourg, France, 2004.
- Spath, E.; Gruber, W. Die constitution des khellins (aus Amni visnaga) (I. Mitteil. Über natürliche chromone). Berichte 1938, 71, 106–113. [Google Scholar]
- Geissman, T.A. The Structure of Khellin. J. Am. Chem. Soc. 1949, 71, 1498. [Google Scholar] [CrossRef]
- Geissman, T.A.; Hinreiner, E. Chromones. II. The synthesis of visnaginone. J. Am. Chem. Soc. 1951, 73, 782–786. [Google Scholar] [CrossRef]
- Schonberg, A.; Sina, A. Khellin and allied compounds. J. Am. Chem. Soc. 1950, 72, 1611–1616. [Google Scholar] [CrossRef]
- Tillman, J.; Whymark, D.W. A method for the determination of disodium cromoglycate and other chromones. Analyst 1971, 96, 689–698. [Google Scholar] [CrossRef]
- Ochoa de Aspuru, E.; Zatón, A.M.L. Binding of disodium cromoglycate to human serum albumin. Spectrochim. Acta A Mol. Biomol. Spectrosc. 1998, 54, 983–988. [Google Scholar] [CrossRef]
- Saleh, S.S.; Lotfy, H.M.; Hassan, N.Y.; Elgizawy, S.M. A comparative study of validated spectrophotometric and TLC-spectrodensitometric methods for the determination of sodium cromoglicate and fluorometholone in ophthalmic solution. Saudi Pharm. J. 2013, 21, 411–421. [Google Scholar] [CrossRef] [PubMed]
- Abdel-Aziz, O.; El Kosasy, A.M.; Magdy, N.; El Zahar, N.M. Novel spectroscopic methods for determination of Cromolyn sodium and Oxymetazoline hydrochloride in binary mixture. Spectrochim. Acta A Mol. Biomol. Spectrosc. 2014, 131, 59–66. [Google Scholar] [CrossRef] [PubMed]
- Hegazy, M.A.M.; Al-Ghobashy, M.A.; Eltanany, B.M.; Khattab, F.I. Spectral resolution and simultaneous determination of oxymetazoline hydrochloride and sodium cromoglycate by derivative and ratio-based spectrophotometric methods. Eur. J. Chem. 2015, 6, 319–324. [Google Scholar] [CrossRef]
- Yasmeen, S.; Khatun, S.; Qais, F.A. Characterization of interactions between cromolyn sodium and bovine serum albumin by spectroscopic, calorimetric and computational methods. J. Biomol. Struct. Dyn. 2020, 38, 722–732. [Google Scholar] [CrossRef] [PubMed]
- Fogg, A.G.; Fayad, N. Differential pulse polarographic determination of disodium cromoglycate in urine. Anal. Chim. Acta 1978, 102, 205–210. [Google Scholar] [CrossRef]
- Moreira, J.C.; Foster, S.E.; Rodrigues, J.A.; Fogg, A.G. Differential-pulse adsorptive stripping voltammetric determination of sodium cromoglycate at a hanging mercury drop electrode. Analyst 1992, 117, 989–991. [Google Scholar] [CrossRef]
- Pereira, F.C.; Fogg, A.G.; Zanoni, M.V.B. Regeneration of poly-L-lysine modified carbon electrodes in the accumulation and cathodic stripping voltammetric determination of the cromoglycate anion. Talanta 2003, 60, 1023–1032. [Google Scholar] [CrossRef]
- El Kosasy, A.M.; Abdel-Aziz, O.; Magdy, N.; El Zahar, N.M. Comparative study of different potentiometric ion–selective electrodes for determination of certain polyionic drugs. Int. J. Electrochem. 2016, 11, 3738–3754. [Google Scholar] [CrossRef]
- Helle, A.; Hirsjarvi, S.; Peltonen, L.; Hirvonen, J.; Weidmer, S.K.J. Quantitative determination of drug encapsulation in poly(lactic acid) nanoparticles by capillary electrophoresis. Chromatogr. A 2008, 1178, 248–255. [Google Scholar] [CrossRef]
- Kocic-Pesic, V.; Radulovic, D.; Pecanac, D.; Zivanovic, L. Determination of sodium cromoglycate in pharmaceutical dosage forms using TLC-densitometry. Farmaco 1992, 47, 1563–1567. [Google Scholar] [PubMed]
- Hegazy, M.A.; Al-Ghobashy, M.A.; Eltanany, B.M.; Khattab, F.I. Validated chromatographic methods for the simultaneous determination of sodium cromoglycate and oxymetazoline hydrochloride in a combined dosage form. J. Adv. Chem. 2015, 11, 3850–3859. [Google Scholar]
- Gardner, J.J.J. Determination of sodium cromoglycate in human urine by high-performance liquid chromatography on an anion-exchange column. Chromatogr. B Biomed. Appl. 1984, 305, 228–232. [Google Scholar] [CrossRef]
- Ng, L.L. Reversed-phase liquid chromatographic determination of cromolyn sodium in drug substance and selected dosage forms. J. AOAC Int. 1994, 77, 1689–1694. [Google Scholar] [CrossRef]
- Aswania, O.A.; Corlett, S.A.; Chrystyn, H.J. Development and validation of an ion-pair liquid chromatographic method for the quantitation of sodium cromoglycate in urine following inhalation. Chromatogr. B Biomed. Appl. 1997, 690, 373–378. [Google Scholar] [CrossRef]
- Segall, A.; Vitale, F.; Ricci, R.; Giancaspro, G.; Pizzorno, M.T. High-performance liquid-chromatographic determination of sodium cromoglycate. Drug Dev. Ind. Pharm. 1997, 23, 839–842. [Google Scholar] [CrossRef]
- Fathy, M.E.; Mohamed, S.A.; Elmansi, H.; Belal, F. Simultaneous determination of cromolyn sodium combined dosage forms using isocratic HPLC method. J. Chromatogr. Sci. 2016, 55, 14–22. [Google Scholar] [CrossRef]
- Mawatari, K.; Mashiko, S.; Sate, Y.; Usui, Y.; Iinuma, F.; Watanabe, M. Determination of disodium cromoglycate in human urine by high-performance liquid chromatography with post-column photoirradiation-fluorescence detection. Analyst 1997, 122, 715–717. [Google Scholar] [CrossRef]
- Ozoux, M.L.; Girault, J.; Malgouyat, J.M.; Pasquier, O.J. Determination of sodium cromoglycate in human plasma by liquid chromatography–mass spectrometry in the turbo ion spray mode. Chromatogr. B Biomed. Appl. 2001, 765, 179–185. [Google Scholar] [CrossRef]
- Lin, Z.J.; Abbas, R.; Rusch, L.M.; Shum, L.J. Development and validation of a sensitive liquid chromatographic-tandem mass spectrometric method for the determination of cromolyn sodium in human plasma. Chromatogr. B Anal. Technol. Biomed. Life Sci. 2003, 788, 159–166. [Google Scholar] [CrossRef]
- Liu, X.Y.; Qu, T.T.; Wang, B.J.; Wei, C.M.; Yuan, G.Y.; Zhang, R.; Guo, R.C. Determination of sodium cromoglycate in human plasma by liquid chromatography with tandem mass. Biomed. Chromatogr. 2008, 22, 1021–1027. [Google Scholar] [CrossRef]
- Duhaime, R.M.; Rollins, L.K.; Gorecki, D.J.K.; Lovering, E.G. Liquid chromatographic determination of cromolyn sodium and related compounds in raw materials. J. AOAC Int. 1994, 77, 1439–1442. [Google Scholar] [CrossRef]
- Mansfield, R.; Huang, J.; Thatcher, S.; Miller, R.B.; Davis, C.W. Development and validation of a stability-indicating HPLC method for the determination of cromolyn sodium and its related substances in cromolyn sodium drug substance and cromolyn sodium inhalation solution, 1.0%. J. Liq. Chrom. Relat. Tech. 1999, 22, 2187–2209. [Google Scholar] [CrossRef]
- Barnes, M.; Mansfield, R.; Thatcher, S. The selection of an ion pairing reagent for developing and validating a stability-indicating HPLC method for cromolyn sodium and its known impurities. J. Liq. Chrom. Relat. Tech. 2002, 25, 1721–1745. [Google Scholar] [CrossRef]
- Ali, M.S.; Rafiuddin, S.; Al-Jawi, D.A.; Al-Hetari, Y.; Ghori, M.U.H.; Khatri, A.R. Stability-indicating assay of sodium cromoglicate in ophthalmic solution using mixed-mode hydrophilic interaction chromatography. J. Sep. Sci. 2008, 31, 1645–1650. [Google Scholar] [CrossRef]
- El-Bagary, R.I.; Fouad, M.A.; El-Shal, M.A.; Tolba, E.H. Stability-indicating RP-HPLC methods for the determination of fluorometholone in its mixtures with sodium cromoglycate and tetrahydrozoline hydrochloride. J. Chromatogr. Sci. 2016, 54, 923–933. [Google Scholar] [CrossRef]
- Abbaspour, A.; Mirzajani, R. Simultaneous determination of phenytoin, barbital and caffeine in pharmaceuticals by absorption (zero-order) UV spectra and first-order derivative spectra multivariate calibration methods. J. Pharm. Biomed. Anal. 2005, 38, 420–427. [Google Scholar] [CrossRef]
- Gadila, S.; Batchu, S.; Lade, S. Development and validation of liquid chromatographic and UV derivative spectrophotometric methods for the determination of famciclovir in pharmaceutical dosage forms. Chem. Pharm. Bull. 2006, 54, 819–822. [Google Scholar]
- El Bagary, R.I.; Elkady, E.F.; Ayoub, B.M. Spectroflourometric and spectrophotometric methods for the determination of sitagliptin in binary mixture with metformin and ternary mixture with metformin and sitagliptin alkaline degradation product. Int. J. Biomed. Sci. 2011, 7, 62–69. [Google Scholar]
- Abdel-Ghany, M.F.; Abdel-Aziz, O.; Ayad, M.F.; Tadros, M.M. Validation of different spectrophotometric methods for determination of vildagliptin and metformin in binary mixture. Spectrochim. Acta A Mol. Biomol. Spectrosc. 2014, 125, 175–182. [Google Scholar] [CrossRef]
- Mowaka, S.; Ayoub, B.M.; Hassan, M.A.; Zaghary, W.A. Different spectrophotometric methods for simultaneous determination of trelagliptin and its acid degradation product. J. Anal. Methods Chem. 2018, 2018, 1–7. [Google Scholar] [CrossRef]
- Afkhami, A.; Bahram, M. Mean centering of ratio spectra as a new spectrophotometric method for the analysis of binary and ternary mixtures. Talanta 2005, 66, 712–720. [Google Scholar] [CrossRef] [PubMed]
- Afkhami, A.; Bahram, M. A novel spectrophotometric method for the simultaneous kinetic analysis of ternary mixtures by mean centering of ratio kinetic profiles. Talanta 2006, 68, 1148–1155. [Google Scholar] [CrossRef]
- Abdelwahab, N.S.; Nouruddin, W.; Fatatry, H.M.E.; Osman, W. Determination of thiomersal, lidocaine and phenylepherine in their ternary mixture. J. Chromatogr. Sep. Tech. 2013, 4, 1–6. [Google Scholar] [CrossRef]
- Moustafa, A.A.; Salem, H.; Hegazy, M.; Ali, O. Evaluating the efficiency of spectral resolution of univariate methods manipulating ratio spectra and comparing to multivariate methods: An application to ternary mixture in common cold preparation. Spectrochim. Acta A Mol. Biomol. Spectrosc. 2015, 137, 1363–1373. [Google Scholar] [CrossRef] [PubMed]
- Abdel Ghany, M.F.; Hussein, L.A.; Ayad, M.F.; Youssef, M.M. Investigation of different spectrophotometric and chemometric methods for determination of entacapone, levodopa and carbidopa in ternary mixture. Spectrochim. Acta A Mol. Biomol. Spectrosc. 2017, 171, 236–245. [Google Scholar] [CrossRef] [PubMed]
- Brereton, R. Multilevel multifactor designs for multivariate calibration. Analyst 1997, 122, 1521–1529. [Google Scholar] [CrossRef]
- Kramer, R. Chemometric Techniques for Quantitative Analysis; Marcel Dekker: New York, NY, USA, 1998. [Google Scholar]
- Haaland, D.M.; Thomas, E.V. Partial least-squares methods for spectral analyses. 1. Relation to other quantitative calibration methods and the extraction of qualitative information. Anal. Chem. 1988, 60, 1193–1202. [Google Scholar] [CrossRef]
- Haaland, D.M. Quantitative infrared analysis of borophosphosilicate films using multivariate statistical methods. Anal. Chem. 1988, 60, 1208–1217. [Google Scholar] [CrossRef]
- Hemmateenejad, B.; Akhond, M.; Samari, F. A comparative study between PCR and PLS in simultaneous spectrophotometric determination of diphenylamine, aniline, and phenol: Effect of wavelength selection. Spectrochim. Acta A Mol. Biomol. Spectrosc. 2007, 67, 958–965. [Google Scholar] [CrossRef]
- Abdel-Aziz, O.; El Kosasy, A.M.; Okeil, S.M.E. Comparative study for determination of some polycyclic aromatic hydrocarbons ‘PAHs’ by a new spectrophotometric method and multivariate calibration coupled with dispersive liquid–liquid extraction. Spectrochim. Acta A Mol. Biomol. Spectrosc. 2014, 133, 119–129. [Google Scholar] [CrossRef] [PubMed]
- Abdel-Hameed, E.A.; Abdel-Salam, R.A.; Hadad, G.M. Chemometric-assisted spectrophotometric methods and high performance liquid chromatography for simultaneous determination of seven β-blockers in their pharmaceutical products: A comparative study. Spectrochim. Acta A Mol. Biomol. Spectrosc. 2015, 141, 278–286. [Google Scholar] [CrossRef] [PubMed]
- El-Kosasy, A.M.; Abdel-Aziz, O.; Magdy, N.; El Zahar, N.M. Spectrophotometric and chemometric methods for determination of imipenem, ciprofloxacin hydrochloride, dexamethasone sodium phosphate, paracetamol and cilastatin sodium in human urine. Spectrochim. Acta A Mol. Biomol. Spectrosc. 2016, 157, 26–33. [Google Scholar] [CrossRef] [PubMed]
- Albayrak, M.; Demirkaya-Miloglu, F.; Senol, O.; Polatdemir, E. Design, optimization, and validation of chemometrics-assisted spectrophotometric methods for simultaneous determination of etodolac and thiocolchicoside in pharmaceuticals. J. Anal. Sci. Technol. 2019, 10, 1–8. [Google Scholar] [CrossRef]
- Wold, S.; Albano, C.; Dunn III, W.J.; Esbensen, K.; Hellberg, S.; Johansson, E.; Sjöström, M. Food Research and Data Analysis; Martens, H., Russworm, H., Eds.; Applied Science Publishers: London, UK, 1983. [Google Scholar]
- Martens, H.; Næs, T. Near-Infrared Technology in Agricultural and Food Industries; Williams, P.C., Norris, K., Eds.; American Association of Cereal Chemists: St. Paul, MN, USA, 1987. [Google Scholar]
- Pham-Gia, T.; Duong, Q.P. The generalized beta- and F-distributions in statistical modelling. Math. Comp. Model. 1989, 12, 1613–1625. [Google Scholar] [CrossRef]
- Brereton, R.G. Introduction to multivariate calibration in analytical chemistry. Analyst 2000, 125, 2125–2154. [Google Scholar] [CrossRef]



| Parameters | Method | ||
|---|---|---|---|
| CS | Deg1 | Deg2 | |
| λ nm | 367.8 | 373.8 | 310.6 |
| Concentration range (µg mL−1) | 2.00–40.00 | 5.00–40.00 | 10.00–100.00 |
| Linearity | |||
| Slope | 92.022 | 12.053 | 11.203 |
| Intercept | 10.890 | −35.255 | −36.903 |
| Correlation coefficient (r) | 0.9999 | 0.9995 | 0.9999 |
| Accuracy (Mean ± SD) | 99.91 ± 1.33 | 100.28 ± 1.44 | 100.61 ± 1.55 |
| Selectivity (Mean ± SD) | 100.18 ± 1.29 | 100.79 ± 1.62 | 100.54 ± 1.59 |
| Precision (% RSD) | |||
| Repeatability a | 0.56% | 0.94% | 0.99% |
| Intermediate precision b | 0.92% | 1.54% | 1.85% |
| LOD c (µg mL−1) | 0.22 | 0.37 | 0.95 |
| LOQ c (µg mL−1) | 0.67 | 1.13 | 2.89 |
| Mixture no. | Claimed Taken (µg mL−1) | MCR Method | ||||
|---|---|---|---|---|---|---|
| CS | Deg1 | Deg2 | CS Recovery % * | Deg1 Recovery% * | Deg2 Recovery % * | |
| 1 | 13 | 10 | 30 | 100.46 | 100.70 | 99.03 |
| 2 | 7 | 12 | 10 | 100.14 | 101.58 | 102.10 |
| 3 | 9 | 12 | 20 | 99.22 | 98.03 | 98.65 |
| 4 | 11 | 16 | 25 | 102.18 | 101.56 | 101.20 |
| 5 | 9 | 10 | 15 | 98.88 | 102.10 | 101.73 |
| Mean ± SD | 100.18 ± 1.29 | 100.79 ± 1.62 | 100.54 ± 1.59 | |||
| Mixture no. | CS | Deg1 | Deg2 |
|---|---|---|---|
| 1 * | 9 | 12 | 20 |
| 2 | 9 | 8 | 10 |
| 3 | 5 | 8 | 30 |
| 4 | 5 | 16 | 10 |
| 5 | 13 | 10 | 30 |
| 6 | 7 | 16 | 20 |
| 7 | 13 | 12 | 15 |
| 8 | 9 | 10 | 15 |
| 9 | 7 | 10 | 25 |
| 10 * | 7 | 14 | 30 |
| 11 | 11 | 16 | 25 |
| 12 | 13 | 14 | 20 |
| 13 * | 11 | 12 | 30 |
| 14 * | 9 | 16 | 30 |
| 15 | 13 | 16 | 10 |
| 16 | 13 | 8 | 25 |
| 17 | 5 | 14 | 10 |
| 18 | 11 | 8 | 20 |
| 19 | 5 | 12 | 25 |
| 20 * | 9 | 14 | 25 |
| 21 | 11 | 14 | 15 |
| 22 | 11 | 10 | 10 |
| 23 * | 7 | 8 | 15 |
| 24 * | 5 | 10 | 20 |
| 25 | 7 | 12 | 10 |
| Parameters | PCR | PLS-2 | ||||
|---|---|---|---|---|---|---|
| CS | Deg1 | Deg2 | CS | Deg1 | Deg2 | |
| Conc. Range (µg mL−1) | 5.00–13.00 | 8.00–16.00 | 10.00–30.00 | 5.00–13.00 | 8.00–16.00 | 10.00–30.00 |
| No. of Factors | 4 | 4 | 4 | 4 | 4 | 4 |
| RMSEC a | 0.13005 | 0.13643 | 0.47471 | 0.13077 | 0.13798 | 0.46723 |
| RMSEP b | 0.09055 | 0.17889 | 0.55263 | 0.09220 | 0.17720 | 0.55654 |
| RMSECV c | 0.16976 | 0.19893 | 0.68146 | 0.171 | 0.19925 | 0.67982 |
| Arithmetic mean (Conc. Range) | 9.00 | 12.00 | 20.00 | 9.00 | 12.00 | 20.00 |
| (%RSD) for RMSEC d | 0.01445 | 0.01136 | 0.02373 | 0.01453 | 0.01149 | 0.02336 |
| (%RSD) for RMSEP e | 0.01006 | 0.01490 | 0.02763 | 0.01024 | 0.01476 | 0.02782 |
| (%RSD) for RMSECV f | 0.01886 | 0.01657 | 0.03407 | 0.019 | 0.01660 | 0.03399 |
| Intercept g | −0.0428 | −0.2005 | 0.0794 | −0.0483 | −0.1993 | 0.0574 |
| Slope d | 1.0053 | 1.0124 | 0.9870 | 1.0058 | 1.0120 | 0.9879 |
| Correlation Coefficient (r d) | 0.9995 | 0.9992 | 0.9989 | 0.9994 | 0.9992 | 0.9988 |
| Mix. No. | PCR | PLS-2 | ||||
|---|---|---|---|---|---|---|
| Found% | Found% | |||||
| CS | Deg1 | Deg2 | CS | Deg1 | Deg2 | |
| 1 | 100.33 | 99.67 | 98.25 | 100.22 | 99.58 | 98.10 |
| 10 | 98.71 | 99.07 | 100.83 | 98.71 | 99.07 | 100.87 |
| 13 | 100.36 | 99.42 | 98.10 | 100.36 | 99.33 | 98.13 |
| 14 | 100.78 | 100.88 | 98.47 | 100.89 | 100.88 | 98.50 |
| 20 | 99.00 | 98.86 | 98.52 | 99.00 | 98.86 | 98.44 |
| 23 | 100.14 | 98.13 | 100.47 | 100.00 | 98.25 | 100.47 |
| 24 | 100.60 | 100.70 | 98.85 | 100.60 | 100.60 | 98.95 |
| Mean | 99.99 | 99.53 | 99.07 | 99.97 | 99.51 | 99.07 |
| RMSEP * | 0.09055 | 0.17889 | 0.55263 | 0.09220 | 0.17720 | 0.55654 |
| Pharmaceutical Formulation | MCR | PCR | PLS | ||||||
|---|---|---|---|---|---|---|---|---|---|
| Epicrom Eye Drops Labeled to Contain 40 mg of CS Per 1 mL | Found * % ± SD | Added (µg mL−1) | Recovery * % | Found * % SD | Added (µg mL−1) | Recovery * % | Found * % ± SD | Added (µg mL−1) | Recovery * % |
| 102.96 ± 1.22 | 3.00 | 98.67 | 102.40 ± 0.83 | 1 | 99.00 | 101.75 ± 0.69 | 1 | 101.00 | |
| 5.00 | 101.80 | 2 | 101.50 | 2 | 99.50 | ||||
| 10.00 | 100.90 | 3 | 101.67 | 3 | 101.33 | ||||
Sample Availability: Samples of the compounds are not available from the authors. |
Publisher’s Note: MDPI stays neutral with regard to jurisdictional claims in published maps and institutional affiliations. |
© 2020 by the authors. Licensee MDPI, Basel, Switzerland. This article is an open access article distributed under the terms and conditions of the Creative Commons Attribution (CC BY) license (http://creativecommons.org/licenses/by/4.0/).
Share and Cite
El Zahar, N.M.; Tadros, M.M.; Ayoub, B.M. Development of Advanced Chemometric-Assisted Spectrophotometric Methods for the Determination of Cromolyn Sodium and Its Alkaline Degradation Products. Molecules 2020, 25, 5953. https://doi.org/10.3390/molecules25245953
El Zahar NM, Tadros MM, Ayoub BM. Development of Advanced Chemometric-Assisted Spectrophotometric Methods for the Determination of Cromolyn Sodium and Its Alkaline Degradation Products. Molecules. 2020; 25(24):5953. https://doi.org/10.3390/molecules25245953
Chicago/Turabian StyleEl Zahar, Noha M., Mariam M. Tadros, and Bassam M. Ayoub. 2020. "Development of Advanced Chemometric-Assisted Spectrophotometric Methods for the Determination of Cromolyn Sodium and Its Alkaline Degradation Products" Molecules 25, no. 24: 5953. https://doi.org/10.3390/molecules25245953
APA StyleEl Zahar, N. M., Tadros, M. M., & Ayoub, B. M. (2020). Development of Advanced Chemometric-Assisted Spectrophotometric Methods for the Determination of Cromolyn Sodium and Its Alkaline Degradation Products. Molecules, 25(24), 5953. https://doi.org/10.3390/molecules25245953


