Antiproliferative and Antiangiogenic Properties of New VEGFR-2-targeting 2-thioxobenzo[g]quinazoline Derivatives (In Vitro)

 , , , , and
Abstract
1. Introduction
2. Results and Discussion
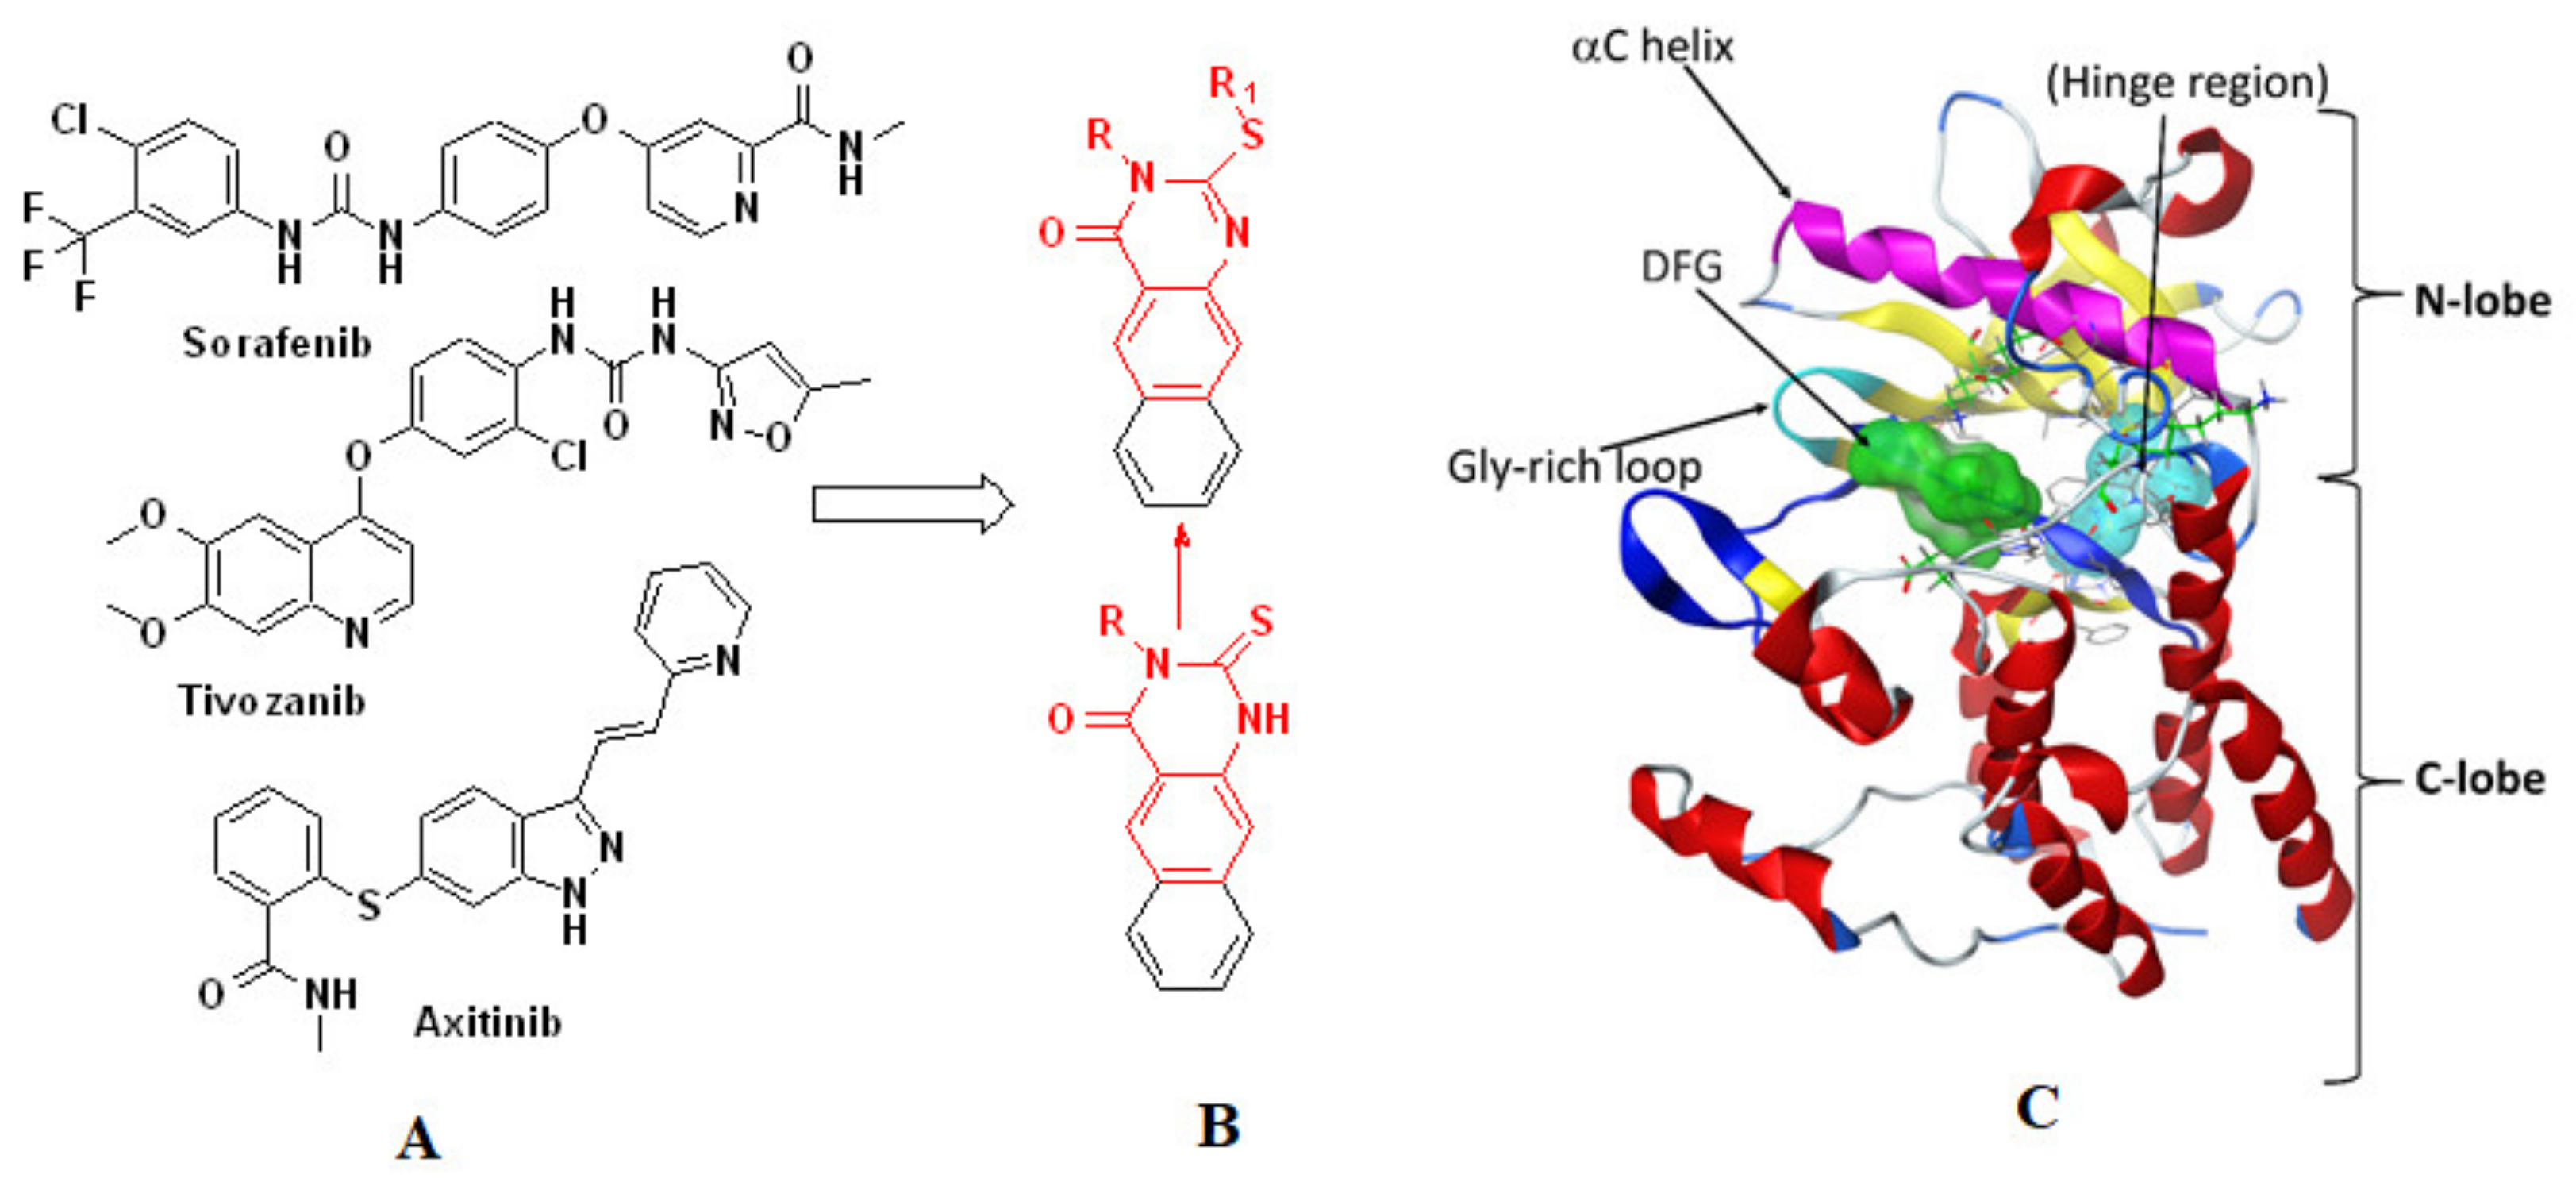
2.1. Chemistry
2.2. Biology
2.2.1. Antiproliferative Activity
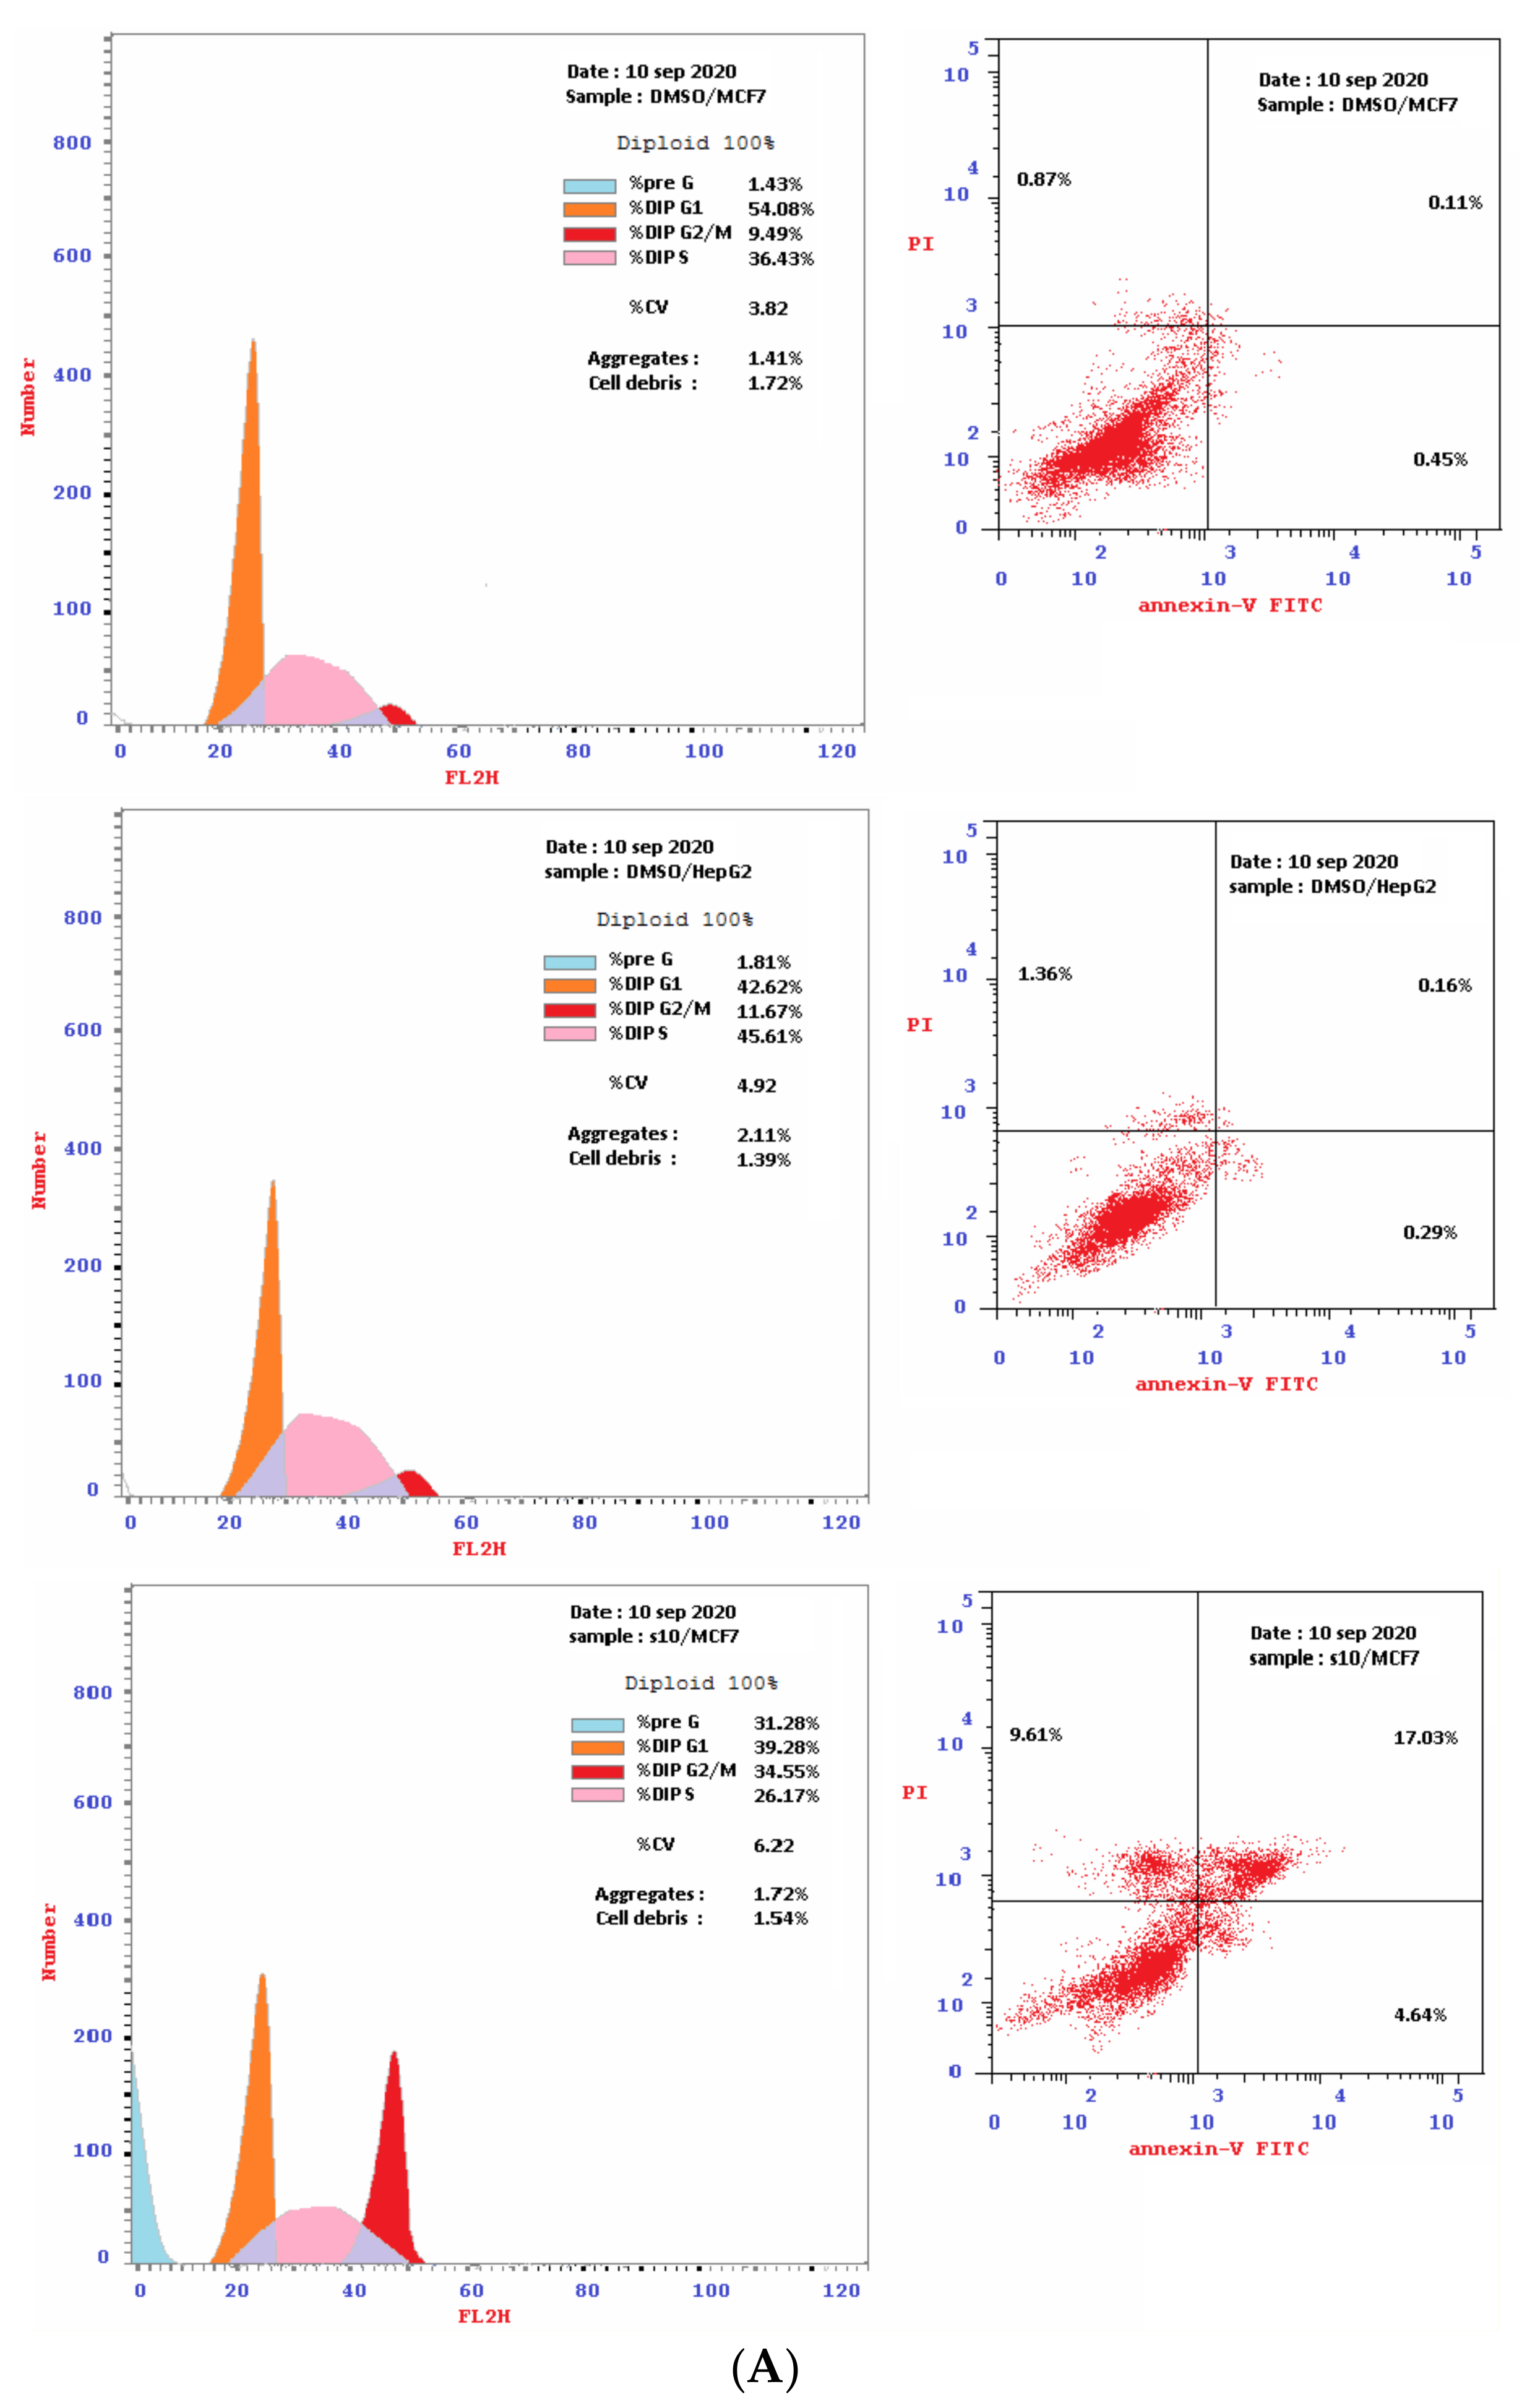
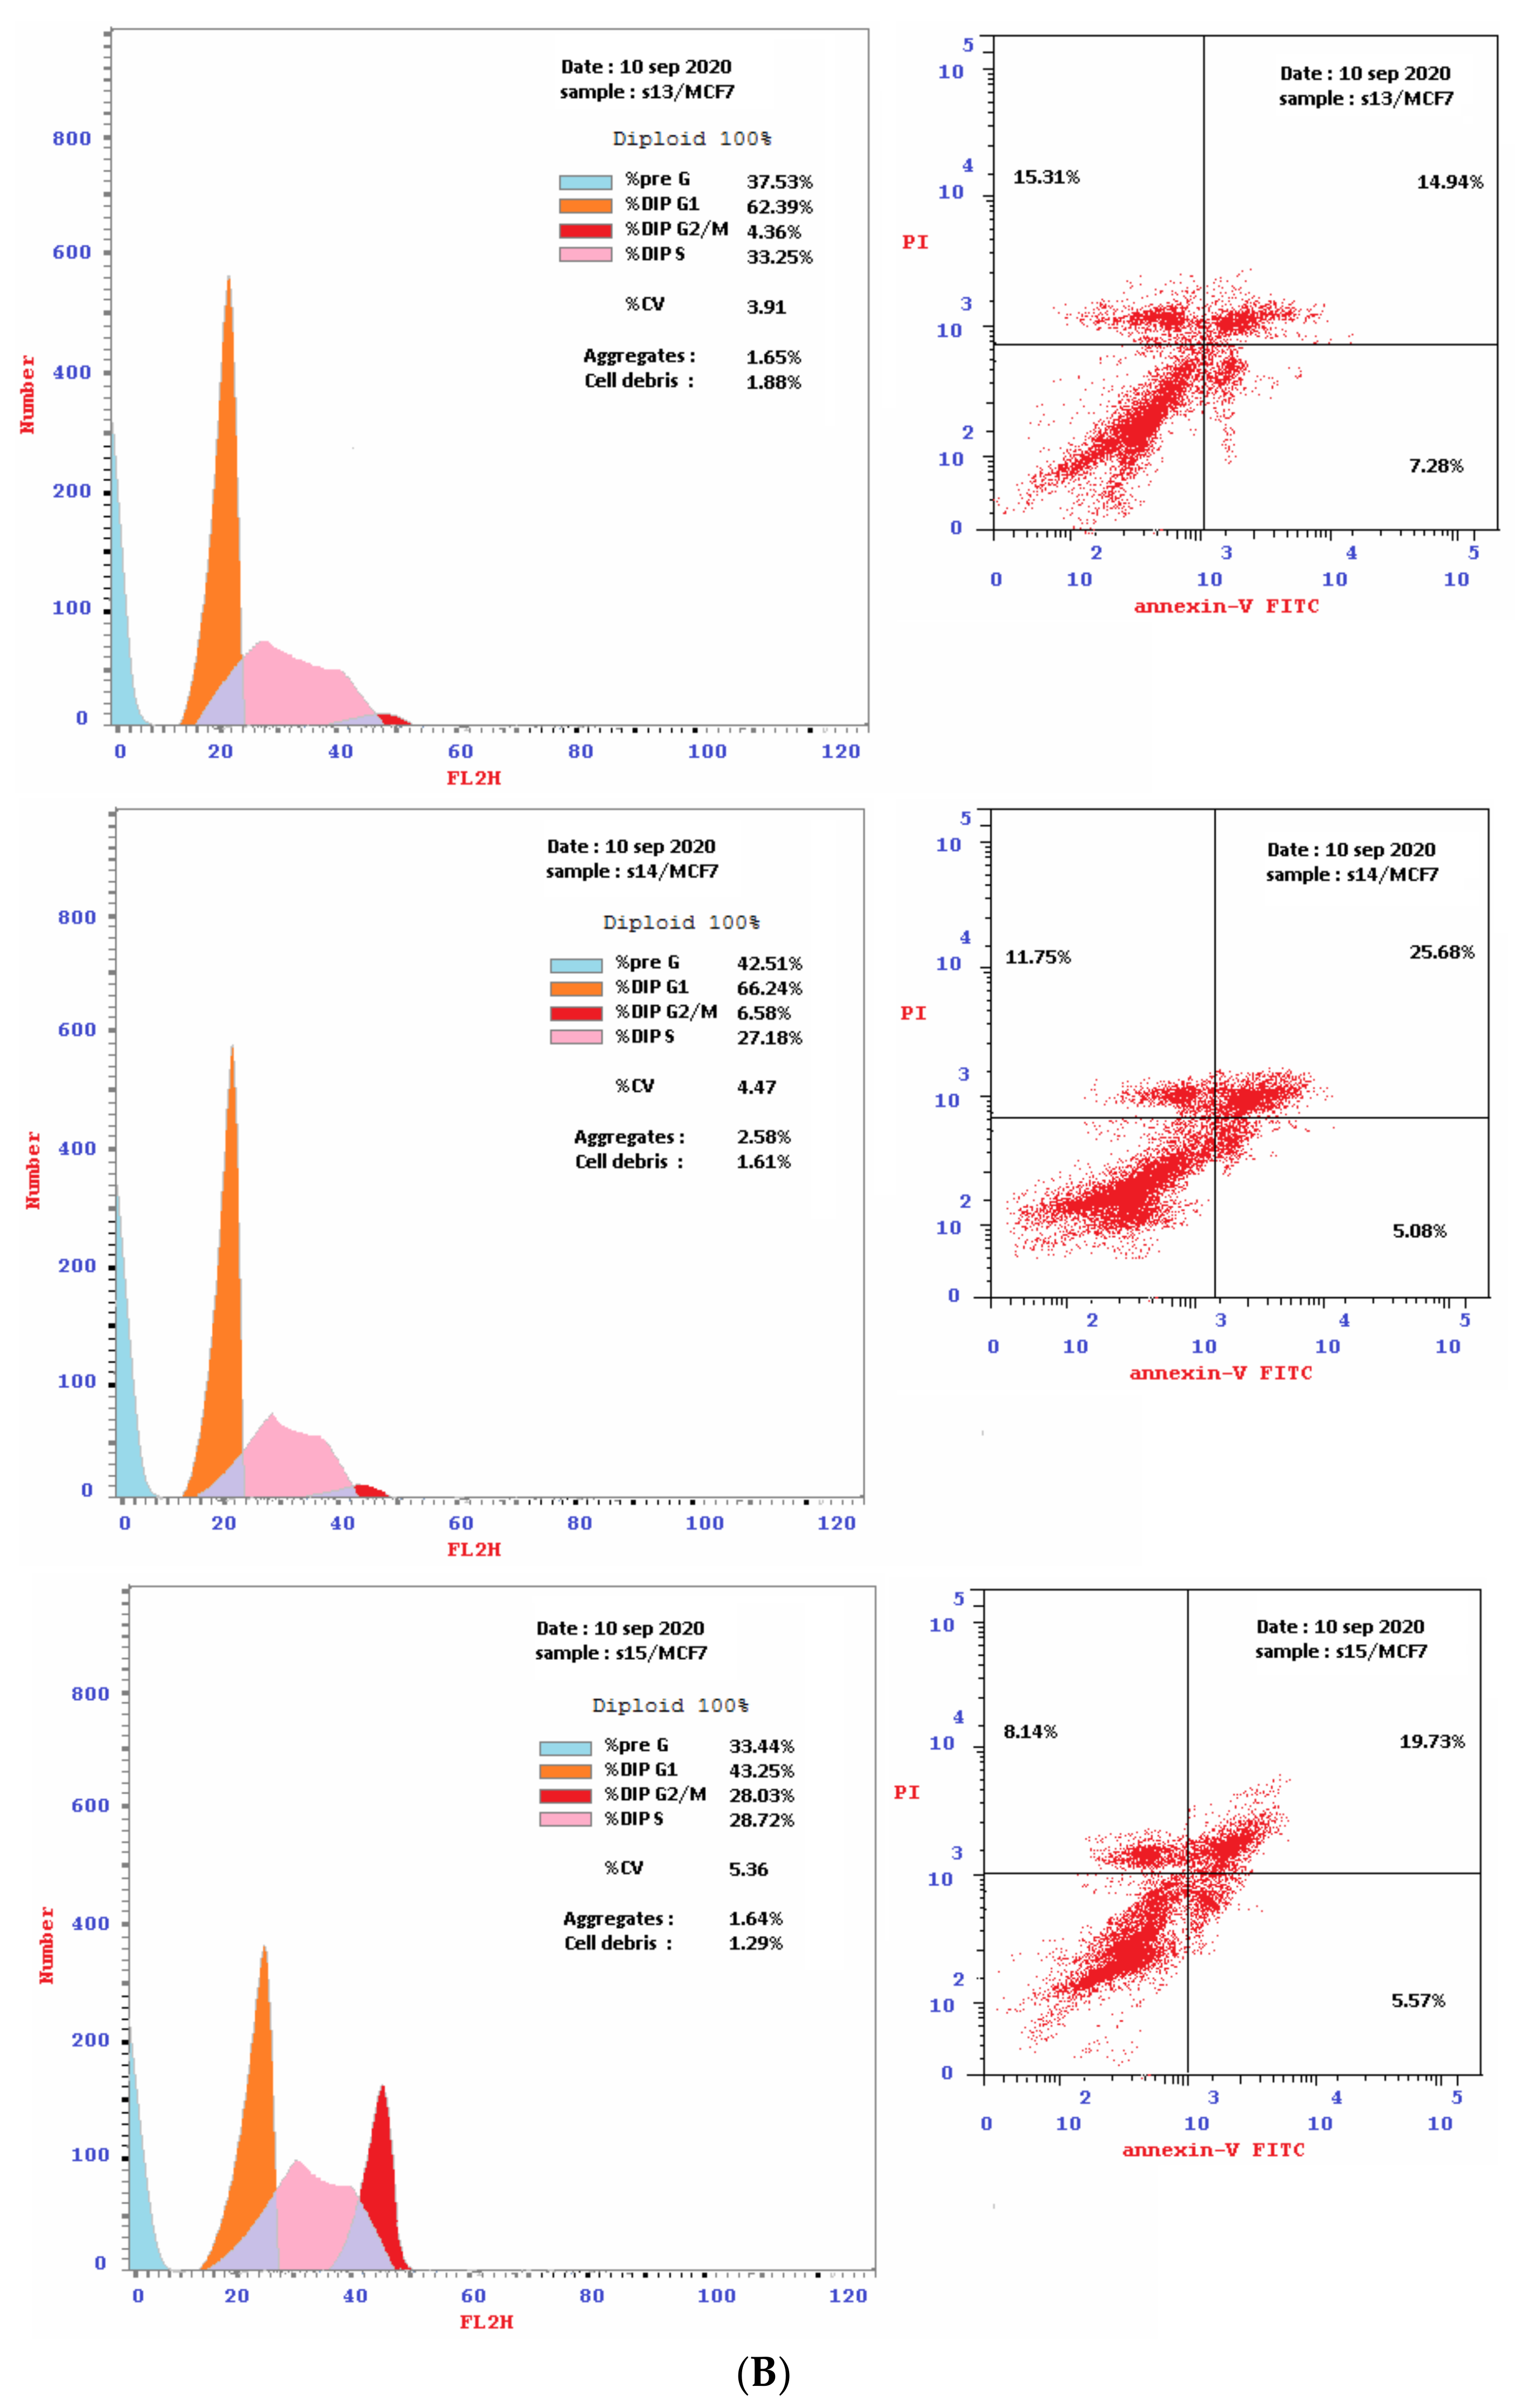
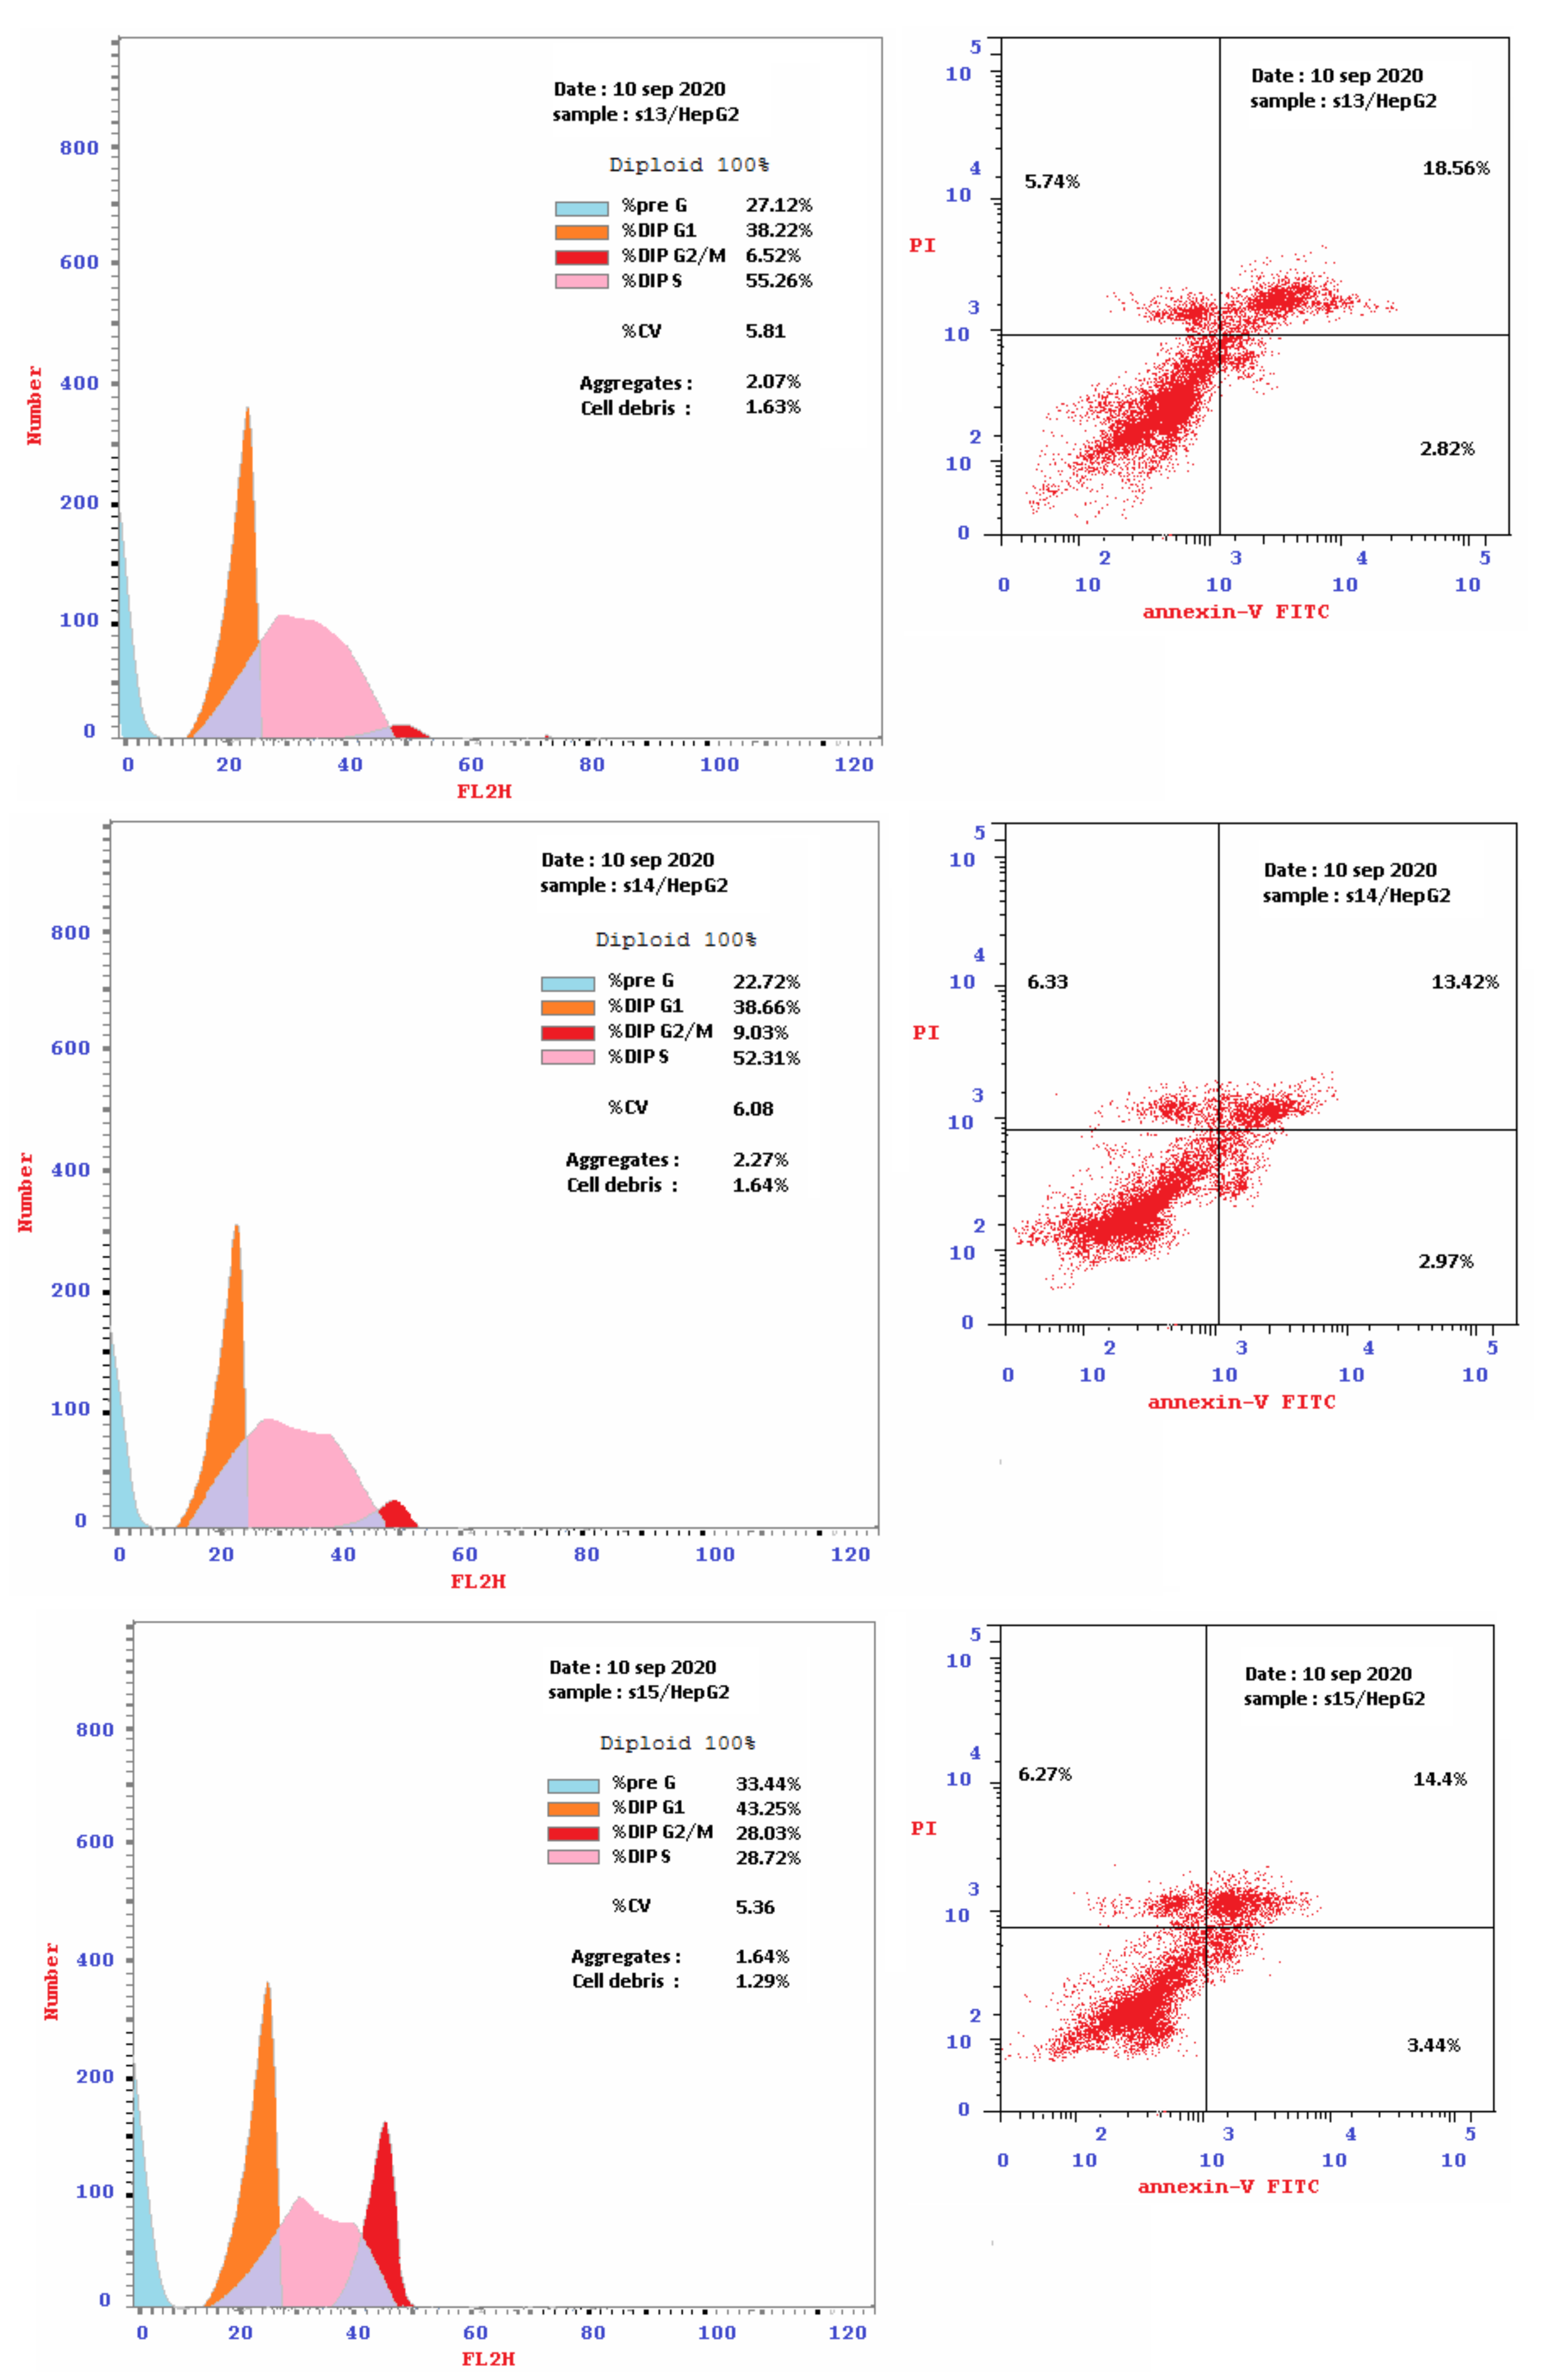
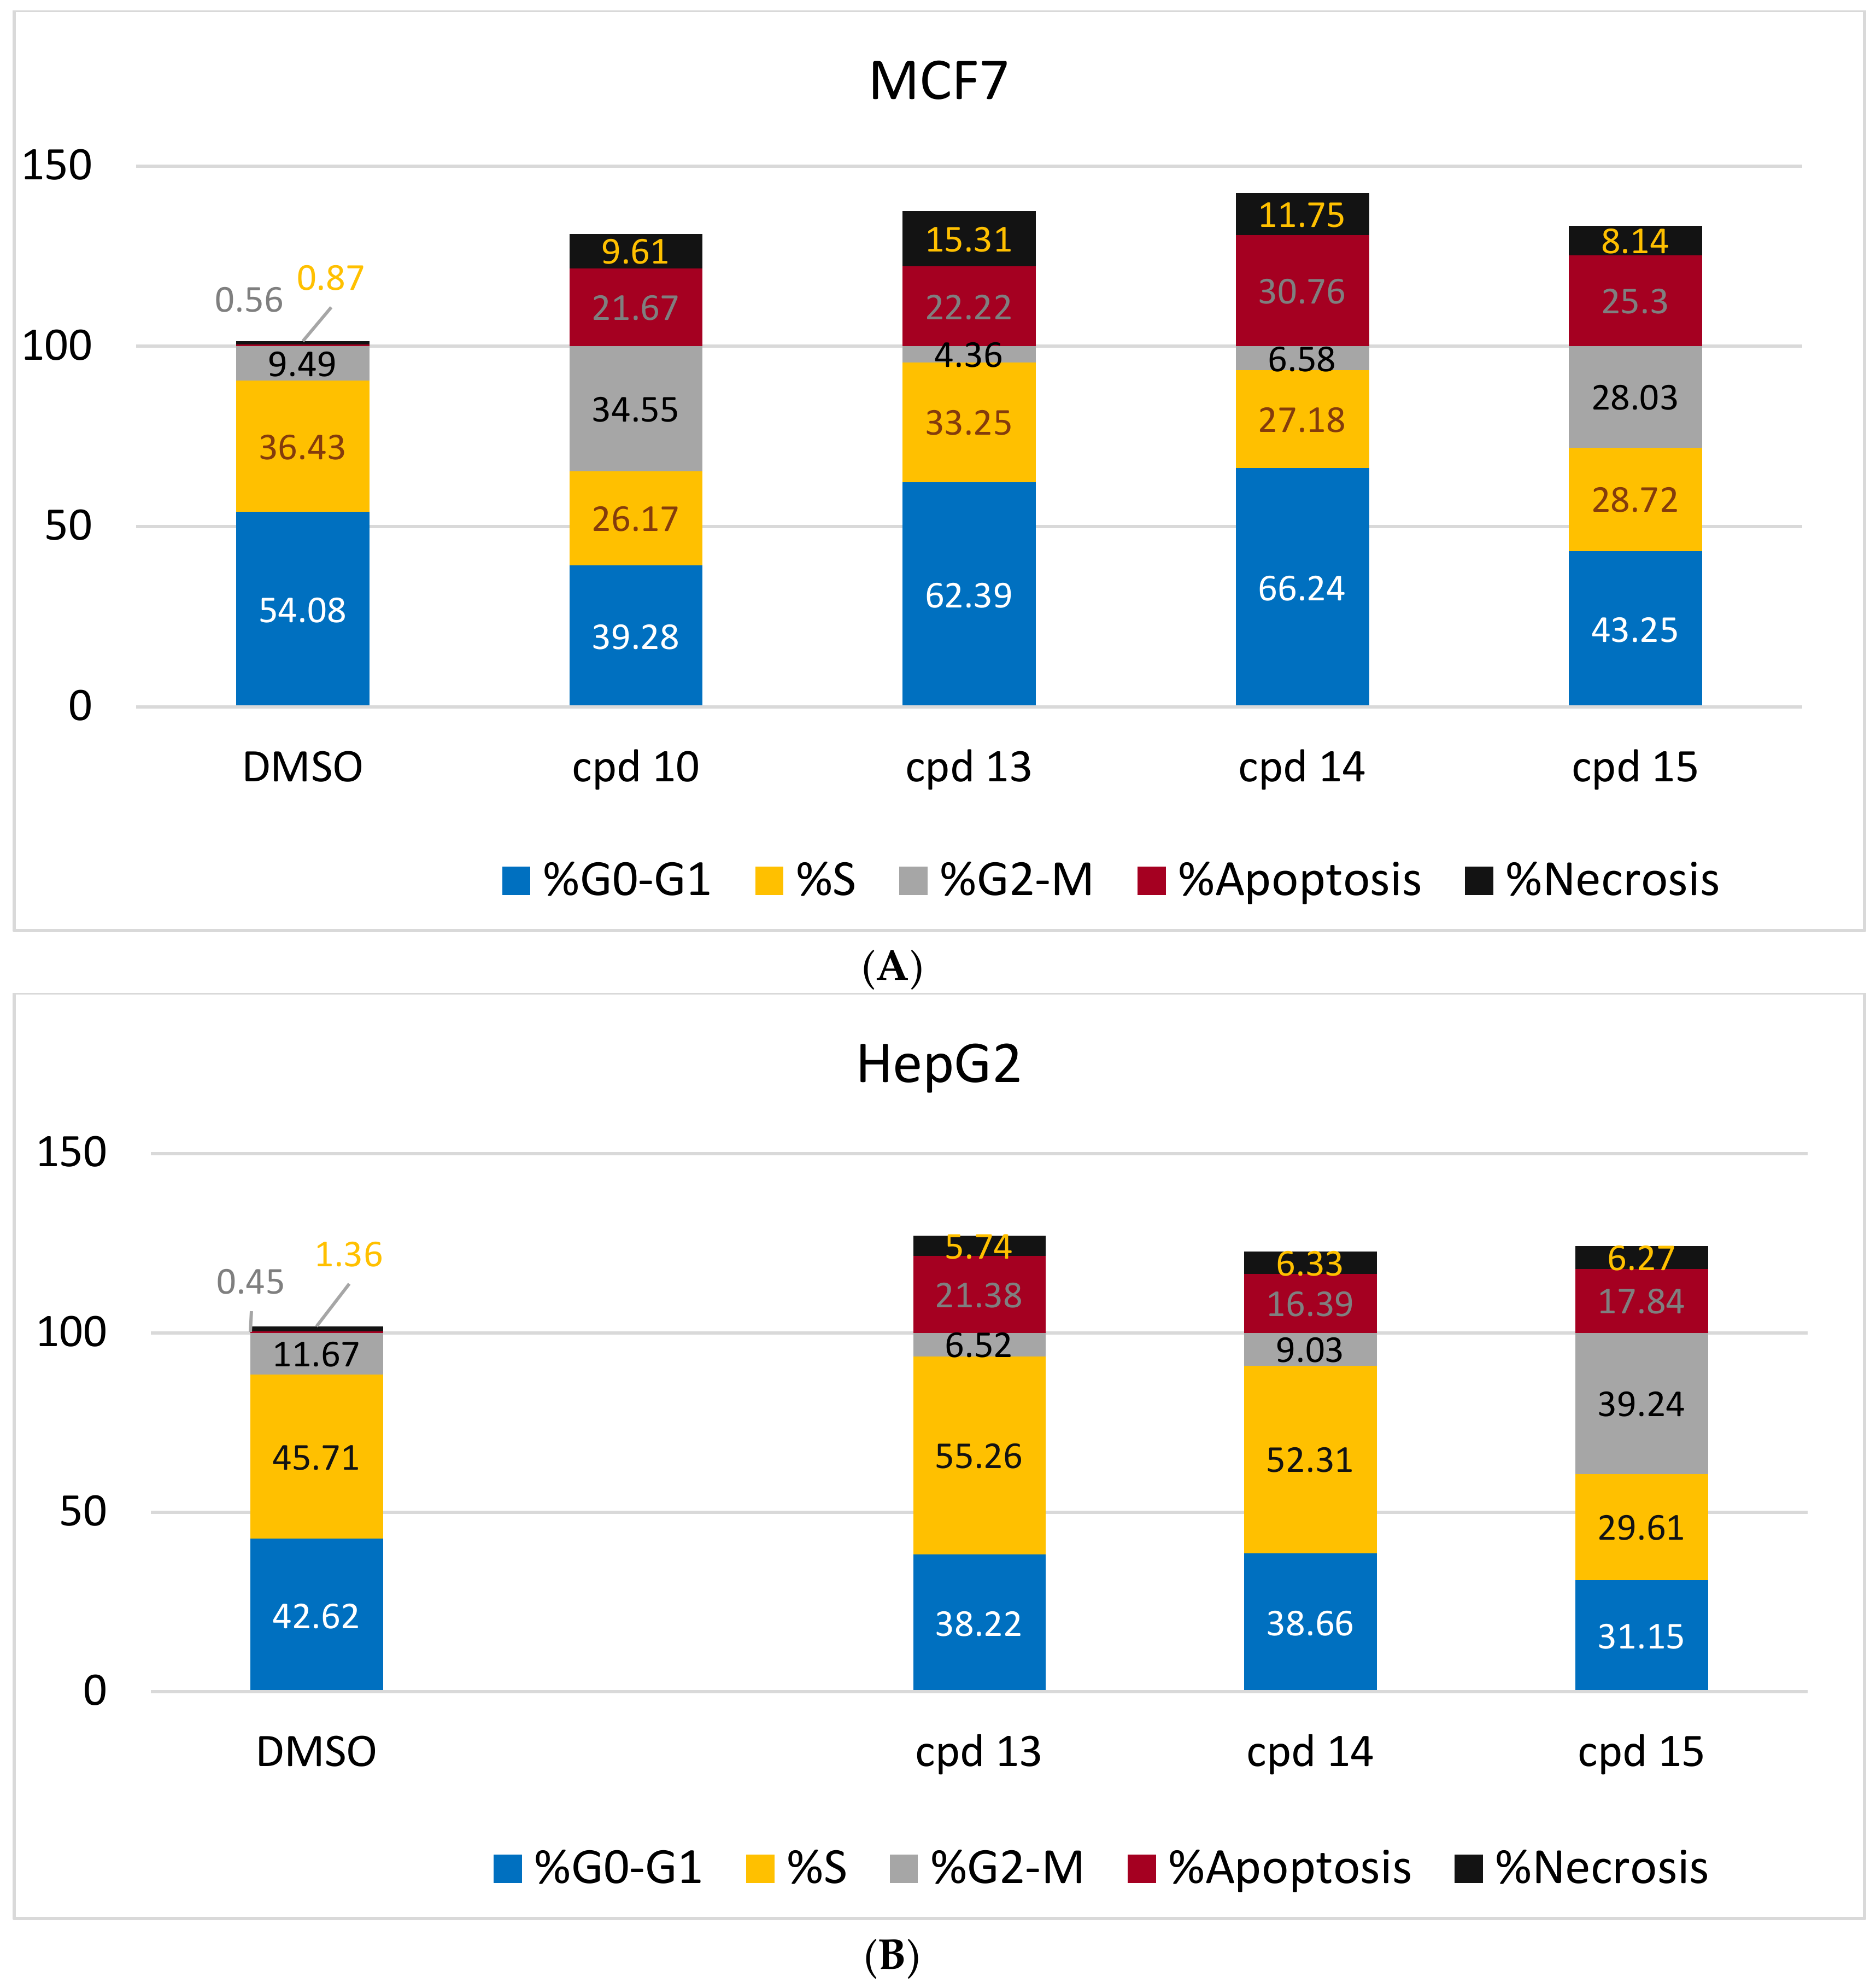
2.2.2. Flow Cytometry Cell-Cycle Analysis
2.2.3. Detection of Apoptosis
Double Staining with V and PI Dyes
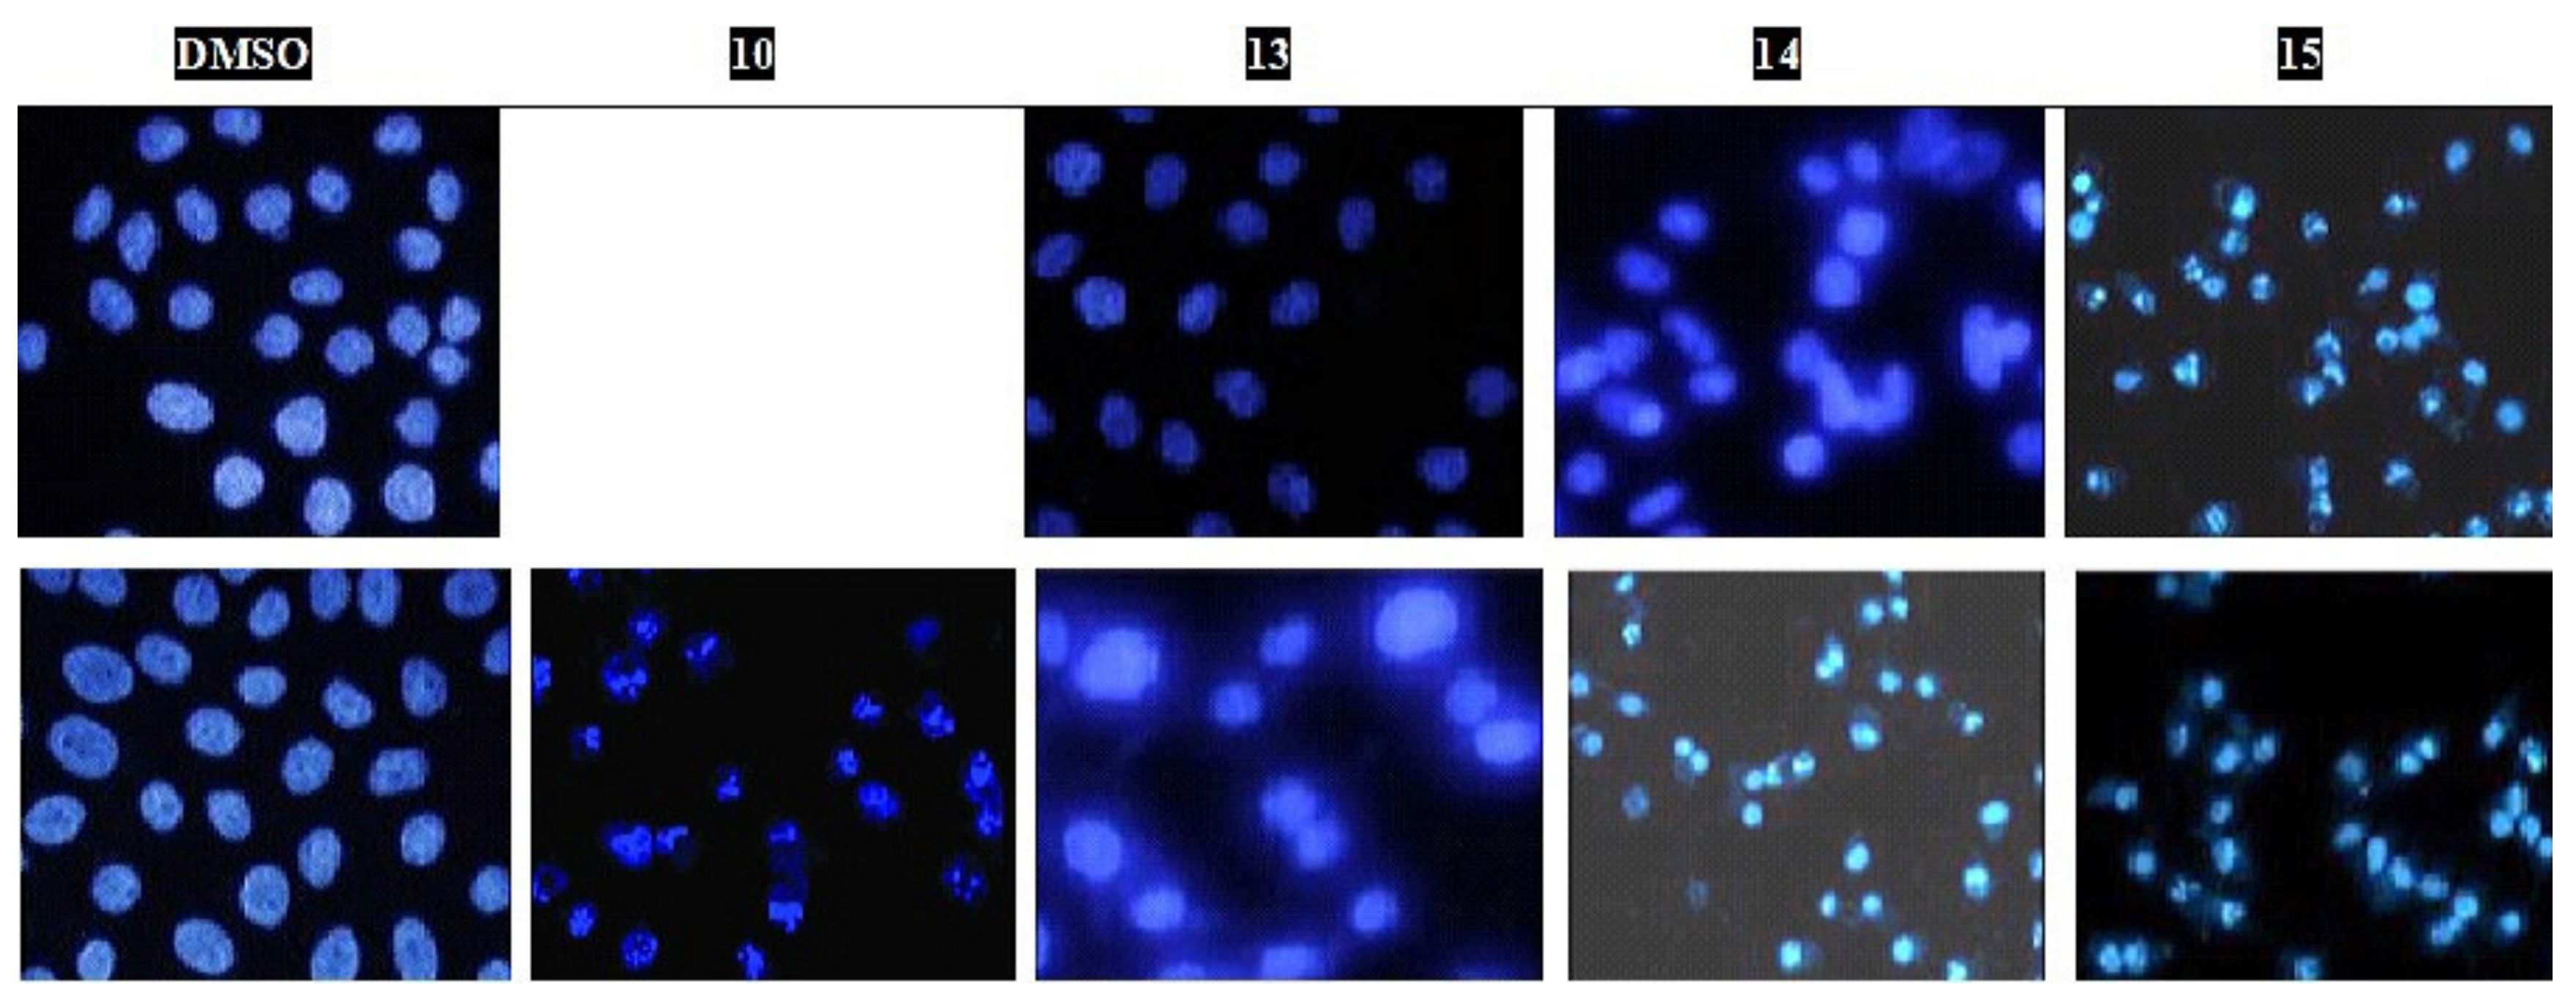
Hoechst 33258 Nuclear Staining-DNA Fragmentation
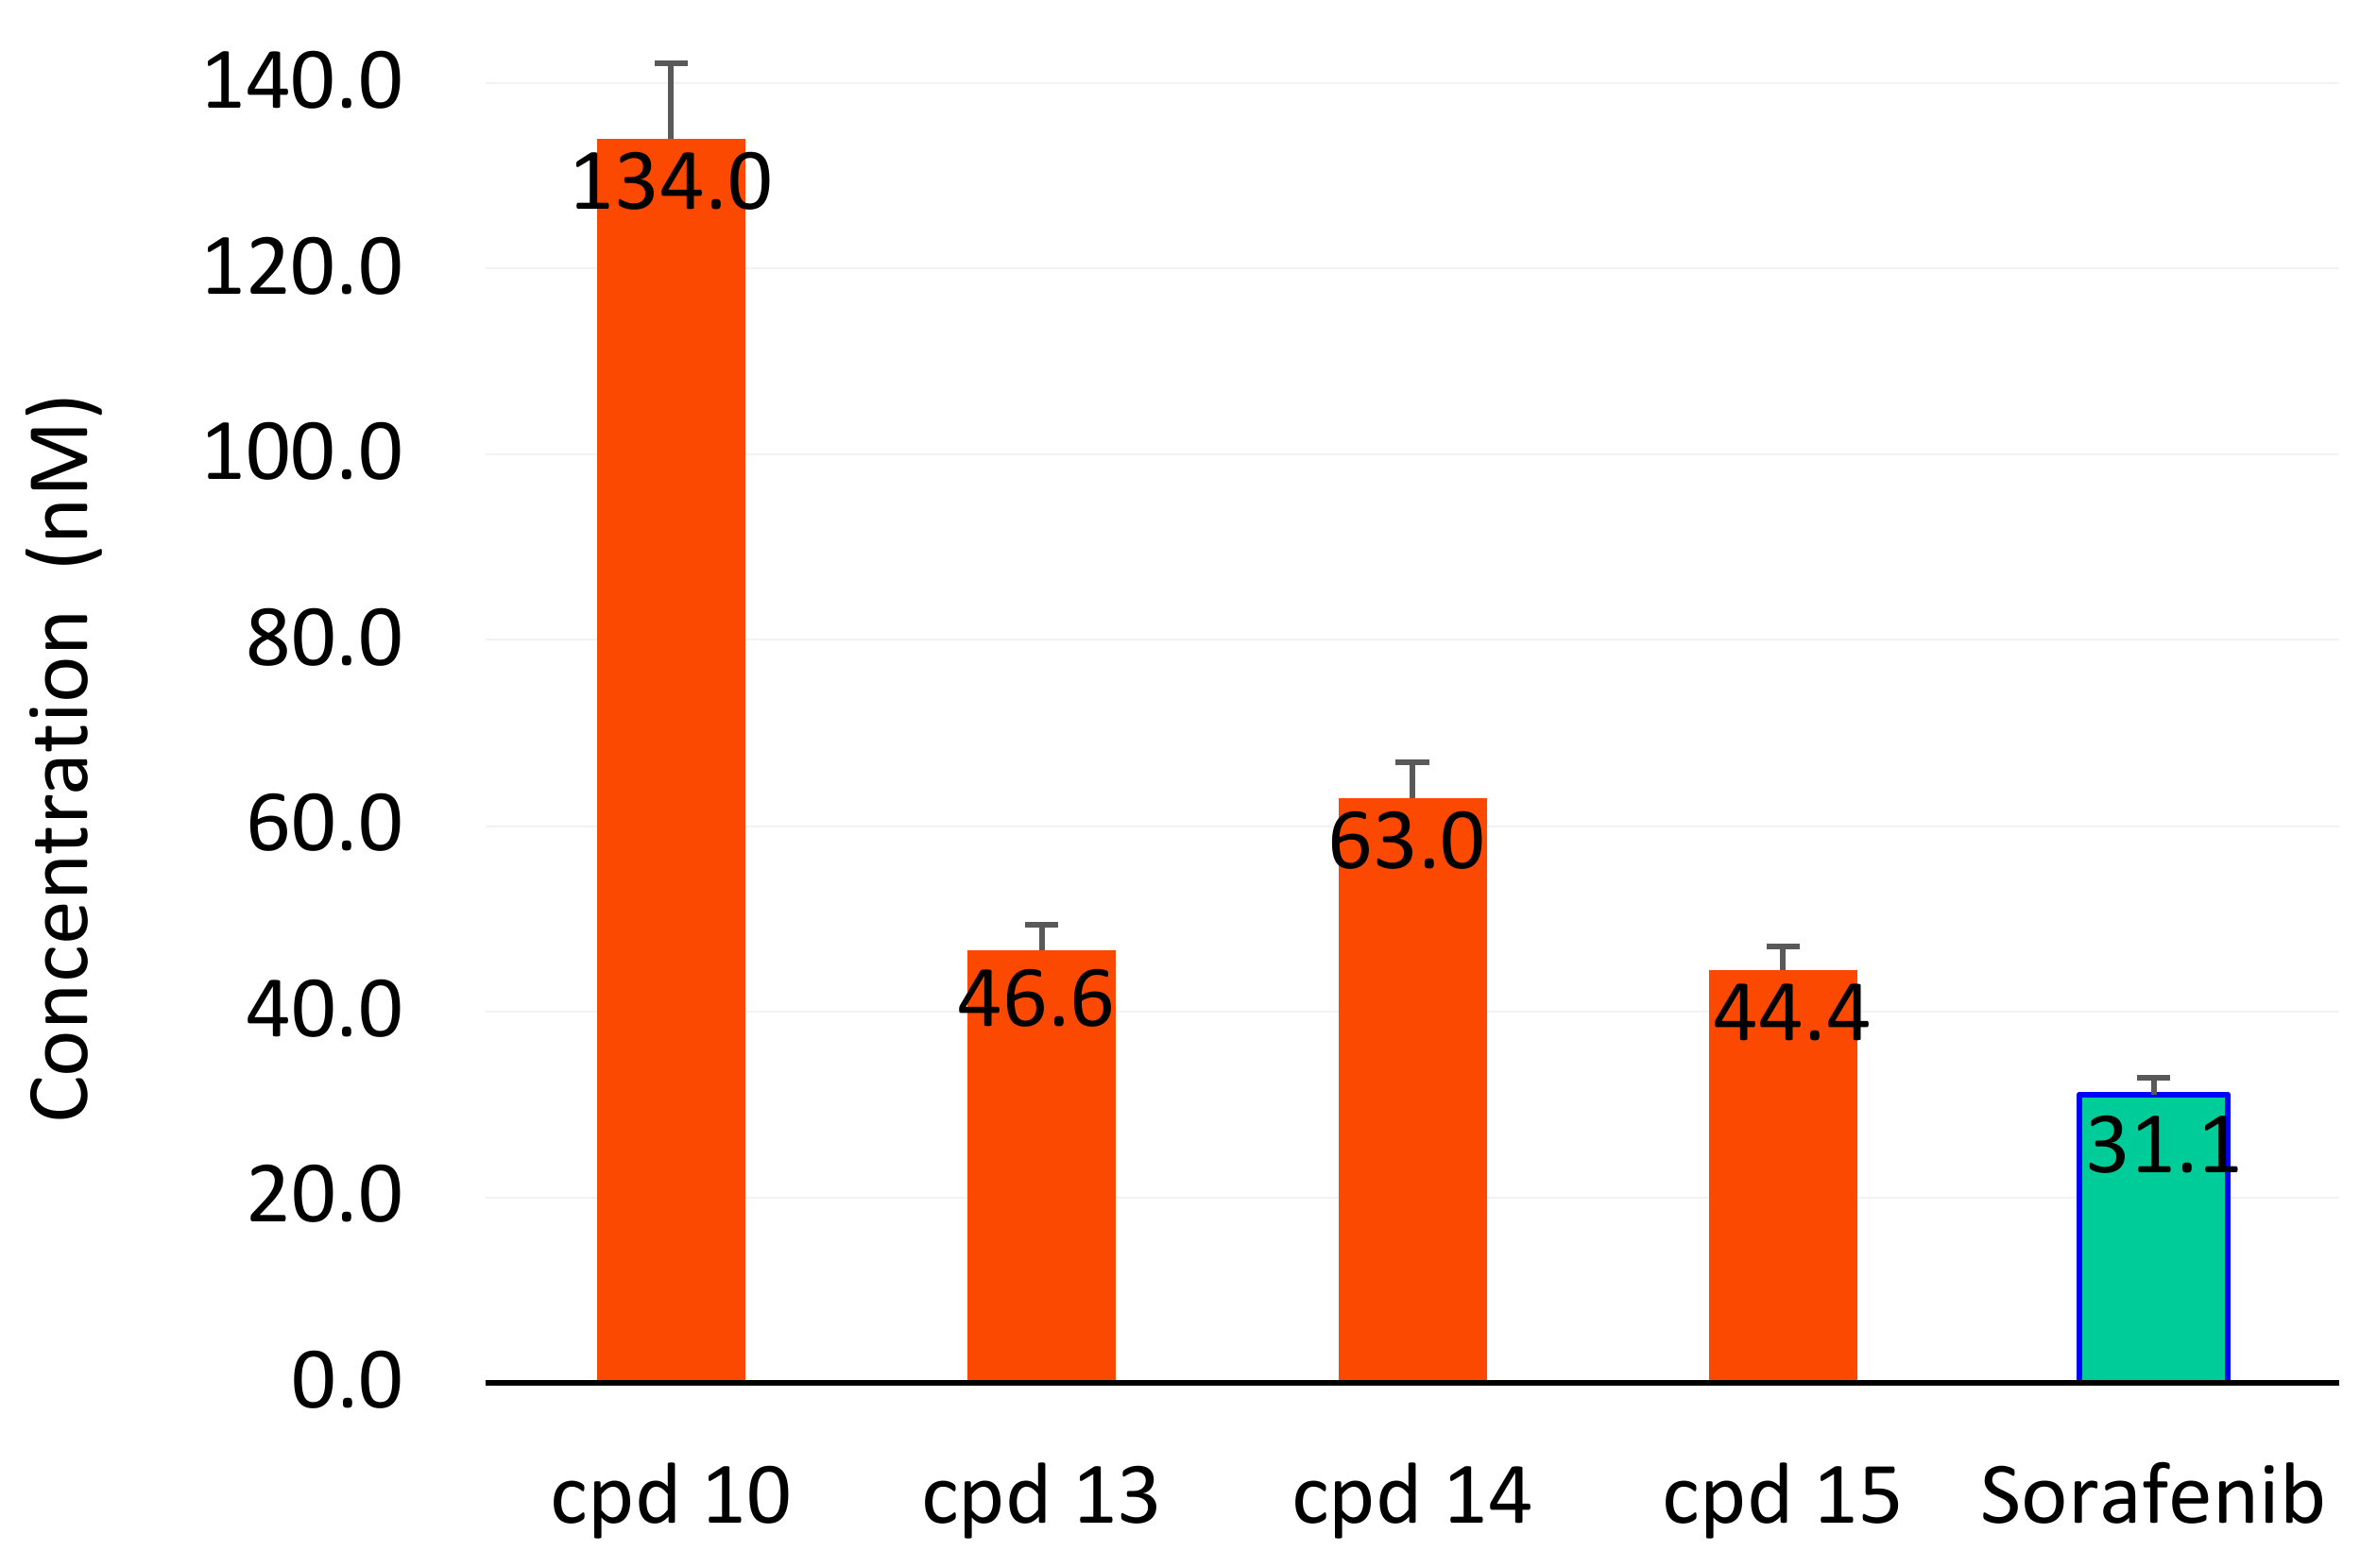
In Vitro Inhibition of VEGFR-2
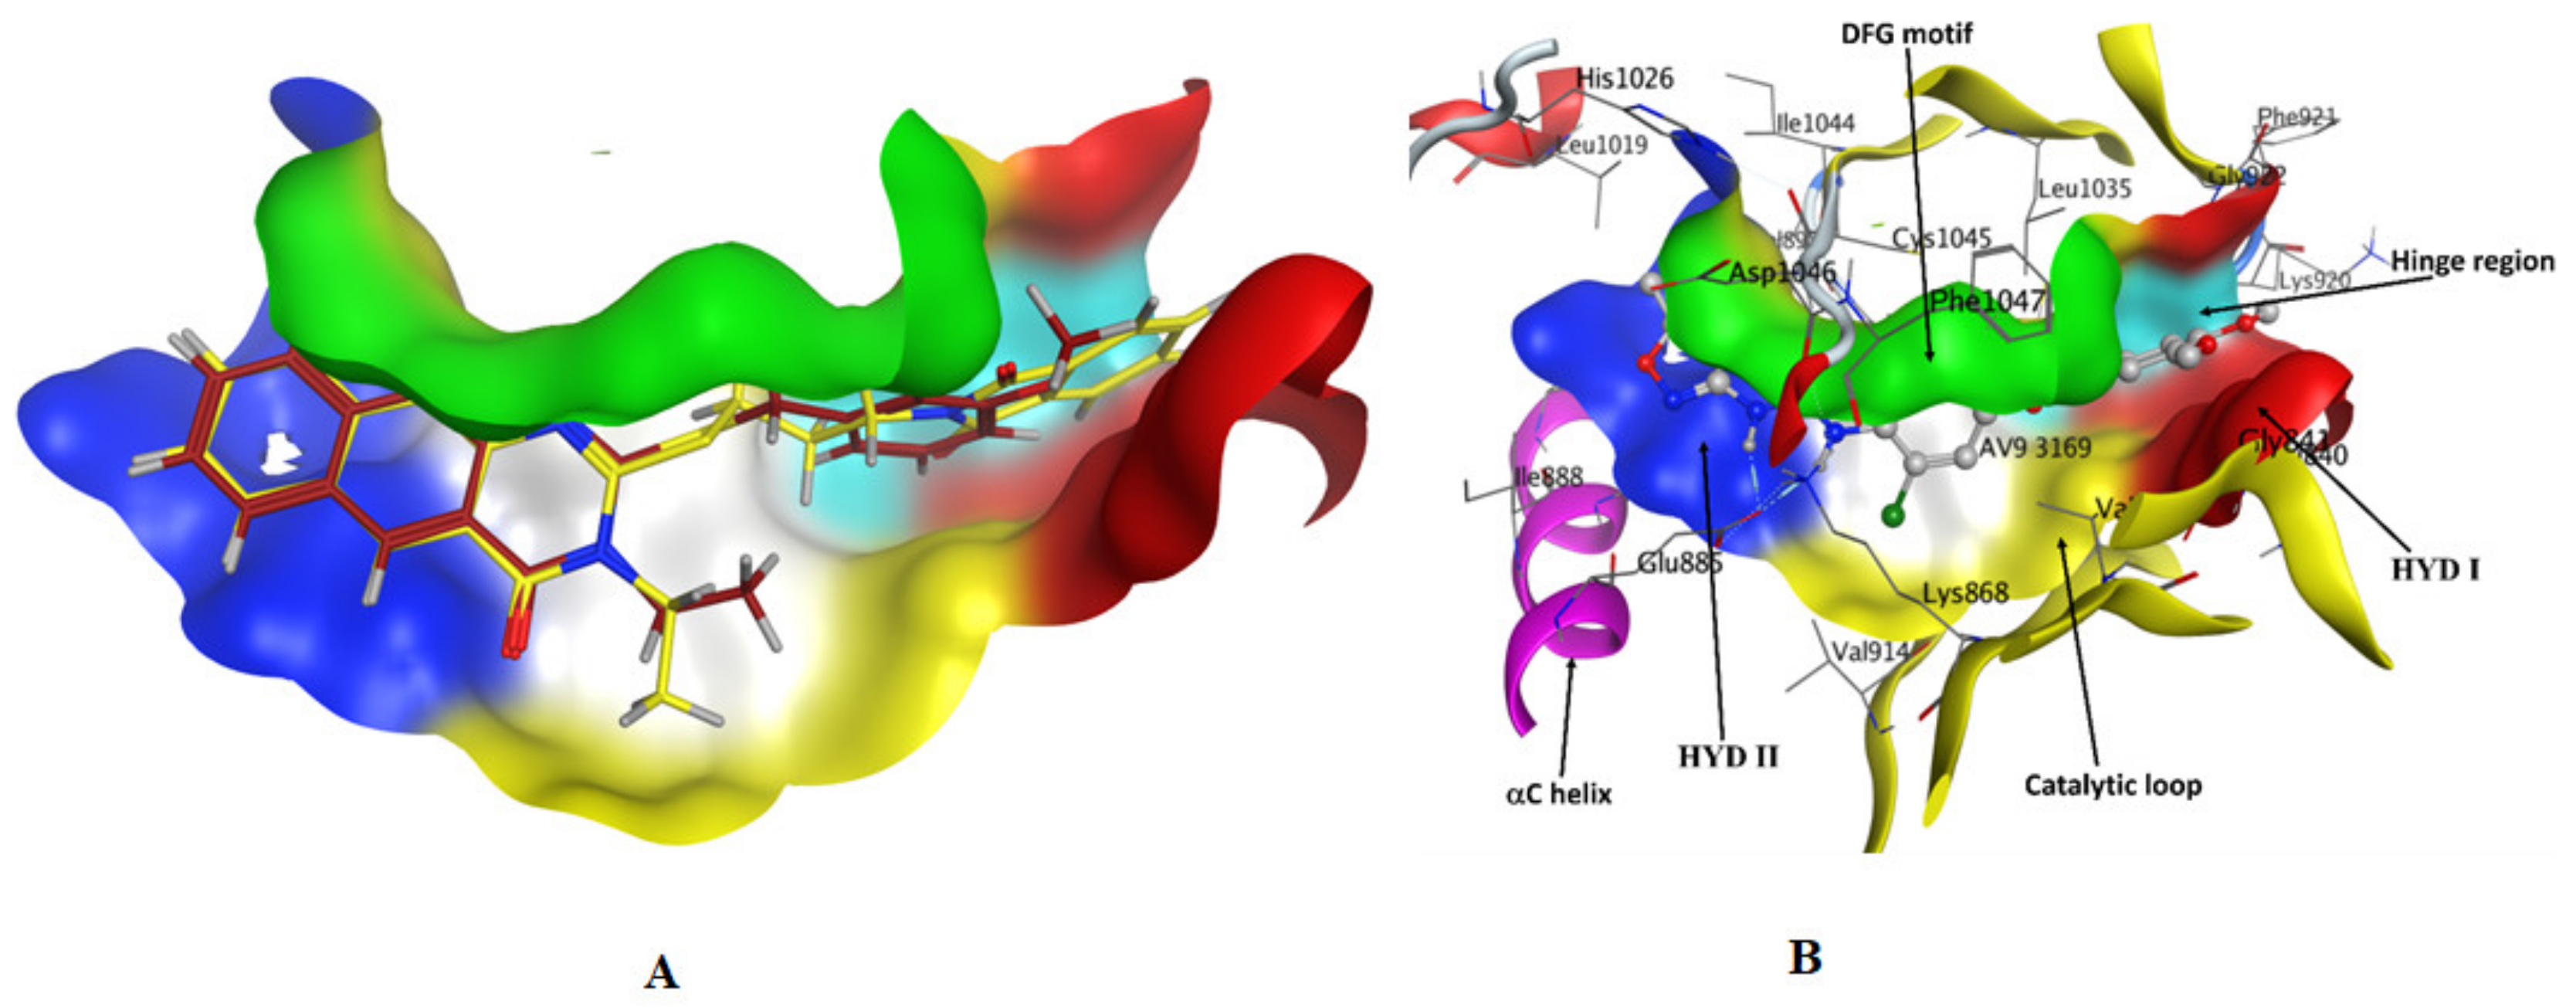
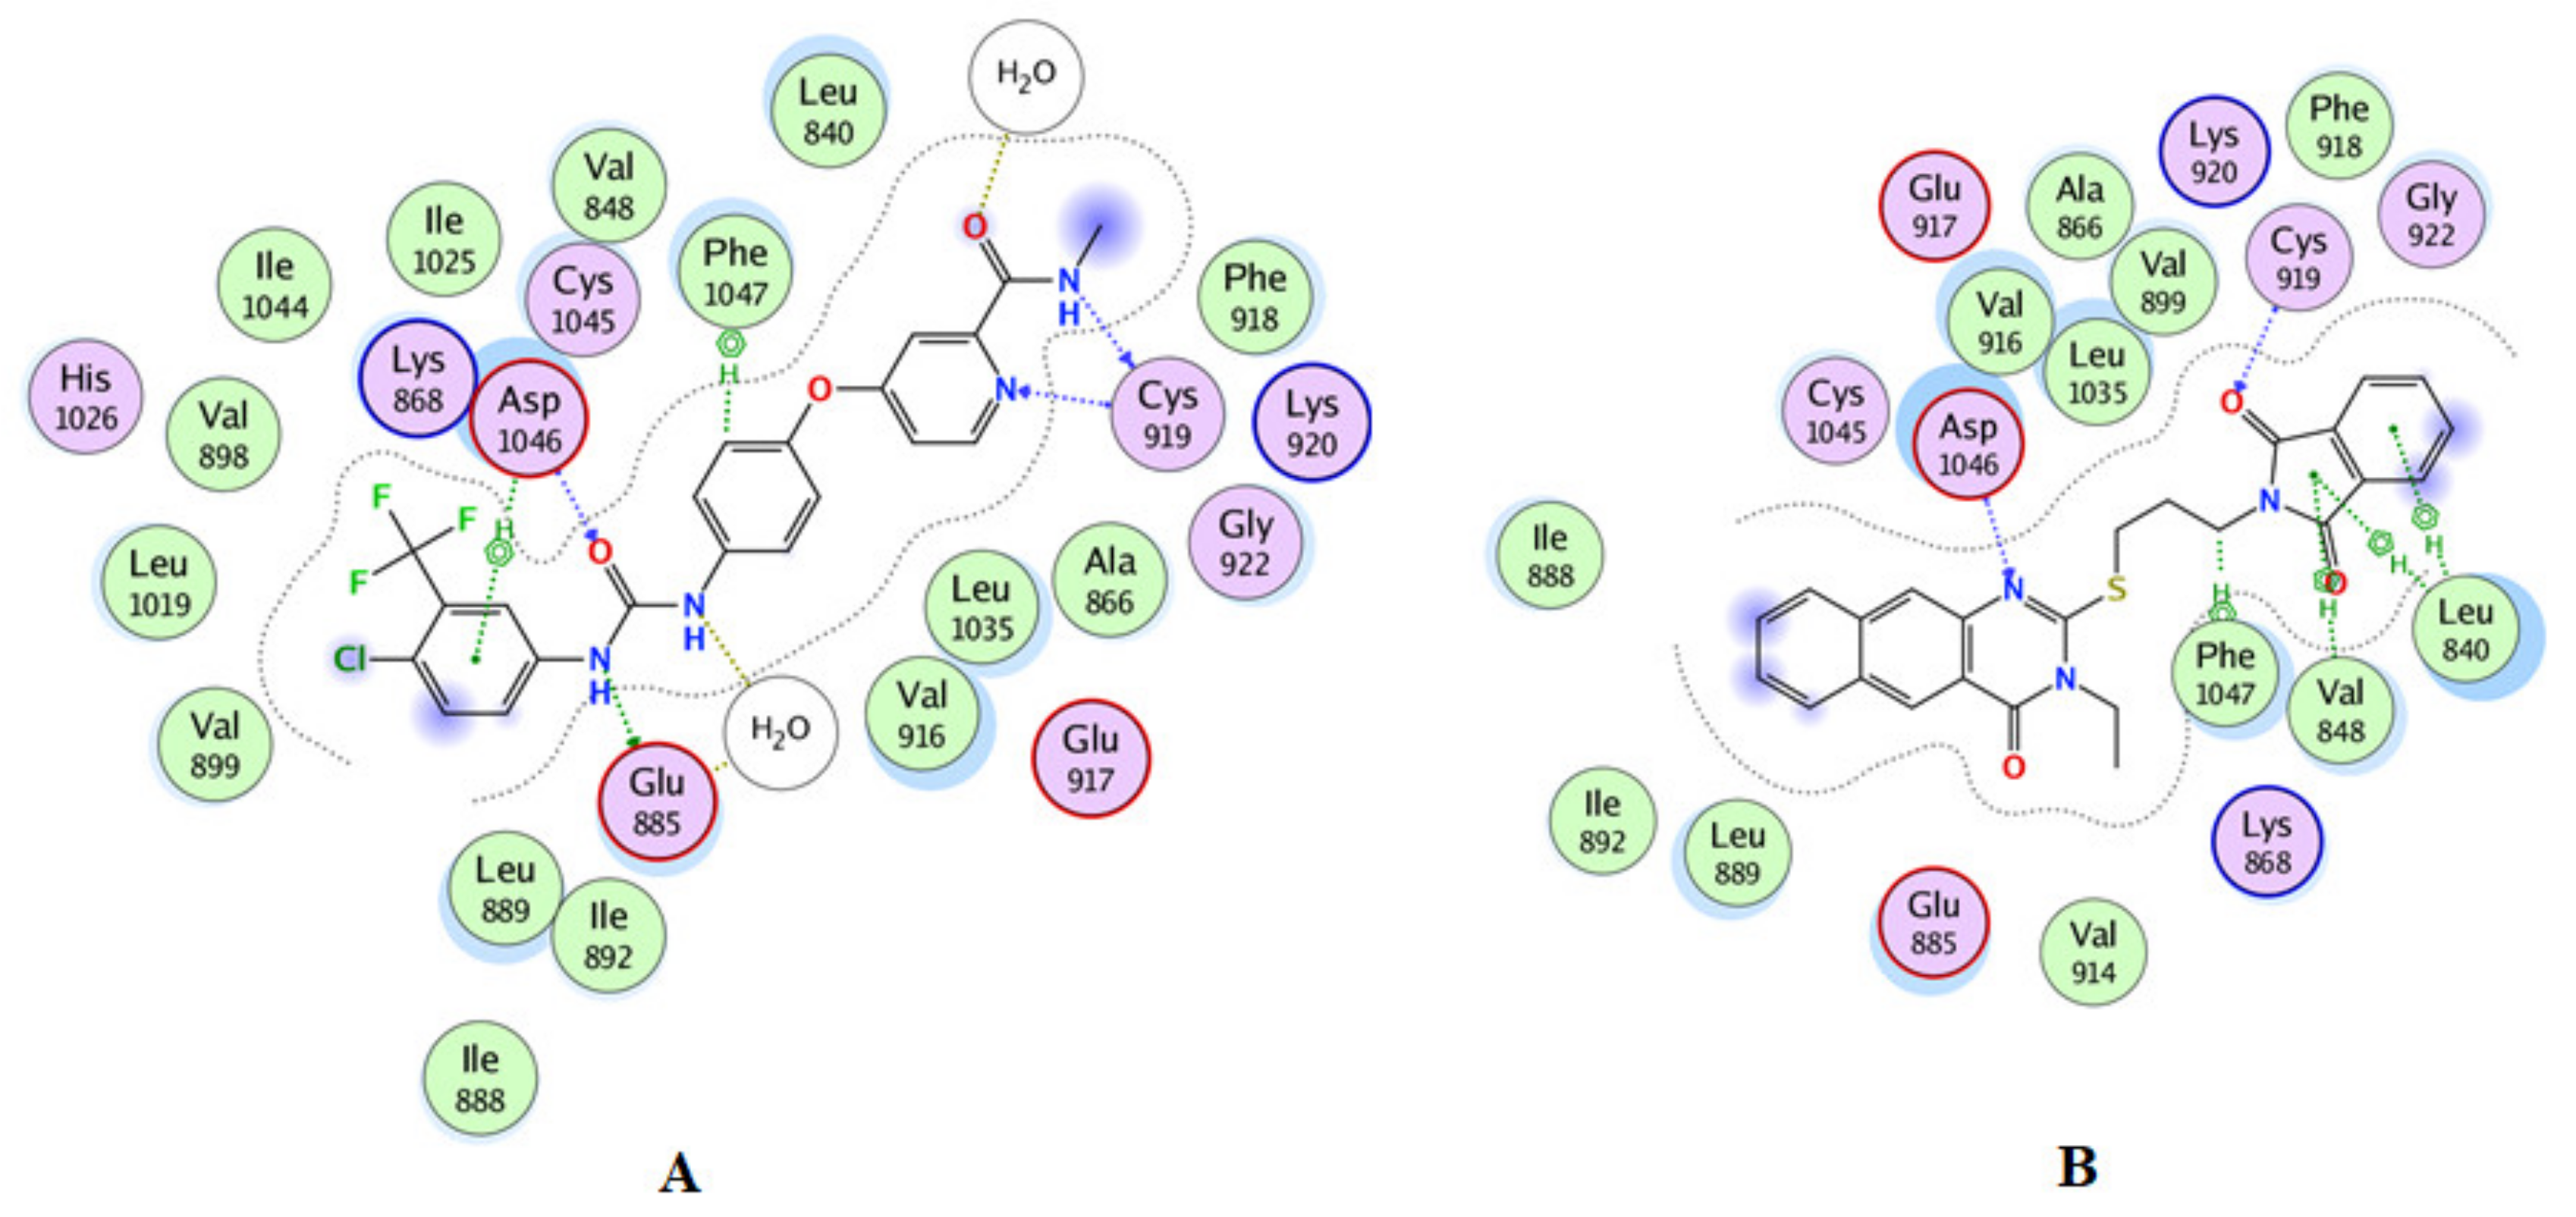
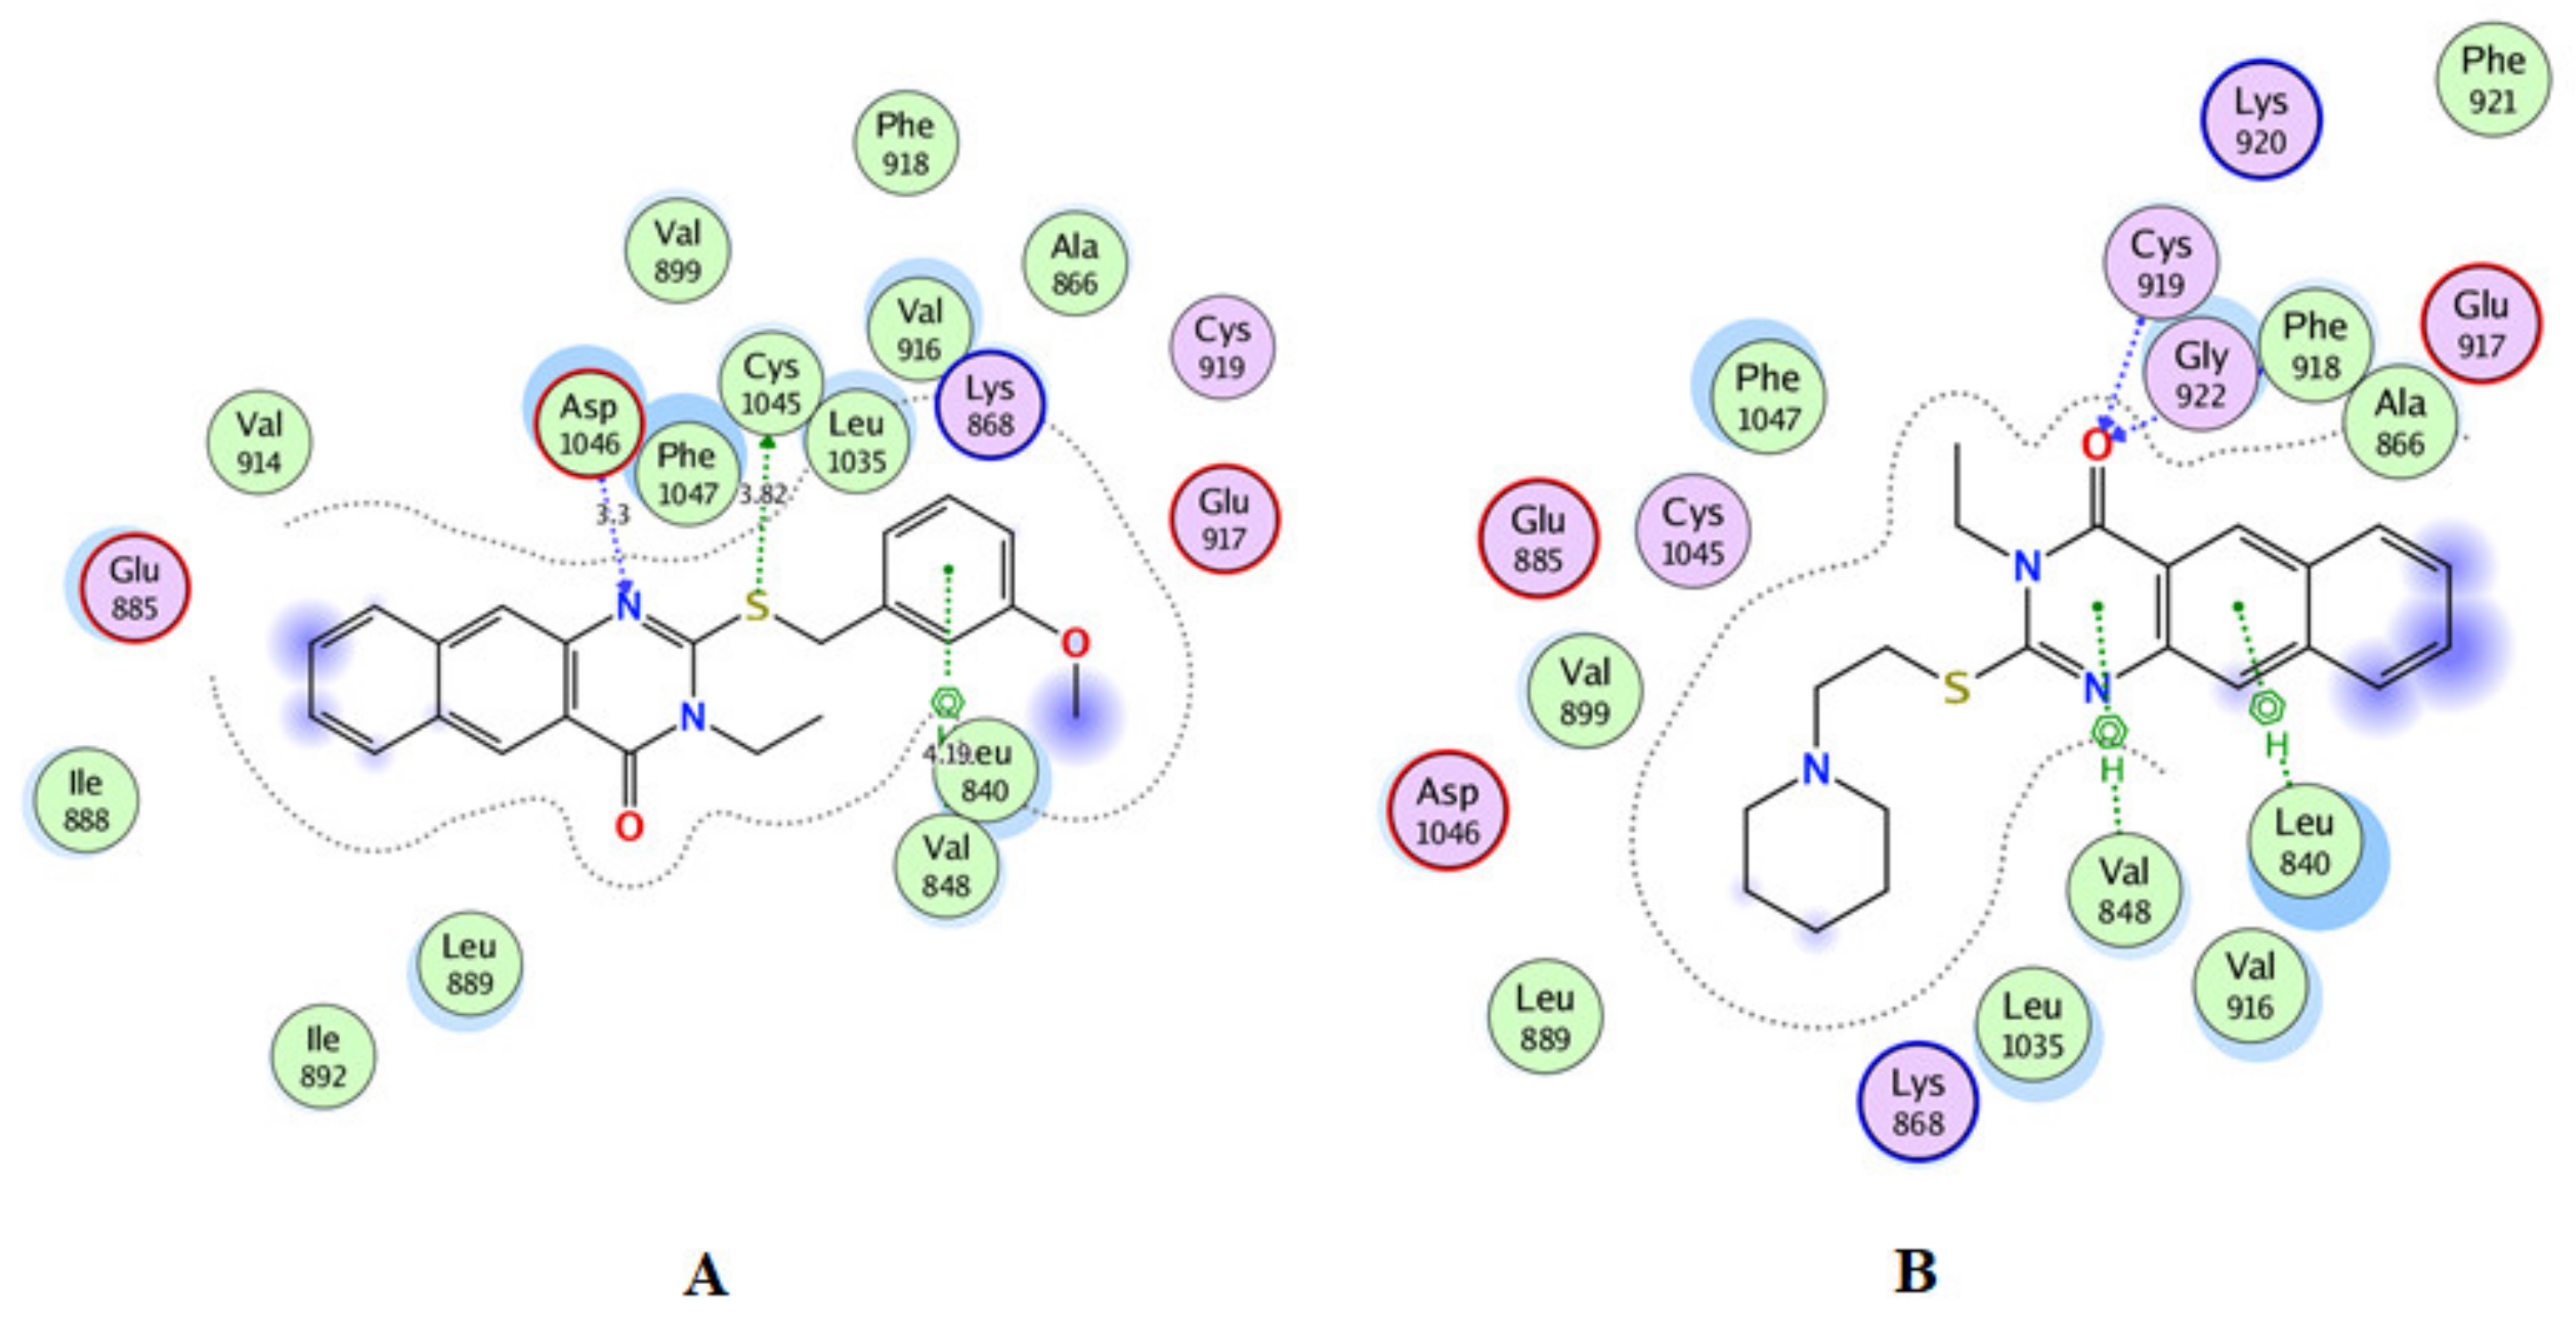
2.3. Molecular Docking
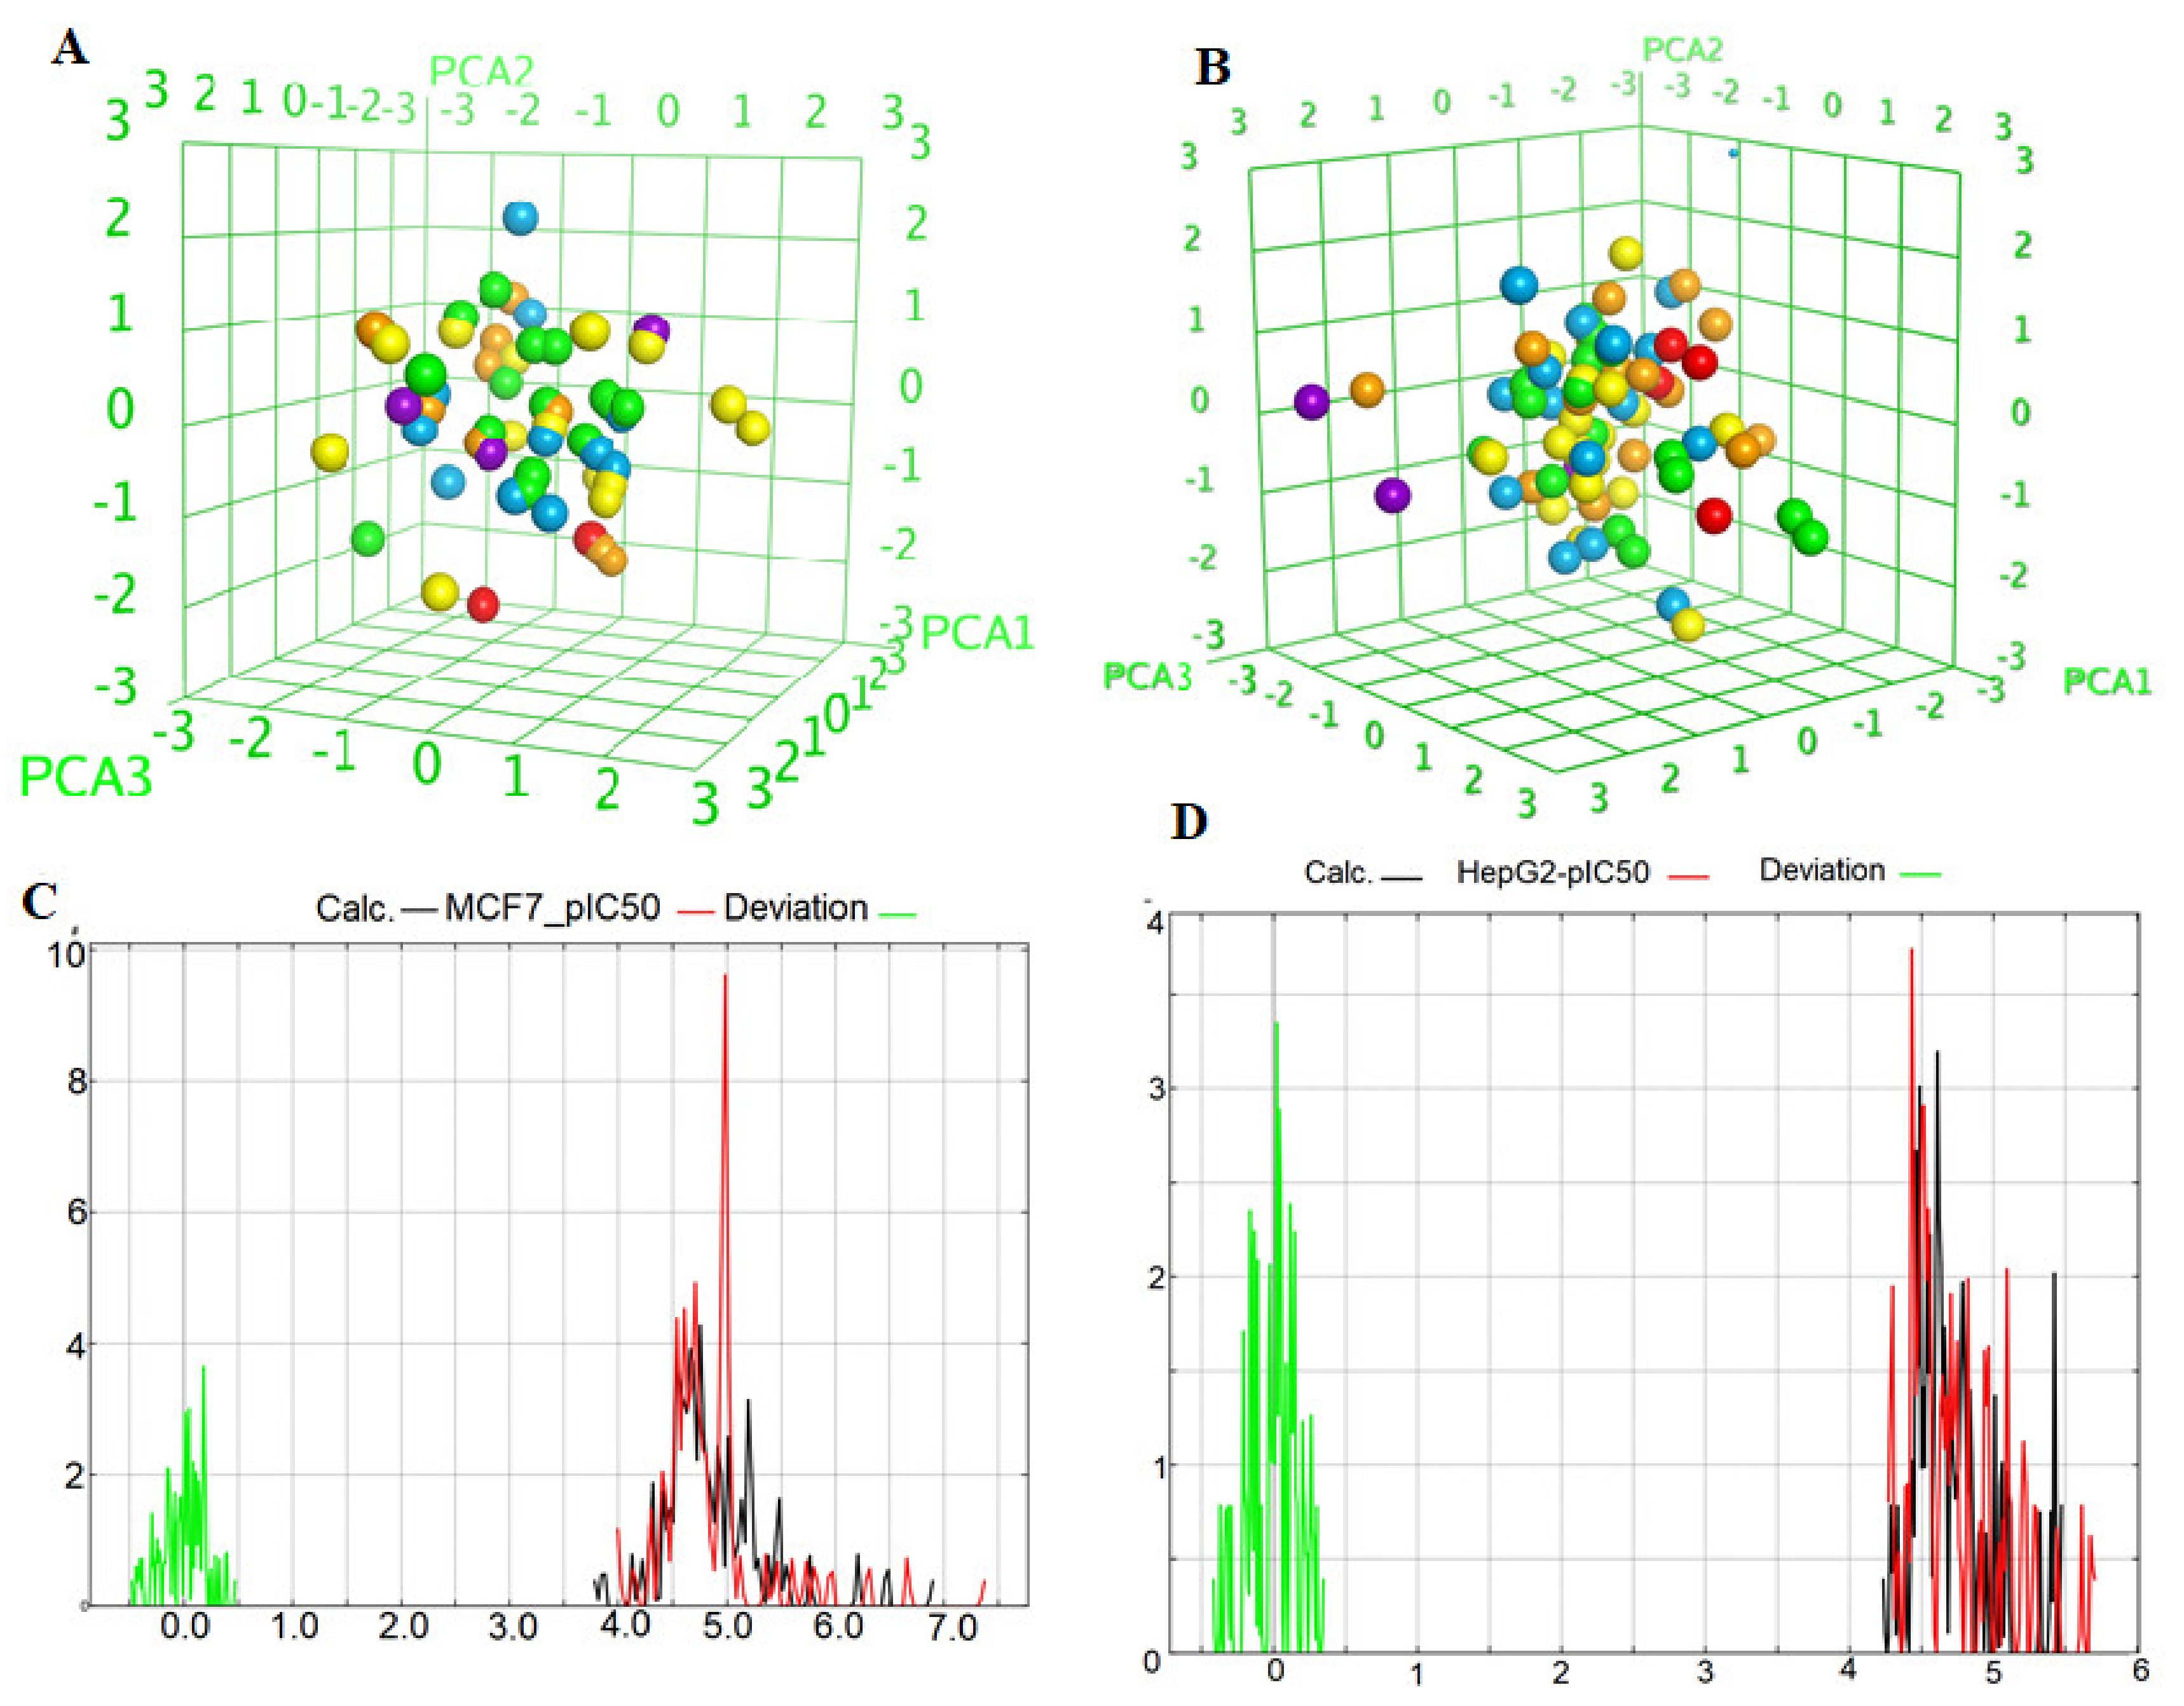
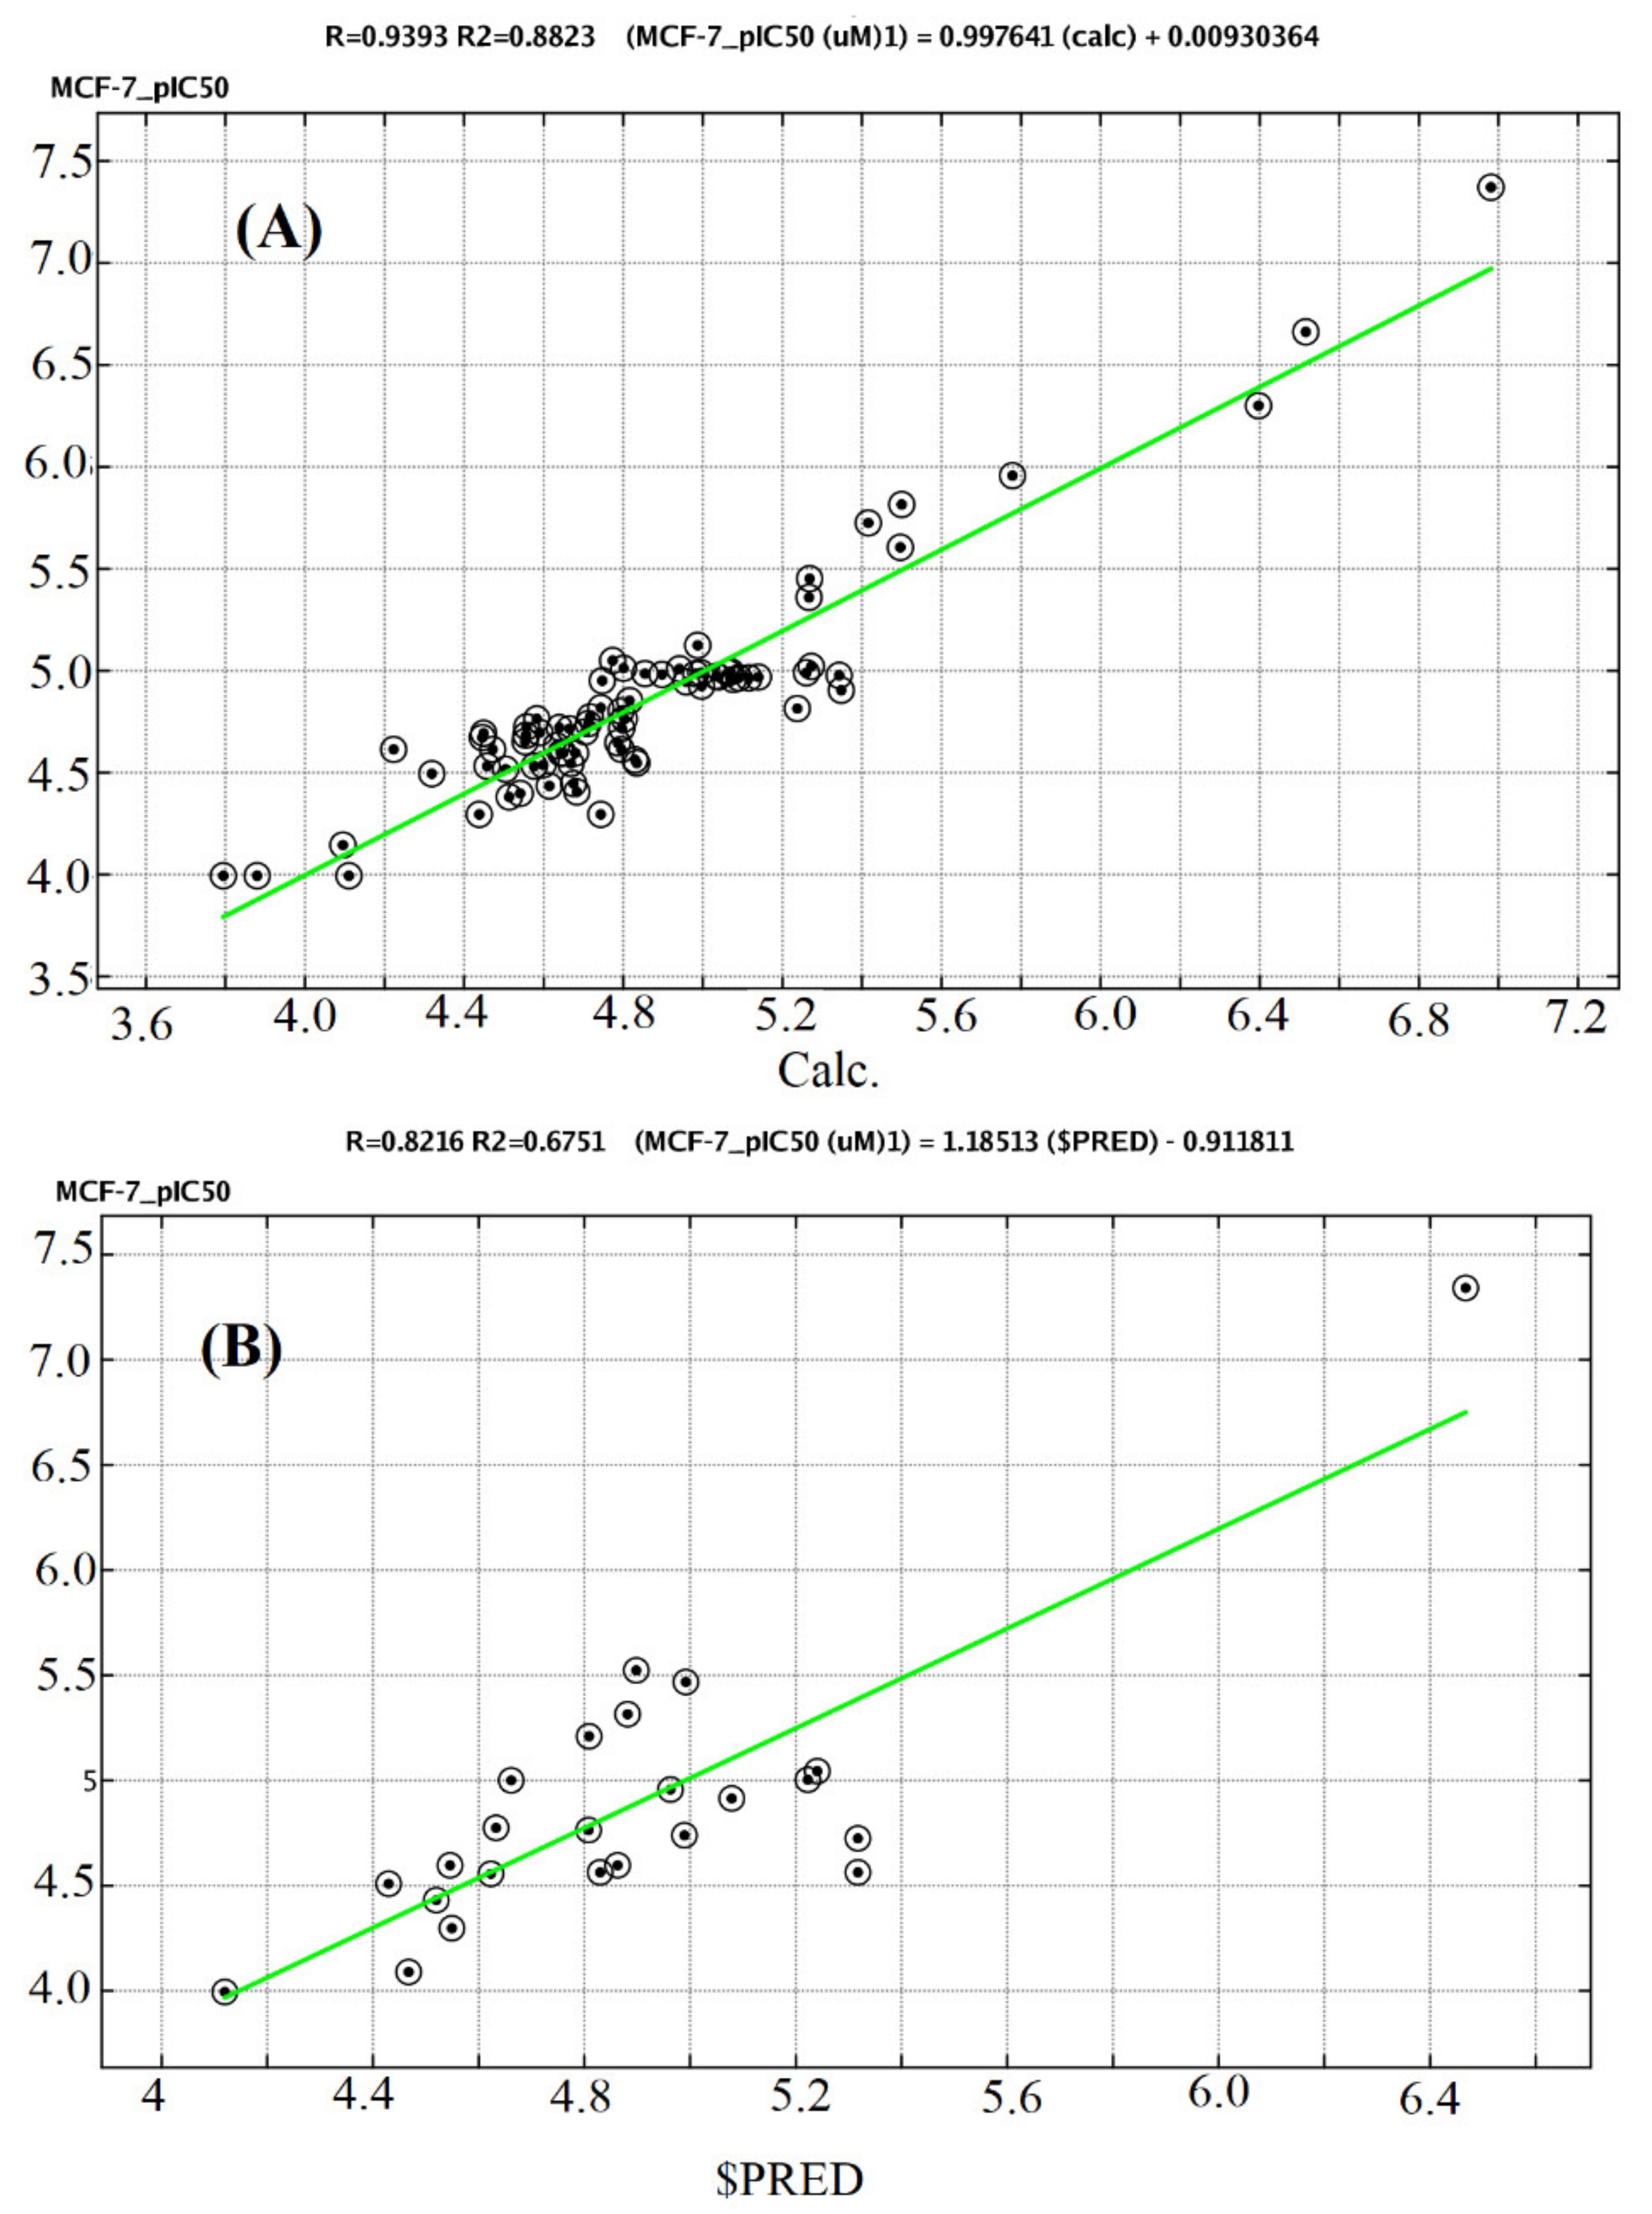
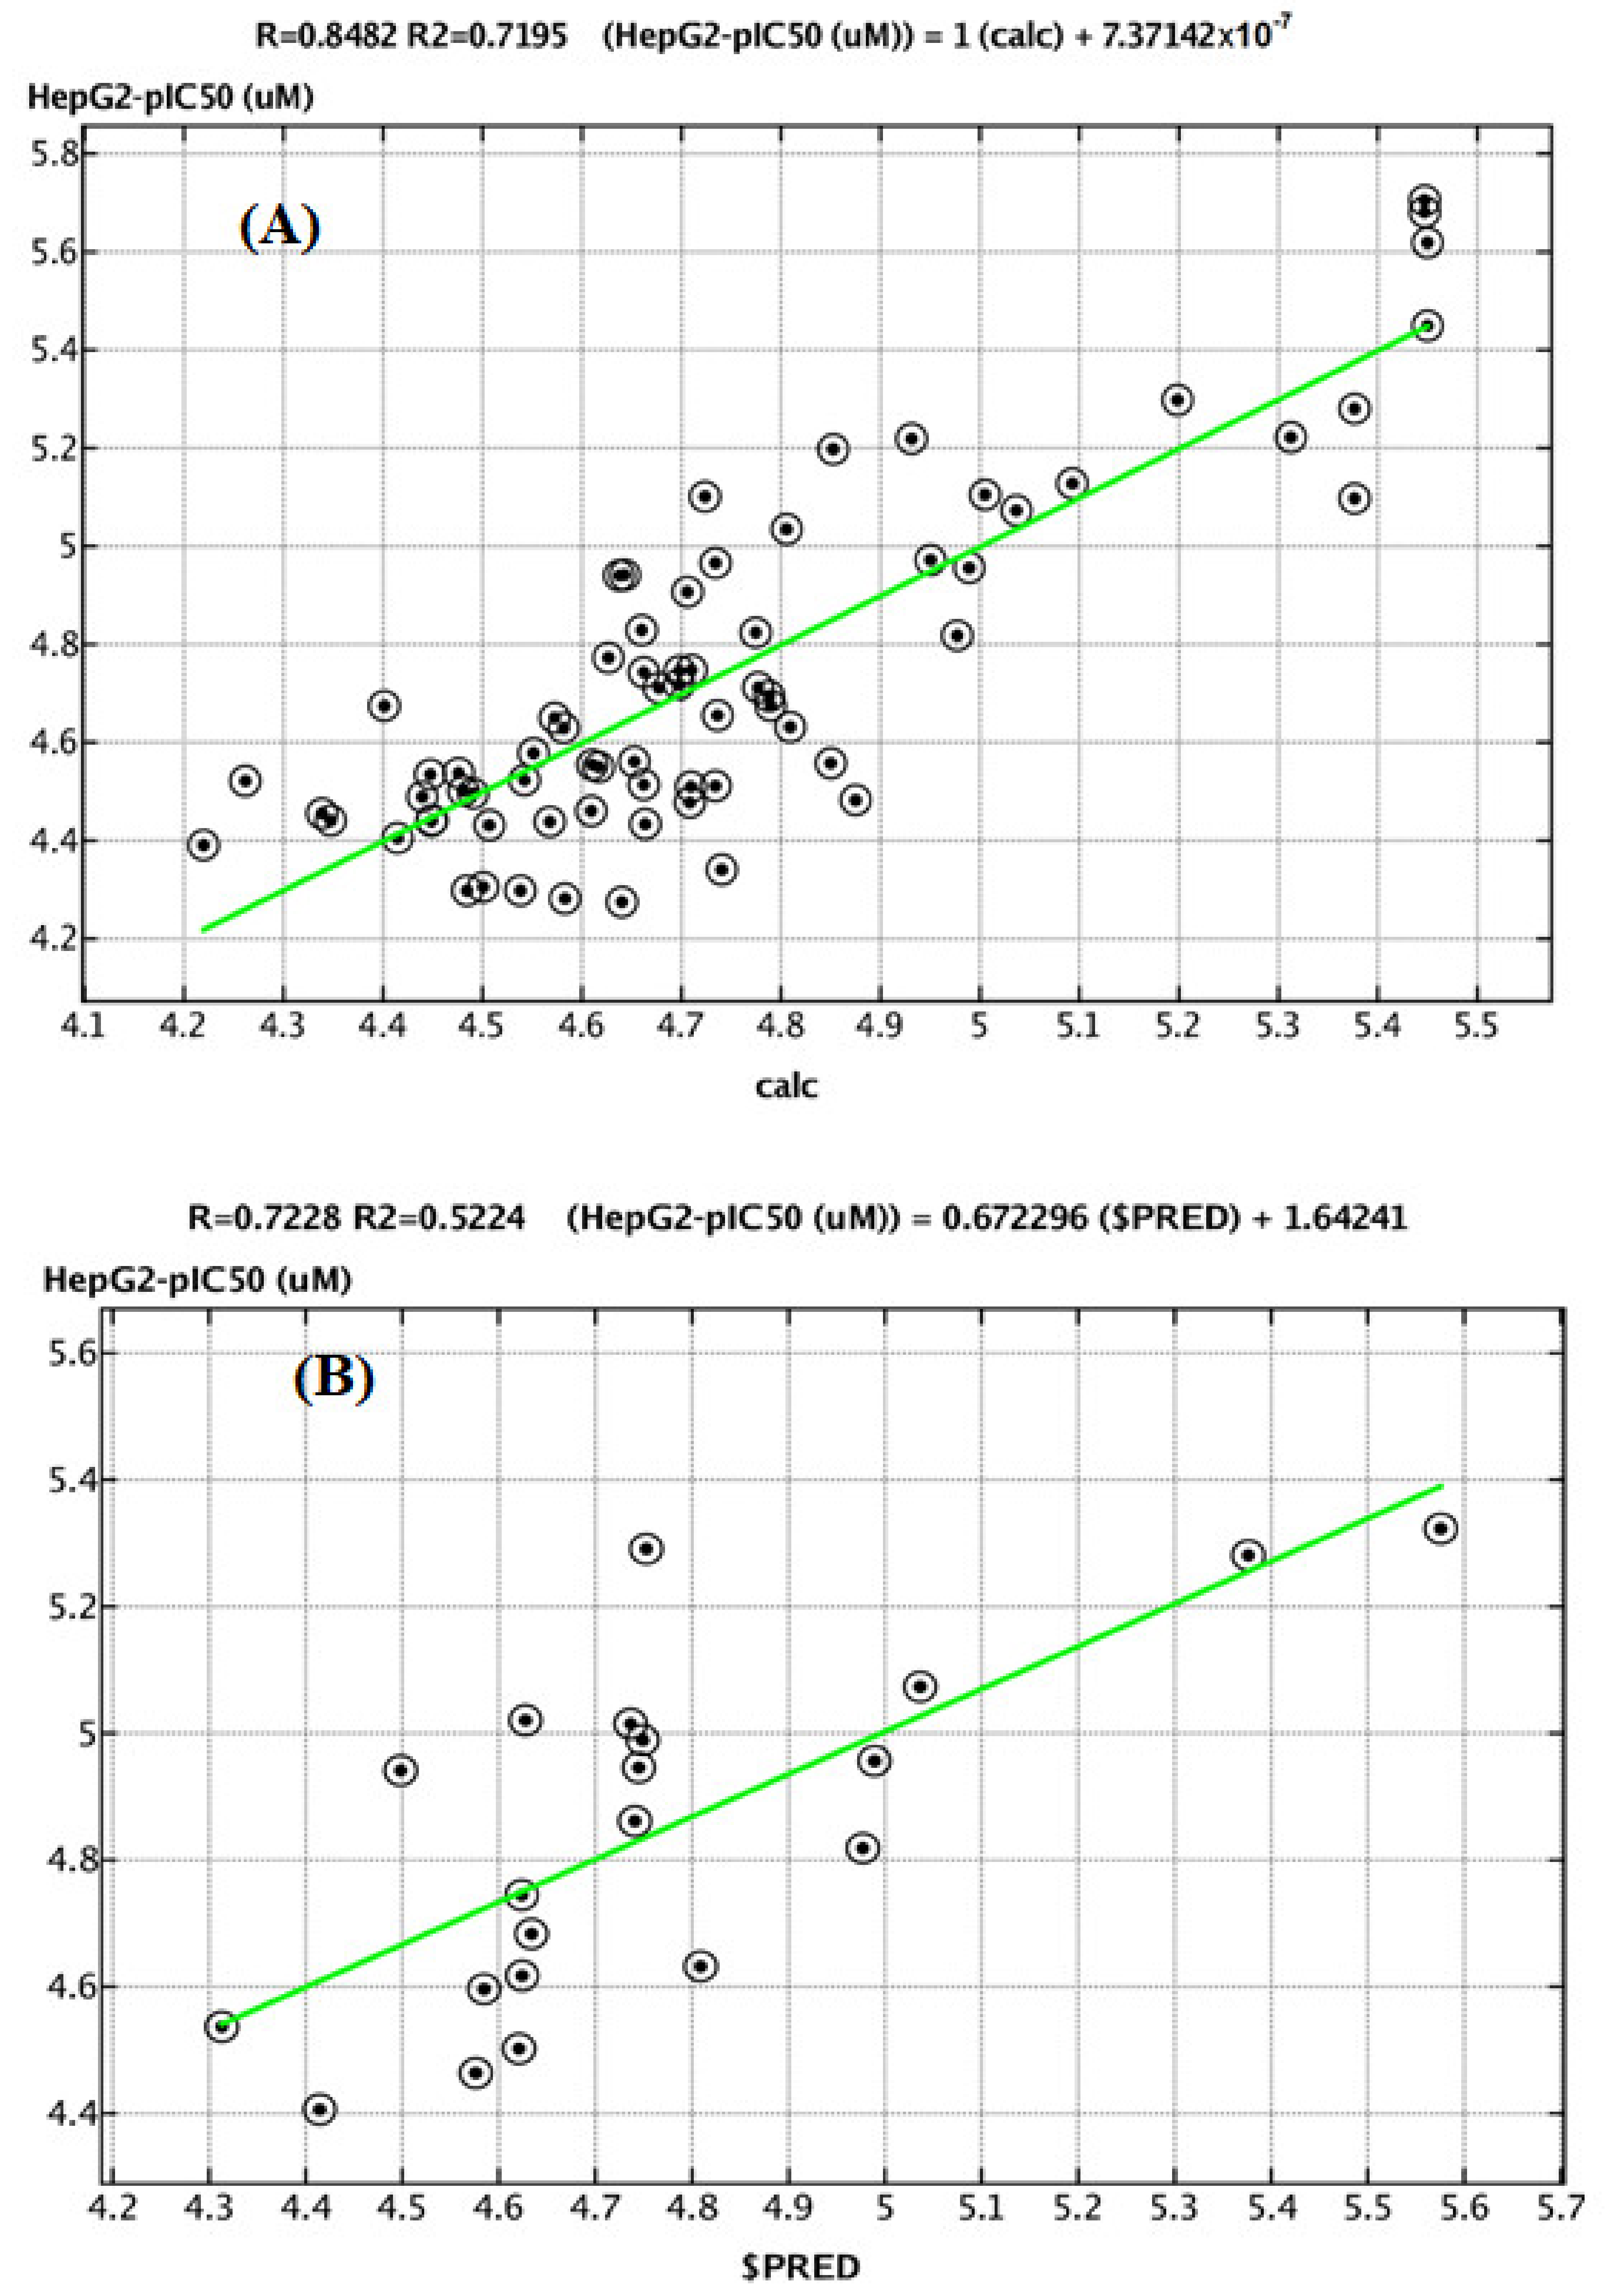
2.4. QSAR Study
3. Materials and Methods
3.1. Chemistry
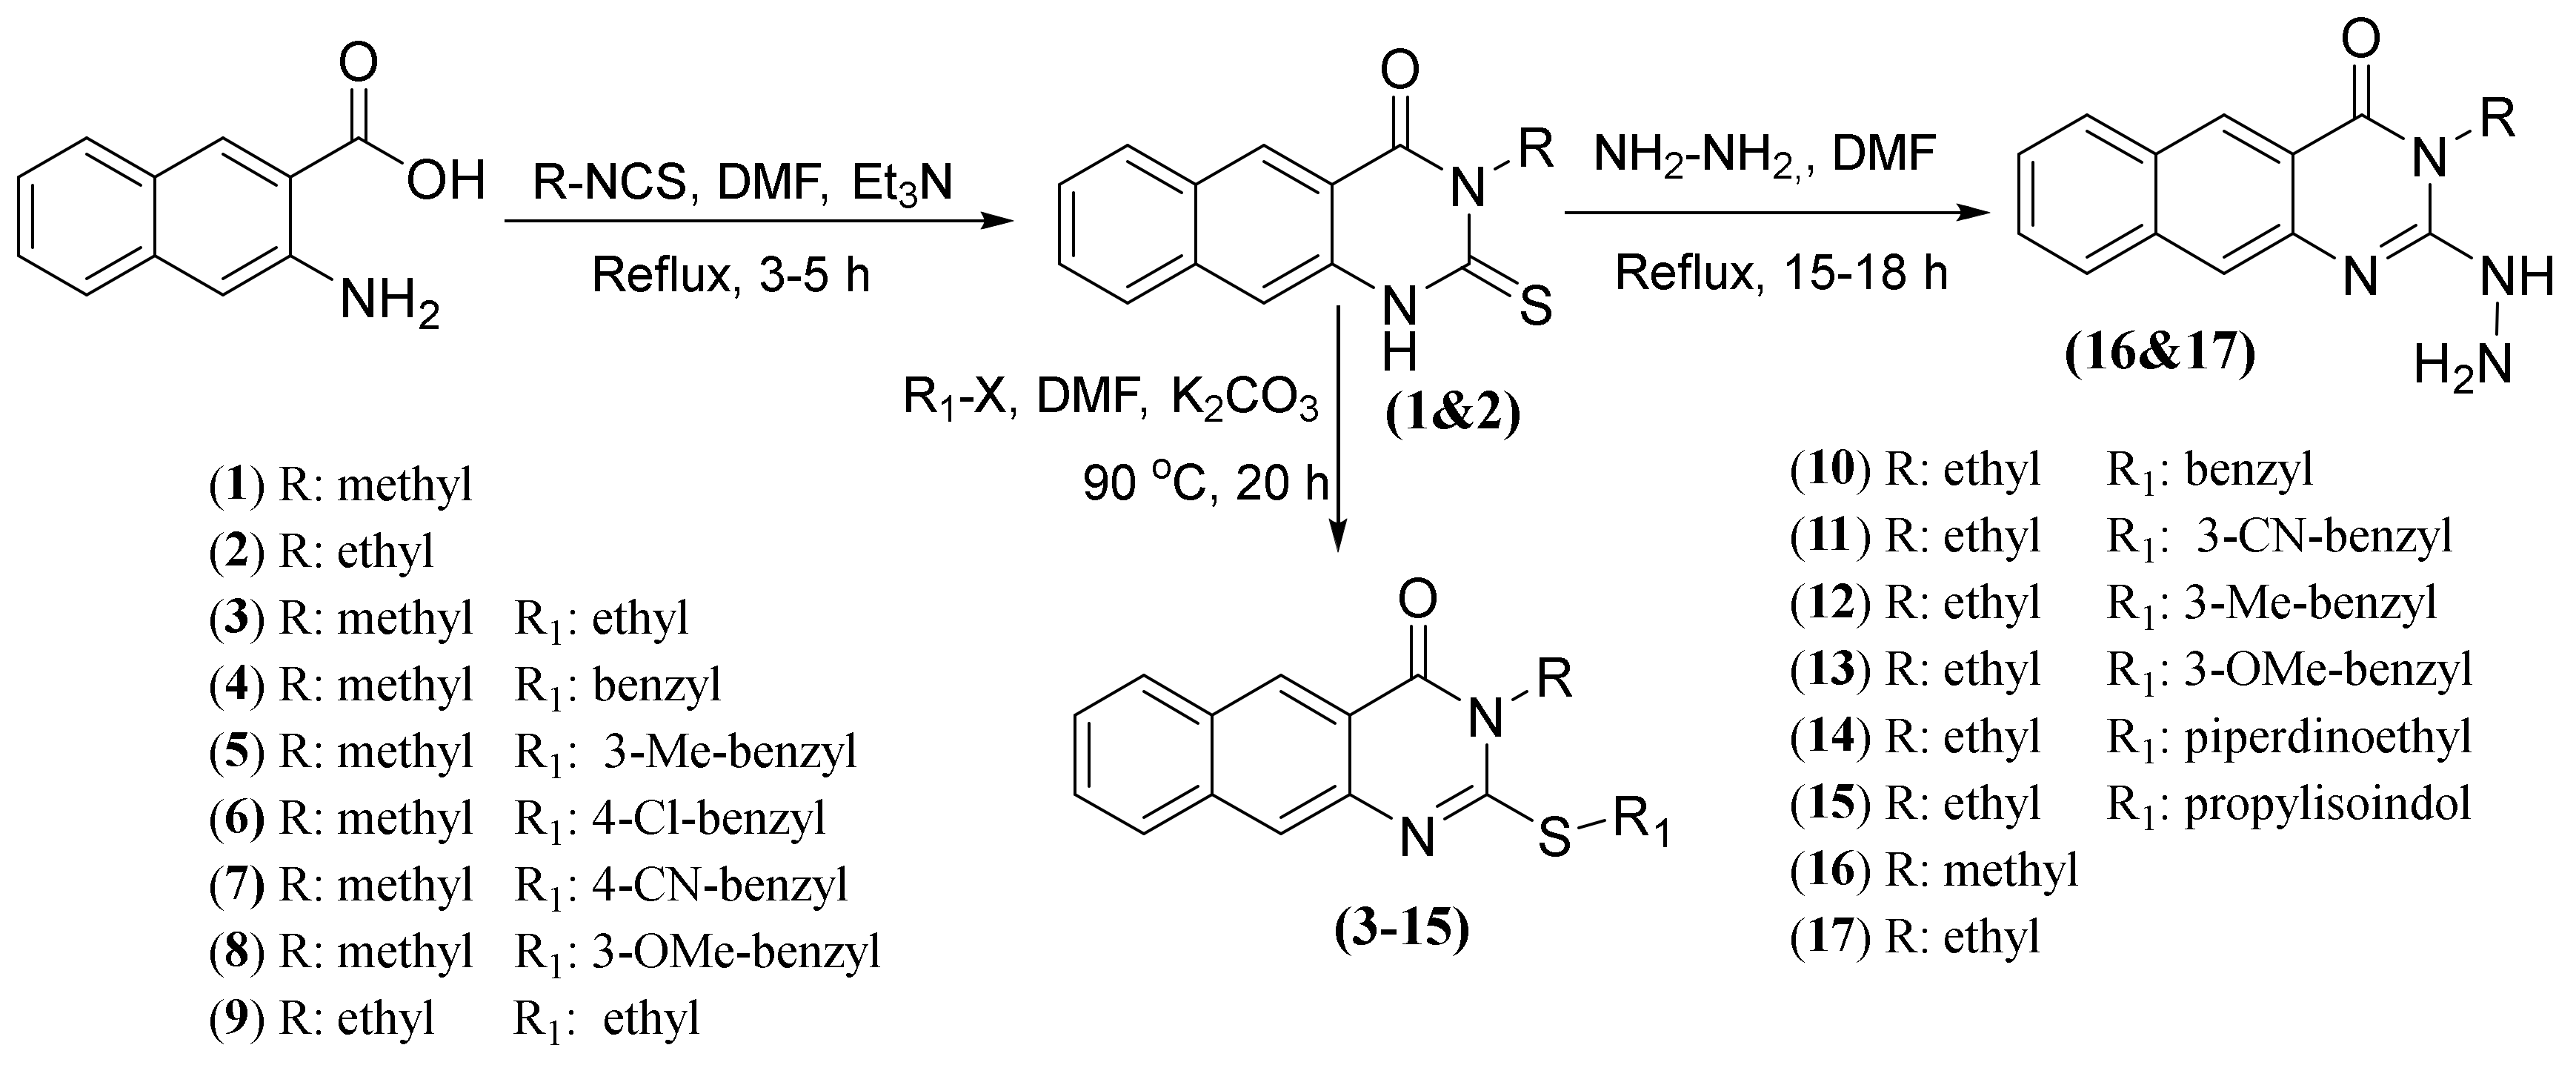
3.1.1. Synthesis of 1–17
3-Methyl-2-thioxo-2,3-dihydrobenzo[g]quinazolin-4(1H)-one (1)
3-Ethyl-2-thioxo-2,3-dihydrobenzo[g]quinazolin-4(1H)-one (2)
2-(Ethylthio)-3-methylbenzo[g]quinazolin-4(3H)-one (3)
2-(Benzylthio)-3-methylbenzo[g]quinazolin-4(3H)-one (4)
3-Methyl-2-((3-methylbenzyl)thio)benzo[g]quinazolin-4(3H)-one (5)
2-((4-Chlorobenzyl)thio)-3-methylbenzo[g]quinazolin-4(3H)-one (6)
4-(((3-Methyl-4-oxo-3,4-dihydrobenzo[g]quinazolin-2-yl)thio)methyl)benzonitrile (7)
2-((3-Methoxybenzyl)thio)-3-methylbenzo[g]quinazolin-4(3H)-one (8)
3-Ethyl-2-(ethylthio)benzo[g]quinazolin-4(3H)-one (9)
2-(Benzylthio)-3-ethylbenzo[g]quinazolin-4(3H)-one (10)
3-(((3-Ethyl-4-oxo-3,4-dihydrobenzo[g]quinazolin-2-yl)thio)methyl)benzonitrile (11)
3-Ethyl-2-((3-methylbenzyl)thio)benzo[g]quinazolin-4(3H)-one (12)
3-Ethyl-2-((3-methoxybenzyl)thio)benzo[g]quinazolin-4(3H)-one (13)
3-Ethyl-2-((2-(piperidin-1-yl)ethyl)thio)benzo[g]quinazolin-4(3H)-one (14)
2-(3-((3-Ethyl-4-oxo-3,4-dihydrobenzo[g]quinazolin-2-yl)thio)propyl)isoindoline -1,3-dione (15)
3.2. Biology
3.2.1. MTT Assay
3.2.2. Cell-Cycle Analysis by Flow Cytometry
3.2.3. Measurements of Apoptosis Using Double Staining with Annexin-V FITC/PI Dyes
3.2.4. Hoechst 33258 Nuclear Staining-DNA Fragmentation
3.2.5. In Vitro Inhibition of VEGFR-2
3.3. Docking Study
3.4. QSAR Methodology
4. Conclusions
Supplementary Materials
Author Contributions
Funding
Conflicts of Interest
References
- Viallard, C.; Larrivée, B. Tumor angiogenesis and vascular normalization: Alternative therapeutic targets. Angiogenesis 2017, 20, 409–426. [Google Scholar] [CrossRef] [PubMed]
- El-GazzarRania, M.G.; El-HazekNashwa, R.M.; Zaher, N.H.; El-Ghazaly, M.A. Design and synthesis of novel pyridazinoquinazoline derivatives as potent VEGFR-2 inhibitors: In vitro and in vivo study. Bioorg. Chem. 2019, 92, 103251. [Google Scholar] [CrossRef] [PubMed]
- Aziz, M.A.; Serya, R.A.; Lasheen, D.S.; Abdel-Aziz, A.K.; Esmat, A.; Mansour, A.M.; Singab, A.N.; Abouzid, A.M. Discovery of potent VEGFR-2 inhibitors based on furopyrimidine and thienopyrimidne scaffolds as cancer targeting agents. Sci. Rep. 2016, 15, 24460. [Google Scholar] [CrossRef] [PubMed]
- Shi, L.; Zhou, J.; Wu, J.; Shen, Y.; Li, X. Anti-angiogenic therapy: Strategies to develop potent VEGFR-2 tyrosine kinase inhibitors and future prospect. Curr. Med. Chem. 2016, 23, 1000–1040. [Google Scholar] [CrossRef] [PubMed]
- Modi, S.J.; Kulkarni, V.M. Vascular Endothelial Growth Factor Receptor (VEGFR-2)/KDR inhibitors. Med. Chem. Perspect. Med. Drug Discov. 2019, 2, 100009. [Google Scholar] [CrossRef]
- Liu, Y.; Gray, N.S. Rational design of inhibitors that bind to inactive kinase conformations. Nat. Chem. Biol. 2006, 2, 358–364. [Google Scholar] [CrossRef]
- Kwak, E.L.; Sordella, R.; Bell, D.W.; Godin-Heymann, N.; Okimoto, R.A.; Brannigan, B.W.; Harris, P.L.; Driscoll, D.R.; Fidias, P.; Lynch, T.J. Irreversible inhibitors of the EGF receptor may circumvent acquired resistance to gefitinib. Proc. Natl. Acad. Sci. USA 2005, 102, 7665–7670. [Google Scholar] [CrossRef]
- Ghorab, M.M.; Alsaid, M.S.; Soliman, A.M.; Ragab, F.A. VEGFR-2 inhibitors and apoptosis inducers: Synthesis and molecular design of new benzo[g]quinazolin bearing benzenesulfonamide moiety. J. Enzyme Inhib. Med. Chem. 2017, 32, 893–907. [Google Scholar] [CrossRef]
- Huang, L.; Huang, Z.; Bai, Z.; Xie, R.; Sun, L.; Lin, K. Development and strategies of VEGFR-2/KDR inhibitors. Future Med. Chem. 2012, 4, 1839–1852. [Google Scholar] [CrossRef]
- Kornev, A.P.; Haste, N.M.; Taylor, S.S.; Ten Eyck, L.F. Surface comparison of active and inactive protein kinases identifies a conserved activation mechanism. Proc. Natl. Acad. Sci. USA 2006, 103, 17783–17788. [Google Scholar] [CrossRef]
- Al-Salahi, R.; Abuelizz, H.; Eldib, R.; Wadi, M.; Alotaibi, M.; Marzouk, M. Antimicrobial activity of newly synthesized 2-methylthio-benzo[g][1,2,4]-triazolo[1,5-a]quinazolines. Med. Chem. 2016, 12, 760–766. [Google Scholar] [CrossRef] [PubMed]
- Al-Salahi, R.; Abuelizz, H.; Ghabbour, H.; Eldib, R.; Marzouk, M. Molecular Docking and Antiviral Evaluation of 2-Thioxo-benzo[g]quinazolin-4(3H)-one derivatives. Chem. Cent. J. 2016, 10, 1–7. [Google Scholar] [CrossRef] [PubMed]
- Al-Salahi, R.; El-dib, R.; Marzouk, M. Synthesis and in vitro cytotoxicity evaluation of new 2-thioxo-benzo[g]quinazolin-4(3H)–one derivatives. Heterocycles 2015, 91, 1735–1751. [Google Scholar] [CrossRef]
- Al-salahi, R.; Abuelizz, H.; Eldib, R.; Marzouk, M. Antimicrobial of 2-Thioxo-benzo[g]quinazolin-4(3H)-one derivatives. Med. Chem. 2017, 13, 85–92. [Google Scholar] [CrossRef]
- Abuelizz, H.A.; El-Dib, R.A.; Marzouk, M.; Al-Salahi, R. In vitro evaluation of new 2-phenoxy-benzo[g][1,2,4]triazolo[1,5-a]quinazoline derivatives as antimicrobial agents. Microbial Pathog. 2018, 117, 60–67. [Google Scholar] [CrossRef]
- Al-Salahi, R.; Moustapha, M.E.; Abuelizz, H.A.; Alharthi, A.I.; Alburikan, K.A.; Ibrahim, I.T.; Marzouk, M.; Motaleb, M.A. Radioiodination and biodistribution of newly synthesized 3-benzyl-2-([3-methoxybenzyl]thio) benzo[g]quinazolin-4-(3H)-one in tumor bearing mice. Saudi Pharm. J. 2018, 26, 1120–1126. [Google Scholar] [CrossRef]
- Al-Salahi, R.; Ahmad, R.; ElHassane, A.; Marzouk, M.; Abuelizz, H.A. 3-Benzyl(phenethyl)-2-thioxobenzo[g]quinazolines as a new class of potent α-glucosidase inhibitors: Synthesis and molecular docking study. Future Med. Chem. 2018, 10, 1889–1905. [Google Scholar] [CrossRef]
- Almehizia, A.A.; Abuelizz, H.A.; Taie, H.A.A.; ElHassane, A.; Marzouk, M.; Al-Salahi, R. Investigation the antioxidant activity of benzo[g]triazolo quinazolines correlated with a DFT study. Saudi Pharm. J. 2019, 27, 133–137. [Google Scholar] [CrossRef]
- Al-Salahi, R.; ElHassane, A.; Marzouk, M.; Abuelizz, H.A. Anti-HAV evaluation and molecular docking of newly synthesized 3-benzyl(phenethyl)benzo[g]quinazolines. Bioorg. Med. Chem. Lett. 2019, 29, 1614–1619. [Google Scholar] [CrossRef]
- Al-Salahi, R.; Taie, H.A.A.; Bakheit, A.H.; Marzouk, M.; Almehizia, A.A.; Herqash, R.; Abuelizz, H.A. Antioxidant activities and molecular docking of 2-thioxobenzo[g]quinazoline derivatives. Pharmacol. Rep. 2019, 71, 695–700. [Google Scholar] [CrossRef]
- Nowak, M.; Malinowski, Z.; Jóźwiak, A.J.; Fornal, E.; Błaszczyk, A.; Kontek, R. Substituted benzoquinazolinones. Part 1: Synthesis of 6-aminobenzo[h]quinazolinones via Buchwalde Hartwig amination from 6-bromobenzo[h]quinzolinones. Tetrahedron 2014, 70, 5153–5160. [Google Scholar] [CrossRef]
- Pendergast, W.; Dickerson, S.H.; Dev, I.K.; Ferone, R.; Duch, D.S.; Smith, G.K. Benzo[flquinazoline inhibitors of thymidylate synthase: Methyleneamino-linked aroylglutamate derivatives. J. Med. Chem. 1994, 37, 838–844. [Google Scholar] [CrossRef] [PubMed]
- Abuelizz, H.A.; Marzouk, M.; Bakheit, A.H.; Al-Salahi, R. Investigation of some benzoquinazoline and quinazoline derivatives as novel inhibitors of HCV-NS3/4A protease: Biological, molecular docking and QSAR studies. RSC Adv. 2020, 10, 35820–35830. [Google Scholar] [CrossRef]
- Khodair, A.I.; Elsafi, M.A.; Al-Issa, S.A. Simple and efficient synthesis of novel 3-substituted 2-thioxo-2,3-dihydro-1H-benzo[g]quinazolin-4-ones and their reactions with alkyl halides and α-glycolpy ranosyl bromides. J. Heterocycl. Chem. 2019, 56, 2358. [Google Scholar] [CrossRef]
- Fallah, A.; Sadeghinia, A.; Kahroba, H.; Samadi, A.; Heidari, H.R.; Bradaran, B.; Zeinali, S.; Molavi, O. Therapeutic targeting of angiogenesis molecular pathways in angiogenesis-dependent diseases. Biomed. Pharmacother. 2019, 110, 775–785. [Google Scholar] [CrossRef]
- Wan, J.; Zhang, L.; Yang, G.; Zhan, C.-G. Quantitative structure− activity relationship for cyclic imide derivatives of protoporphyrinogen oxidase inhibitors: A study of quantum chemical descriptors from density functional theory. J. Chem. Inf. Comput. Sci. 2004, 44, 2099–2105. [Google Scholar] [CrossRef]
- Kassem, A.F.; Nassar, I.F.; Abdel-Aal, M.T.; Awad, H.M.; El-Sayed, W.A. Synthesis and anticancer activity of new ((Furan-2-yl)-1,3,4-thiadiazolyl)-1,3,4-oxadiazole acyclic sugar derivatives. Chem. Pharm. Bull. 2019, 67, 888–895. [Google Scholar] [CrossRef]
- Abuelizz, H.A.; Awad, A.M.; Marzouk, M.; Nasr, F.A.; Bakheit, A.H.; Naglah, A.M.; Al-Salahi, R. Exploiting the 4-Hydrazinobenzoic acid moiety for the development of anticancer agents: Synthesis and biological profile. Bioorg. Chem. 2020, 102, 104098. [Google Scholar] [CrossRef]
- Alminderej, F.M.; Elganzory, H.H.; El-Bayaa, M.N.; Awad, H.M.; El-Sayed, W.A. Synthesis and cytotoxic activity of new 1,3,4-thiadiazole thiogl ycosides and 1,2,3-triazolyl-1,3,4-thiadiazole N-glycosides. Molecules 2019, 24, 3738. [Google Scholar] [CrossRef]
- Alaaeldin, G.M.F.; Soltan, M.M.; Esam, A.R.; Hanna, A.G. Synthesis and biological evaluation of novel 5-chloro-N-(4-sulfamoylbenzyl)salicylamide derivatives as tubulin polymerization inhibitors. MedChemComm 2018, 9, 1511–1528. [Google Scholar]
- Barua, A.; Yellapa, A.; Bahr, J.M.; Machado, S.A.; Bitterman, P.; Basu, S.; Sharma, S.; Abramowicz, J.S. VEGFR2-targeted ultrasound imaging agent anhances the detection of ovarian tumors at early stage in laying hens, a preclinical model of spontaneous ovarian cancer. Ultrasonic Imaging 2015, 37, 224–237. [Google Scholar] [CrossRef] [PubMed]
- Hasegawa, K.; Deushi, T.; Yoshida, H.; Miyashita, Y.; Sasaki, S.I. Chemometric QSAR studies of antifungal azoxy compounds. J. Comput. Aided Mol. Des. 1994, 8, 449–456. [Google Scholar] [CrossRef] [PubMed]
- Asadollahi, T.; Dadfarnia, S.; Shabani, A.M.H.; Ghasemi, J.B.; Sarkhosh, M. QSAR models for CXCR2 receptor antagonists based on the genetic algorithm for data preprocessing prior to application of the PLS linear regression method and design of the new compounds using in silico virtual screening. Molecules 2011, 16, 1928–1955. [Google Scholar] [CrossRef]
- Umar, B.A.; Uzairu, A.; Shallangwa, G.A.; Sani, U. QSAR modeling for the prediction of pGI50 activity of compounds on LOX IMVI cell line and ligand-based design of potent compounds using in silico virtual screening. Netw. Modeling Anal. Health Inform. Bioinform. 2019, 8, 22. [Google Scholar] [CrossRef]
- Veerasamy, R.; Rajak, H.; Jain, A.; Sivadasan, S.; Varghese, C.P.; Agrawal, R.K. Validation of QSAR models-strategies and importance. Int. J. Drug Des. Discov. 2011, 3, 511–519. [Google Scholar]
Sample Availability: Samples of the benzo[g]quinazoline compounds 1–17 are available from the authors at College of pharmacy- king Saud University. |


| Compound | IC50 (μM) ± SD | |
|---|---|---|
| HepG2 | MCF-7 | |
| 1 | 40.4 ± 4.1 | 10.7 ± 1.1 |
| 2 | 36.1 ± 3.6 | 10.5 ± 0.5 |
| 3 | 29.9 ± 2.5 | 10.1 ± 0.7 |
| 4 | 34.8 ± 3.1 | 10.2 ± 1.1 |
| 5 | 31.3 ± 3.1 | 10.6 ± 0.7 |
| 6 | 28.8 ± 2.6 | 10.7 ± 1.1 |
| 7 | 36.0 ± 3.1 | 9.8 ± 1.2 |
| 8 | 31.3 ± 3.1 | 10.9 ± 0.9 |
| 9 | 31.7 ± 3.1 | 10.2 ± 0.6 |
| 10 | 36.2 ± 3.5 | 8.8 ± 0.5 |
| 11 | 34.2 ± 2.9 | 10.6 ± 1.1 |
| 12 | 30.7 ± 3.1 | 11.2 ± 0.9 |
| 13 | 27.5 ± 2.1 | 10.1 ± 1.1 |
| 14 | 27.7 ± 2.5 | 9.6 ± 0.5 |
| 15 | 26.0 ± 2.5 | 9.4 ± 0.7 |
| 16 | 28.9 ± 2.3 | 10.4 ± 1.1 |
| 17 | 29.8 ± 2.1 | 10.1 ± 0.7 |
| Doxorubicin | 28.5 ± 1.9 | 10.3 ± 0.8 |
| Compound | Conc. μM | Necrosis | Apoptosis | Cell Cycle Distribution | Cell Growth Arrest at: | ||||
|---|---|---|---|---|---|---|---|---|---|
| Early | Late | Total | %G0/G1 | %S | %G2/M | ||||
| DMSO [HepG2] | 0.0 | 1.36 | 0.29 | 0.16 | 0.45 | 42.62 | 45.71 | 11.67 | --- |
| DMSO [MCF-7] | 0.0 | 0.87 | 0.45 | 0.11 | 0.56 | 54.08 | 36.43 | 9.49 | --- |
| 10 [MCF-7] | 8.8 | 9.61 | 4.64 | 17.03 | 21.67 | 39.28 | 26.17 | 34.55 | G2/M |
| 13 [HepG2] | 27.5 | 5.74 | 2.82 | 18.56 | 21.38 | 38.22 | 55.26 | 6.52 | S |
| 13 [MCF-7] | 10.1 | 15.31 | 7.28 | 14.94 | 22.22 | 62.39 | 33.25 | 4.36 | G1 |
| 14 [HepG2] | 27.7 | 6.33 | 2.97 | 13.42 | 16.39 | 38.66 | 52.31 | 9.03 | S |
| 14 [MCF-7] | 9.6 | 11.75 | 5.08 | 25.68 | 30.76 | 66.24 | 27.18 | 6.58 | G1 |
| 15 [HepG2] | 28.0 | 6.27 | 3.44 | 14.4 | 17.84 | 31.15 | 29.61 | 39.24 | G2/M |
| 15 [MCF-7] | 9.4 | 8.14 | 5.57 | 19.73 | 25.3 | 43.25 | 28.72 | 28.03 | G2/M |
| Compound | IC50 nM | Fold Relative to Sorafenib |
|---|---|---|
| 10 | 134.0 ± 8.2 | 4.5 |
| 13 | 46.6 ± 2.8 | 1.5 |
| 14 | 63.0 ± 3.9 | 2.0 |
| 15 | 44.4 ± 2.6 | 1.4 |
| Sorafenib | 31.1 ± 1.8 | 1.0 |
| Compound | Ligand | Receptor | Interaction | Distance | E (kcal/mol) | Binding Affinity (kcal/mol) | rmsd | Docking Score (S) | Binding Energy kcal/mol |
|---|---|---|---|---|---|---|---|---|---|
| 1 | O 1 | N CYS 919 (A) | H-acceptor | 3.07 | −3.1 | −6.133 | 1.543 | −9.076 | −26.8 |
| 6−ring | CD1 LEU 840 (A) | pi-H | 4.1 | −0.8 | |||||
| 6-ring | CG1 VAL 848 (A) | pi-H | 4.19 | −0.7 | |||||
| 2 | S 30 | CB LYS 868 (A) | H-acceptor | 3.73 | −0.8 | −6.087 | 1.695 | −9.145 | −24.54 |
| 6-ring | CD1 LEU 840 (A) | pi-H | 4.13 | −0.5 | |||||
| 6-ring | CG1 VAL 848 (A) | pi-H | 3.87 | −0.7 | |||||
| 6-ring | CG1 VAL 848 (A) | pi-H | 4.33 | −0.7 | |||||
| 3 | O 1 | CA PHE 918 (A) | H-acceptor | 3.42 | −0.6 | −7.077 | 0.7452 | −10.42 | −33.57 |
| O 1 | N CYS 919 (A) | H-acceptor | 2.96 | −3.8 | |||||
| C 10 | 6-ring PHE 104 (A) | H-pi | 3.59 | −0.9 | |||||
| 6-ring | CD1 LEU 840 (A) | pi-H | 4.16 | −0.6 | |||||
| 4 | O 1 | CA PHE 918 (A) | H-acceptor | 3.45 | −0.6 | −8.073 | 2.766 | −10.47 | −39.66 |
| O 1 | N CYS 919 (A) | H-acceptor | 3.07 | −3 | |||||
| 6-ring | CD1 LEU 840 (A) | pi-H | 4.1 | −0.8 | |||||
| 6-ring | CG1 VAL 848 (A) | pi-H | 4.24 | −0.7 | |||||
| 5 | O 1 | N CYS 919 (A) | H-acceptor | 3.17 | −2.3 | −8.352 | 2.081 | −11.94 | −39.35 |
| 6-ring | CD1 LEU 840 (A) | pi-H | 4.06 | −0.8 | |||||
| 6-ring | CG1 VAL 848 (A) | pi-H | 4.28 | −1 | |||||
| 6 | O 1 | N CYS 919 (A) | H-acceptor | 2.88 | −3.8 | ||||
| 6-ring | CD1 LEU 840 (A) | pi-H | 4.39 | −0.5 | −7.608 | 2.217 | −11.29 | −35.42 | |
| 6-ring | CD1 LEU 840 (A) | pi-H | 4.22 | −0.6 | |||||
| 7 | O 1 | N CYS 919 (A) | H-acceptor | 2.88 | −4.2 | −8.097 | 1.5 | −11.99 | −41.31 |
| N 22 | N ASP 1046 (A) | H-acceptor | 3.3 | −1.6 | |||||
| 6-ring | CD1 LEU 840 (A) | pi-H | 4.56 | −0.5 | |||||
| 6-ring | CD1 LEU 840 (A) | pi-H | 4.16 | −0.6 | |||||
| 8 | O 1 | N CYS 919 (A) | H-acceptor | 2.9 | −3.8 | −8.184 | 1.272 | −12.03 | −41.37 |
| O 21 | N ASP 1046 (A) | H-acceptor | 3 | −0.9 | |||||
| 6-ring | CD1 LEU 840 (A) | pi-H | 4.43 | −0.5 | |||||
| 6-ring | CD1 LEU 840 (A) | pi-H | 4.23 | −0.5 | |||||
| 9 | 6-ring | CD1 LEU 840 (A) | pi-H | 4.4 | −0.8 | −7.008 | 0.8151 | −9.659 | −26.6 |
| 6-ring | CD1 LEU 840 (A) | pi-H | 4 | −1 | |||||
| 6-ring | CG1 VAL 848 (A) | pi-H | 3.72 | −1.1 | |||||
| 10 | S 12 | O ASP 1046 (A) | H-donor | 4.08 | −0.2 | −7.556 | 0.9181 | −10.75 | −24.99 |
| 6-ring | CD1 LEU 840 (A) | pi-H | 3.87 | −0.8 | |||||
| 6-ring | CG1 VAL 848 (A) | pi-H | 4.24 | −0.6 | |||||
| 11 | O 1 | N CYS 919 (A) | H-acceptor | 2.84 | −4 | −8.022 | 1.192 | −11.03 | −37.82 |
| N 25 | N ASP 1046 (A) | H-acceptor | 3.25 | −1.5 | |||||
| 6-ring | CB LEU 840 (A) | pi-H | 4.56 | −0.6 | |||||
| 6-ring | CD1 LEU 840 (A) | pi-H | 4.43 | −0.5 | |||||
| 6-ring | CD1 LEU 840 (A) | pi-H | 4.36 | −0.5 | |||||
| 12 | O 1 | N CYS 919 (A) | H-acceptor | 2.84 | −4 | −7.861 | 1.907 | −10.42 | −34.37 |
| 6-ring | CB LEU 840 (A) | pi-H | 4.55 | −0.6 | |||||
| 6-ring | CD1 LEU 840 (A) | pi-H | 4.44 | −0.5 | |||||
| 6-ring | CD1 LEU 840 (A) | pi-H | 4.37 | −0.5 | |||||
| 13 | N 31 | N ASP 1046 (A) | H-acceptor | 3.3 | −1.6 | −8.133 | 1.971 | −11.22 | −35.75 |
| S 12 | SG CYS 1045 (A) | H-donor | 3.82 | −0.3 | |||||
| 6-ring | CG1 VAL 848 (A) | pi-H | 4.19 | −0.4 | |||||
| 14 | O 1 | CA PHE 918 (A) | H-acceptor | 3.22 | −1.2 | −8.307 | 1.24 | −11.39 | −30.04 |
| O 1 | N CYS 919 (A) | H-acceptor | 2.88 | −2.5 | |||||
| 6-ring | CD1 LEU 840 (A) | pi-H | 4.2 | −0.8 | |||||
| 6−ring | CG1 VAL 848 (A) | pi-H | 4.32 | −1 | |||||
| 15 | O 35 | N CYS 919 (A) | H-acceptor | 2.44 | −1.3 | −9.669 | 1.31 | −10.75 | −47.76 |
| N 37 | N ASP 1046 (A) | H-acceptor | 2.37 | −1.1 | |||||
| 6-ring | CD1 LEU 840 (A) | pi-H | 2.85 | −0.5 | |||||
| 5-ring | CD1 LEU 840 (A) | pi-H | 2.85 | −0.5 | |||||
| 5-ring | CG1 VAL 848 (A) | pi-H | 3.57 | −0.6 | |||||
| C 19 | 6-ring Phe 1047 (A) | pi-H | 4.56 | −0.1 | |||||
| 16 | O 1 | N CYS 919 (A) | H-acceptor | 3.16 | −2.5 | −6.206 | 0.7808 | −10.12 | −26.87 |
| 17 | O 1 | N CYS 919 (A) | H-acceptor | 2.91 | −1.3 | −6.291 | 0.9979 | −11.55 | −24.36 |
| 6-ring | CD1 LEU 840 (A) | pi-H | 3.91 | −0.9 | |||||
| Axitinib | N82 3 | OE2 GLU 885 (A) | H-donor | 2.91 | −2.8 | −9.178 | 1.157 | −12.66 | −48.69 |
| S24 19 | O ASP 1046 (A) | H-donor | 3.84 | −0.3 | |||||
| O81 1 | N ASP 1046 (A) | H-acceptor | 3.01 | −3.6 | |||||
| N14 30 | N CYS 919 (A) | H-acceptor | 3.11 | −2.4 | |||||
| 6-ring | CD2 LEU 840 (A) | pi-H | 4.14 | −0.5 | |||||
| Sorafenib | N12 40 | OE2 GLU 885 (A) | H-donor | 2.92 | −5.5 | −11.01 | 0.3431 | −14.18 | −70.11 |
| N14 42 | O HOH 2142 (A) | H-donor | 3.02 | −0.8 | |||||
| O15 44 | N ASP 1046 (A) | H-acceptor | 2.88 | −2.3 | |||||
| N26 46 | N CYS 919 (A) | H-acceptor | 3.25 | −3 | |||||
| O32 48 | O HOH 2090 (A) | H-acceptor | 2.88 | −2.3 |
Publisher’s Note: MDPI stays neutral with regard to jurisdictional claims in published maps and institutional affiliations. |
© 2020 by the authors. Licensee MDPI, Basel, Switzerland. This article is an open access article distributed under the terms and conditions of the Creative Commons Attribution (CC BY) license (http://creativecommons.org/licenses/by/4.0/).
Share and Cite
Abuelizz, H.A.; Marzouk, M.; Bakheit, A.H.; Awad, H.M.; Soltan, M.M.; Naglah, A.M.; Al-Salahi, R. Antiproliferative and Antiangiogenic Properties of New VEGFR-2-targeting 2-thioxobenzo[g]quinazoline Derivatives (In Vitro). Molecules 2020, 25, 5944. https://doi.org/10.3390/molecules25245944
Abuelizz HA, Marzouk M, Bakheit AH, Awad HM, Soltan MM, Naglah AM, Al-Salahi R. Antiproliferative and Antiangiogenic Properties of New VEGFR-2-targeting 2-thioxobenzo[g]quinazoline Derivatives (In Vitro). Molecules. 2020; 25(24):5944. https://doi.org/10.3390/molecules25245944
Chicago/Turabian StyleAbuelizz, Hatem A., Mohamed Marzouk, Ahmed H. Bakheit, Hanem M. Awad, Maha M. Soltan, Ahmed M. Naglah, and Rashad Al-Salahi. 2020. "Antiproliferative and Antiangiogenic Properties of New VEGFR-2-targeting 2-thioxobenzo[g]quinazoline Derivatives (In Vitro)" Molecules 25, no. 24: 5944. https://doi.org/10.3390/molecules25245944
APA StyleAbuelizz, H. A., Marzouk, M., Bakheit, A. H., Awad, H. M., Soltan, M. M., Naglah, A. M., & Al-Salahi, R. (2020). Antiproliferative and Antiangiogenic Properties of New VEGFR-2-targeting 2-thioxobenzo[g]quinazoline Derivatives (In Vitro). Molecules, 25(24), 5944. https://doi.org/10.3390/molecules25245944