Article

Discrimination of Lycium chinense and L. barbarum Based on Metabolite Analysis and Hepatoprotective Activity

1
Department of Chemistry and Nanoscience, Ewha Womans University, Seoul 03760, Korea
2
College of Pharmacy, Ewha Womans University, Seoul 03760, Korea
3
College of Pharmacy, Sunchon National University, Suncheon 57922, Korea
4
Department of Convergence Study on the Ocean Science and Technology, Korea Maritime and Ocean University, Busan 4912, Korea
5
Biomix Co., Ltd. 142, Ilsan-ro, Ilsandong-gu, Goyang-si, Gyeonggi-do 10442, Korea
6
New Drug Development Center, Daegu Gyeongbuk Medical Innovation Foundation, Daegu 41061, Korea
*
Authors to whom correspondence should be addressed.
These authors contributed equally to this work.
Molecules 2020, 25(24), 5835; https://doi.org/10.3390/molecules25245835
Submission received: 17 November 2020 / Revised: 9 December 2020 / Accepted: 9 December 2020 / Published: 10 December 2020

Abstract

:
Lycii Fructus is a traditional medicine used to prevent liver and kidney diseases, which commonly derives from Lycium chinense and Lycium barbarum. Here, the extracts and ethyl acetate-soluble fractions of L. chinense fruits exhibited better hepatoprotective effects than those of L. barbarum, which was likely due to differences in their composition. Therefore, GC-MS and HPLC analyses were conducted to characterize the metabolite differences between L. chinense and L. barbarum. Based on amino acid (AA) and phenolic acid (PA) profiling, 24 AAs and 9 PAs were identified in the two species. Moreover, each species exhibited unique and readily distinguishable AA and PA star graphic patterns. HPLC analysis elucidated composition differences between the ethyl acetate-soluble layers of the two compounds. Further, NMR analysis identified their chemical structures as 4-(2-formyl-5-(hydroxymethyl)-1H-pyrrol-1-yl)butanoic acid and p-coumaric acid. The higher content of 4-(2-formyl-5-(hydroxymethyl)-1H-pyrrol-1-yl)butanoic acid was detected in L. chinense, whereas the content of p-coumaric acid was higher in L. barbarum. Therefore, the differences in the relative contents of these two secondary metabolites in the ethyl acetate-soluble layer of Lycii Fructus could be a good marker to discriminate between L. chinense and L. barbarum.

1. Introduction

Recent development of discrimination methods to distinguish herb products is mainly based on molecular evidence. For example, several molecular discrimination methods of the genus Cynanchum were developed employing InDel markers [1], the ARMS-PCR method [2], and ITS2 barcode analysis [3]. However, the discrimination methods based on molecular evidence are limited when a processed product is the target of the discrimination, which may lose the sequencing information during the extraction, heating, and drying procedures. From this perspective, chemical analysis may have its own merits and could be employed as a complementary method with a molecular analysis.
Lycii Fructus, the dried fruit of Barbary Wolfberry, is widely cultivated in China, Japan, and Korea due to its therapeutic value. Traditionally, Lycii Fructus was used as an herbal medicine to strengthen the liver and kidney [4], as well as an ingredient for functional teas in China, North America, and Southeast Asia [5]. Moreover, the uracil, rutin, and ascorbic acid contents of Lycii Fructus have been linked to anti-diabetic effects [6]. Cerebrosides and pyrrole compounds from this herb have been also reported to possess protective effects against hepatotoxicity caused by carbon tetrachlorides [7,8]. Betaine was also isolated from Lycii Fructus and was found to possess hepatoprotective, hypotensive, and anti-diabetic effects. However, betaine is a naturally occurring water-soluble N-timethylated amino acid both in Lycium chinense and Lycium barbarum. Therefore, it is not a suitable marker to discriminate between these two species [9,10]. Additionally, detailed studies are required to characterize the components of these Lycium species and their bioactivities. Therefore, GC-MS/HPLC-DAD was conducted to compare the metabolite profiles of L. chinense and L. barbarum. Amino acid (AA) and phenolic acid (PA) were analyzed by GC-MS, whereas secondary metabolites were analyzed by HPLC-DAD/LC-MS from the ethyl acetate (EA)-soluble extracts of both species. Our findings were ultimately used to discriminate between the two species.

2. Results

2.1. Hepatoprotective Activity of Extracts and Fractions of L. chinense and L. barbarum

The hepatoprotective effects of the crude extracts and fractions of L. chinense and L. barbarum were investigated in vitro. Hepatoprotective activities were evaluated against acetaminophen-induced cytotoxicity using HepG2 human hepatoma cells. The crude extracts and fractions of L. chinense displayed hepatoprotective effects. Specifically, the EA layer showed significant and dose-dependent activity. However, L. barbarum crude extracts had no effects, and the water layer showed weak activity at 20 ppm concentration only. As the crude extracts and fractions from both species showed no cytotoxicity on HepG2 cells, this difference suggested that the two species had different active compound compositions (Figure 1).

2.2. Amino Acid and Phenolic Acid Profiling Analyses

The presence of amino acids and phenolic acids of L. chinense and L. barbarum was analyzed using gas chromatography-mass spectrometry (GC-MS). A total of 24 amino acids (AAs) were identified as ethoxycarbonyl-tert-butyldimethylsilyl (EOC-TBDMS) derivatives (Table 1), and nine phenolic acids (PAs) were identified as tert-butyldimethylsilyl (TBDMS) derivatives (Table 2). The levels of AAs and PAs were reported as total (ng/mg) and normalized values in Table 1 and Table 2. Asparagine was the most abundant among the 24 aforementioned AAs in L. chinense, followed by proline and glutamine. In contrast, proline was the most abundant AA in L. barbarum, followed by glutamine and asparagine. Among the nine identified PAs, ferulic acid was the most abundant in L. chinense, followed by vanillic acid and 4-hydroxybenzoic acid, whereas, p-coumaric acid was the most abundant in L. barbarum, followed by ferulic acid and 4-hydroxybenzoic acid. The three most abundant AAs (asparagine, proline, and glutamine) in both species are known to possess liver-protective effects. The distribution of the three AAs varied greatly between the two species [11,12,13]. Additionally, the most abundant PAs (vanillic acid, p-coumaric acid, and ferulic acid) are known to have a hepatoprotective effect, and the three PAs also exhibited different distributions between the two species [14,15,16]. Therefore, among the AA and PA profiles of L. chinense and L. barbarum, these six metabolites were deemed suitable markers to distinguish between the two species.

2.3. Star Pattern Recognition Analysis

The levels of 24 AAs and 9 PAs in L. chinense were normalized to their corresponding mean levels in L. barbarum (Table 1 and Table 2). The overall patterns of AA and PA differences were informative to understand the differences between the two species. In the star symbol plot shown in Figure 2, the levels of eight AAs in L. chinense (alanine, proline, pyroglutamic acid, threonine, aspartic acid, N-methyl-DL-aspartic acid, homocysteine, and glutamine) were lower than those of L. barbarum. Moreover, the levels of 16 AAs were higher in L. chinense compared to those of L. barbarum. In the PA star symbol plots, the levels of five PAs in L. chinense were lower than those of L. barbarum (4-hydroxybenzoic acid, p-coumaric acid, protocatechuic acid, ferulic acid, and caffeic acid) (Figure 3). The differences between L. chinense and L. barbarum were clearly illustrated in the AA and PA star symbol plots (Figure 2 and Figure 3). Therefore, the star symbol plot patterns of AAs and PAs might be useful for the visual discrimination of L. chinense and L. barbarum.

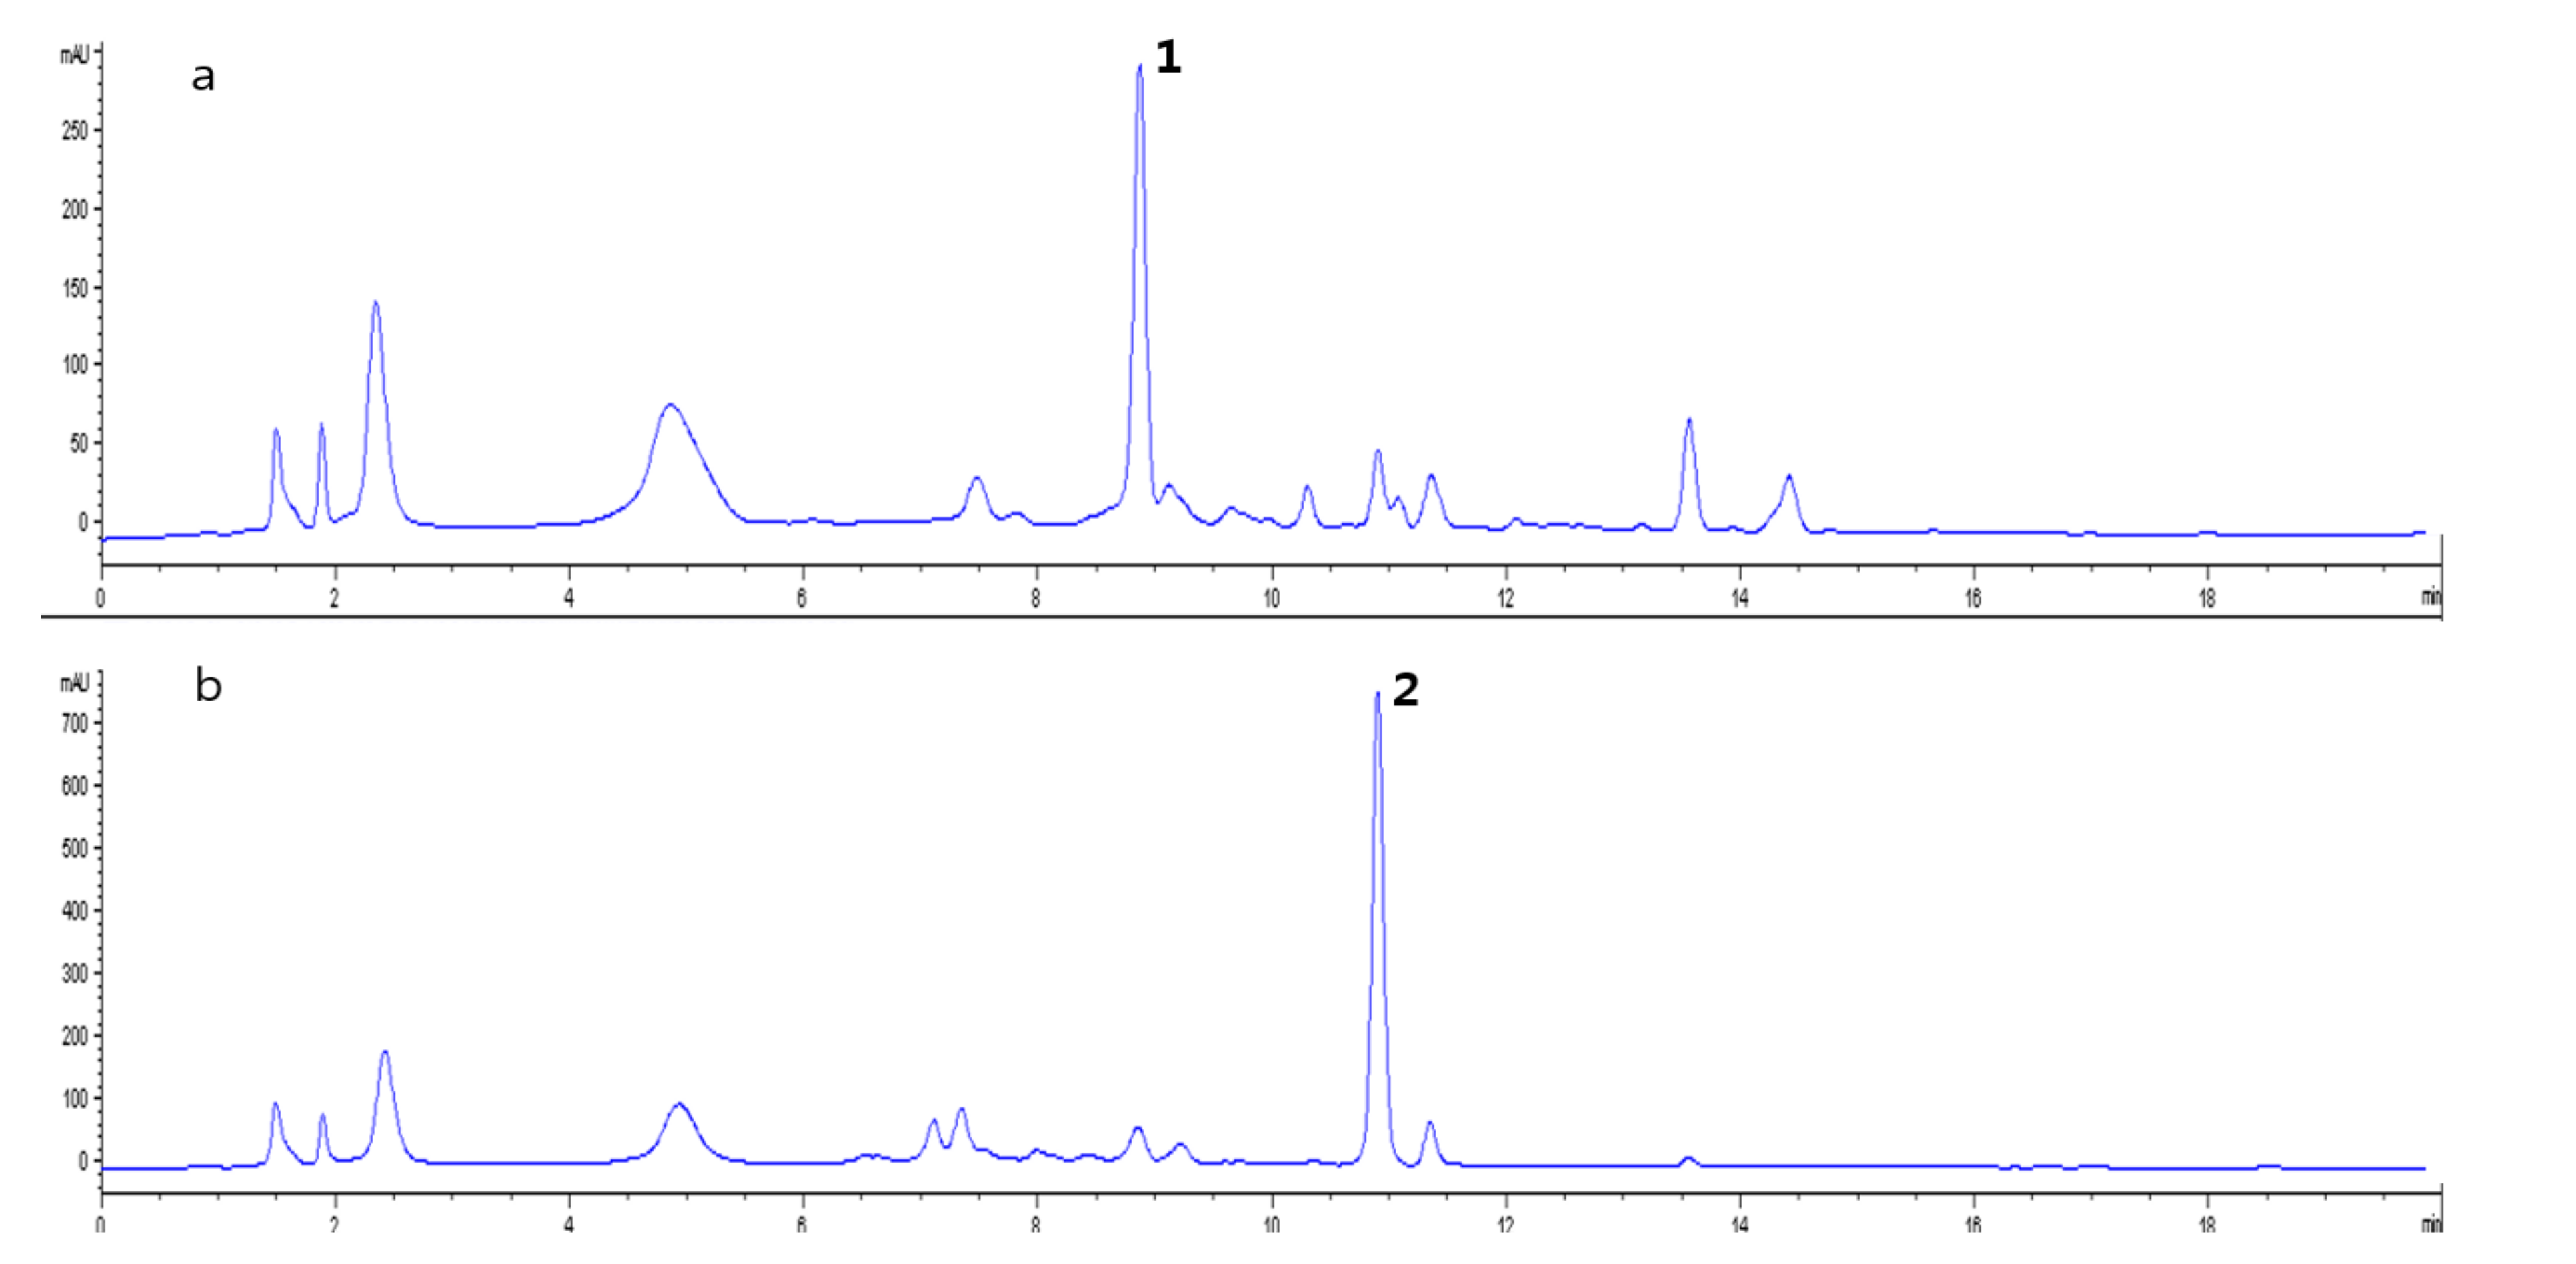
2.4. Identification of Compounds with Different Contents in L. chinense and L. barbarum

The ethyl acetate-soluble layers of L. chinense and L. barbarum were analyzed using HPLC. A peak with a retention time of 8.9 min in L. chinense was higher than that of L. barbarum, whereas a peak with a retention time of 10.9 min was higher in L. barbarum (Figure 4). HPLC-UV guided isolation of each extract yielded two compounds and their chemical structures were identified by comparing their spectroscopic data to those of previously reported compounds. The 1H-NMR spectroscopic data of a peak with a retention time of 8.9 min (1) displayed eleven proton signals, including an aldehyde proton (δH 9.43) and two heteroatomic aromatic protons (δH 6.98 (1H, d, J = 4.1 Hz, H-3) and 6.27 (1H, d, J = 4.1 Hz, H-4)). By comparing the 1H-NMR and MS data to those of previously characterized structures [8], compound 1 was identified as 4-[formyl-5-(hydroxymethyl)-1H-pyrrol-1-yl]butanoic acid (Figure 5). The 1H-NMR spectrum of a peak with a retention time of 10.9 min (2) showed para-substituted aromatic protons (δH 7.46 (2H, d, J = 8.6 Hz, H-2, H-6), 6.82 (2H, d, J = 8.6 Hz, H-3, H-5)) and two olefinic protons (δH 7.61 (1H, d, J = 15.8Hz, H-7), 6.30 (1H, d, J = 15.8 Hz, H-8)). The chemical structure of compound 2 was identified as p-coumaric acid based on previously reported 1H- and 13C-NMR data (Figure 5).
The contents of compounds 1 and 2 in 12 samples of two types of commercially available Lycii Fructus were analyzed. Compound 1 was detected in L. chinense only, whereas compound 2 was observed noticeably in L. barbarum (Figures S5 and S6 in Supplementary Materials). Thus, compounds 1 and 2 could be suitable markers to discriminate between L. chinense and L. barbarum.

2.5. Hepatoprotective Effect of 4-(2-formyl-5-(hydroxymethyl)-1H-pyrrol-1-yl)Butanoic Acid Isolated from L. chinense

Compound 1 (4-(2-formyl-5-(hydroxymethyl)-1H-pyrrol-1-yl)butanoic acid) is known to inhibit CCl4-induced glutamic pyruvic transaminase (GPT) release in rat primary hepatocytes. On the other hand, compound 2 (p-coumaric acid) is a well-known plant-derived natural product that reportedly inhibits melanin formation in murine melanoma cells stimulated by the α-melanocyte-stimulating hormone [17,18]. This compound also inhibits mushroom, murine, and human tyrosinases [19].
The hepatoprotective effect of the two herbs was evaluated against acetaminophen-induced cytotoxicity in HepG2 cells. L. chinense extracts and fractions exhibited strong hepatoprotective effects in a dose-dependent manner (Figure 1).
Further, the hepatoprotective effects of compound 1 were evaluated to confirm its putative properties. Notably, this compound exhibited dose-dependent and significant hepatoprotective effects up to 2.5 ppm (Figure 6).

3. Materials and Methods

3.1. Plant Material

One set of dried L. chinense and L. barbarum fruits were provided by Biomix Co. Ltd. (Goyang-si, Korea), whereas five sets were purchased from an herbal medicine commercial brand in Korea and were identified by one of the authors. A total six sets of dried L. chinense and L. barbarum fruits were used for analysis. After the analysis, the herb fruits were then each combined for the isolation of the compounds and prepared for the assay samples. Voucher specimens (ESN) documenting this purchase were deposited at the Natural Product and Medicine Research Laboratory, Department of Chemistry and Nanoscience, Ewha Womans University.

3.2. Chemical and Reagents

The AA standards, PA standards, ethyl chloroformate (ECF), and triethylamine (TEA) were purchased from Sigma-Aldrich (St. Louis, MO, USA). N-Methyl-N-tert-butyldimethylsilyl trifluoroacetamide (MTBSTFA) was obtained from Pierce (Rockford, IL, USA). Toluene, diethyl ether, ethyl acetate, and dichloromethane of analysis-grade pesticide residue were purchased from Kanto Chemical (Tokyo, Japan).

3.3. Extraction, Fractionation, and Isolation of Compounds

The dried and ground L. chinense (0.8 kg) and L. barbarum (0.8 kg) fruits were separately extracted with distilled water (3 L) via 30 min of sonication (40 kHz frequency, 523 W, DAIHAN, Seoul, Korea) and then the water (0.1 L) was removed in vacuo to obtain the crude extracts. The rest (2.9 L) was then partitioned with ethyl acetate (EtOAc) (5 L × 4 times). The water-soluble layer was dried in vacuo with large-capacity evaporator WEV-1020 (DAIHAN, Seoul, Korea) to have the water extracts of L. chinense (45 g) and L. barbarum (36 g), respectively. The EtOAc-soluble layer was dried in vacuo with the large-capacity evaporator. After filtration and concentration, the EtOAc extract (2.1 g) of L. chinense was fractionated via silica normal phase column chromatography eluting with a step gradient from 0 to 100% methanol (MeOH) in dichloromethane (DCM) distributed into eight fractions. The sixth fraction (DCM:MeOH = 80:20, 158 mg) was subjected to reversed-phase HPLC with 40% aqueous acetonitrile (Watchers 120 ODS-BP, ISU Industry Corp., Seoul, Korea, 250 × 10 mm, 5 μm, 2.0 mL/min, UV = 310 nm) to render 4-(2-formyl-5-(hydroxymethyl)-1H-pyrrol-1-yl)butanoic acid (1, 2.0 mg) with a retention time of 8.9 min. The EtOAc extract (1.8 g) of L. barbarum was fractionated by silica normal phase column chromatography eluting with the same ratio of DCM and MeOH. The fourth fraction (DCM:MeOH = 95:5, 112 mg) was subjected to reversed-phase HPLC with 23% aqueous acetonitrile (Watchers 120 ODS-BP, 250 × 10 mm, 5 μm, 2.0 mL/min, UV = 280 nm) to render p-coumaric acid (2, 13.4 mg) with a retention time of 10.9 min. The isolation of the compounds was performed by a Waters 616 quaternary HPLC pump and a Waters 996 photodiode array detector (Waters, Milford, MA, USA).
4-[Formyl-5-(hydroxymethyl)-1H-pyrrol-1-yl]butanoic acid (1): 1H-NMR (400 MHz, CD3OD) δH 9.43 (1H, s, CHO), 6.98 (1H, d, J = 4.1 Hz, H-3), 6.27 (1H, d, J = 4.1 Hz, H-4), 4.65 (2H, s, H-6), 4.39 (2H, t, J = 7.6 Hz, H-1′), 2.31 (2H, t, J = 7.5 Hz, H-3′), 2.01 (2H, q, J = 7.4 Hz, H-2′); 13C-NMR (100 MHz, CD3OD) δC 180.9 (CH, C-1), 176.7 (qC, C-4′), 144.6 (qC, C-5), 133.5 (qC, C-2), 126.4 (CH, C-3), 111.5 (CH, C-4), 56.4 (CH2, C-6), 45.8 (CH2, C-1′), 31.7 (CH2, C-3′), 27.6 (CH2, C-2′); LRMS: m/z 212.3 [M + H]+.
p-Coumaric acid (2): 1H-NMR (300 MHz, CD3OD) δH 7.61(1H, d, J = 15.8Hz, H-7), 7.46 (2H, d, J = 8.6 Hz, H-2, H-6), 6.82 (2H, d, J = 8.6 Hz, H-3, H-5), 6.30 (1H, d, J = 15.8 Hz, H-8); 13C-NMR (125 MHz, CD3OD) δC 170.0 (qC, C-9), 160.0 (qC, C-4), 145.3 (CH, C-7), 130.8 (CH, C-2, C-6), 126.6 (qC, C-1), 116.7 (CH, C-3, C-5), 115.9 (CH, C-8); LRMS: m/z 165.0 [M + H]+.

3.4. Hepatoprotection Assay

HepG2 cells (human hepatocellular carcinoma) were obtained from ATCC (Manassas, VA, USA). The cells were cultured in 75T culture plates and were maintained in standard culture conditions using Dulbecco’s Modified Eagle’s Medium (DMEM) containing 10% fetal bovine serum (FBS), 1% penicillin-streptomycin, and incubated in a 5% CO2 humidified atmosphere at 37 °C [20,21,22,23,24,25,26]. The culture medium was changed twice a week. At 70 to 80% cell confluence, adherent cells were released with a solution of trypsin (Hyclone, South Logan, UT, USA). HepG2 cells were seeded at 1 × 10⁶ cells/mL for the experiments. WST-1 (4-[3-(indophenyl)-2-(4-nitrophenyl)-2H-5-tetrazolio]-1,3-benzene disulfonate) (Roche, Indianapolis, IN, USA) solution was used to investigate cell viability. For the WST-1 assay, 1 × 10⁴ cells were seeded into 96-well plates. HepG2 cells treated with the samples (with or without acetaminophen) were incubated with 200 μL of WST-1 solution for 2.5 h at 37 °C at 5% CO2 in the dark. A total of 100 μL of the supernatant was transferred into each well of a 96-well plate, and absorbance was measured at 450 nm. An amount of 1000× DMSO stock solution was prepared for each concentration of extract and diluted 1000 times in the culture media to achieve the indicated concentrations. APAP was prepared as 200× stock in DMSO and spiked to the culture media to achieve the indicated concentrations. Where APAP or extract stock solution was not treated, the same amount of DMSO was spiked (final DMSO concentration 0.6%). All measurements were performed in triplicate.

3.5. Gas Chromatography-Mass Spectrometry

The GC-MS analysis of AAs and PAs was performed using an Agilent 7890 N gas chromatograph (Agilent Technologies, Santa Clara, CA, USA) interfaced with an Agilent 5975C mass-selective detector (70 eV, electron ionization mode) using an Ultra-2 capillary column (25 m × 0.20 mm I.D., 0.11 μm film thickness; Agilent Technologies, Santa Clara, CA, USA). Helium was used as the carrier gas at a constant flow rate of 0.5 mL/min. Samples (1 μL) were then injected and the analysis was conducted in split-injection mode (10:1). For amino acid analysis, the oven temperature was set initially to 140 °C for 2 min and increased to 240 °C at a 5 °C/min rate, and finally to 300 °C at a 30 °C/min rate with a holding time of 5 min. For phenolic acid analysis, the oven temperature was set initially at 180 °C for 1 min and increased to 300 °C at a 15 °C/min rate with a holding time of 5 min.

3.6. Sample Preparation for Amino Acids Profiling Analysis

AA profiling analysis (as EOC-TBDMS derivatives) was performed using GC-MS as described in a previous study [21]. Each Lycii Fructus sample (0.1 mg) with norvaline as internal standard (IS) (0.1 μg) were spiked into deionized water (1 mL) and added to dichloromethane (2.0 mL) containing ECF (20 μL), after which the pH was adjusted to ≥12 with 5.0 M sodium hydroxide. A two-phase EOC reaction was performed via vortex mixing for 10 min. After the EOC reaction, the pH was adjusted to ≤2 with 10% H2SO4, after which the product was saturated with sodium chloride and sequentially extracted using diethyl ether (3 mL) and ethyl acetate (2 mL). The extracts were evaporated to dryness under a gentle stream of nitrogen (40 °C). Prior to GC-MS analysis, the TBDMS derivative was produced with toluene (15 μL), MTBSTFA (20 μL), and triethylamine (5 μL) for 30 min at 60 °C. All samples were prepared individually in triplicate and analyzed directly by GC-MS.

3.7. Sample Preparation for Phenolic Acids Profiling Analysis

PA profiling analysis (as TBDMS derivatives) was performed using GC-MS [22,23]. Each Lycii Fructus sample (10 mg) with naproxen as an internal standard (0.2 μg) was spiked into deionized water (1 mL) and was adjusted to pH ≤ 2 with 10% H2SO4, saturated with sodium chloride, and sequentially extracted three times using diethyl ether and a dichloromethane mixture (2:1, v:v). The extracts were evaporated to dryness under a gentle stream of nitrogen (40 °C). Prior to GC-MS analysis, the TBDMS derivative was produced with toluene (15 μL), MTBSTFA (20 μL), and triethylamine (5 μL) for 60 min at 100 °C All samples were prepared individually in triplicate and analyzed directly by GC-MS.

3.8. Star Symbol Plotting

The levels of 24 AAs and nine PAs in each Lycii Fructus were determined based on calibration curves. The mean AA and PA values in L. chinense were normalized to the corresponding mean values of L. barbarum. Each normalized value was plotted as a line radiating from a common central point. The far ends of the lines were joined together to produce star symbol plots using MS Excel (Microsoft, Redmond, WA, USA) [24,25].

3.9. HPLC Analysis

HPLC analysis was carried out on an Agilent 1200 HPLC system with a G1315C diode array detector and an Agilent Technologies 6120 quadrupole instrument using a reverse phased column (Phenomenex Luna C-18 (2) 100 Å, 100 × 4.6 mm, 5 μm). The column was maintained at 25 °C and the flow rate was set at 1.0 mL/min. A 15 μL volume was injected into the column. Mobile phases were water (solvent A) and CH3CN (solvent B) solutions containing 0.1% (v/v) TFA. The initial conditions were 95:5 (A:B) and were held for 2 min; the percentage of CH3CN was increased to 30 from 2 to 10 min and held for 7 min; the percentage of CH3CN was increased linearly from 17 to 20 min and held for 3 min.

3.10. NMR Analysis

NMR spectra were recorded on 300 and 400 MHz for 1H-NMR, and 100 and 125 MHz for 13C-NMR (Varian Inova, Agilent, Santa Clara, CA, USA). CD3OD was used for the NMR solvent (Cambridge Isotope Laboratories, Tewksbury, MA, USA).

4. Conclusions

L. chinense and L. barbarum are currently discriminated based on gustatory patterns and sweetness [9]. However, this method is not suitable to identify species or origin in the health food or drink industries, which employ the herbs in powder or extract forms. Also, recently developed discrimination methods have limitations for the analysis of processed herb products. The star symbol plots produced from the analysis of 24 AAs and 9 PAs conducted herein were unique for both species and could therefore be used to discriminate between them. Additionally, compounds 1 and 2 would be useful identification markers for the discrimination of these two species. Importantly, the hepatoprotective activity of compound 1 partially demonstrated the therapeutic values of the L. chinense.

Supplementary Materials

The following materials are available online. 1H- and 13C-NMR spectra of compounds 1 and 2 (Figures S1–S4), commercially available Lycii Fructus, and corresponding LC chromatograms (Figures S5 and S6).

Author Contributions

Experiment, M.-J.R., M.K., M.J., and C.L.; resources, S.-B.H.; data curation, J.C. and E.K.S.; writing—original draft preparation, M.-J.R., M.K., and M.J.; writing—review and editing, I.Y.; supervision, M.-J.P., K.-M.L., and S.-J.N.; project administration, M.-J.P., K.-M.L., and S.-J.N.; funding acquisition, K.-M.L. All authors have read and agreed to the published version of the manuscript.

Funding

This research was supported by a grant from the Ministry of Trade, Industry & Energy (MOTIE), Korea Institute for Advancement of Technology (KIAT) through the Encouragement Program for The Industries of the Economic Cooperation Region and the National Research Foundation of Korea (2018R1D1A1B07042919 and 2018R1A5A2025286).

Conflicts of Interest

The authors declare no conflict of interest.

References

  1. Kim, Y.; Choi, H.; Shin, J.; Jo, A.; Lee, K.E.; Cho, S.S.; Hwang, Y.P.; Choi, C. Molecular discrimination of Cynanchum wilfordii and Cynanchum auriculatum by InDel markers of chloroplast DNA. Molecules 2018, 23, 1337. [Google Scholar] [CrossRef] [Green Version]
  2. Han, E.H.; Lee, S.J.; Kim, M.B.; Shin, Y.W.; Kim, Y.H.; Lee, S.W. Molecular marker analysis of Cynanchum wilfordii and C. auriculatum using the simple ARMS-PCR method with mismatched primers. Plant Biotechnol. Rep. 2017, 11, 127–133. [Google Scholar] [CrossRef]
  3. Guo, M.; Ren, L.; Pang, X. Inspecting the true identity of herbal materials from Cynanchum using ITS2 barcode. Front. Plant Sci. 2017, 8, 1–10. [Google Scholar] [CrossRef] [PubMed]
  4. Peng, Y.; Ma, C.; Li, Y.; Leung, K.S.Y.; Jiang, Z.H.; Zhao, Z. Quantification of zeaxanthin dipalmitate and total carotenoids in Lycium fruits (Fructus Lycii). Plant Foods Hum. Nutr. 2005, 60, 161–164. [Google Scholar] [CrossRef] [PubMed]
  5. Duan, H.; Chen, Y.; Chen, G. Far infrared-assisted extraction followed by capillary electrophoresis for the determination of bioactive constituents in the leaves of Lycium barbarum Linn. J. Chromatogr. A 2010, 1217, 4511–4516. [Google Scholar] [CrossRef]
  6. Kim, K.S.; Shim, S.H.; Jeong, G.H.; Cheong, C.S.; Ko, K.H.; Park, J.H.; Huh, H.; Lee, B.J.; Kim, B.-K. Anti-diabetic activity of constituents of Lycii Fructus. J. Appl. Pharmacol. 1998, 6, 378–382. [Google Scholar]
  7. Kim, S.Y.; Lee, E.J.; Kim, H.P.; Kim, Y.C.; Moon, A.; Kim, Y.C. A Novel cerebroside from Lycii Fructus preserves the hepatic glutathione redox system in primary cultures of rat hepatocytes. Biol. Pharm. Bull. 1999, 22, 873–875. [Google Scholar] [CrossRef]
  8. Chin, Y.W.; Lim, S.W.; Kim, S.H.; Shin, D.Y.; Suh, Y.G.; Kim, Y.B.; Kim, Y.C.; Kim, J. Hepatoprotective pyrrole derivatives of Lycium chinense fruits. Bioorganic Med. Chem. Lett. 2003, 13, 79–81. [Google Scholar] [CrossRef]
  9. Lee, H.W.; Kim, Y.H.; Kim, Y.H.; Lee, G.H.; Lee, M.Y. Discrimination of Lycium chinense and Lycium barbarum by taste pattern and betaine analysis. Int. J. Clin. Exp. Med. 2014, 7, 2053–2059. [Google Scholar]
  10. Zhao, B.T.; Jeong, S.Y.; Hwangbo, K.; Moon, D.C.; Seo, E.K.; Lee, D.; Lee, J.H.; Min, B.S.; Ma, E.S.; Son, J.K.; et al. Quantitative analysis of betaine in Lycii Fructus by HILIC-ELSD. Arch. Pharm. Res. 2013, 36, 1231–1237. [Google Scholar] [CrossRef] [Green Version]
  11. Kang, P.; Liu, Y.; Zhu, H.; Zhang, J.; Shi, H.; Li, S.; Pi, D.; Leng, W.; Wang, X.; Wu, H.; et al. The effect of dietary asparagine supplementation on energy metabolism in liver of weaning pigs when challenged with lipopolysaccharide. Asian Australas. J. Anim. Sci. 2018, 31, 548–555. [Google Scholar] [CrossRef] [PubMed] [Green Version]
  12. Yu, J.C.; Jiang, Z.M.; Li, D.M. Glutamine: A precursor of glutathione and its effect on liver. World J. Gastroenterol. 1999, 5, 143–146. [Google Scholar] [CrossRef] [PubMed]
  13. Obayashi, Y.; Arisaka, H.; Yoshida, S.; Mori, M.; Takahashi, M. Proline protects liver from d-galactosamine hepatitis by activating the IL-6/STAT3 survival signaling pathway. Amino Acids 2012, 43, 2371–2380. [Google Scholar] [CrossRef] [PubMed]
  14. Rukkumani, R.; Aruna, K.; Varma, P.S.; Menon, V.P. Hepatoprotective role of ferulic acid: A dose-dependent study. J. Med. Food 2004, 7, 456–461. [Google Scholar] [CrossRef] [PubMed]
  15. Itoh, A.; Isoda, K.; Kondoh, M.; Kawase, M.; Kobayashi, M.; Tamesada, M.; Yagi, K. Hepatoprotective effect of syringic acid and vanillic acid on concanavalin A-induced liver injury. Biol. Pharm. Bull. 2009, 32, 1215–1219. [Google Scholar] [CrossRef] [Green Version]
  16. Lee, S., II; An, S.M.; Mun, G.I.; Lee, S.J.; Park, K.M.; Park, S.H.; Boo, Y.C. Protective effect Sasa quelpaertensis and p-courmaric acid on ethanol-induced hepatotoxicity in mice. J. Appl. Biol. Chem. 2008, 51, 148–154. [Google Scholar] [CrossRef] [Green Version]
  17. An, S.M.; Lee, S.I.; Choi, S.W.; Moon, S.W.; Boo, Y.C. p-Coumaric acid, a constituent of Sasa quelpaertensis Nakai, inhibits cellular melanogenesis stimulated by α-melanocyte stimulating hormone. Br. J. Dermatol. 2008, 159, 292–299. [Google Scholar] [CrossRef]
  18. Park, S.H.; Kim, D.S.; Park, S.H.; Shin, J.W.; Youn, S.W.; Park, K.C. Inhibitory effect of p-coumaric acid by Rhodiola sachalinensis on melanin synthesis in B16F10 cells. Pharmazie 2008, 63, 290–295. [Google Scholar] [CrossRef]
  19. An, S.M.; Koh, J.S.; Boo, Y.C. p-coumaric acid not only inhibits human tyrosinase activity in vitro but also melanogenesis in cells exposed to UVB. Phyther. Res. 2010, 24, 1175–1180. [Google Scholar] [CrossRef]
  20. Kim, M.; Lee, E.J.; Lim, K.-M. Ibuprofen increases the hepatotoxicity of ethanol through potentiating oxidative stress. Biomol. Ther. 2020. [Google Scholar] [CrossRef]
  21. Paik, M.-J.; Moon, S.-M.; Kim, K.-R.; Choi, S.; Ahn, Y.-H.; Lee, G. Target metabolic profiling analysis of free amino acids in plasma as EOC/TBDMS derivatives by GC-SIM-MS. Biomed. Chromatogr. 2008, 22, 339–342. [Google Scholar] [CrossRef] [PubMed]
  22. Paik, M.J.; Kim, K.R. Sequential ethoxycarbonylation, methoximation and tert- butyldimethylsilylation for simultaneous determination of amino acids and carboxylic acids by dual-column gas chromatography. J. Chromatogr. A 2004, 1034, 13–23. [Google Scholar] [CrossRef] [PubMed]
  23. Paik, M.J.; Lee, H.J.; Kim, K.R. Simultaneous retention index analysis of urinary amino acids and carboxylic acids for graphic recognition of abnormal state. J. Chromatogr. B Anal. Technol. Biomed. Life Sci. 2005, 821, 94–104. [Google Scholar] [CrossRef] [PubMed]
  24. Seo, C.; Hwang, Y.H.; Lee, H.S.; Kim, Y.; Shin, T.H.; Lee, G.; Son, Y.J.; Kim, H.; Yee, S.T.; Park, A.K.; et al. Metabolomic study for monitoring of biomarkers in mouse plasma with asthma by gas chromatography–mass spectrometry. J. Chromatogr. B Anal. Technol. Biomed. Life Sci. 2017, 1063, 156–162. [Google Scholar] [CrossRef] [PubMed]
  25. Seo, C.; Na, M.; Jang, J.; Park, M.; Choi, B.; Lee, S.; Paik, M.J. Monitoring of altered amino acid metabolic pattern in rat urine following intraperitoneal injection with γ-hydroxybutyric acid. Metabolomics 2018, 14, 111. [Google Scholar] [CrossRef] [PubMed]
  26. Sooklert, K.; Wongjarupong, A.; Cherdchom, S.; Wongjarupong, N.; Jindatip, D.; Phungnoi, Y.; Rojanathanes, R.; Sereemaspun, A. Molecular and morphological evidence of hepatotoxicity after silver nanoparticle exposure: A systematic review, in silico, and ultrastructure investigation. Toxicol. Res. 2019, 35, 257–270. [Google Scholar]
Figure 1. Effects of the L. chinense and L. barbarum crude extracts and fractions on HepG2 cell viability. The extracts were treated for 24 h with or without 30 mM acetaminophen and the resulting cell viability was measured via the WST-1 assay. n = 4 or more; # indicates a significant difference from the acetaminophen (APAP)-only group (t-test, p < 0.05).
Molecules 25 05835 g001
Figure 2. Amino acid star symbol plot of the normalized values in Table 1. The numbers on the rays correspond to the row no. in Table 1.
Molecules 25 05835 g002
Figure 3. Phenolic acid star symbol plot of the normalized values in Table 2. The numbers on the rays correspond to the row no. in Table 2.
Molecules 25 05835 g003
Figure 4. HPLC traces (detected at 310 nm) of (a) the ethyl acetate-soluble fraction of L. chinense and (b) L. barbarum extracts. These peaks were identified as 4-(2-formyl-5-(hydroxymethyl)-1H-pyrrol-1-yl)butanoic acid (1) and p-coumaric acid (2), respectively. The HPLC samples were prepared with 2 mg/mL of the extract by injecting 15 μL of each sample.
Molecules 25 05835 g004
Figure 5. Chemical structures of 4-(2-formyl-5-(hydroxymethyl)-1H-pyrrol-1-yl)butanoic acid (1) and p-coumaric acid (2).
Molecules 25 05835 g005
Figure 6. Effects of 4-(2-formyl-5-(hydroxymethyl)-1H-pyrrol-1-yl)butanoic acid (1) on the cell viability of HepG2 without (left) or with (right) 30 mM acetaminophen (APAP). n = 4 or more; # and * indicate significant differences from the APAP-only group and control, respectively (t-test, p < 0.05).
Molecules 25 05835 g006
Table 1. Amino acid levels in L. chinense and L. barbarum.
No.Amino AcidRetention TimeSelected Ions 1 (m/z)Amount (ng/mg, Mean ± SD)Normalized Value 2
L. barbarumL. chinense
1Alanine5.171902182602187.6 ± 67.8565.2 ± 13.60.26
2Glycine5.4017620424636.5 ± 1.1132.9 ± 1.03.64
3α-Aminobutyric acid6.0613020423212.9 ± 0.329.2 ± 0.62.27
4Valine6.51144218246290.3 ± 10.4412.8 ± 15.21.42
5Leucine7.37158232260234.1 ± 8.0683.4 ± 7.22.92
6Isoleucine7.6215823226055.7 ± 1.5400.7 ± 5.77.19
7Proline8.091422162449798.5 ± 242.42931.3 ± 106.00.30
8γ-Aminobutyric acid8.12186201346121.4 ± 4.21108.0 ± 31.39.13
9Pipecolic acid8.8115623025861.0 ± 1.797.6 ± 5.01.60
10Pyroglutamic acid10.25272300342653.7 ± 20.6240.0 ± 8.70.37
11Serine11.03216302348514.0 ± 59.5530.8 ± 42.91.03
12Threonine11.12230248261159.6 ± 33.2146.2 ± 17.70.92
13Phenylalanine12.1719520529439.1 ± 1.7440.7 ± 17.911.28
14Cysteine12.58216276322157.8 ± 0.5158.7 ± 0.31.01
15Aspartic acid12.812873302873301079.9 ± 24.00.85
16N-Methyl-DL-aspartic acid13.0124428739040.5 ± 1.723.1 ± 0.50.57
17Homocysteine13.8523429033681.2 ± 7.656.5 ± 0.30.70
18Glutamic acid14.18288344390346.2 ± 15.3559.5 ± 31.91.62
19Asparagine14.472863293753460.4 ± 146.915211.9 ± 1141.64.40
20α-Aminoadipic acid15.3630235840433.6 ± 0.139.4 ± 0.71.17
21Glutamine15.712873433897462.7 ± 588.41468.8 ± 119.10.20
22Lysine15.85156301347185.9 ± 6.1897.2 ± 57.34.83
23Histidine16.35254267356565.5 ± 9.61441.7 ± 238.22.55
24Tryptophan18.35130244333156.8 ± 3.9520.5 ± 118.13.32
1 The bolded ions were used for quantification. 2 Normalized value = amino acid amount of L. chinense/amino acid amount of L. barbarum.
Table 2. Phenolic acid levels in L. chinense and L. barbarum.
No.Phenolic AcidRetention TimeSelected Ions 1 (m/z)Amount (ng/mg, Mean ± SD)Normalized Value 2
L. barbarumL. chinense
1Salicylic acid4.44731151951.8 ± 0.12.3 ± 0.41.23
24-Hydroxybenzoic acid5.27732352858.1 ± 0.37.8 ± 0.10.96
3Vanillic acid6.021932232671.8 ± 0.126.4 ± 0.314.81
4Syringic acid6.742232532970.3 ± < 0.10.9 ± < 0.12.97
5p-Coumaric acid7.1073261291178.4 ± 9.36.8 ± < 0.10.04
6Protocatechuic acid7.47733653951.0 ± < 0.10.7 ± < 0.10.72
7Ferulic acid7.8621924929333.6 ± 3.631.3 ± 0.30.93
8Gallic acid8.88733234391.2 ± 0.11.9 ± 0.31.55
9Caffeic acid9.08732192612.5 ± 0.30.7 ± 0.10.29
1 The bolded ions were used for quantification. 2 Normalized value = phenolic acid amount of L. chinense/phenolic acid amount of L. barbarum.
Sample Availability: Sample of the compound 1 is available from the authors.
Publisher’s Note: MDPI stays neutral with regard to jurisdictional claims in published maps and institutional affiliations.

