Content of Phenolic Compounds in Meadow Vegetation and Soil Depending on the Isolation Method


Abstract
1. Introduction
- −
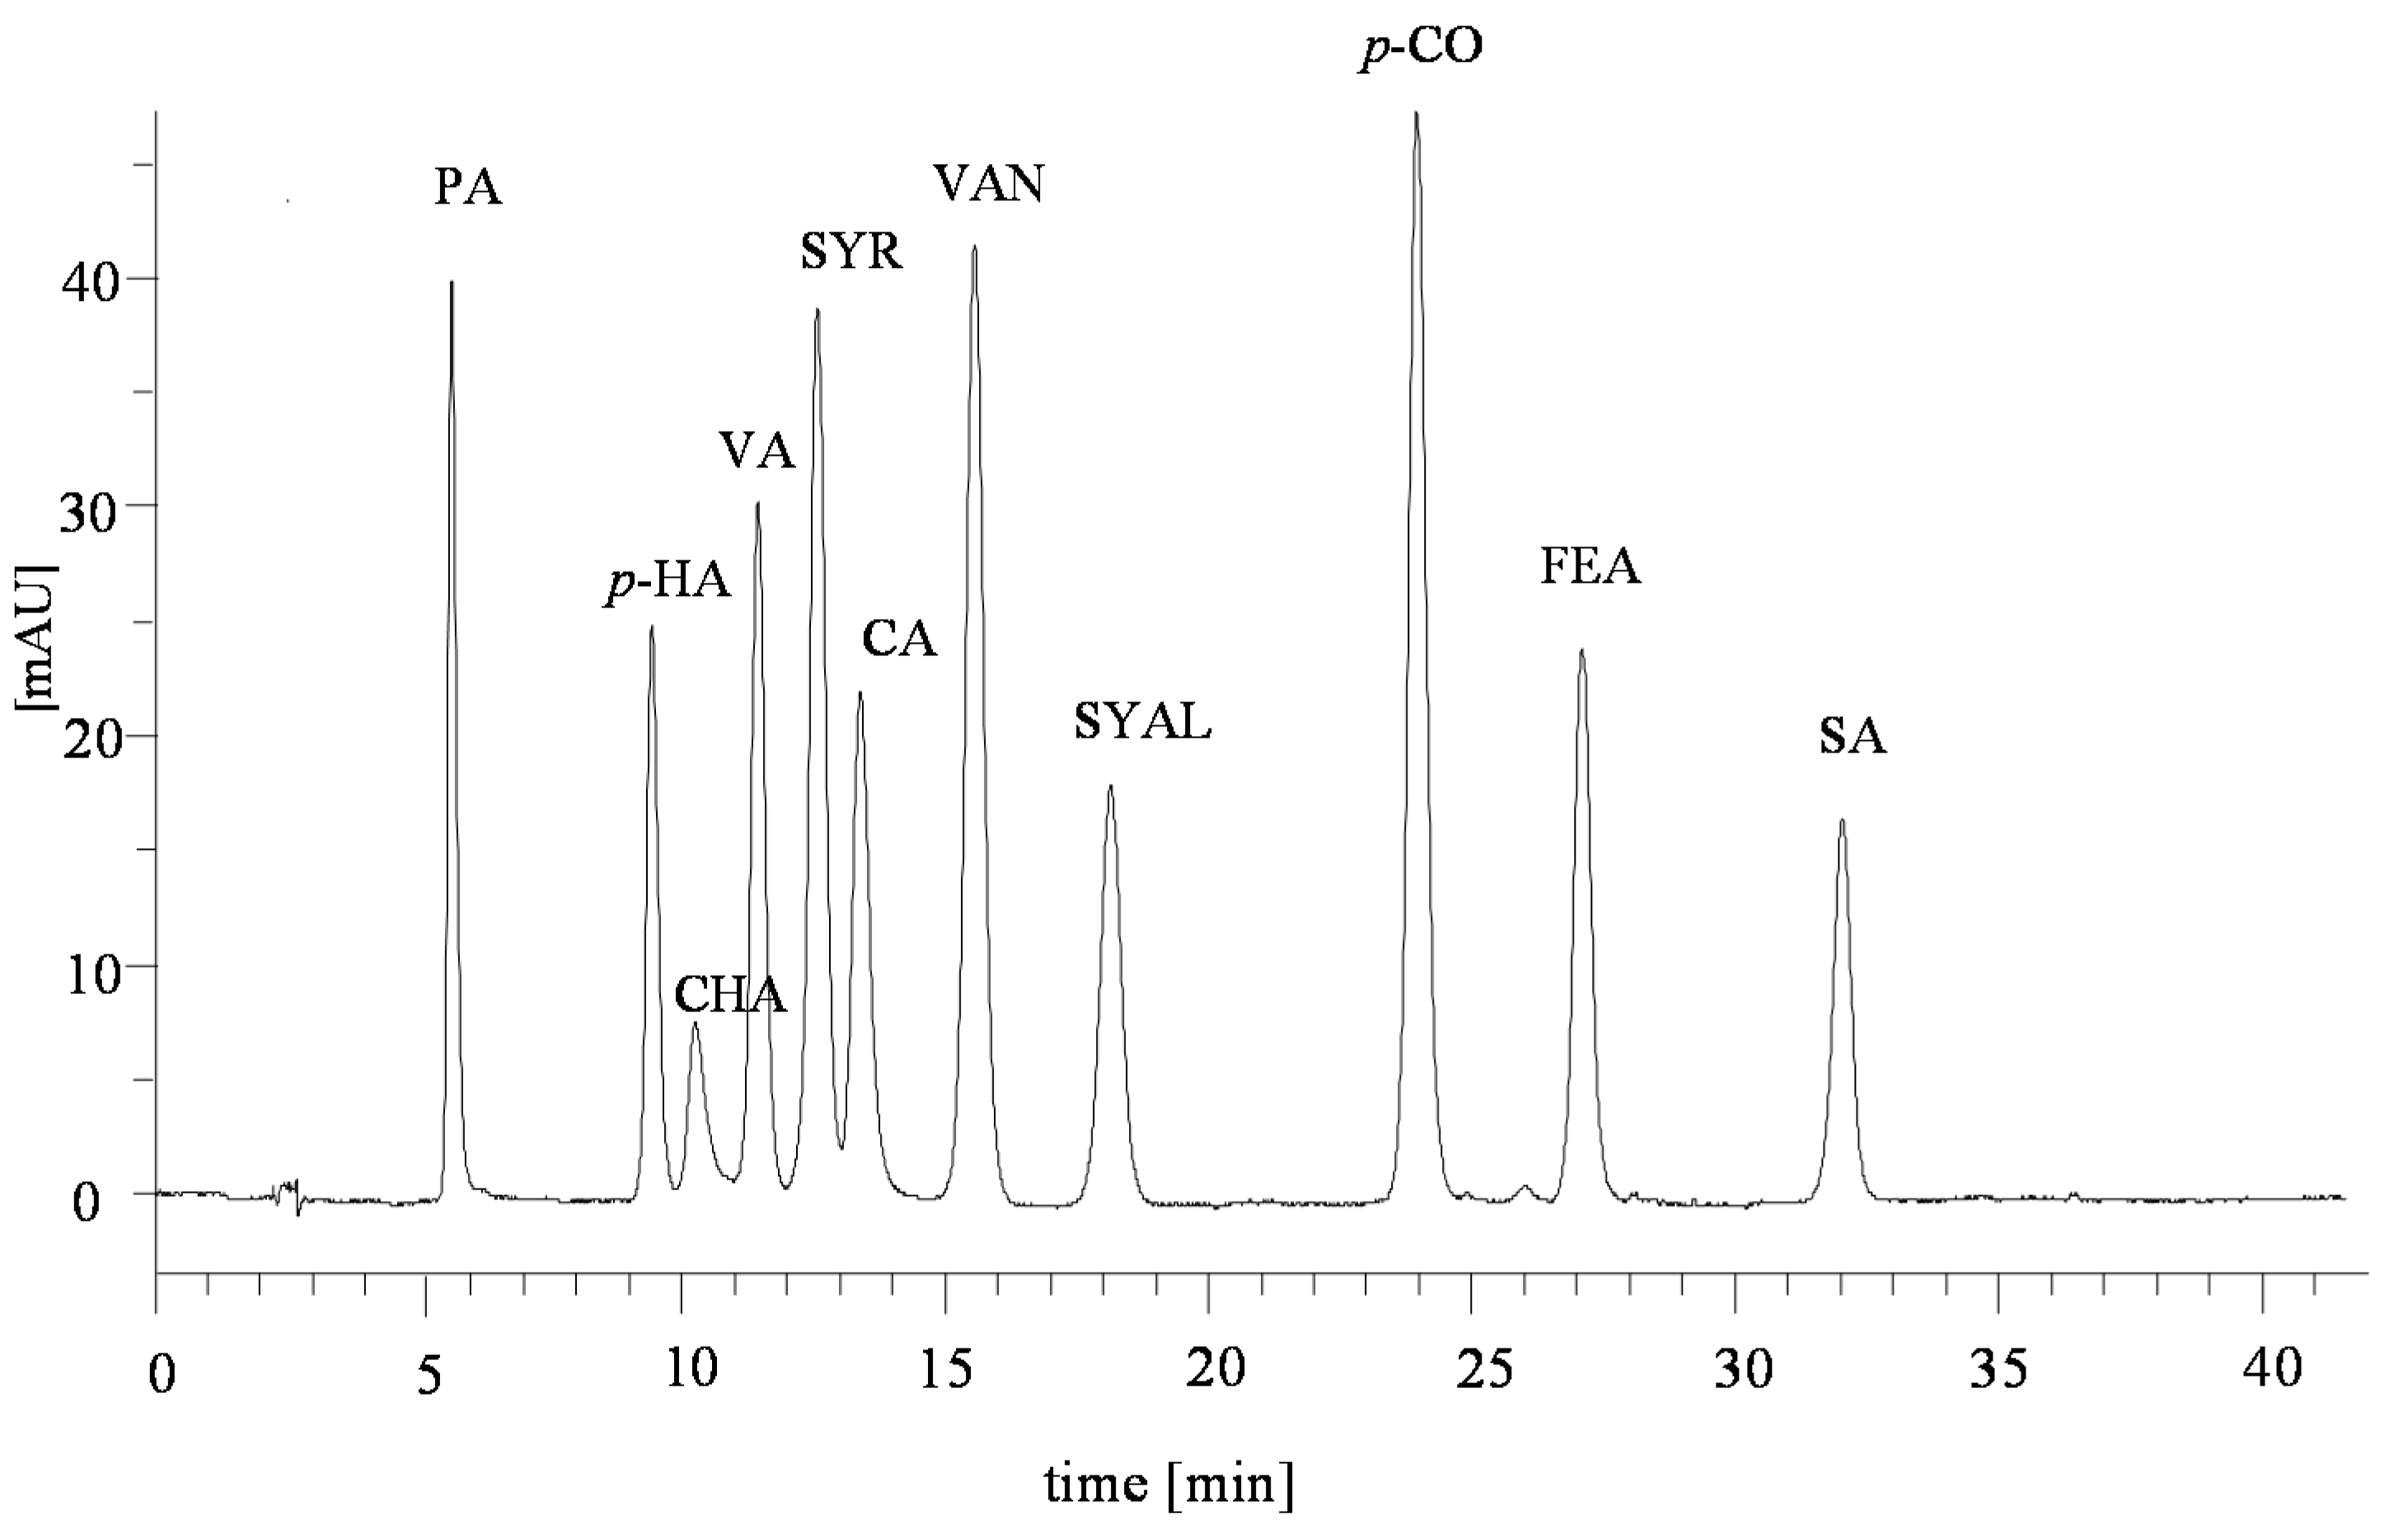
- Hydroxybenzoic acid and its derivatives, e.g., dihydroxybenzoic, protocatechuic (PA), salicylic (SA), syringic (SYR), and vanillic (VA) acids;
- −
- Hydroxycinnamic acid and its derivatives, e.g., cinnamic, ferulic (FEA), p-coumaric (p-CO), and caffeic (CA) acids.
2. Results
2.1. Contents of Phenolic Compounds in the Plant Material Samples
2.2. Contents of Phenolic Compounds in Soil Samples
3. Discussion
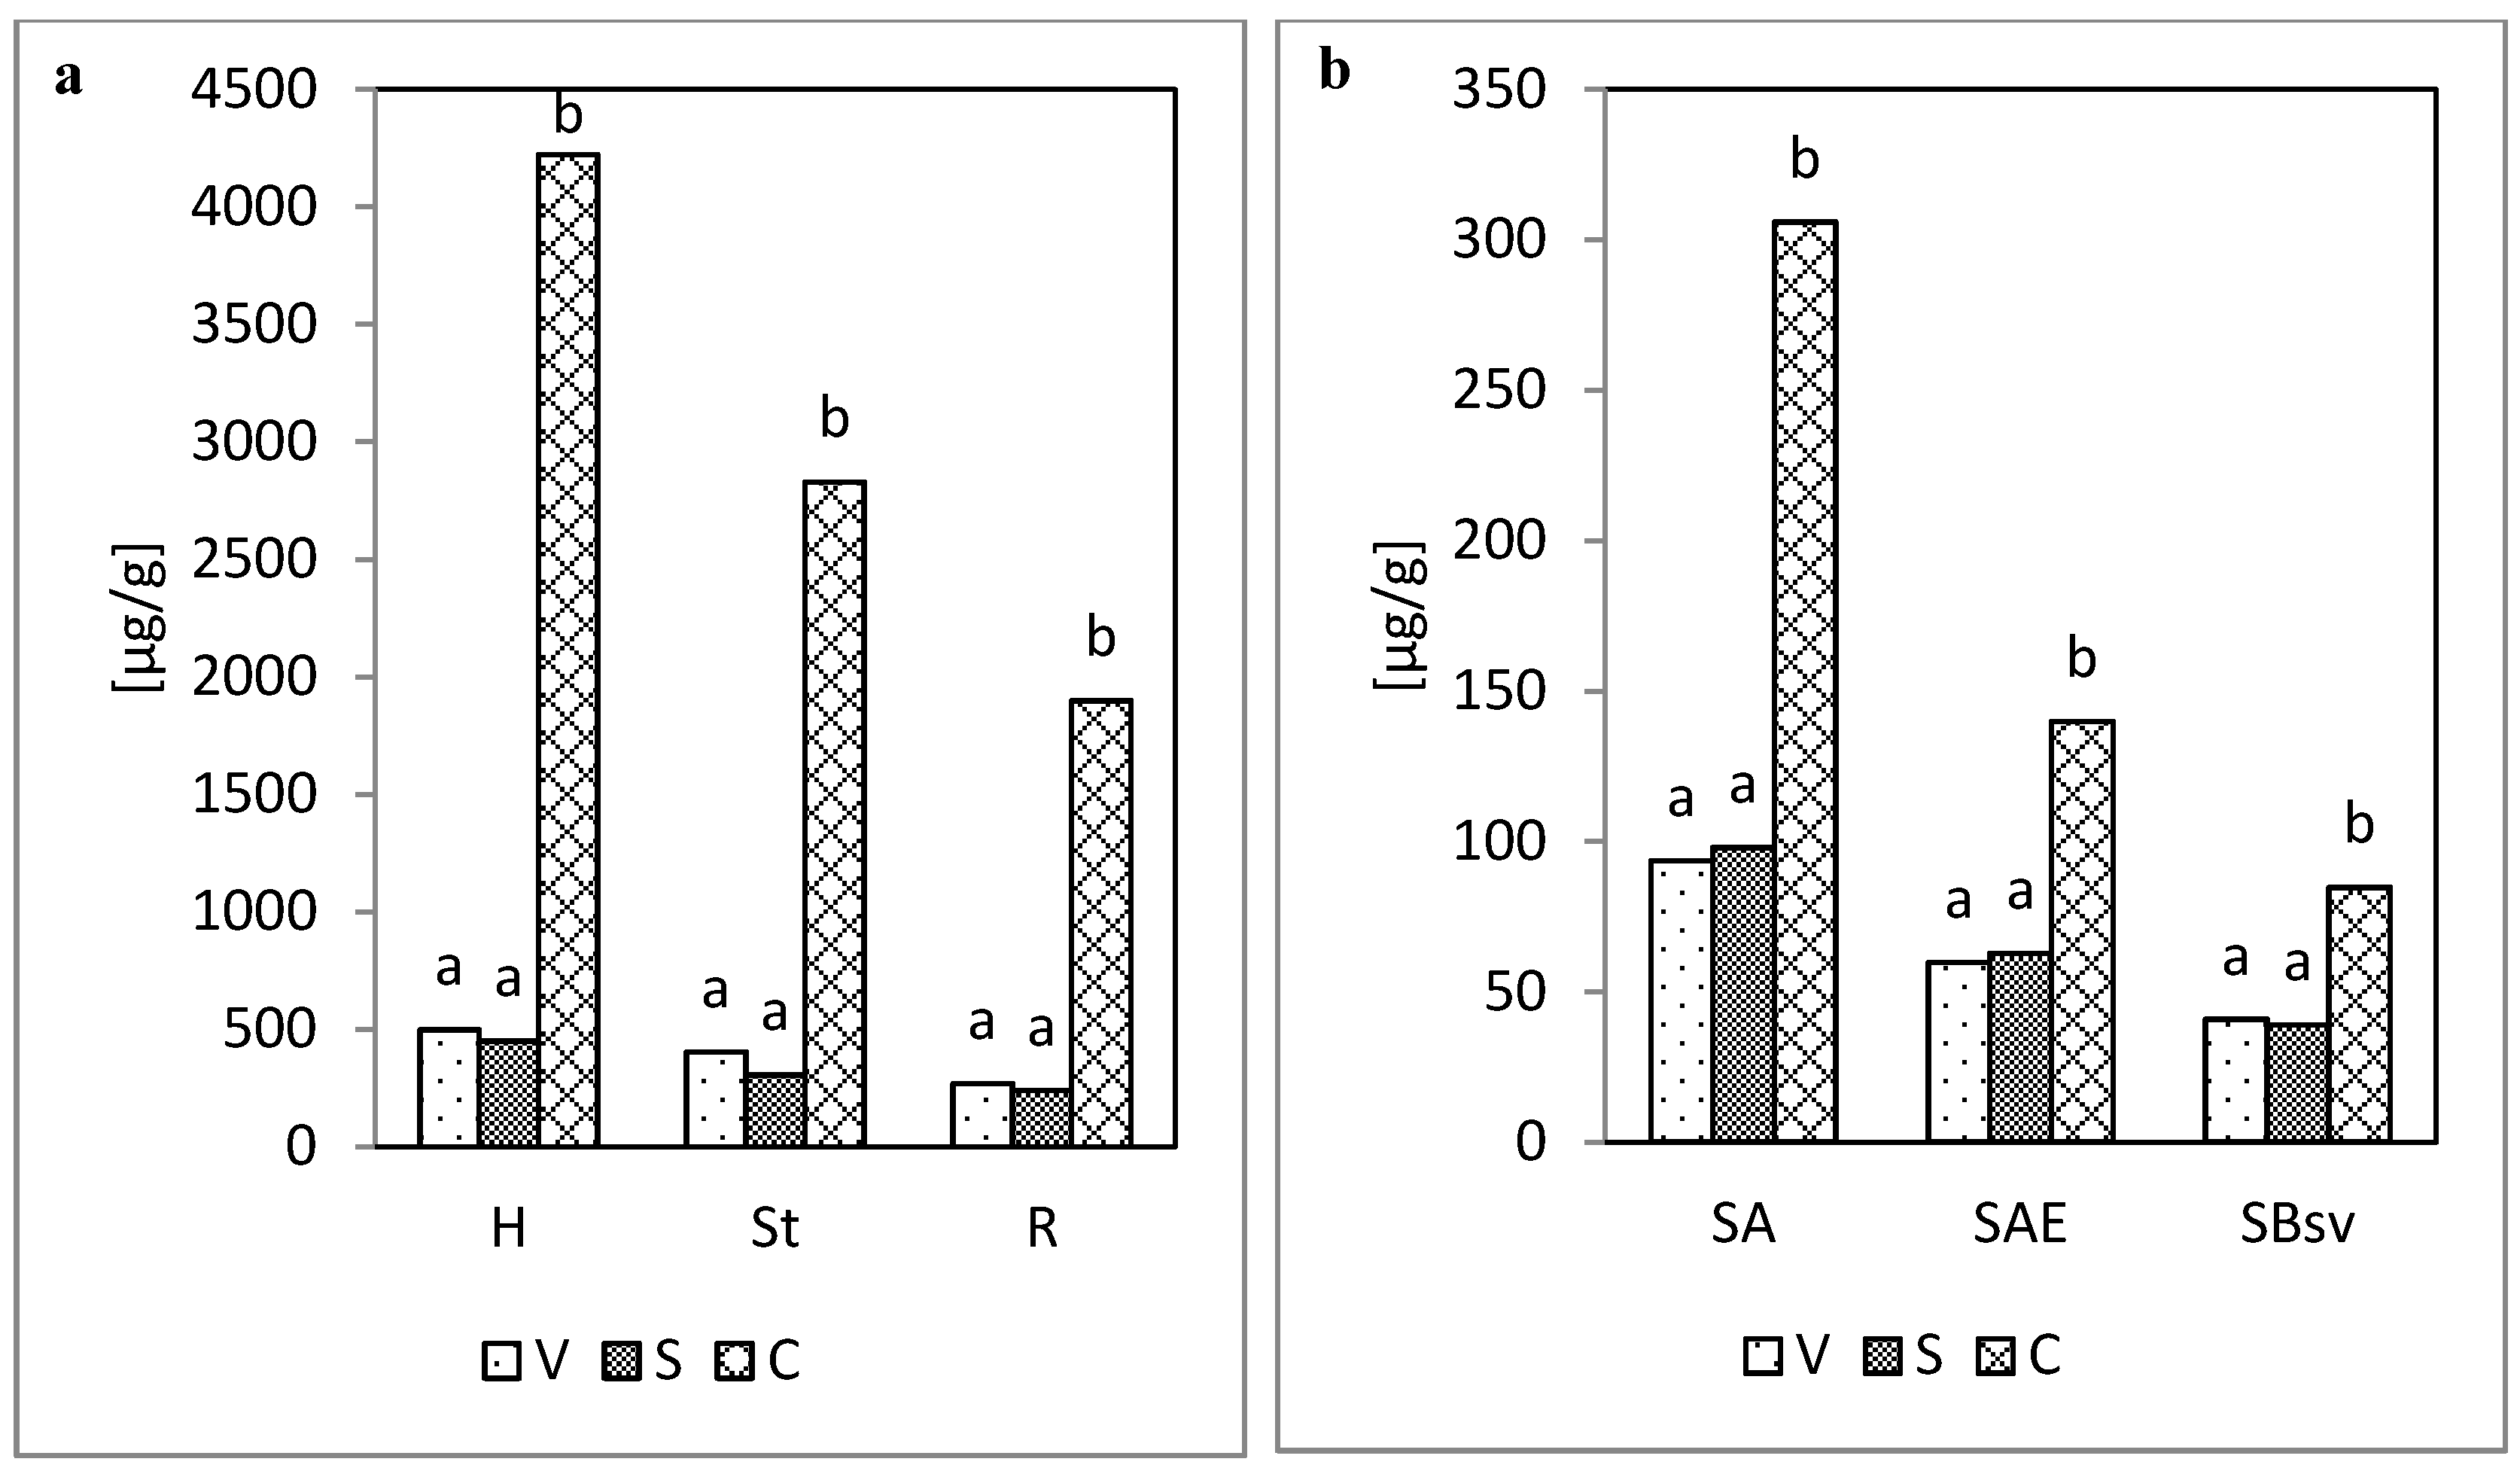
- −
- Vanillyl compounds (V), as the total content of vanillin and vanillic acid derived from coniferyl alcohol;
- −
- Syringyl compounds (S), as the total content of syringaldehyde and syringic acid, derived from sinapyl alcohol;
- −
4. Materials and Methods
4.1. Chemicals
4.2. Materials
4.3. Methods
4.3.1. Extraction of Phenolic Compounds from the Samples of Plant Material and Soils
- −
- Acid hydrolysis with a 6 M HCl solution; and
- −
- Alkaline re-hydrolysis with a 10 M NaOH.
4.3.2. Qualitative and Quantitative Analyses of Extracts Containing Phenolic Compounds
- −
- Eluent A: H2O:CH3CN:CH3COOH (88.5:10:1.5—% V); and
- −
- Eluent B: CH3CN.
4.4. Statistical Analysis
5. Conclusions
- A combination of acid and alkaline hydrolysis ensures the best extraction efficiency of insoluble-bound forms of polyphenols from plant and soil material.
- Alkaline re-hydrolysis resulted in an increase in the amount of the phenolics extracted from the plant material samples from 215% (hay) to 454% (roots), and from soil, from 55.7% (horizon Bsv) to 240% (horizon A) of their contents in acid hydrolysates.
- In the extracts from acid hydrolysates, in general, chlorogenic and p-hydroxybenzoic acids were dominant. In the alkaline extracts from the plant material, the highest content was recorded for p-coumaric and ferulic acids, and in the extracts from soil, for ferulic and chlorogenic acids.
- The values of the parameter V:S:C (the ratio of vanillyl to syringyl to cinnamyl compounds) recorded for the extracts from the plant material following the acid hydrolysis ranged from 1:1:2 to 1:1:4, and for the hydrolyses sum from 1:1:8 to 1:1:9. The values of the parameter V:S:C for soil, calculated for the hydrolyses in total, was 1:1:2–1:1:3, and following the acid hydrolysis only 1:1:1.5–1:1:2.
- It was demonstrated that the plant material of meadow soils, irrespective of the extraction method, showed a similar share of syringyl and vanillyl compounds and an advantage of cinnamyl compounds. In the humification process of meadow vegetation, the ratio of the share of V and S compounds did not change; however, the share of cinnamyl compounds in the V+S+C pool decreased.
Supplementary Materials
Author Contributions
Funding
Acknowledgments
Conflicts of Interest
References
- Mroz, P.; Wilczek, K.; Zak, M.; Zielinska-Pisklak, M. Chromatographic methods for isolation and identification of phenolic acids. Biul. Wydz. Farm. WUM 2012, 6, 40–48. (in Polish). [Google Scholar]
- Parus, A. Antioxidant and pharmacological properties of phenolic acids. Postepy Fitot. 2013, 1, 48–53. (in Polish). [Google Scholar]
- Sterbova, D.; Matejicek, D.; Vlcek, J.; Kuban, V. Combined microwave-assisted isolation and solid-phase purification procedures prior to the chromatographic determination of phenolic compounds in plant material. Anal. Chim. Acta 2004, 513, 435–444. [Google Scholar] [CrossRef]
- Verma, B.; Hucl, P.; Chibbar, R.N. Phenolic acid composition and antioxidant capacity of acid and alkali hydrolysed wheat bran fraction. Food Chem. 2009, 116, 947–954. [Google Scholar] [CrossRef]
- Irakli, M.N.; Samanidou, V.F.; Biliaderis, C.G.; Papadoyannis, I.N. Development and validation of an HPLC-method for determination of free and bound phenolic acids in cereals after solid-phase extraction. Food Chem. 2012, 134, 1624–1632. [Google Scholar] [CrossRef] [PubMed]
- Ross, K.A.; Beta, T.; Arntfield, S.D. A comparative study on the phenolic acids identified and quantified in dry beans using HPLC as affected by different extraction and hydrolysis methods. Food Chem. 2009, 113, 336–344. [Google Scholar] [CrossRef]
- Nardini, M.; Cirillo, E.; Natella, F.; Mencarelli, D.; Comisso, A.; Scaccini, C. Detection of bound phenolic acids: Prevention by ascorbic acid and ethylenediaminetetraacetic acid of degradation of phenolic acids during alkaline hydrolysis. Food Chem. 2002, 79, 119–124. [Google Scholar] [CrossRef]
- Serve, L.; Piovetti, L.; Longuemard, N. Dosage des acides et aldehydes phenoliques par chromatographie liquide haute-performance: Analyse comparative des sols de haute montage et de leur vegetation. J. Chrom. 1983, 259, 319–328. [Google Scholar] [CrossRef]
- Serve, L.; Piovetti, L.; Longuemard, N. Dosage par chromatographie liquide haute-performancedes composes phenoliques liberes par hydrolyse d`acides humiques. J. Chrom. 1984, 292, 458–467. [Google Scholar] [CrossRef]
- Kogel-Knabner, I.; Hatcher, P.G.; Zech, W. Chemical structural studies of forest: Soil humic acids: Aromatic carbon fractions. Soil Sci. Am. J. 1991, 55, 241–247. [Google Scholar] [CrossRef]
- Kovalev, I.V.; Kovaleva, N.O. Biochemistry of lignin in soils of periodic excessive moistening (from the example of agrogray soils in Opolie Landscapes on the Russian Plain). Eurasian Soil Sci. 2008, 41, 1066–1076. [Google Scholar] [CrossRef]
- Kovaleva, N.O.; Kovalev, I.V. Transformation of lignin in surface and buried soils of mountainous landscapes. Eurasian Soil Sci. 2009, 42, 1270–1281. [Google Scholar] [CrossRef]
- Debska, B.; Banach-Szott, M. Identification of phenolic compounds in forest soils. Pol. J. Soil Sci. 2010, 43, 141–150. [Google Scholar]
- Banach-Szott, M.; Debska, B. Content of phenolic compounds in fulvic and humic acid fraction of forest soils. Pol. J. Environ. 2008, 4, 463–472. [Google Scholar]
- Banach-Szott, M.; Debska, B. Role of plant litter in developing the content of phenolic compounds in humic substances. Ecol. Chem. Eng. 2009, 16, 239–252. [Google Scholar]
- Krygier, K.; Sosulski, F.; Hogge, L. Free, esterified, and insoluble-bound phenolic-acids. 1. Extraction and purification procedure. J. Agric. Food Chem. 1982, 30, 330–334. [Google Scholar] [CrossRef]
- Luczkiewicz, M.; Cisowski, W.; Kaiser, P.; Ochocka, R.; Piotrowski, A. Comparative analysis of phenolic acids in mistletoe plans from various hosts. Acta Poloniae Pharm. 2001, 58, 373–379. [Google Scholar] [PubMed]
- Mika, V.; Kuban, V.; Klejdus, B.; Odstrcilova, V.; Nerusil, P. Phenolic compounds as chemical markers of low taxonomic levels in the family Placeae. Plant Soil Environ. 2005, 51, 506–512. [Google Scholar] [CrossRef]
- Kim, K.H.; Tsao, R.; Yang, R.; Cui, S.W. Phenolic acid profiles and antioxidant activities of wheat bran extracts and the effect of hydrolysis conditions. Food Chem. 2006, 95, 466–473. [Google Scholar] [CrossRef]
- Dziamski, A.; Banach-Szott, M.; Debska, B. The effect of long-term irrigation of meadows on the state of organic matter. Acta Sci. Pol. Agric. 2015, 14, 15–27. [Google Scholar]
- Crawford, R.L. Lignin Biodegradation and Transformation; John Wiley and Sons Ltd.: New York, NY, USA, 1981. [Google Scholar]


| Symbol | Mean ± SD | Min | Max | SE | Mean ± SD | Min | Max | SE |
|---|---|---|---|---|---|---|---|---|
| Acid hydrolysis | Alkaline Re-hydrolysis | |||||||
| Hay | ||||||||
| PA | 73.0 ± 62.8 a | 20.2 | 230.8 | 14.8 | 74.9 ± 19.6 a | 47.9 | 107.1 | 4.6 |
| p-HA | 72.2 ± 51.8 b | 13.8 | 182.5 | 12.2 | 59.9 ± 19.7 a | 19.4 | 79.3 | 4.7 |
| CHA | 710.8 ± 151.6 b | 530.0 | 947.4 | 35.7 | 130.9 ± 29.9 a | 90.0 | 183.1 | 7.0 |
| VA | 49.6 ± 17.2 a | 23.9 | 79.3 | 4.0 | 110.7 ± 24.2 b | 83.0 | 158.2 | 5.7 |
| SYR | 42.5 ± 21.2 a | 18.8 | 86.1 | 5.0 | 99.2 ± 29.5 b | 70.2 | 156.9 | 6.9 |
| CA | 64.2 ± 41.3 a | 13.4 | 147.8 | 9.7 | 166.6 ± 33.9 b | 105.5 | 228.3 | 8.0 |
| VAN | 76.4 ± 39.3 a | 24.2 | 149.7 | 9.3 | 261.4 ± 68.9 b | 179.5 | 385.6 | 16.2 |
| SYAL | 60.8 ± 32.4 a | 18.5 | 114.2 | 7.6 | 248.2 ± 48.9 b | 180.1 | 328.1 | 11.5 |
| p-CO | 145.9 ± 24.5 a | 105.9 | 189.7 | 5.8 | 1655.1 ± 304.7 b | 1275.0 | 2221.0 | 71.8 |
| FEA | 201.7 ± 41.7 a | 137.1 | 256.1 | 9.8 | 1988.0 ± 452.4 b | 1306.9 | 2500.4 | 106.6 |
| SA | 58.9 ± 32.6 a | 14.8 | 116.7 | 7.7 | 106.0 ± 61.2 b | 20.5 | 214.1 | 14.4 |
| SUM | 1556.1 ± 153.0 a | 1272.0 | 1816.7 | 36.1 | 4900.9 ± 685.7 b | 3900.2 | 6083.7 | 161.6 |
| Sward | ||||||||
| PA | 55.1 ± 26.1 a | 12.1 | 91.5 | 6.2 | 77.3 ± 20.2b | 56.8 | 111.2 | 4.8 |
| p-HA | 90.6 ± 84.3 b | 18.3 | 278.4 | 19.9 | 78.6 ± 38.5a | 33.6 | 143.8 | 9.1 |
| CHA | 315.3 ± 151.6 b | 126.5 | 638.6 | 35.7 | 142.6 ± 33.8a | 100.5 | 202.5 | 8.0 |
| VA | 42.5 ± 32.5 a | 9.2 | 112.1 | 7.7 | 116.1 ± 24.4b | 73.8 | 148.6 | 5.8 |
| SYR | 37.9 ± 23.5 a | 10.0 | 84.6 | 5.5 | 73.0 ± 20.1b | 33.8 | 102.1 | 4.7 |
| CA | 77.9 ± 42.7 a | 36.9 | 164.8 | 10.1 | 127.4 ± 27.4b | 77.0 | 165.1 | 6.5 |
| VAN | 44.0 ± 17.2 a | 17.3 | 73.8 | 4.1 | 201.2 ± 68.0b | 117.9 | 348.1 | 16.0 |
| SYAL | 60.0 ± 28.0 a | 30.5 | 107.4 | 6.6 | 134.9 ± 53.6 b | 40.6 | 219.0 | 12.6 |
| p-CO | 47.1 ± 34.5 a | 7.3 | 107.3 | 8.1 | 1426.2 ± 253.5 b | 1005.8 | 1738.4 | 59.8 |
| FEA | 58.9 ± 30.1 a | 17.8 | 114.5 | 7.1 | 1092.2 ± 220.0 b | 900.6 | 1585.4 | 51.8 |
| SA | 12.8 ± 7.7 a | 2.8 | 25.7 | 1.8 | 129.0 ± 88.7 b | 42.8 | 263.2 | 20.9 |
| SUM | 842.2 ± 347.7 a | 507.0 | 1594.0 | 82.0 | 3598.5 ± 477.8 b | 3048.3 | 4592.5 | 112.6 |
| Roots | ||||||||
| PA | 33.6 ± 13.3 a | 10.9 | 56.1 | 3.1 | 71.6 ± 26.2 b | 22.5 | 105.9 | 6.2 |
| p-HA | 121.8 ± 13.7 b | 92.6 | 140.9 | 3.2 | 100.2 ± 38.4 a | 34.0 | 161.8 | 9.1 |
| CHA | 81.7 ± 41.9 a | 15.1 | 134.0 | 9.9 | 152.4 ± 30.4 b | 115.3 | 211.7 | 7.2 |
| VA | 16.2 ± 8.3 a | 3.3 | 30.4 | 2.0 | 118.2 ± 28.0 b | 57.2 | 149.8 | 6.6 |
| SYR | 20.6 ± 6.7 a | 9.7 | 32.0 | 1.6 | 82.1 ± 48.0 b | 26.0 | 164.0 | 11.3 |
| CA | 71.7 ± 38.1 a | 23.3 | 146.3 | 9.0 | 154.1 ± 38.9 b | 100.9 | 238.9 | 9.2 |
| VAN | 22.4 ± 9.7 a | 9.8 | 37.4 | 2.3 | 112.6 ± 15.0 b | 90.3 | 139.6 | 3.5 |
| SYAL | 40.0 ± 18.5 a | 10.9 | 71.4 | 4.4 | 96.7 ± 45.8 b | 20.0 | 165.6 | 10.8 |
| p-CO | 17.4 ± 13.9 a | 4.0 | 45.1 | 3.3 | 891.6 ± 214.2 b | 477.8 | 1128.6 | 50.5 |
| FEA | 31.6 ± 22.7 a | 3.4 | 65.7 | 5.3 | 732.5 ± 63.8 b | 629.2 | 843.7 | 15.0 |
| SA | 9.6 ± 2.0 a | 6.8 | 13.3 | 0.5 | 73.2 ± 21.0 b | 46.2 | 114.8 | 4.9 |
| SUM | 466.6 ± 81.8 a | 367.0 | 586.9 | 19.3 | 2585.2 ± 210.4 b | 2175.0 | 2883.9 | 49.6 |
| Symbol | Mean ± SD | Min | Max | SE | Mean ± SD | Min | Max | SE |
|---|---|---|---|---|---|---|---|---|
| Acid hydrolysis | Alkaline Re-hydrolysis | |||||||
| Horizon A | ||||||||
| PA | 7.6 ± 2.3 a | 3.6 | 11.8 | 0.5 | 24.1 ± 10.2 b | 8.1 | 44.0 | 2.4 |
| p-HA | 10.9 ± 5.3 a | 4.1 | 21.1 | 1.2 | 25.0 ± 15.7 b | 10.0 | 56.6 | 3.7 |
| CHA | 39.3 ± 30.3 a | 12.1 | 104.3 | 7.1 | 121 ± 62.2 b | 23.9 | 215.0 | 14.7 |
| VA | 26.4 ± 6.8 a | 17.8 | 40.2 | 1.6 | 30.2 ± 12.2 a | 10.5 | 50.9 | 2.9 |
| SYR | 13.7 ± 4.0 a | 9.8 | 23.9 | 0.9 | 26.2 ± 9.7 b | 10.4 | 42.8 | 2.3 |
| CA | 42.0 ± 21.8 a | 23.6 | 90.1 | 5.1 | 33.4 ± 13.6 a | 10.3 | 54.0 | 3.2 |
| VAN | 17.8 ± 12.0 a | 6.0 | 43.7 | 2.8 | 19.1 ± 10.7 a | 9.0 | 40.4 | 2.5 |
| SYAL | 25.9 ± 11.5 a | 8.1 | 49.9 | 2.7 | 32.1 ± 14.9 a | 10.6 | 57.1 | 3.5 |
| p-CO | 3.1 ± 2.6 a | 0.8 | 8.7 | 0.6 | 84.1 ± 42.8 b | 15.1 | 144.3 | 10.1 |
| FEA | 29.9 ± 9.0 a | 17.2 | 46.0 | 2.1 | 113.3 ± 46.4 b | 30.3 | 177.6 | 10.9 |
| SA | 4.5 ± 3.4 a | 2.0 | 13.5 | 0.8 | 23.2 ± 16.2 b | 4.6 | 49.3 | 3.8 |
| SUM | 221.2 ± 44.5 a | 166.5 | 307.6 | 10.5 | 531.6 ± 132.3 b | 334.9 | 770.9 | 31.2 |
| Horizon AE | ||||||||
| PA | 16.3 ± 7.7 b | 6.8 | 30.4 | 1.8 | 7.2 ± 4.2 a | 3.0 | 17.9 | 1.0 |
| p-HA | 77.0 ± 27.8 b | 40.4 | 126.1 | 6.6 | 10.9 ± 4.7 a | 5.1 | 21.3 | 1.1 |
| CHA | 54.1 ± 24.6 a | 21.2 | 90.5 | 5.8 | 49.5 ± 24.8 a | 10.0 | 79.0 | 5.8 |
| VA | 17.3 ± 9.3 b | 6.1 | 34.0 | 2.2 | 12.0 ± 8.6 a | 3.2 | 29.4 | 2.0 |
| SYR | 16.4 ± 14.0 a | 2.0 | 43.5 | 3.3 | 13.1 ± 5.5 a | 3.3 | 23.1 | 1.3 |
| CA | 35.8 ± 19.9 a | 6.1 | 66.2 | 4.7 | 28.8 ± 16.0 a | 7.2 | 55.2 | 3.8 |
| VAN | 17.5 ± 11.3 a | 3.2 | 34.5 | 2.7 | 12.9 ± 6.6 a | 4.0 | 27.0 | 1.6 |
| SYAL | 19.7 ± 12.3 b | 9.2 | 47.2 | 2.9 | 13.6 ± 12.5 a | 3.6 | 44.4 | 2.9 |
| p-CO | 4.3 ± 4.0 a | 0.4 | 13.9 | 0.9 | 11.4 ± 7.7 b | 4.7 | 29.1 | 1.8 |
| FEA | 9.4 ± 3.7 a | 2.1 | 13.4 | 0.9 | 50.2 ± 14.1 b | 30.2 | 77.3 | 3.3 |
| SA | 5.4 ± 3.9 a | 1.8 | 15.9 | 0.9 | 12.3 ± 6.8 b | 6.3 | 28.8 | 1.6 |
| SUM | 273.1 ± 50.2 b | 187.2 | 355.7 | 11.8 | 221.9 ± 47.9 a | 148.7 | 296.0 | 11.3 |
| Horizon Bsv | ||||||||
| PA | 13.3 ± 7.6 b | 3.3 | 29.9 | 1.8 | 8.3 ±2.6 a | 5.3 | 13.4 | 0.6 |
| p-HA | 57.5 ± 29.2 b | 12.9 | 92.3 | 6.9 | 12.9 ± 5.4 a | 5.1 | 24.8 | 1.3 |
| CHA | 44.4 ± 21.4 b | 18.2 | 86.7 | 5.0 | 21.6 ± 7.4 a | 11.1 | 35.0 | 1.7 |
| VA | 14.6 ± 9.0 b | 6.3 | 34.7 | 2.1 | 8.7 ± 6.1 a | 4.0 | 25.0 | 1.4 |
| SYR | 12.6 ± 3.2 b | 6.4 | 17.2 | 0.7 | 6.4 ± 3.7 a | 2.0 | 13.8 | 0.9 |
| CA | 27.5 ± 18.9 b | 8.4 | 60.0 | 4.5 | 8.6 ± 4.6 a | 3.3 | 17.2 | 1.1 |
| VAN | 12.9 ± 6.1 b | 6.5 | 24.4 | 1.4 | 4.6 ± 1.6 a | 2.4 | 8.0 | 0.4 |
| SYAL | 13.4 ± 15.1 b | 1.6 | 48.6 | 3.6 | 6.6 ± 1.5 a | 3.7 | 9.6 | 0.3 |
| p-CO | 4.3 ± 2.4 a | 1.4 | 9.3 | 0.6 | 9.5 ± 6.8 b | 2.0 | 22.7 | 1.6 |
| FEA | 12.2 ± 8.6 a | 3.3 | 30.7 | 2.0 | 22.6 ± 15.3 b | 7.8 | 58.7 | 3.6 |
| SA | 3.6 ± 2.2 a | 1.1 | 6.8 | 0.5 | 10.8 ± 9.2 b | 3.0 | 33.0 | 2.2 |
| SUM | 216.5 ± 30.2 b | 154.5 | 262.6 | 7.1 | 120.5 ± 29.7 a | 75.8 | 184.1 | 7.0 |
| Material | Sum of Hydrolyses | Acids Hydrolysis |
|---|---|---|
| H | 1:1:9 | 1:1:4 |
| St | 1:1:9 | 1:1:2 |
| R | 1:1:8 | 1:1.5:3 |
| SA | 1:1:3 | 1:1:2 |
| SAE | 1:1:2.5 | 1:1:1,5 |
| SBsv | 1:1:2 | 1:1:1.5 |
| Horizon | TOC | Nt | pH | 0.2-0.05 | 0.05–0.002 | <0.002 | |
|---|---|---|---|---|---|---|---|
| (g/kg) | (g/kg) | (%) | |||||
| A | Mean | 39.72 | 3.65 | - | 91.74 | 8.25 | n.d. ** |
| Min | 30.20 | 2.80 | 5.2 | 89.45 | 6.68 | - | |
| Max | 45.20 | 4.15 | 6.5 | 93.32 | 10.53 | - | |
| SE * | 6.00 | 0.49 | - | 1.29 | 1.28 | - | |
| AE | Mean | 28.73 | 2.77 | - | 91.33 | 9.20 | n.d. |
| Min | 21.40 | 2.13 | 5.6 | 88.70 | 6.19 | - | |
| Max | 35.60 | 3.41 | 6.7 | 93.81 | 11.82 | - | |
| SE | 6.31 | 0.57 | - | 1.83 | 2.21 | - | |
| Bsv | Mean | 15.83 | 1.44 | - | 89.30 | 10.20 | 0.02 |
| Min | 10.00 | 0.47 | 5.9 | 85.72 | 8.58 | 0.02 | |
| Max | 24.00 | 2.49 | 6.7 | 91.42 | 13.28 | 0.02 | |
| SE | 6.63 | 0.84 | - | 2.19 | 1.90 | - | |
| Name of the Standard | Regression Coefficient R2 | LOD μg/mL | LOQ μg/mL |
|---|---|---|---|
| Protocatechuic acid | 0.9831 | 0.22 | 0.67 |
| p-Hydroxybenzoic acid | 0.9801 | 0.41 | 1.23 |
| Chlorogenic acid | 0.9806 | 0.24 | 0.71 |
| Vanillic acid | 0.9836 | 0.25 | 0.75 |
| Syringic acid | 0.9863 | 0.35 | 1.04 |
| Caffeic acid | 0.9817 | 0.26 | 0.78 |
| Vanillin | 0.9865 | 0.17 | 0.51 |
| Syringaldehyde | 0.9818 | 0.15 | 0.45 |
| p-Coumaric acid | 0.9875 | 0.30 | 0.91 |
| Ferulic acid | 0.9858 | 0.23 | 0.70 |
| Salicylic acid | 0.9802 | 0.24 | 0.73 |
Sample Availability: Samples of the compounds are available from the authors. |
Publisher’s Note: MDPI stays neutral with regard to jurisdictional claims in published maps and institutional affiliations. |
© 2020 by the authors. Licensee MDPI, Basel, Switzerland. This article is an open access article distributed under the terms and conditions of the Creative Commons Attribution (CC BY) license (http://creativecommons.org/licenses/by/4.0/).
Share and Cite
Ziolkowska, A.; Debska, B.; Banach-Szott, M. Content of Phenolic Compounds in Meadow Vegetation and Soil Depending on the Isolation Method. Molecules 2020, 25, 5462. https://doi.org/10.3390/molecules25225462
Ziolkowska A, Debska B, Banach-Szott M. Content of Phenolic Compounds in Meadow Vegetation and Soil Depending on the Isolation Method. Molecules. 2020; 25(22):5462. https://doi.org/10.3390/molecules25225462
Chicago/Turabian StyleZiolkowska, Anna, Bozena Debska, and Magdalena Banach-Szott. 2020. "Content of Phenolic Compounds in Meadow Vegetation and Soil Depending on the Isolation Method" Molecules 25, no. 22: 5462. https://doi.org/10.3390/molecules25225462
APA StyleZiolkowska, A., Debska, B., & Banach-Szott, M. (2020). Content of Phenolic Compounds in Meadow Vegetation and Soil Depending on the Isolation Method. Molecules, 25(22), 5462. https://doi.org/10.3390/molecules25225462