
Novel Therapeutic Effects of Pterosin B on Ang II-Induced Cardiomyocyte Hypertrophy

 ,
,  , and
, and 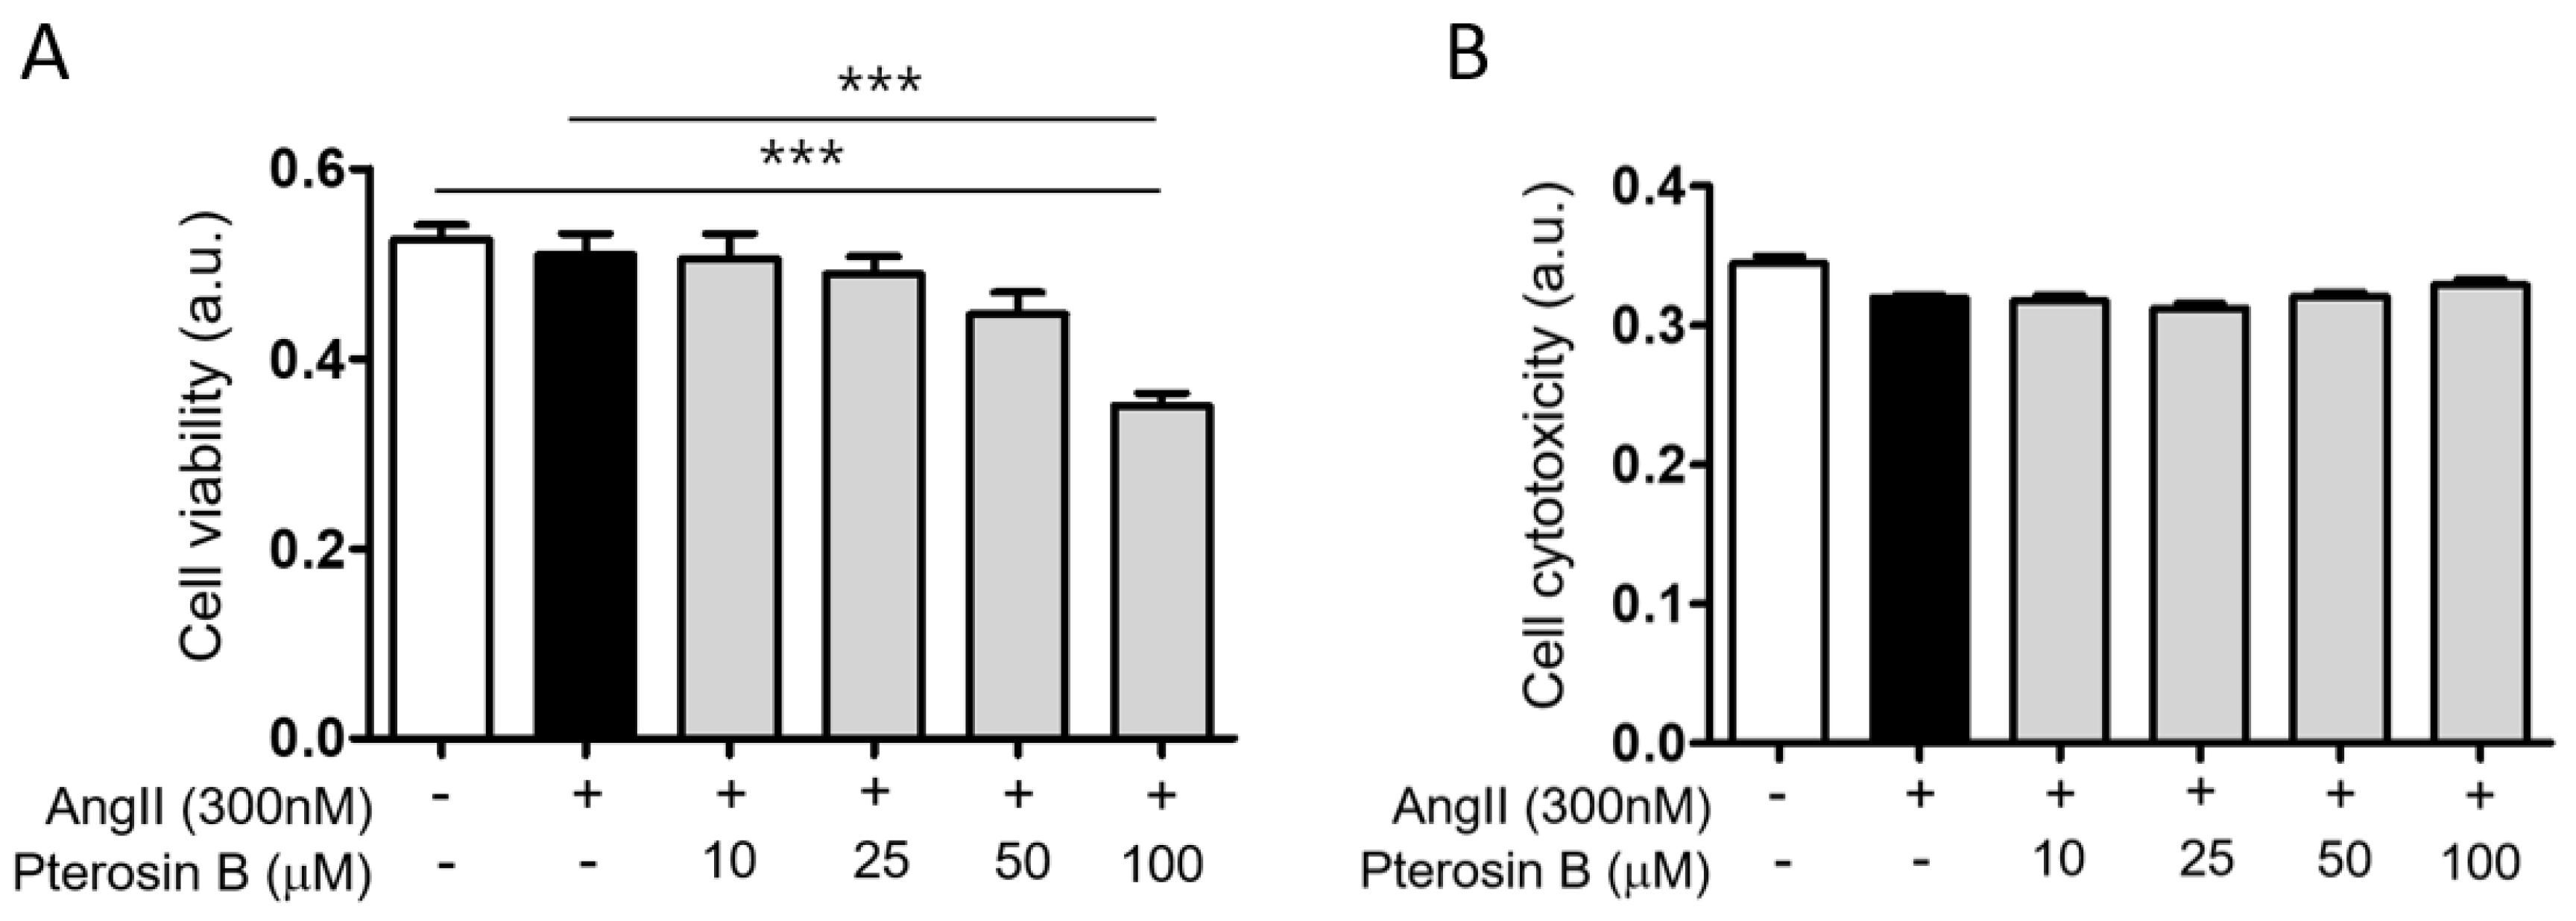
Abstract
1. Introduction
2. Results
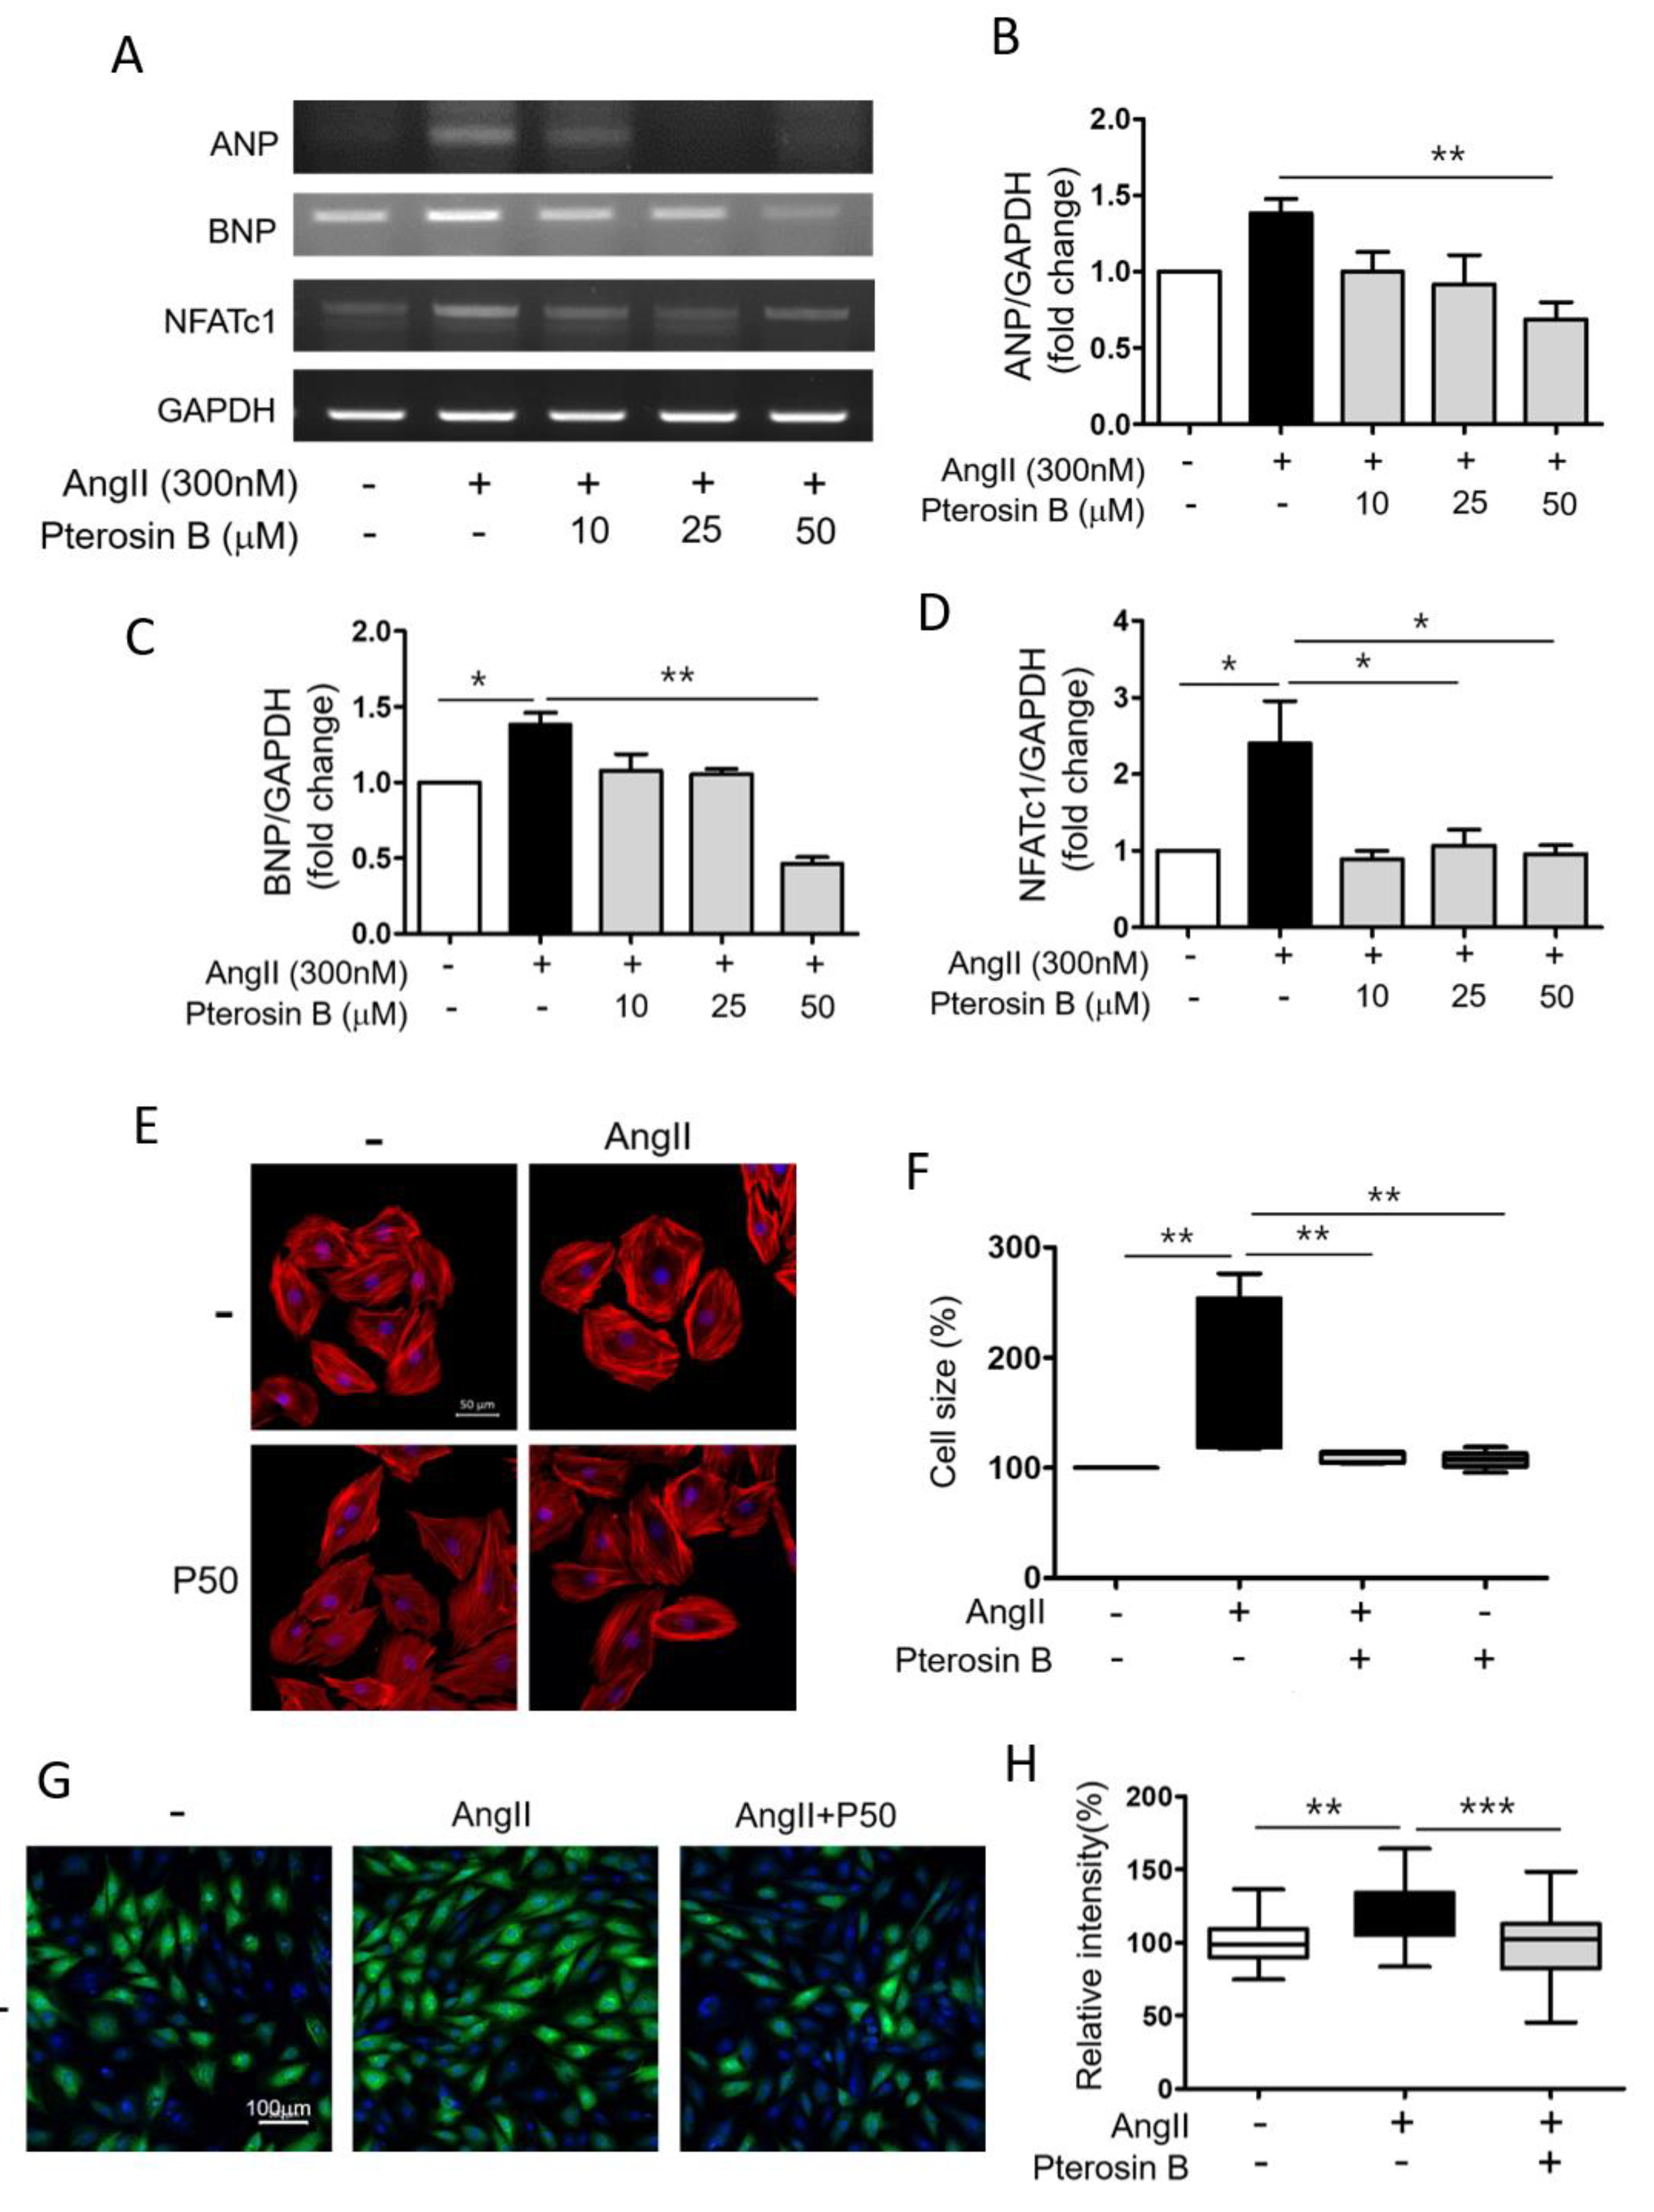
2.1. Anti-Hypertrophic Effect of Pterosin B on Ang II-Treated Cardiomyocytes
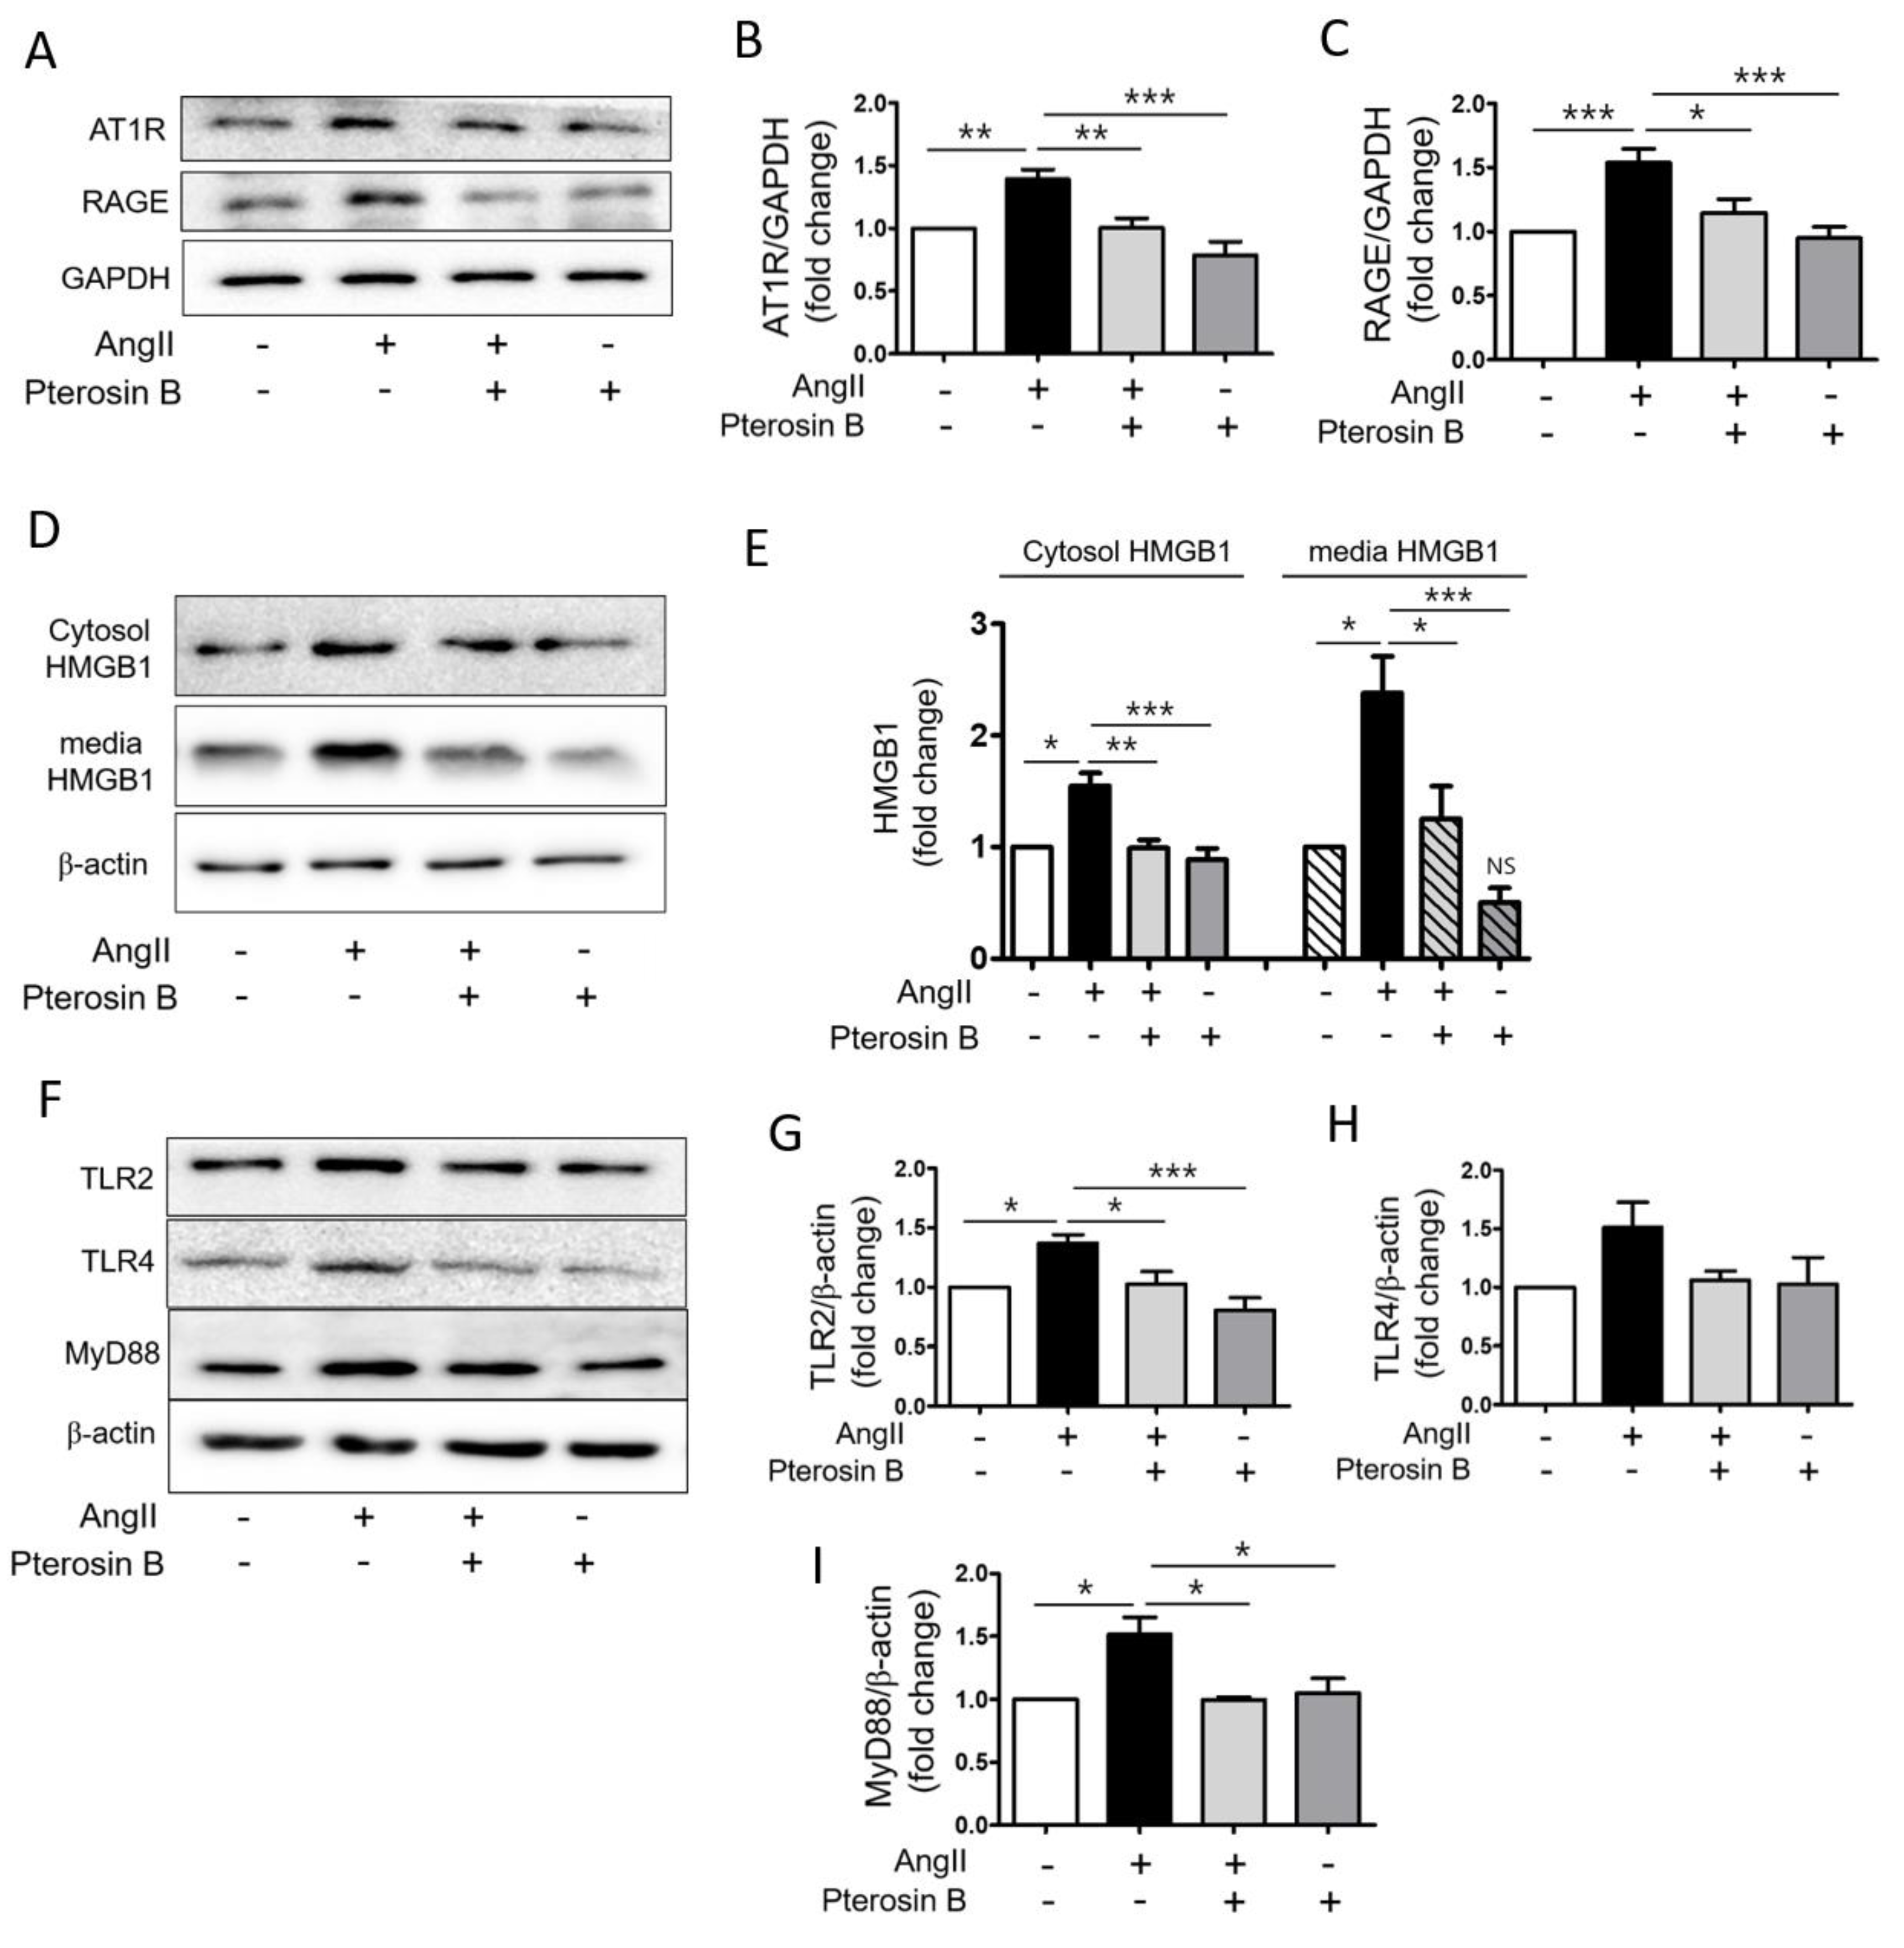
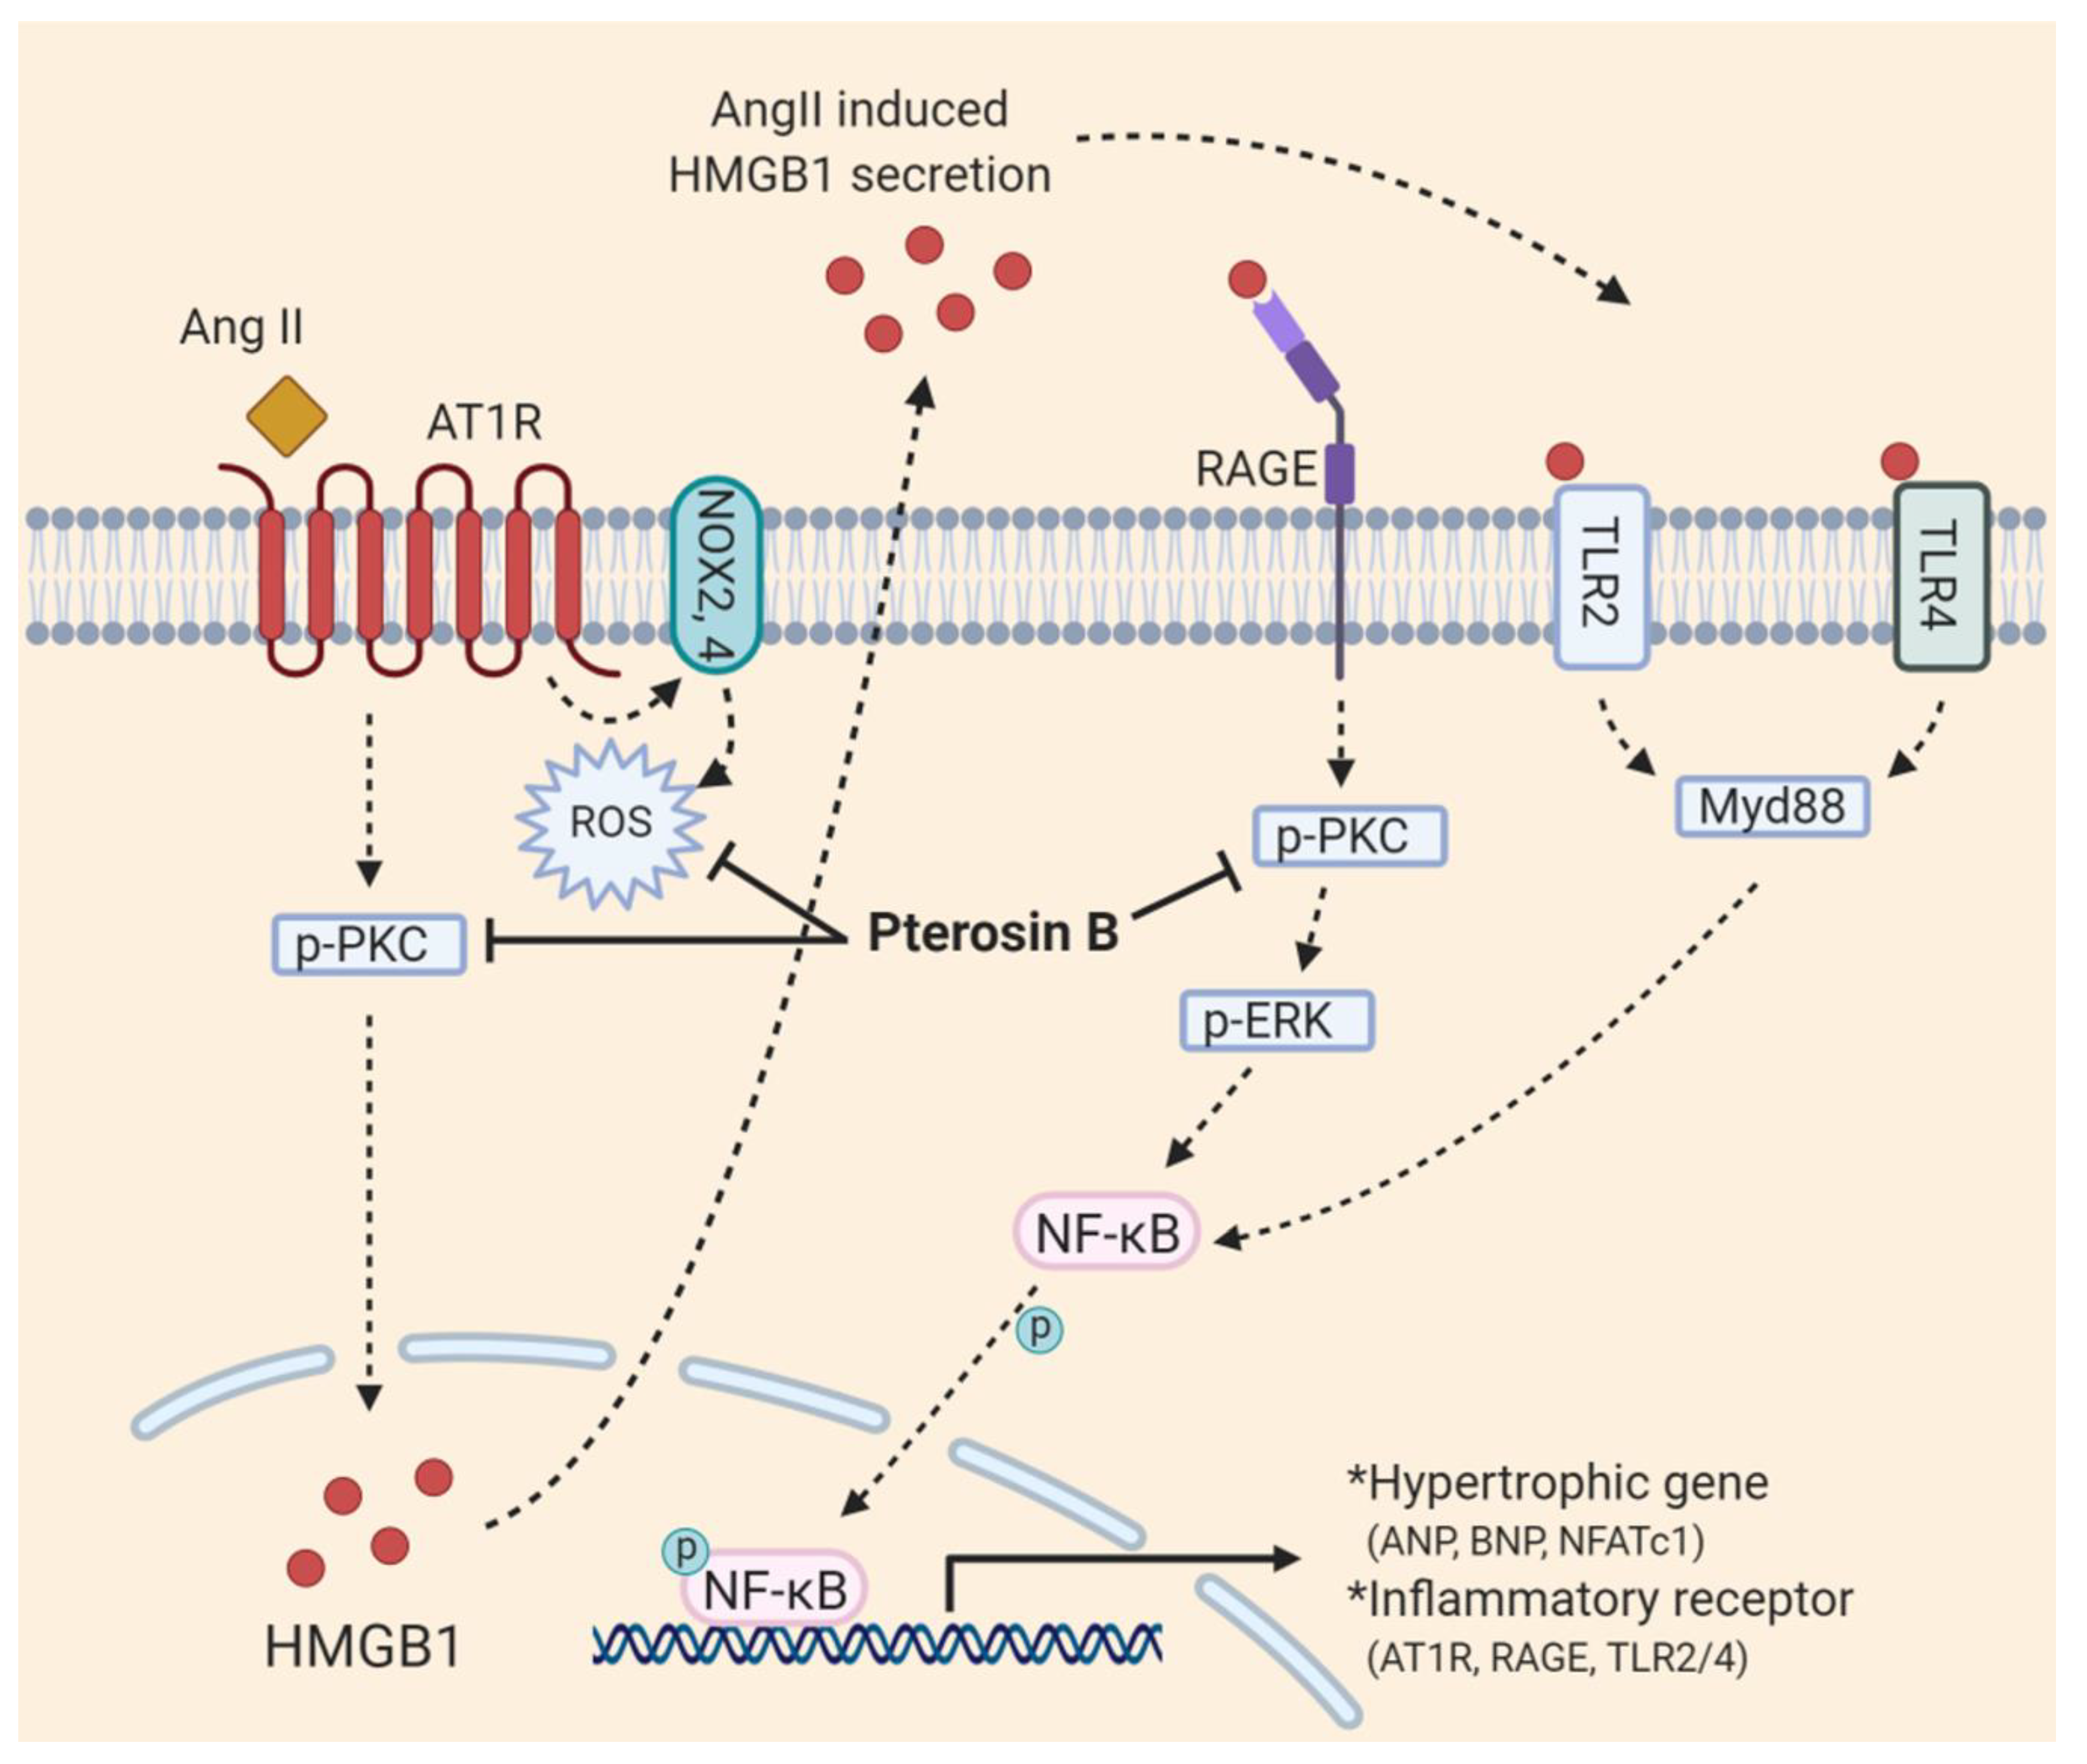
2.2. Pterosin B Attenuates AT1R-Mediated HMGB1 Secretion in Ang II-Induced Hypertrophic Cardiomyocytes
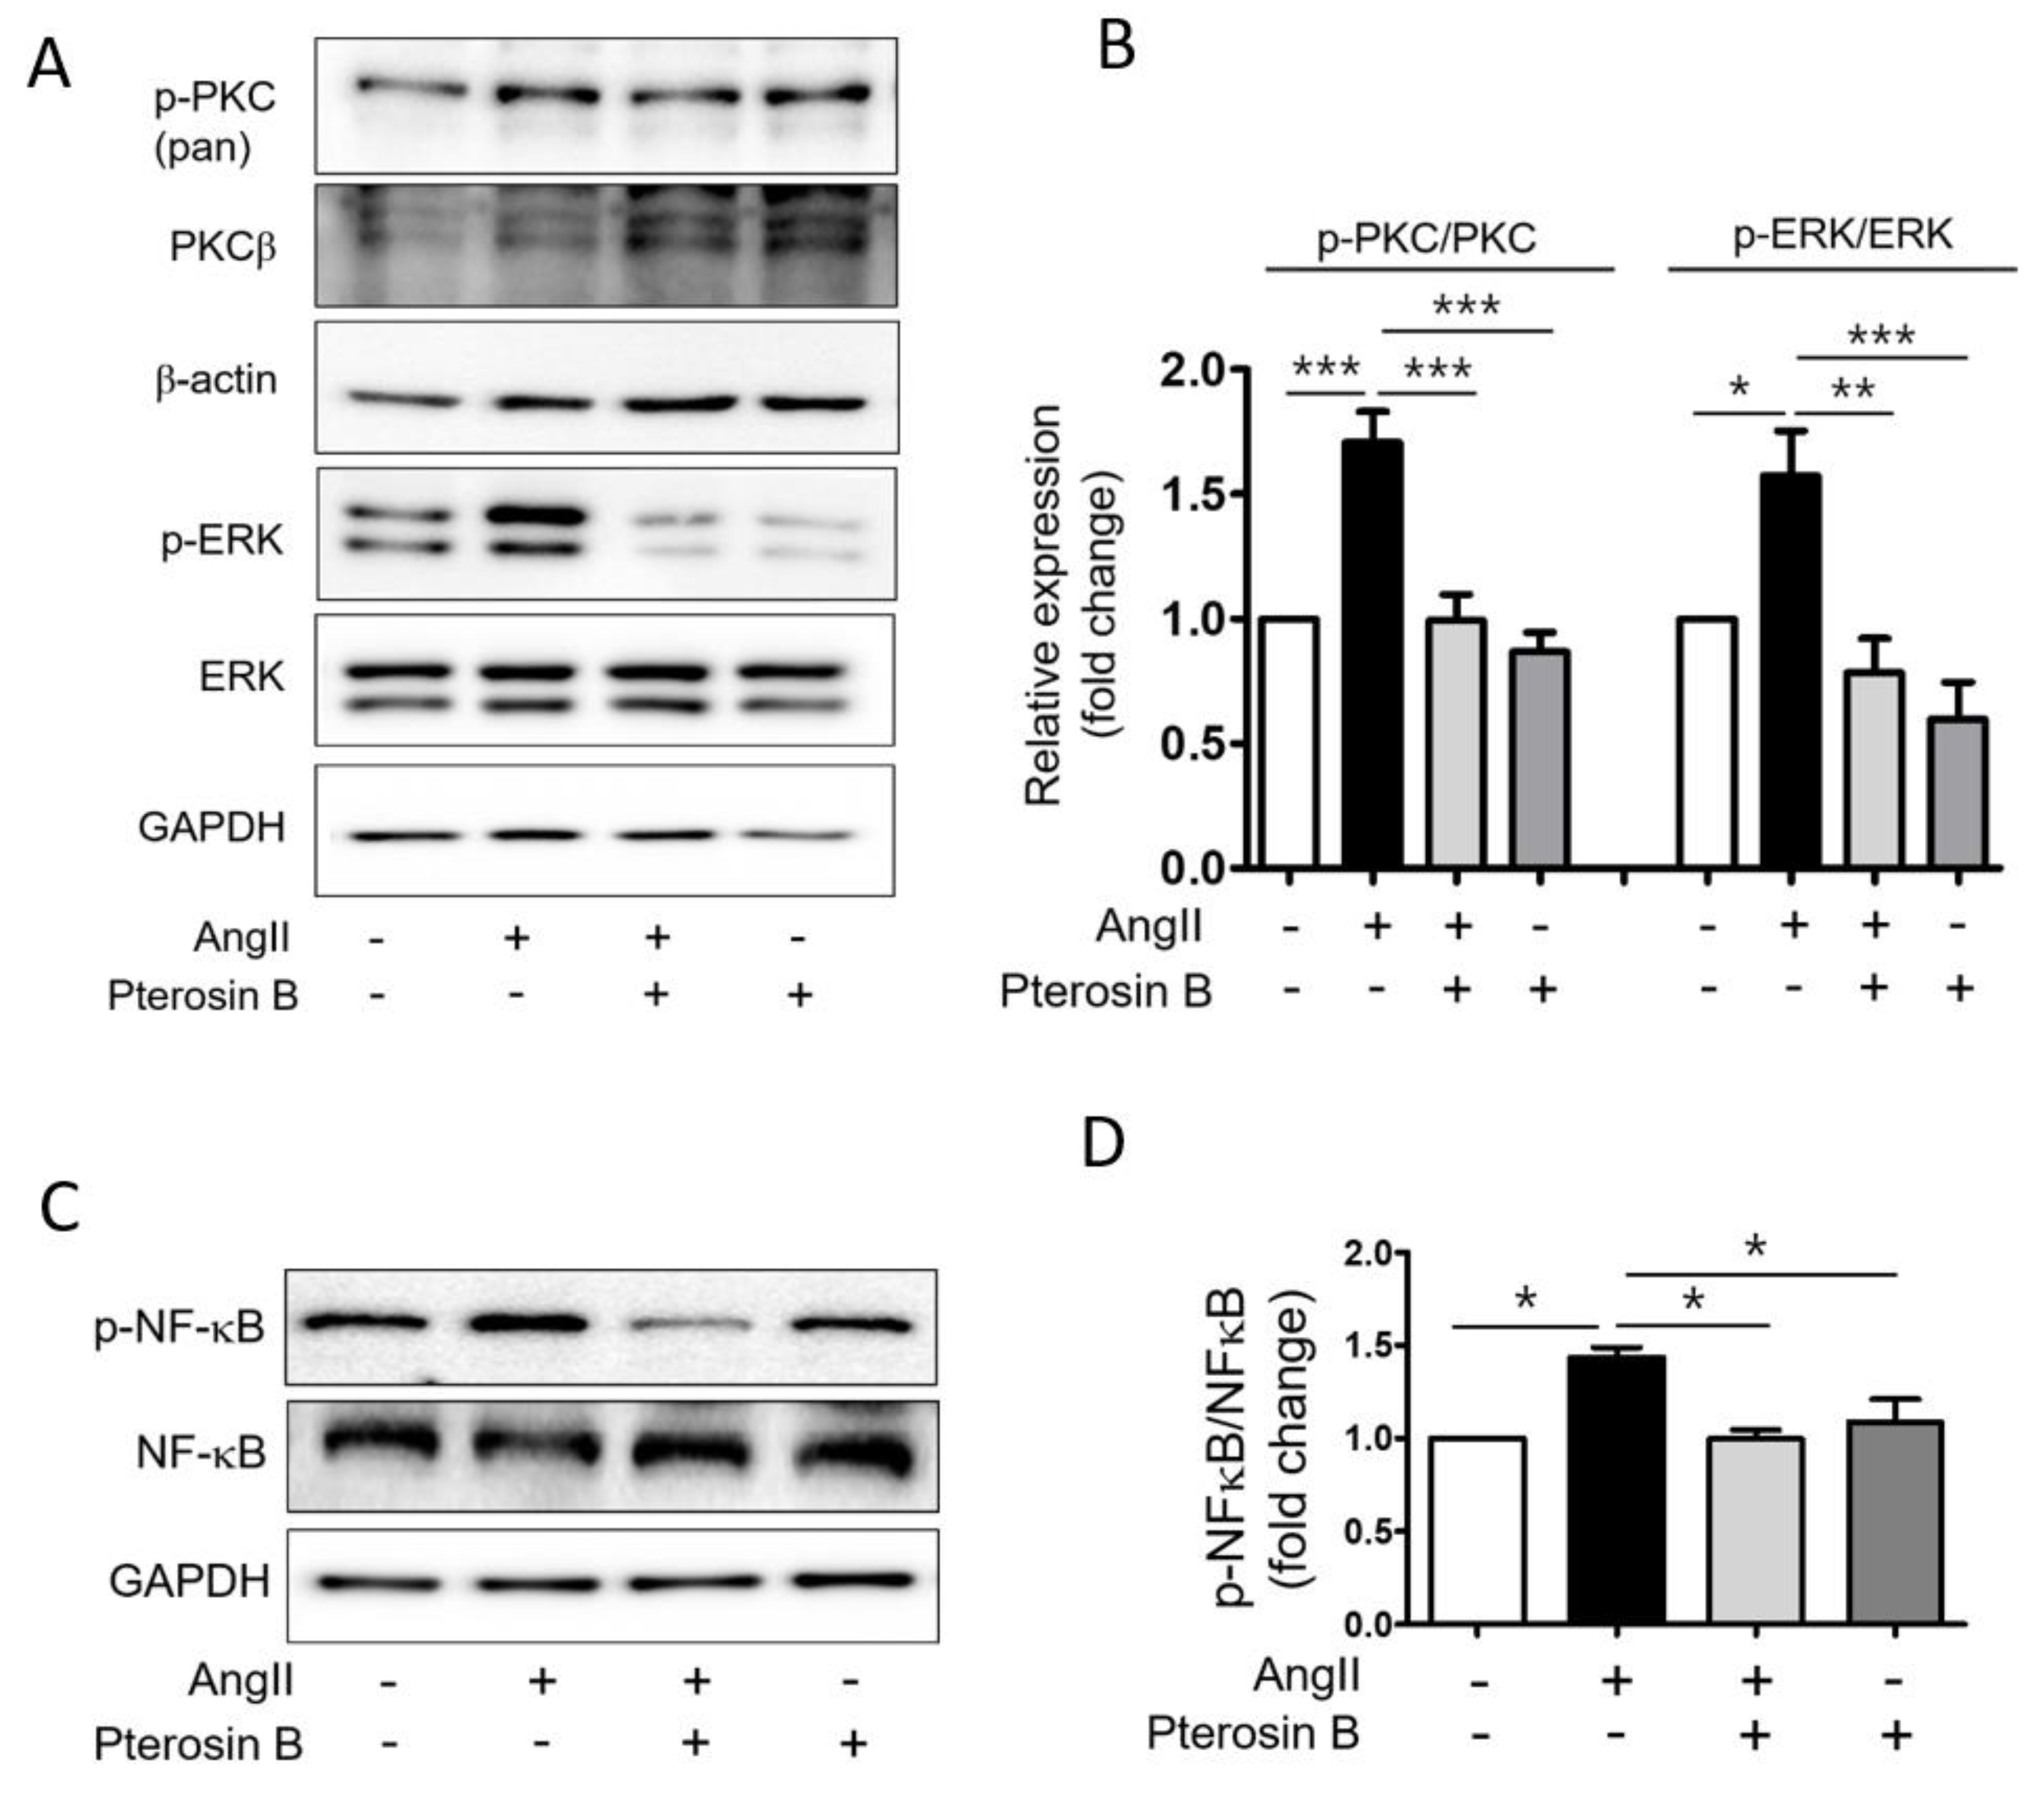
2.3. Pterosin B Attenuates Ang II-Mediated Signaling Pathways
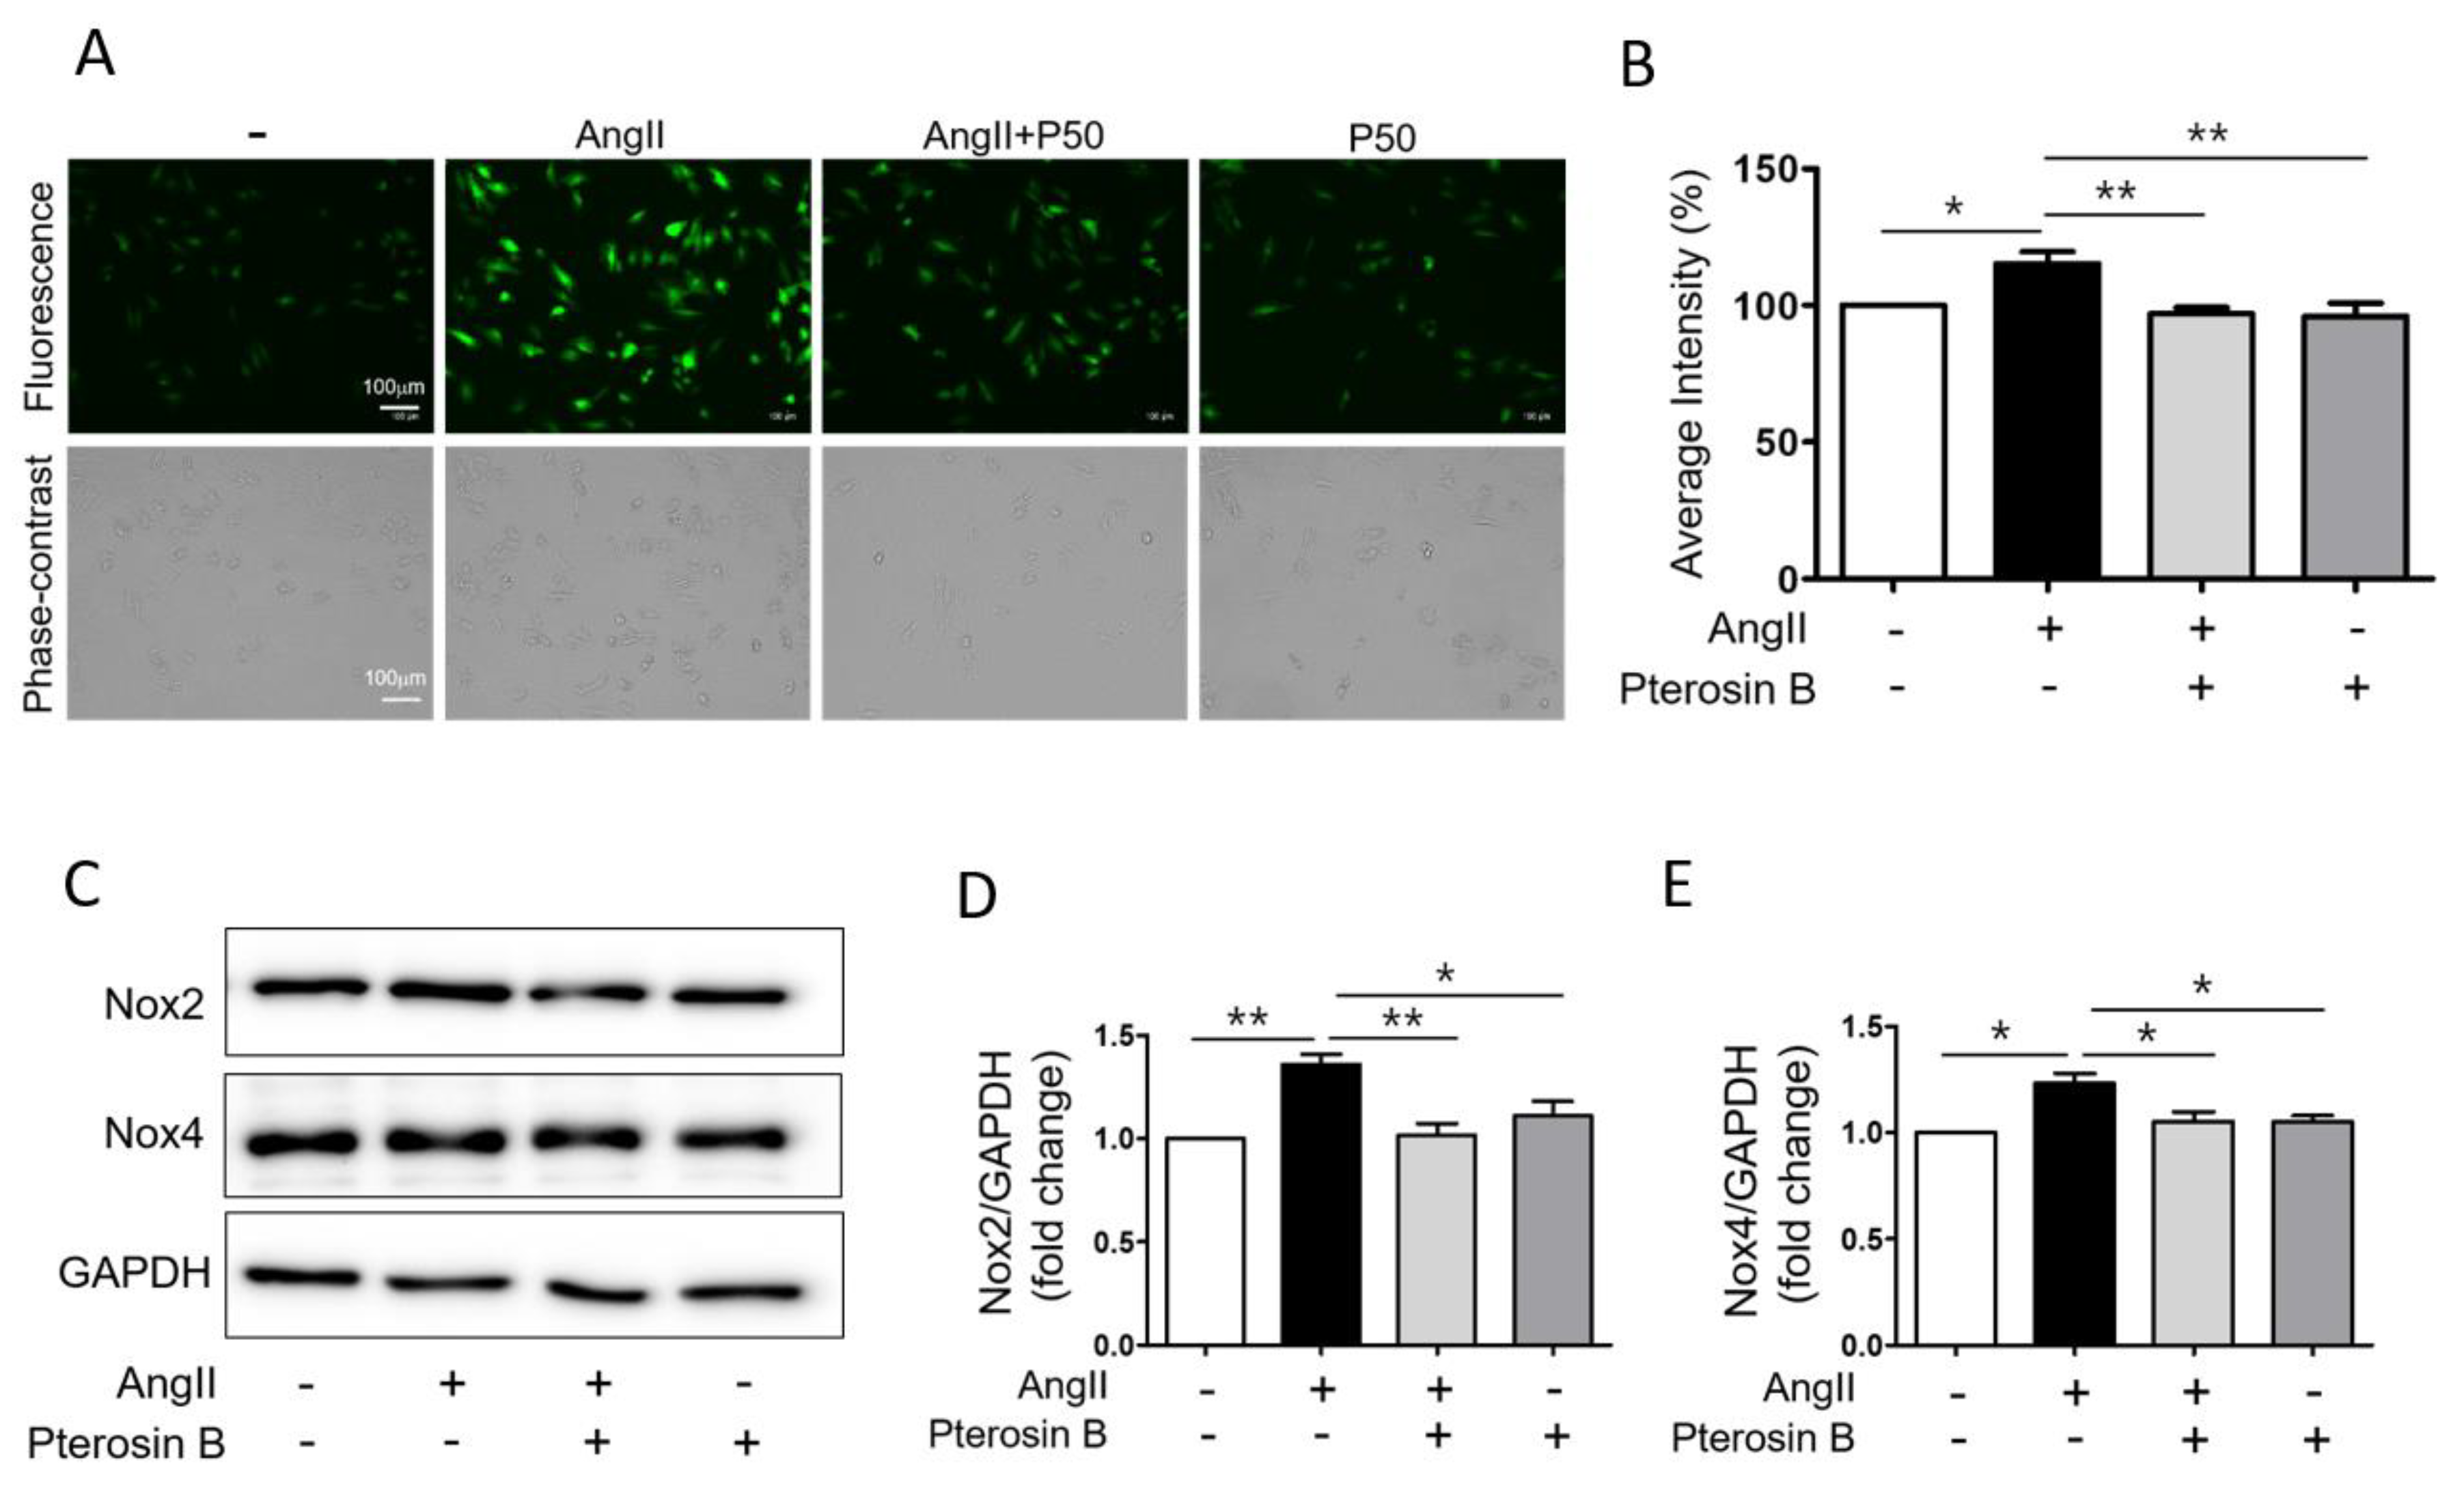
2.4. Pterosin B Attenuates Ang II-Induced Intracellular ROS
3. Discussion
4. Materials and Methods
4.1. Reagent
4.2. Induction of Cardiomyocyte Hypertrophy In Vitro
4.3. Cell Viability/Cytotoxicity Assay
4.3.1. Cell Viability
4.3.2. Cytotoxicity Assay
4.4. Immunocytochemistry and Cardiomyocyte Cell Size Measurement
4.5. Reverse Transcription PCR Analysis
4.6. Quantification of Protein Synthesis
4.7. Immunoblot Analysis
4.8. Measuring Cytosolic ROS Levels
4.9. Statistical Analysis
5. Conclusions
Supplementary Materials
Author Contributions
Funding
Conflicts of Interest
References
- Maron, B.J.; Ommen, S.R.; Semsarian, C.; Spirito, P.; Olivotto, I.; Maron, M.S. Hypertrophic cardiomyopathy: Present and future, with translation into contemporary cardiovascular medicine. J. Am. Coll. Cardiol. 2014, 64, 83–99. [Google Scholar] [CrossRef]
- Hernandez-Hernandez, R.; Sosa-Canache, B.; Velasco, M.; Armas-Hernandez, M.J.; Armas-Padilla, M.C.; Cammarata, R. Angiotensin II receptor antagonists role in arterial hypertension. J. Hum. Hypertens. 2002, 16 (Suppl. 1), S93–S99. [Google Scholar] [CrossRef]
- Crowley, S.D.; Gurley, S.B.; Herrera, M.J.; Ruiz, P.; Griffiths, R.; Kumar, A.P.; Kim, H.S.; Smithies, O.; Le, T.H.; Coffman, T.M. Angiotensin II causes hypertension and cardiac hypertrophy through its receptors in the kidney. Proc. Natl. Acad. Sci. USA 2006, 103, 17985–17990. [Google Scholar] [CrossRef] [PubMed]
- Mehta, P.K.; Griendling, K.K. Angiotensin II cell signaling: Physiological and pathological effects in the cardiovascular system. Am. J. Physiol. Cell. Physiol. 2007, 292, C82–C97. [Google Scholar] [CrossRef] [PubMed]
- Griffin, S.A.; Brown, W.C.; MacPherson, F.; McGrath, J.C.; Wilson, V.G.; Korsgaard, N.; Mulvany, M.J.; Lever, A.F. Angiotensin II causes vascular hypertrophy in part by a non-pressor mechanism. Hypertension 1991, 17, 626–635. [Google Scholar] [CrossRef] [PubMed]
- Kagiyama, S.; Eguchi, S.; Frank, G.D.; Inagami, T.; Zhang, Y.C.; Phillips, M.I. Angiotensin II-induced cardiac hypertrophy and hypertension are attenuated by epidermal growth factor receptor antisense. Circulation 2002, 106, 909–912. [Google Scholar] [CrossRef] [PubMed]
- Paradis, P.; Dali-Youcef, N.; Paradis, F.W.; Thibault, G.; Nemer, M. Overexpression of angiotensin II type I receptor in cardiomyocytes induces cardiac hypertrophy and remodeling. Proc. Natl. Acad. Sci. USA 2000, 97, 931–936. [Google Scholar] [CrossRef] [PubMed]
- Forrester, S.J.; Booz, G.W.; Sigmund, C.D.; Coffman, T.M.; Kawai, T.; Rizzo, V.; Scalia, R.; Eguchi, S. Angiotensin II Signal Transduction: An Update on Mechanisms of Physiology and Pathophysiology. Physiol. Rev. 2018, 98, 1627–1738. [Google Scholar] [CrossRef]
- Takimoto, E.; Kass, D.A. Role of oxidative stress in cardiac hypertrophy and remodeling. Hypertension 2007, 49, 241–248. [Google Scholar] [CrossRef]
- Crowley, S.D. Linking angiotensin II to nuclear factor-kappa light chain enhancer of activated B cells-induced cardiovascular damage: Bad CARMAs. Hypertension 2014, 64, 933–934. [Google Scholar] [CrossRef]
- Lim, S.; Lee, M.E.; Jeong, J.; Lee, J.; Cho, S.; Seo, M.; Park, S. sRAGE attenuates angiotensin II-induced cardiomyocyte hypertrophy by inhibiting RAGE-NFkappaB-NLRP3 activation. Inflamm. Res. 2018, 67, 691–701. [Google Scholar] [CrossRef] [PubMed]
- Mian, M.O.R.; He, Y.; Bertagnolli, M.; Mai-Vo, T.A.; Fernandes, R.O.; Boudreau, F.; Cloutier, A.; Luu, T.M.; Nuyt, A.M. TLR (Toll-Like Receptor) 4 Antagonism Prevents Left Ventricular Hypertrophy and Dysfunction Caused by Neonatal Hyperoxia Exposure in Rats. Hypertension 2019, 74, 843–853. [Google Scholar] [CrossRef] [PubMed]
- Wang, L.; Li, Y.L.; Zhang, C.C.; Cui, W.; Wang, X.; Xia, Y.; Du, J.; Li, H.H. Inhibition of Toll-like receptor 2 reduces cardiac fibrosis by attenuating macrophage-mediated inflammation. Cardiovasc. Res. 2014, 101, 383–392. [Google Scholar] [CrossRef] [PubMed]
- Singh, M.V.; Cicha, M.Z.; Nunez, S.; Meyerholz, D.K.; Chapleau, M.W.; Abboud, F.M. Angiotensin II-induced hypertension and cardiac hypertrophy are differentially mediated by TLR3- and TLR4-dependent pathways. Am. J. Physiol. Heart Circ. Physiol. 2019, 316, H1027–H1038. [Google Scholar] [CrossRef]
- Frantz, S.; Kelly, R.A.; Bourcier, T. Role of TLR-2 in the activation of nuclear factor kappaB by oxidative stress in cardiac myocytes. J. Biol. Chem. 2001, 276, 5197–5203. [Google Scholar] [CrossRef]
- Su, F.F.; Shi, M.Q.; Guo, W.G.; Liu, X.T.; Wang, H.T.; Lu, Z.F.; Zheng, Q.S. High-mobility group box 1 induces calcineurin-mediated cell hypertrophy in neonatal rat ventricular myocytes. Mediat. Inflamm. 2012, 2012, 805149. [Google Scholar] [CrossRef]
- Yang, H.; Wang, H.; Czura, C.J.; Tracey, K.J. The cytokine activity of HMGB1. J. Leukoc. Biol. 2005, 78, 1–8. [Google Scholar] [CrossRef]
- Vetter, J. A biological hazard of our age: Bracken fern [Pteridium aquilinum (L.) Kuhn]-a review. Acta Vet. Hung. 2009, 57, 183–196. [Google Scholar] [CrossRef]
- Potter, D.M.; Baird, M.S. Carcinogenic effects of ptaquiloside in bracken fern and related compounds. Br. J. Cancer 2000, 83, 914–920. [Google Scholar] [CrossRef]
- O’Driscoll, C.; Ramwell, C.; Harhen, B.; Morrison, L.; Clauson-Kaas, F.; Hansen, H.C.; Campbell, G.; Sheahan, J.; Misstear, B.; Xiao, L. Ptaquiloside in Irish Bracken Ferns and Receiving Waters, with Implications for Land Managers. Molecules 2016, 21, 543. [Google Scholar] [CrossRef]
- Wang, H.; Wu, S. Preparation and antioxidant activity of Pteridium aquilinum-derived oligosaccharide. Int. J. Biol. Macromol. 2013, 61, 33–35. [Google Scholar] [CrossRef] [PubMed]
- Xu, W.; Zhang, F.; Luo, Y.; Ma, L.; Kou, X.; Huang, K. Antioxidant activity of a water-soluble polysaccharide purified from Pteridium aquilinum. Carbohydr. Res. 2009, 344, 217–222. [Google Scholar] [CrossRef] [PubMed]
- Dion, C.; Haug, C.; Guan, H.; Ripoll, C.; Spiteller, P.; Coussaert, A.; Boulet, E.; Schmidt, D.; Wei, J.; Zhou, Y.; et al. Evaluation of the anti-inflammatory and antioxidative potential of four fern species from China intended for use as food supplements. Nat. Prod. Commun. 2015, 10, 597–603. [Google Scholar] [CrossRef] [PubMed]
- Latorre, A.O.; Furlan, M.S.; Sakai, M.; Fukumasu, H.; Hueza, I.M.; Haraguchi, M.; Gorniak, S.L. Immunomodulatory effects of Pteridium aquilinum on natural killer cell activity and select aspects of the cellular immune response of mice. J. Immunotoxicol. 2009, 6, 104–114. [Google Scholar] [CrossRef]
- Sang Don Koh, K.S.K. Effect of ethanol extracts of raw and boiled bracken on blood pressure in cats. Korean J. Physiol. 1984, 18, 171–180. [Google Scholar]
- Yahara, Y.; Takemori, H.; Okada, M.; Kosai, A.; Yamashita, A.; Kobayashi, T.; Fujita, K.; Itoh, Y.; Nakamura, M.; Fuchino, H.; et al. Pterosin B prevents chondrocyte hypertrophy and osteoarthritis in mice by inhibiting Sik3. Nat. Commun. 2016, 7, 10959. [Google Scholar] [CrossRef]
- Swynghedauw, B. Molecular mechanisms of myocardial remodeling. Physiol Rev. 1999, 79, 215–262. [Google Scholar] [CrossRef]
- Billet, S.; Aguilar, F.; Baudry, C.; Clauser, E. Role of angiotensin II AT1 receptor activation in cardiovascular diseases. Kidney Int. 2008, 74, 1379–1384. [Google Scholar] [CrossRef]
- Zheng, C.; Chen, J.; Chu, F.; Zhu, J.; Jin, T. Inflammatory Role of TLR-MyD88 Signaling in Multiple Sclerosis. Front. Mol. Neurosci. 2019, 12, 314. [Google Scholar] [CrossRef]
- Cho, S.; Cho, H.W.; Woo, K.W.; Jeong, J.; Lim, J.; Park, S.; Seo, M.; Lim, S. Nelumbo nucifera Receptaculum Extract Suppresses Angiotensin II-Induced Cardiomyocyte Hypertrophy. Molecules 2019, 24, 1647. [Google Scholar] [CrossRef]
- Nguyen Dinh Cat, A.; Montezano, A.C.; Burger, D.; Touyz, R.M. Angiotensin II, NADPH oxidase, and redox signaling in the vasculature. Antioxid. Redox Signal. 2013, 19, 1110–1120. [Google Scholar] [CrossRef] [PubMed]
- Maulik, S.K.; Kumar, S. Oxidative stress and cardiac hypertrophy: A review. Toxicol. Mech. Methods 2012, 22, 359–366. [Google Scholar] [CrossRef] [PubMed]
- Zhang, M.; Mongue-Din, H.; Martin, D.; Catibog, N.; Smyrnias, I.; Zhang, X.; Yu, B.; Wang, M.; Brandes, R.P.; Schroder, K.; et al. Both cardiomyocyte and endothelial cell Nox4 mediate protection against hemodynamic overload-induced remodelling. Cardiovasc. Res. 2018, 114, 401–408. [Google Scholar] [CrossRef] [PubMed]
- Jeong, J.; Lee, J.; Lim, J.; Cho, S.; An, S.; Lee, M.; Yoon, N.; Seo, M.; Lim, S.; Park, S. Soluble RAGE attenuates AngII-induced endothelial hyperpermeability by disrupting HMGB1-mediated crosstalk between AT1R and RAGE. Exp. Mol. Med. 2019, 51, 1–15. [Google Scholar] [CrossRef]
- Feng, Q.; Liu, D.; Lu, Y.; Liu, Z. The Interplay of Renin-Angiotensin System and Toll-Like Receptor 4 in the Inflammation of Diabetic Nephropathy. J. Immunol. Res. 2020, 2020, 6193407. [Google Scholar] [CrossRef]
- Ramalingam, L.; Menikdiwela, K.; LeMieux, M.; Dufour, J.M.; Kaur, G.; Kalupahana, N.; Moustaid-Moussa, N. The renin angiotensin system, oxidative stress and mitochondrial function in obesity and insulin resistance. Biochim. Biophys. Acta Mol. Basis. Dis. 2017, 1863, 1106–1114. [Google Scholar] [CrossRef]
- Dai, D.F.; Johnson, S.C.; Villarin, J.J.; Chin, M.T.; Nieves-Cintron, M.; Chen, T.; Marcinek, D.J.; Dorn, G.W., 2nd; Kang, Y.J.; Prolla, T.A.; et al. Mitochondrial oxidative stress mediates angiotensin II-induced cardiac hypertrophy and Galphaq overexpression-induced heart failure. Circ. Res. 2011, 108, 837–846. [Google Scholar] [CrossRef]
- Zhang, G.X.; Lu, X.M.; Kimura, S.; Nishiyama, A. Role of mitochondria in angiotensin II-induced reactive oxygen species and mitogen-activated protein kinase activation. Cardiovasc. Res. 2007, 76, 204–212. [Google Scholar] [CrossRef]
- Murdoch, C.E.; Alom-Ruiz, S.P.; Wang, M.; Zhang, M.; Walker, S.; Yu, B.; Brewer, A.; Shah, A.M. Role of endothelial Nox2 NADPH oxidase in angiotensin II-induced hypertension and vasomotor dysfunction. Basic Res. Cardiol. 2011, 106, 527–538. [Google Scholar] [CrossRef]
- Han, S.J.; Min, H.J.; Yoon, S.C.; Ko, E.A.; Park, S.J.; Yoon, J.H.; Shin, J.S.; Seo, K.Y. HMGB1 in the pathogenesis of ultraviolet-induced ocular surface inflammation. Cell Death Dis. 2015, 6, e1863. [Google Scholar] [CrossRef]
- Min, H.J.; Kim, J.H.; Yoo, J.E.; Oh, J.H.; Kim, K.S.; Yoon, J.H.; Kim, C.H. ROS-dependent HMGB1 secretion upregulates IL-8 in upper airway epithelial cells under hypoxic condition. Mucosal Immunol. 2017, 10, 685–694. [Google Scholar] [CrossRef] [PubMed]
- Raucci, A.; Di Maggio, S.; Scavello, F.; D’Ambrosio, A.; Bianchi, M.E.; Capogrossi, M.C. The Janus face of HMGB1 in heart disease: A necessary update. Cell. Mol. Life Sci. 2019, 76, 211–229. [Google Scholar] [CrossRef] [PubMed]
- Andrassy, M.; Volz, H.C.; Igwe, J.C.; Funke, B.; Eichberger, S.N.; Kaya, Z.; Buss, S.; Autschbach, F.; Pleger, S.T.; Lukic, I.K.; et al. High-mobility group box-1 in ischemia-reperfusion injury of the heart. Circulation 2008, 117, 3216–3226. [Google Scholar] [CrossRef] [PubMed]
- Su, Z.; Sun, C.; Zhou, C.; Liu, Y.; Zhu, H.; Sandoghchian, S.; Zheng, D.; Peng, T.; Zhang, Y.; Jiao, Z.; et al. HMGB1 blockade attenuates experimental autoimmune myocarditis and suppresses Th17-cell expansion. Eur. J. Immunol. 2011, 41, 3586–3595. [Google Scholar] [CrossRef] [PubMed]
- Oh, Y.J.; Youn, J.H.; Ji, Y.; Lee, S.E.; Lim, K.J.; Choi, J.E.; Shin, J.S. HMGB1 is phosphorylated by classical protein kinase C and is secreted by a calcium-dependent mechanism. J. Immunol. 2009, 182, 5800–5809. [Google Scholar] [CrossRef]
- An, K.; Rong, H.; Ni, H.; Zhu, C.; Xu, L.; Liu, Q.; Chen, Y.; Zheng, Y.; Huang, B.; Yao, M. Spinal PKC activation—Induced neuronal HMGB1 translocation contributes to hyperalgesia in a bone cancer pain model in rats. Exp. Neurol. 2018, 303, 80–94. [Google Scholar] [CrossRef]
- Zhou, S.; Lu, H.; Chen, R.; Tian, Y.; Jiang, Y.; Zhang, S.; Ni, D.; Su, Z.; Shao, X. Angiotensin II enhances the acetylation and release of HMGB1 in RAW264.7 macrophage. Cell. Biol. Int. 2018, 42, 1160–1169. [Google Scholar] [CrossRef]
- Sanguinetti, M.C.; Jiang, C.; Curran, M.E.; Keating, M.T. A mechanistic link between an inherited and an acquired cardiac arrhythmia: HERG encodes the IKr potassium channel. Cell 1995, 81, 299–307. [Google Scholar] [CrossRef]
- Roy, M.; Dumaine, R.; Brown, A.M. HERG, a primary human ventricular target of the nonsedating antihistamine terfenadine. Circulation 1996, 94, 817–823. [Google Scholar] [CrossRef]
- Chiu, P.J.; Marcoe, K.F.; Bounds, S.E.; Lin, C.H.; Feng, J.J.; Lin, A.; Cheng, F.C.; Crumb, W.J.; Mitchell, R. Validation of a [3H]astemizole binding assay in HEK293 cells expressing HERG K+ channels. J. Pharmacol. Sci. 2004, 95, 311–319. [Google Scholar] [CrossRef]
Sample Availability: Samples of the compounds are not available from the authors. |


Publisher’s Note: MDPI stays neutral with regard to jurisdictional claims in published maps and institutional affiliations. |
© 2020 by the authors. Licensee MDPI, Basel, Switzerland. This article is an open access article distributed under the terms and conditions of the Creative Commons Attribution (CC BY) license (http://creativecommons.org/licenses/by/4.0/).
Share and Cite
Lee, C.Y.; Park, H.K.; Lee, B.-S.; Jeong, S.; Hyun, S.-A.; Choi, J.-W.; Kim, S.W.; Lee, S.; Lim, S.; Hwang, K.-C. Novel Therapeutic Effects of Pterosin B on Ang II-Induced Cardiomyocyte Hypertrophy. Molecules 2020, 25, 5279. https://doi.org/10.3390/molecules25225279
Lee CY, Park HK, Lee B-S, Jeong S, Hyun S-A, Choi J-W, Kim SW, Lee S, Lim S, Hwang K-C. Novel Therapeutic Effects of Pterosin B on Ang II-Induced Cardiomyocyte Hypertrophy. Molecules. 2020; 25(22):5279. https://doi.org/10.3390/molecules25225279
Chicago/Turabian StyleLee, Chang Youn, Han Ki Park, Bok-Sim Lee, Seongtae Jeong, Sung-Ae Hyun, Jung-Won Choi, Sang Woo Kim, Seahyoung Lee, Soyeon Lim, and Ki-Chul Hwang. 2020. "Novel Therapeutic Effects of Pterosin B on Ang II-Induced Cardiomyocyte Hypertrophy" Molecules 25, no. 22: 5279. https://doi.org/10.3390/molecules25225279
APA StyleLee, C. Y., Park, H. K., Lee, B.-S., Jeong, S., Hyun, S.-A., Choi, J.-W., Kim, S. W., Lee, S., Lim, S., & Hwang, K.-C. (2020). Novel Therapeutic Effects of Pterosin B on Ang II-Induced Cardiomyocyte Hypertrophy. Molecules, 25(22), 5279. https://doi.org/10.3390/molecules25225279