
Advances in Optical Detection of Human-Associated Pathogenic Bacteria

Abstract
1. Introduction
2. Conventional Detection Methods
3. The Case for Optical Detection of Pathogenic Bacteria
3.1. Vibrational Spectroscopy to Distinguish Cell Biomolecular Composition
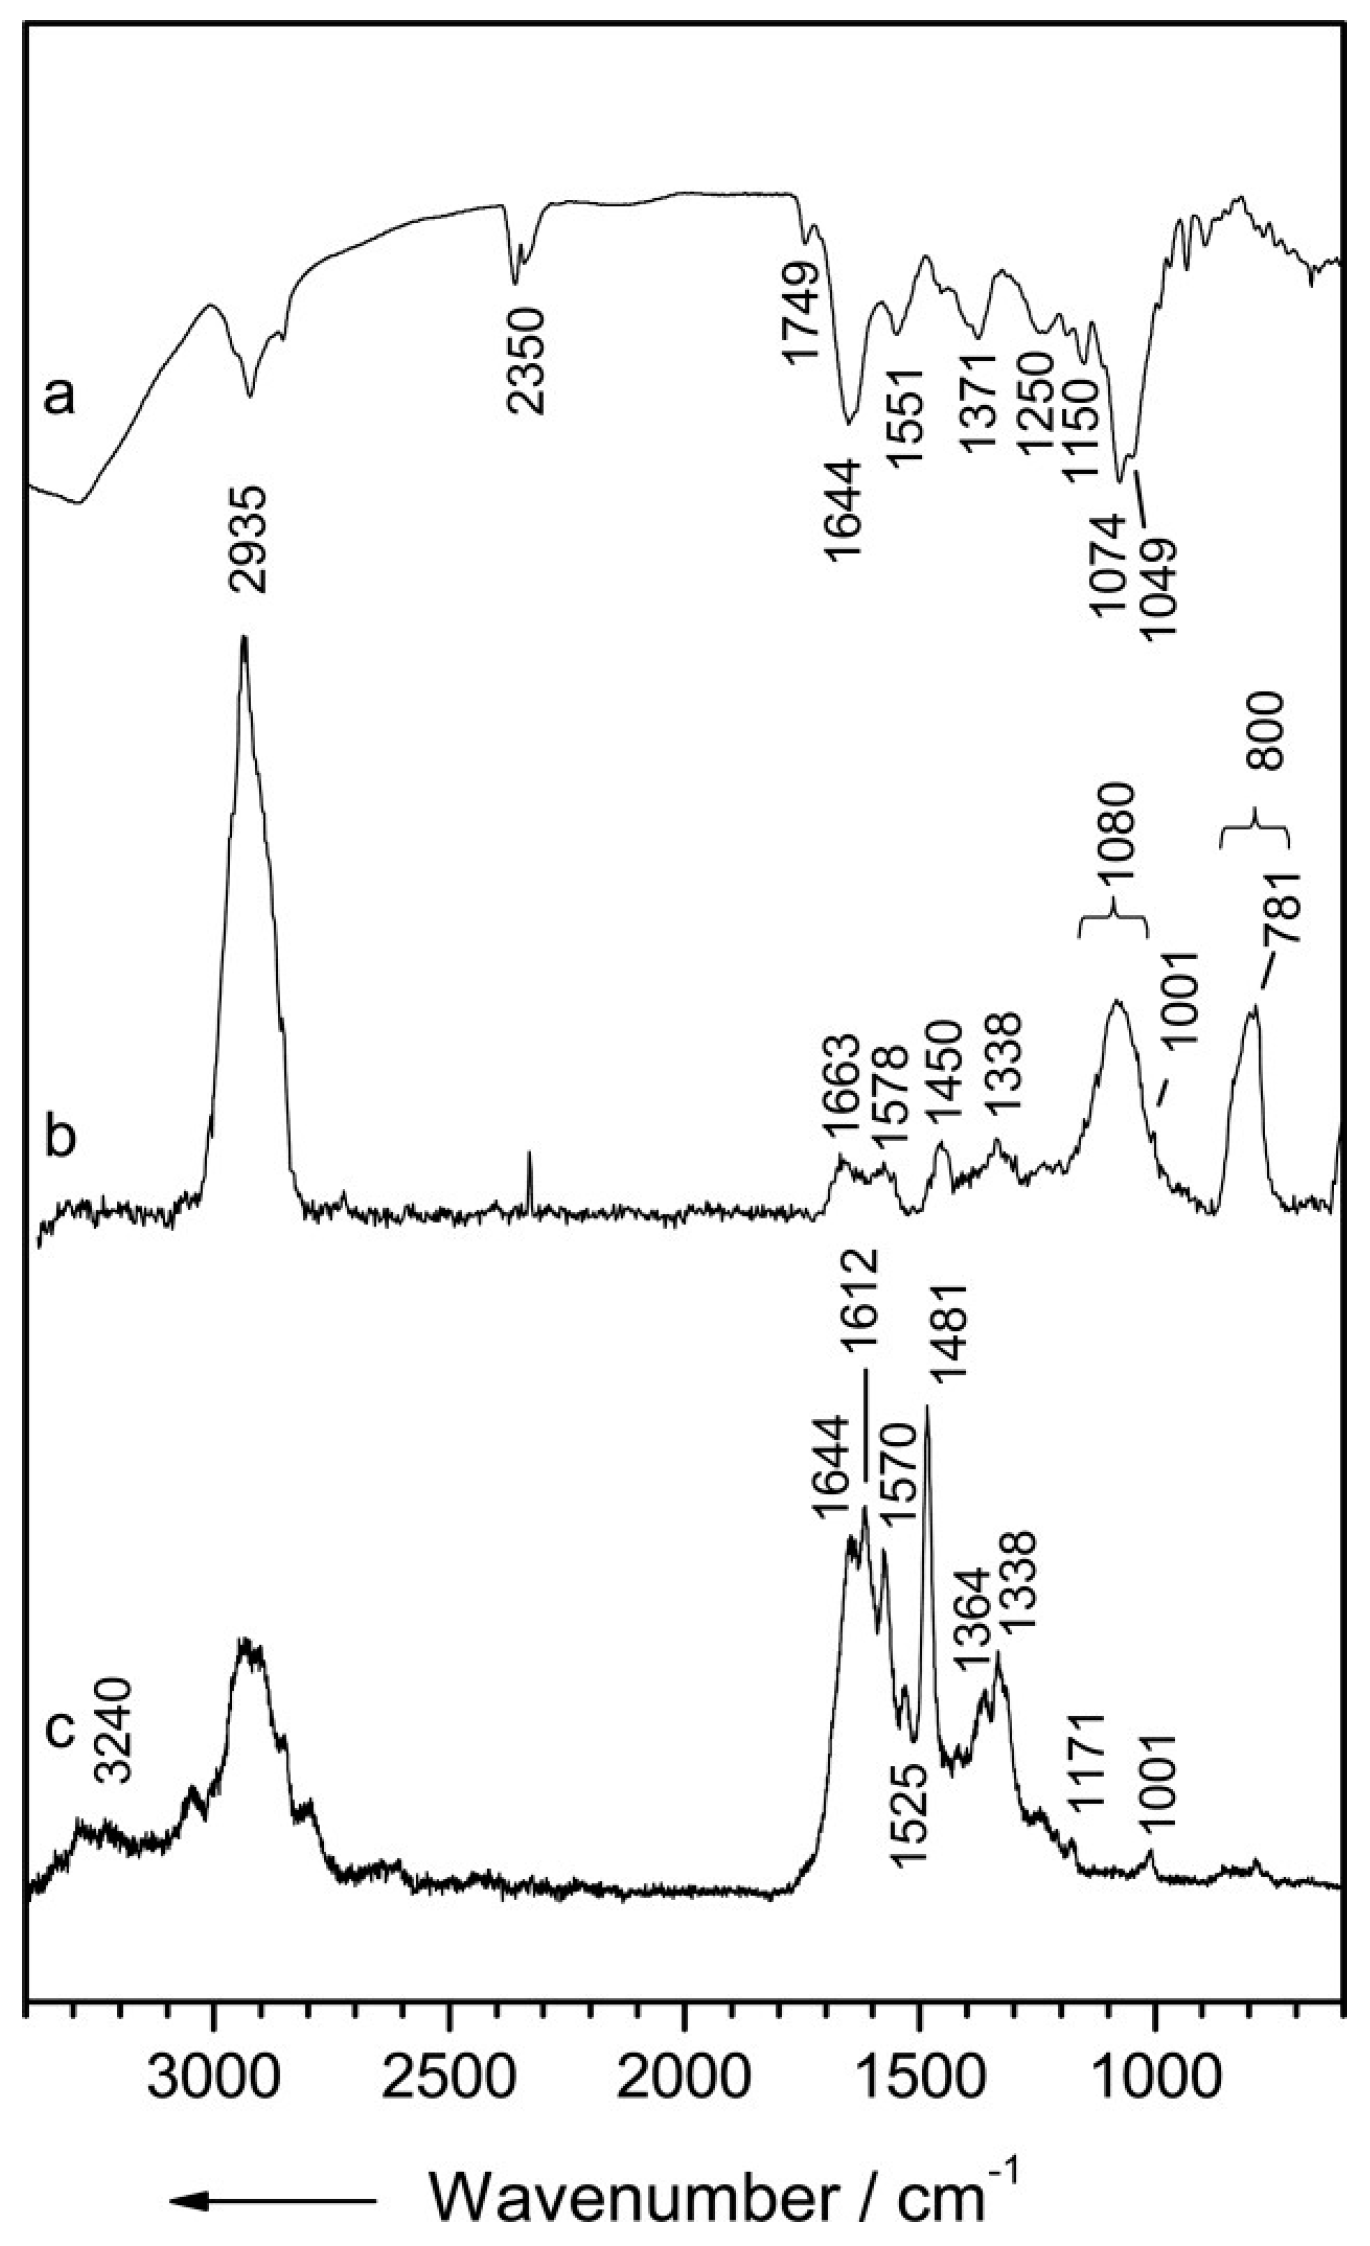
3.1.1. Infrared Spectroscopy
3.1.2. Raman Spectroscopy
3.1.3. Ultra-Violet Resonance Raman
3.1.4. Surface-Enhanced Raman Spectroscopy
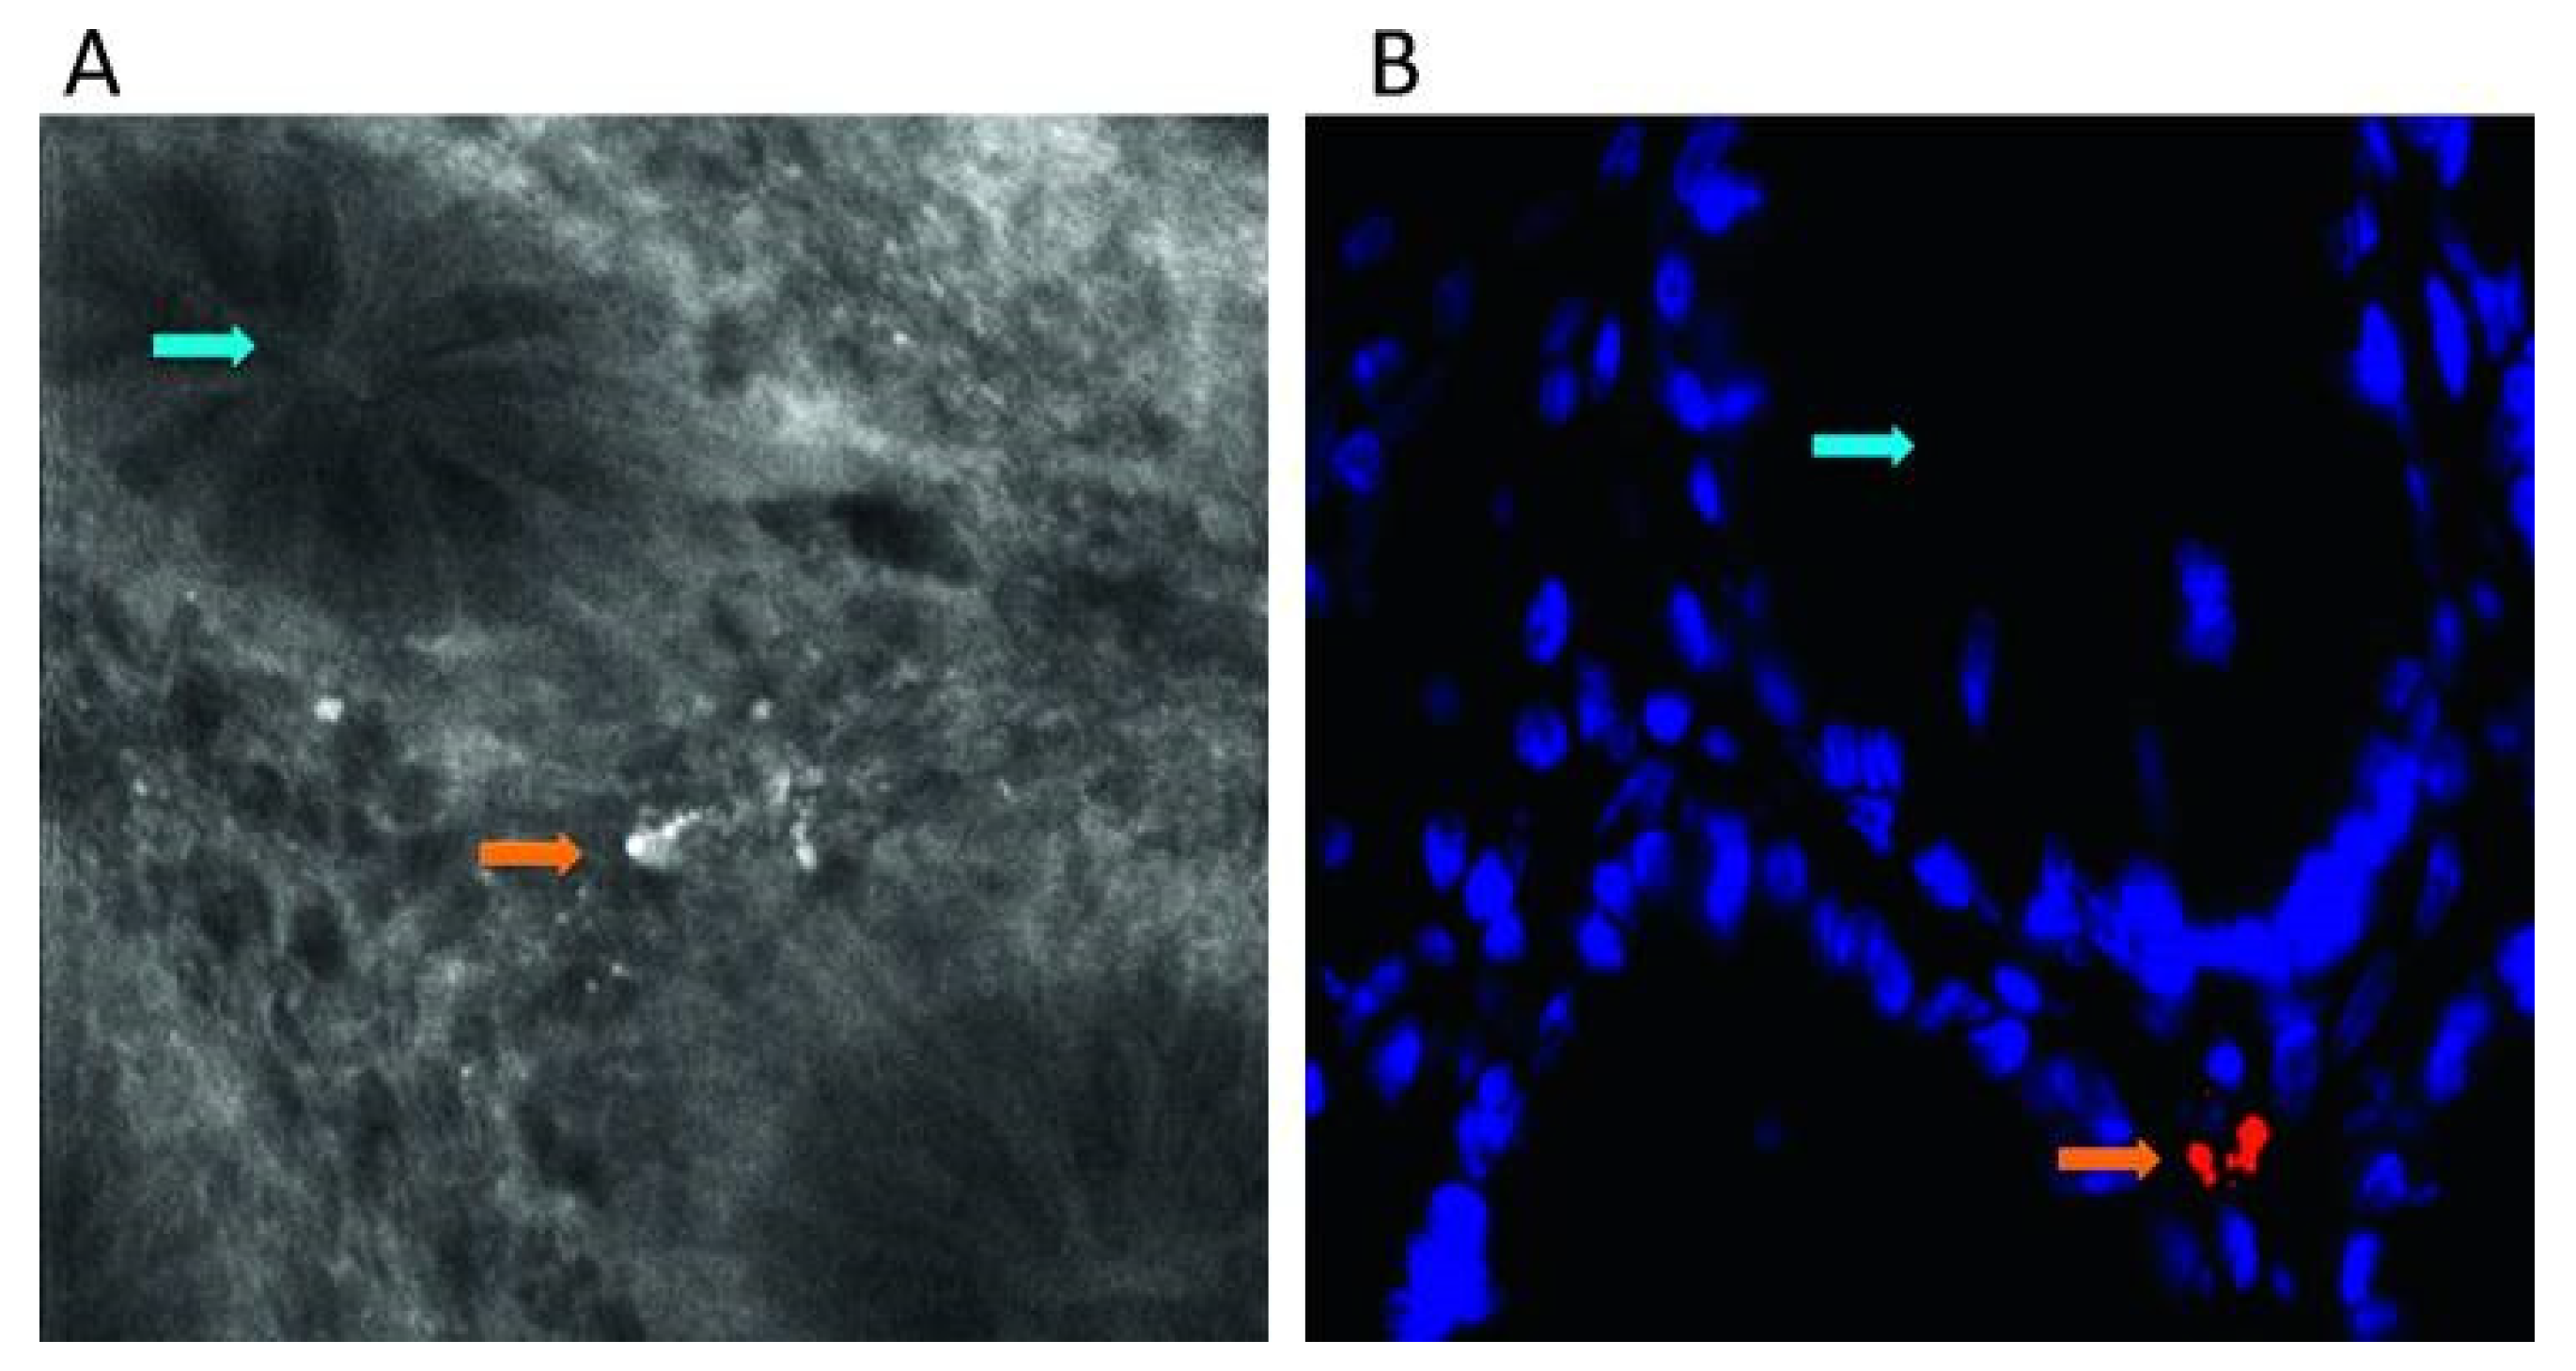
3.1.5. Fluorescence
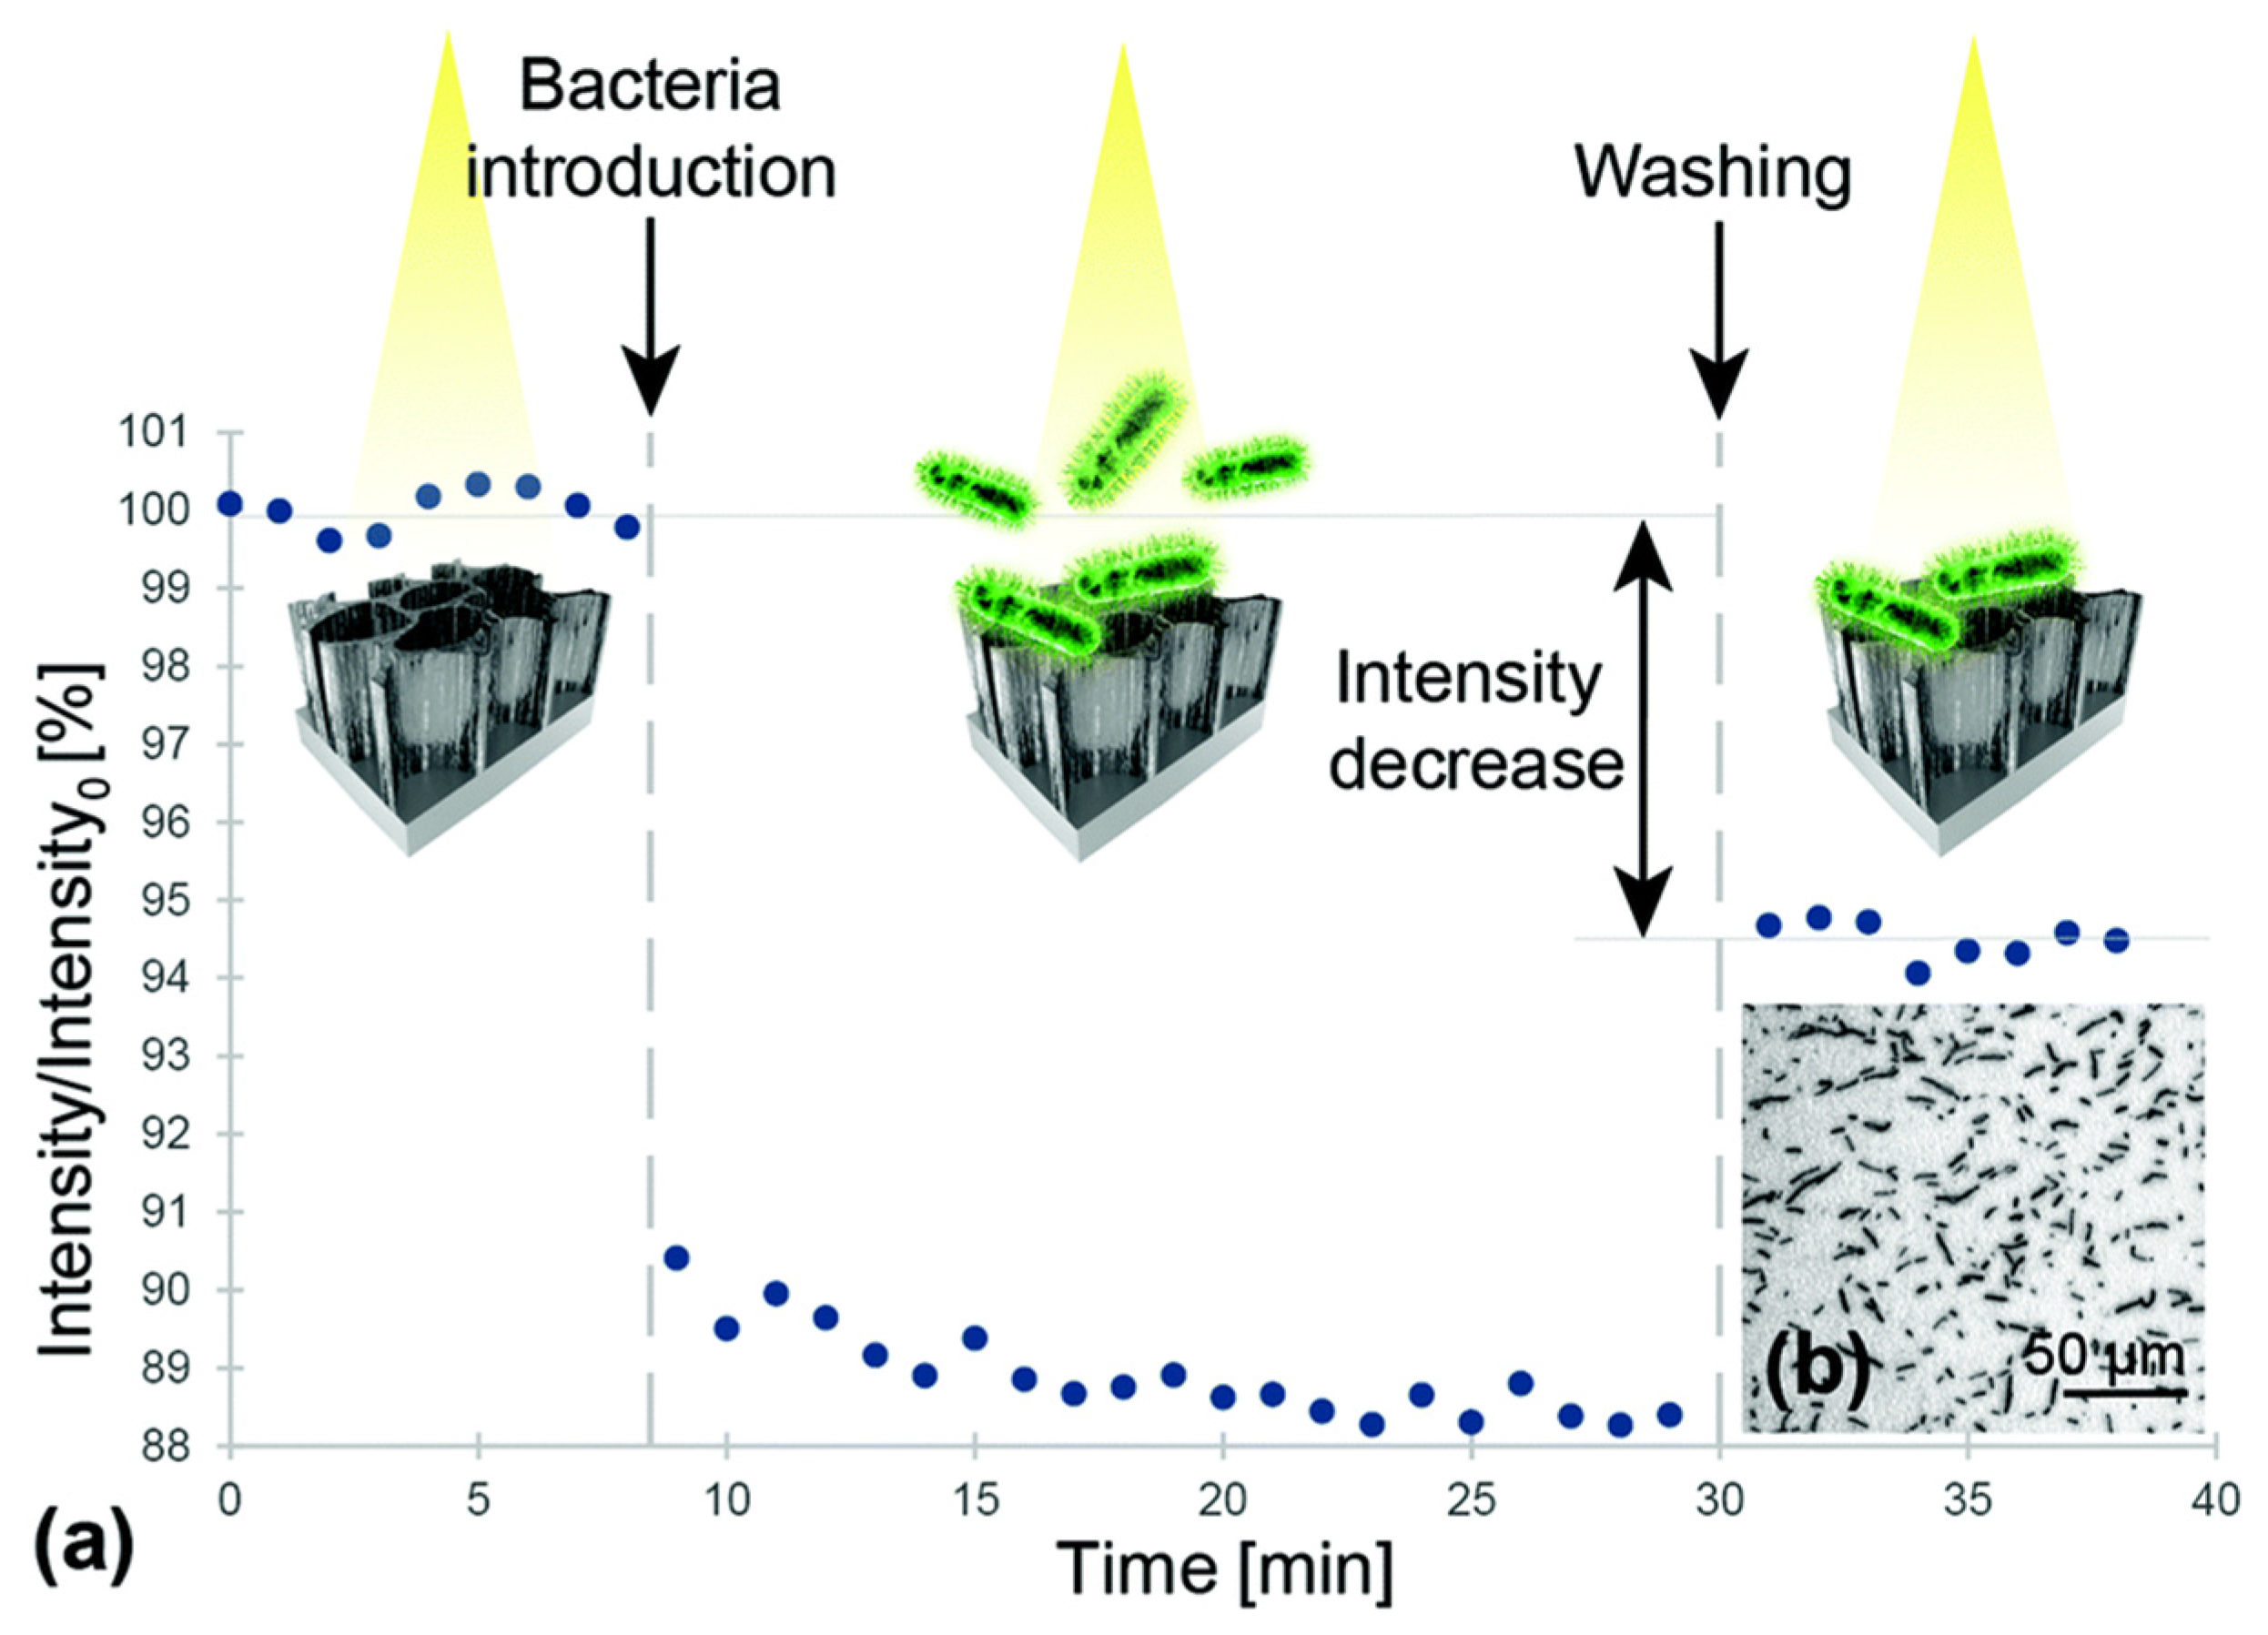
3.2. Optical Coherence Tomography
3.3. Interference
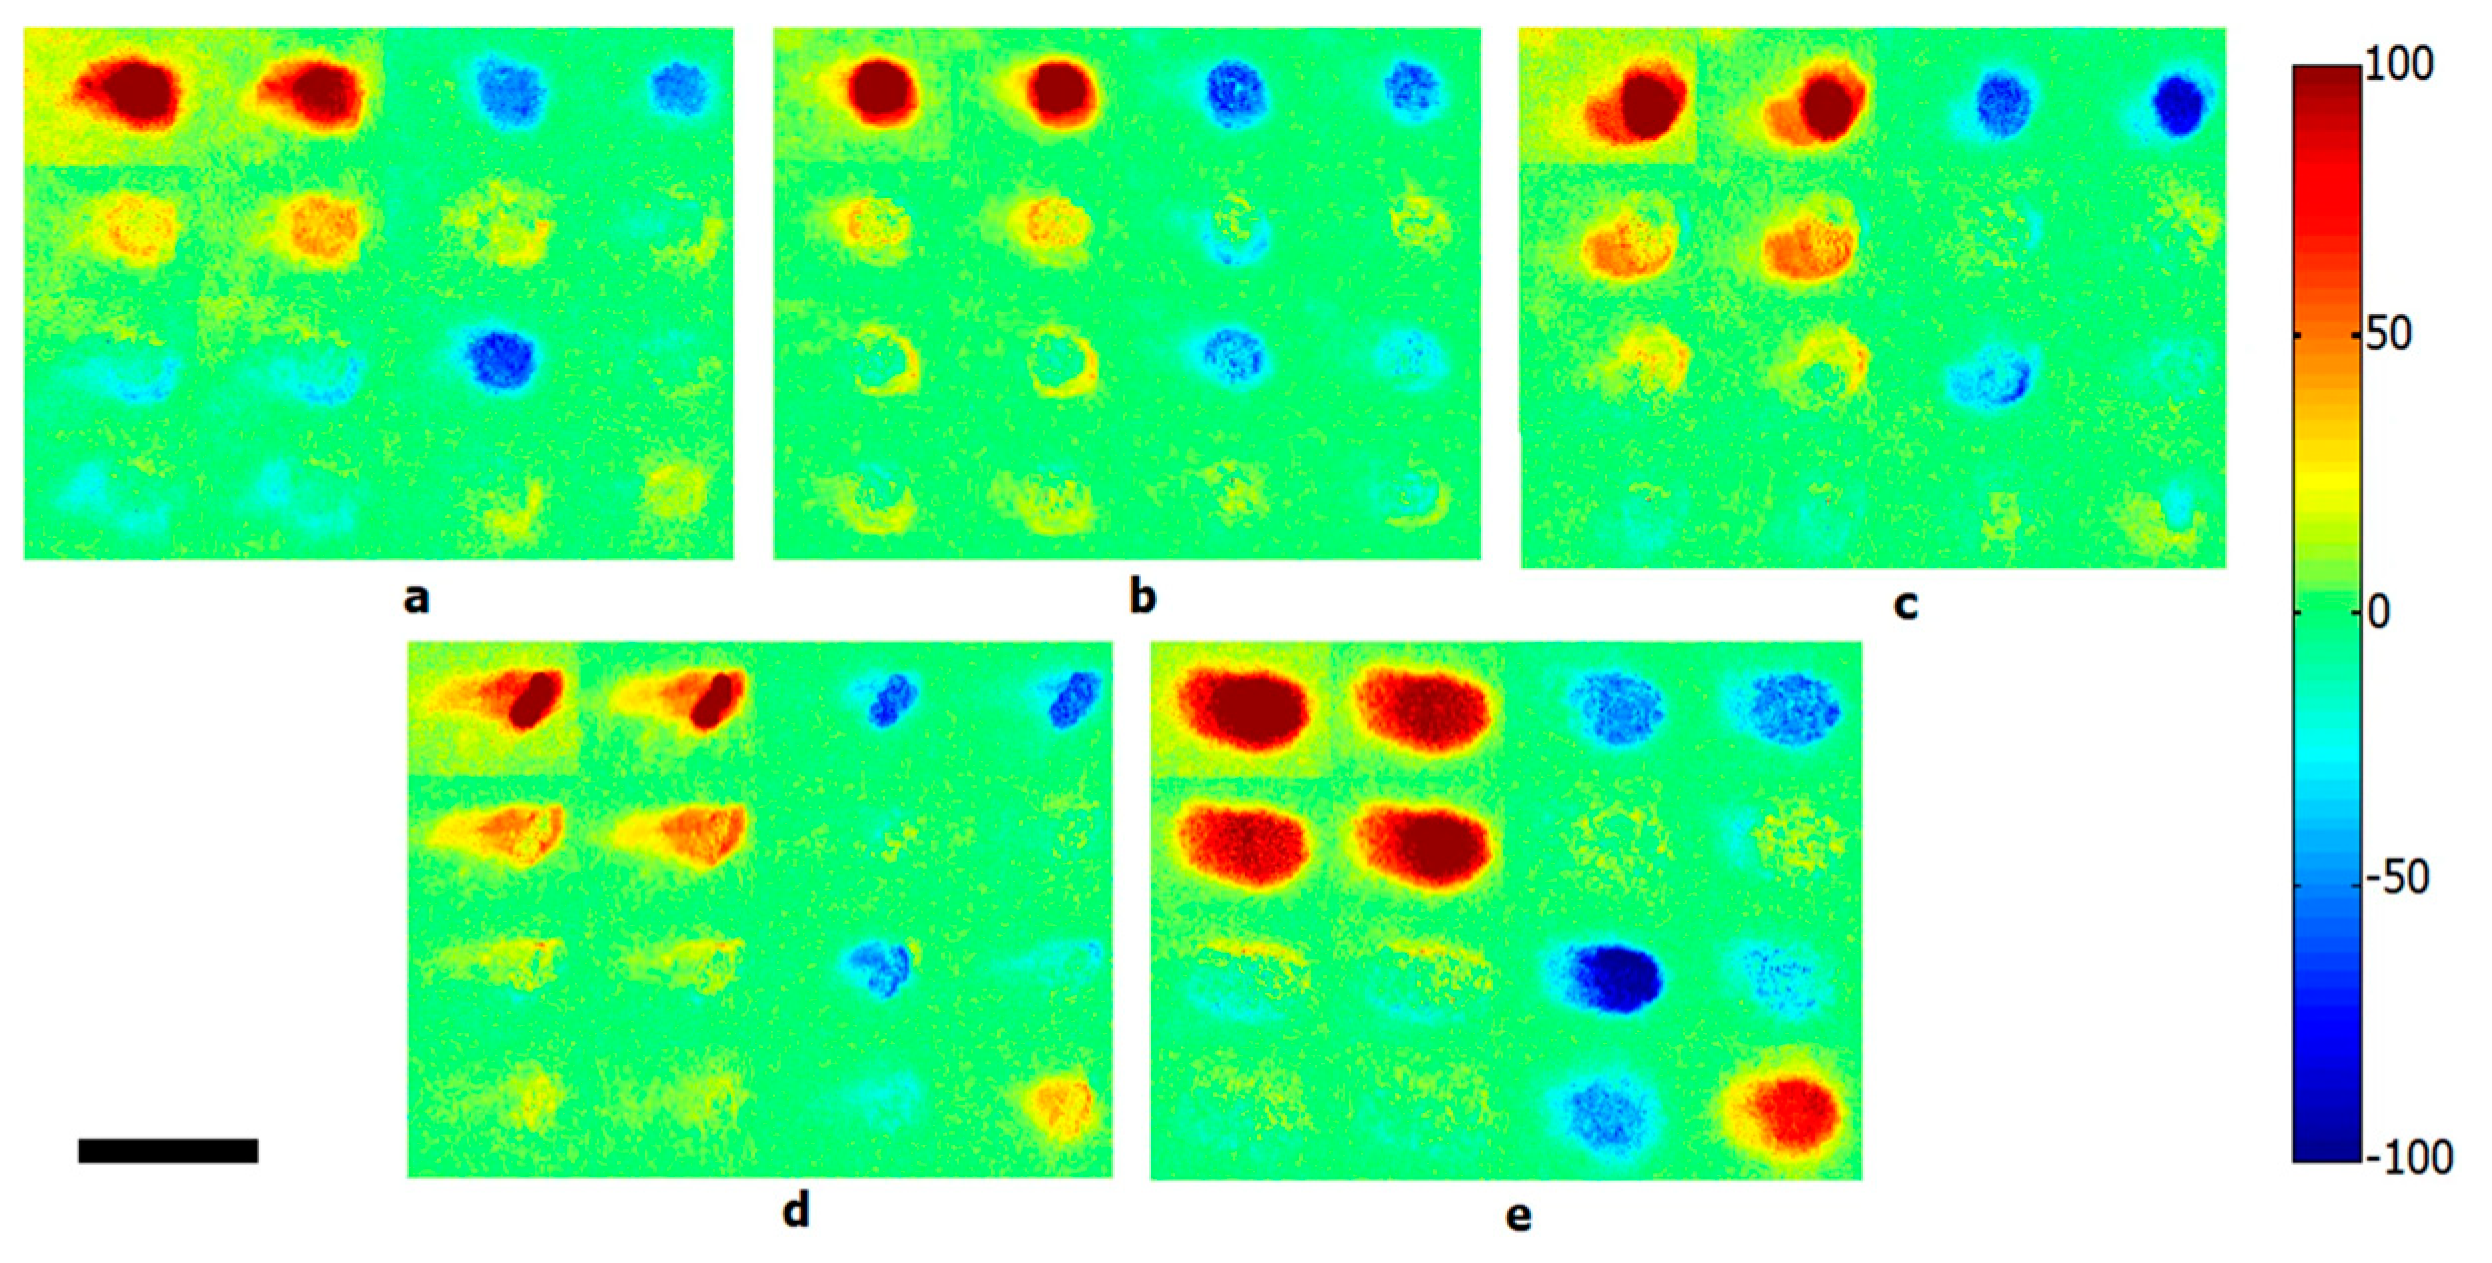
3.4. Polarization
3.5. Laser Scattering
3.6. Speckle Contrast Imaging
4. Comparison of Optical Techniques
5. Future Prospective and Current Clinical Limitations
Author Contributions
Funding
Conflicts of Interest
References
- Smith, K.F.; Goldberg, M.; Rosenthal, S.; Carlson, L.; Chen, J.; Chen, C.; Ramachandran, S. Global rise in human infectious disease outbreaks. J. Royal Soc. Interface 2014, 11, 20140950. [Google Scholar] [CrossRef] [PubMed]
- Centers for Disease Control and Prevention. About Antibiotic Resistance. 2013. Available online: https://www.cdc.gov/drugresistance/about.html (accessed on 3 July 2019).
- Maragakis, L.L.; Perencevich, E.N.; Cosgrove, S.E. Clinical and economic burden of antimicrobial resistance. Expert Rev. Anti-Infect. Ther. 2008, 6, 751–763. [Google Scholar] [CrossRef] [PubMed]
- Grant, S.S.; Hung, D.T. Persistent bacterial infections, antibiotic tolerance, and the oxidative stress response. Virulence 2013, 4, 273–283. [Google Scholar] [CrossRef] [PubMed]
- Sheikhzadeh, E.; CHamsaz, M.; Turner, A.; Jager, E.; Beni, V. Label-free impedimetric biosensor for Salmonella Typhimurium detection based on poly [pyrrole-co-3-carboxyl-pyrrole] copolymer supported aptamer. Biosens. Bioelectr. 2016, 80, 194–200. [Google Scholar] [CrossRef]
- Rayner, M.G.; Zhang, Y.; Gorry, M.C.; Chen, Y.; Post, J.C.; Ehrlich, G.D. Evidence of bacterial metabolic activity in culture-negative otitis media with effusion. JAMA 1998, 279, 296–299. [Google Scholar] [CrossRef]
- Huang, W.E.; Ferguson, A.; Singer, A.C.; Lawson, K.; Thompson, I.P.; Kalin, R.M.; Larkin, M.J.; Bailey, M.J.; Whiteley, A.S. Resolving genetic functions within microbial populations: In situ analyses using rRNA and mRNA stable isotope probing coupled with single-cell Raman-fluorescence in situ hybridization. Appl. Environ. Microbiol. 2009, 75, 234–241. [Google Scholar] [CrossRef]
- Cox, M.M.; Doudna, J.A.; O’Donnell, M. Molecular Biology: Principles and Practice; WH Freeman and Company: New York, NY, USA, 2012. [Google Scholar]
- Huang, W.E.; Li, M.; Jarvis, R.M.; Goodacre, R.; Banwart, S.A. Shining light on the microbial world: The application of Raman microspectroscopy. In Advances in Applied Microbiology; Academic Press: Cambridge, MA, USA, 2010; pp. 153–186. [Google Scholar]
- Sparks, W.B.; Hough, J.; Germer, T.A.; Chen, F.; DasSarma, S.; DasSarma, P.; Robb, F.T.; Manset, N.; Kolokolova, L.; Reid, N. Detection of circular polarization in light scattered from photosynthetic microbes. Proc. Natl. Acad. Sci. USA 2009, 106, 7816–7821. [Google Scholar] [CrossRef]
- Jamal, M.; Ahmad, W.; Andleeb, S.; Jalil, F.; Imran, M.; Nawaz, M.A.; Hussain, T.; Ali, M.; Rafiq, M.; Kamil, M.A. Bacterial biofilm and associated infections. J. Chin. Med. Assoc. 2018, 81, 7–11. [Google Scholar] [CrossRef]
- Römling, U.; Balsalobre, C. Biofilm infections, their resilience to therapy and innovative treatment strategies. J. Intern. Med. 2012, 272, 541–561. [Google Scholar] [CrossRef]
- Sun, F.; Qu, F.; Ling, Y.; Mao, P.; Xia, P.; Chen, H.; Zhou, D. Biofilm-associated infections: Antibiotic resistance and novel therapeutic strategies. Future Microbiol. 2013, 8, 877–886. [Google Scholar] [CrossRef]
- Krakau, M.; Dagöö, B.R.; Hellström, S.; Granath, A. Long-term hearing outcomes after recurrent acute otitis media during early childhood. Acta Oto-Laryngol. 2017, 137, 1238–1243. [Google Scholar] [CrossRef] [PubMed]
- Leibovitz, E.; Greenberg, D.; Piglansky, L.; Raiz, S.; Porat, N.; Press, J.; Leiberman, A.; Dagan, R. Recurrent acute otitis media occurring within one month from completion of antibiotic therapy: Relationship to the original pathogen. Pediatr. Infect. Dis. J. 2003, 22, 209–215. [Google Scholar] [CrossRef] [PubMed]
- Schilder, A.G.; Chonmaitree, T.; Cripps, A.W.; Rosenfeld, R.M.; Casselbrant, M.L.; Haggard, M.P.; Venekamp, R.P. Otitis media. Nat. Rev. Dis. Prim. 2016, 2, 1–18. [Google Scholar] [CrossRef]
- Lenton, P.; Rudney, J.; Chen, R.; Fok, A.; Aparicio, C.; Jones, R.S. Imaging in vivo secondary caries and ex vivo dental biofilms using cross-polarization optical coherence tomography. Dent. Mater. 2012, 28, 792–800. [Google Scholar] [CrossRef] [PubMed]
- Larsen, T.; Fiehn, N.E. Dental biofilm infections–An update. Apmis 2017, 125, 376–384. [Google Scholar] [CrossRef] [PubMed]
- Suh, J.D.; Cohen, N.A.; Palmer, J.N. Biofilms in chronic rhinosinusitis. Curr. Opin. Otolaryngol. Head Neck Surg. 2010, 18, 27–31. [Google Scholar] [CrossRef] [PubMed]
- Al-Mazrou, K.A.; Al-Khattaf, A.S. Adherent biofilms in adenotonsillar diseases in children. Arch. Otolaryngol. Head Neck Surg. 2008, 134, 20–23. [Google Scholar] [CrossRef][Green Version]
- Morris, D.P. Bacterial biofilm in upper respiratory tract infections. Curr. Infect. Dis. Rep. 2007, 9, 186–192. [Google Scholar] [CrossRef]
- Maurice, N.M.; Bedi, B.; Sadikot, R.T. Pseudomonas aeruginosa biofilms: Host response and clinical implications in lung infections. Am. J. Respir. Cell Mol. Biol. 2018, 58, 428–439. [Google Scholar] [CrossRef]
- Høiby, N.; Ciofu, O.; Bjarnsholt, T. Pseudomonas aeruginosa biofilms in cystic fibrosis. Future Microbiol. 2010, 5, 1663–1674. [Google Scholar] [CrossRef]
- Malic, S.; Hill, K.E.; Hayes, A.; Percival, S.L.; Thomas, D.W.; Williams, D.W. Detection and identification of specific bacteria in wound biofilms using peptide nucleic acid fluorescent in situ hybridization (PNA FISH). Microbiol. 2009, 155, 2603–2611. [Google Scholar] [CrossRef]
- Zhao, G.; Usui, M.L.; Lippman, S.I.; James, G.A.; Stewart, P.S.; Fleckman, P.; Olerud, J.E. Biofilms and inflammation in chronic wounds. Adv. Wound Care 2013, 2, 389–399. [Google Scholar] [CrossRef]
- von Rosenvinge, E.C.; O’May, G.A.; Macfarlane, S.; Macfarlane, G.T.; Shirtliff, M.E. Microbial biofilms and gastrointestinal diseases. Pathog. Dis. 2013, 67, 25–38. [Google Scholar] [CrossRef]
- Maquelin, K.; Kirschner, C.; Choo-Smith, L.-P.; Ngo-Thi, N.; Van Vreeswijk, T.; Stämmler, M.; Endtz, H.; Bruining, H.; Naumann, D.; Puppels, G. Prospective study of the performance of vibrational spectroscopies for rapid identification of bacterial and fungal pathogens recovered from blood cultures. J. Clin. Microbiol. 2003, 41, 324–329. [Google Scholar] [CrossRef]
- Movasaghi, Z.; Rehman, S.; Rehman, I.U. Raman spectroscopy of biological tissues. Appl. Spectrosc. Rev. 2007, 42, 493–541. [Google Scholar] [CrossRef]
- Harz, M.; Rösch, P.; Popp, J. Vibrational spectroscopy—A powerful tool for the rapid identification of microbial cells at the single-cell level. Cytom. Part A J. Int. Soc. Anal. Cytol. 2009, 75, 104–113. [Google Scholar] [CrossRef]
- Maquelin, K.; Choo-Smith, L.P.; Kirschner, C.; Ngo-Thi, N.; Naumann, D.; Puppels, G. Vibrational spectroscopic studies of microorganisms. Handb. Vib. Spectrosc. 2006. [Google Scholar]
- Harrison, J.P.; Berry, D. Vibrational spectroscopy for imaging single microbial cells in complex biological samples. Front. Microbiol. 2017, 8, 675. [Google Scholar] [CrossRef]
- Smith, B.C. Fundamentals of Fourier Transform Infrared Spectroscopy; CRC Press: Boca Raton, FL, USA, 2011. [Google Scholar]
- Petibois, C.; Desbat, B. Clinical application of FTIR imaging: New reasons for hope. Trends Biotechnol. 2010, 28, 495–500. [Google Scholar] [CrossRef]
- Dorling, K.M.; Baker, M.J. Rapid FTIR chemical imaging: Highlighting FPA detectors. Trends Biotechnol. 2013, 31, 437–438. [Google Scholar] [CrossRef]
- Humbert, F.; Quilès, F. In-situ study of early stages of biofilm formation under different environmental stresses by ATR-FTIR spectroscopy. Sci. Microb. Pathog. Commun. Curr. Res. Technol. Adv. 2011, 2, 889–895. [Google Scholar]
- Oberreuter, H.; Seiler, H.; Scherer, S. Identification of coryneform bacteria and related taxa by Fourier-transform infrared (FT-IR) spectroscopy. Int. J. Syst. Evol. Microbiol. 2002, 52, 91–100. [Google Scholar] [CrossRef]
- Hassan, M.; Gonzalez, E.; Hitchins, V.; Ilev, I. Detecting bacteria contamination on medical device surfaces using an integrated fiber-optic mid-infrared spectroscopy sensing method. Sens. Actuators B Chem. 2016, 231, 646–654. [Google Scholar] [CrossRef]
- Naumann, D.; Fijala, V.; Labischinski, H.; Giesbrecht, P. The rapid differentiation and identification of pathogenic bacteria using Fourier transform infrared spectroscopic and multivariate statistical analysis. J. Mol. Struct. 1988, 174, 165–170. [Google Scholar] [CrossRef]
- Martak, D.; Valot, B.; Sauget, M.; Cholley, P.; Thouverez, M.; Bertrand, X.; Hocquet, D. Fourier-transform infrared spectroscopy can quickly type gram-negative bacilli responsible for hospital outbreaks. Front. Microbiol. 2019, 10, 1440. [Google Scholar] [CrossRef]
- Bastert, J.; Korting, H.; Traenkle, P.; Schmalreck, A. Identification of dermatophytes by Fourier transform infrared spectroscopy (FT-IR). Mycoses 1999, 42, 525–528. [Google Scholar] [CrossRef]
- Guibet, F.; Amiel, C.; Cadot, P.; Cordevant, C.; Desmonts, M.; Lange, M.; Marecat, A.; Travert, J.; Denis, C.; Mariey, L. Discrimination and classification of Enterococci by Fourier transform infrared (FT-IR) spectroscopy. Vib. Spectrosc. 2003, 33, 133–142. [Google Scholar] [CrossRef]
- Helm, D.; Labischinski, H.; Schallehn, G.; Naumann, D. Classification and identification of bacteria by Fourier-transform infrared spectroscopy. Microbiology 1991, 137, 69–79. [Google Scholar] [CrossRef]
- Haag, H.; Gremlich, H.-U.; Bergmann, R.; Sanglier, J.-J. Characterization and identification of actinomycetes by FT-IR spectroscopy. J. Microbiol. Methods 1996, 27, 157–163. [Google Scholar] [CrossRef]
- Holt, C.; Hirst, D.; Sutherland, A.; MacDonald, F. Discrimination of species in the genus Listeria by Fourier transform infrared spectroscopy and canonical variate analysis. Appl. Environ. Microbiol. 1995, 61, 377–378. [Google Scholar] [CrossRef]
- Lefier, D.; Hirst, D.; Holt, C.; Williams, A.G. Effect of sampling procedure and strain variation in Listeria monocytogenes on the discrimination of species in the genus Listeria by Fourier transform infrared spectroscopy and canonical variates analysis. FEMS Microbiol. Lett. 1997, 147, 45–50. [Google Scholar] [CrossRef] [PubMed]
- Udelhoven, T.; Naumann, D.; Schmitt, J. Development of a Hierarchical Classification System with Artificial Neural Networks and FT-IR Spectra for the Identification of Bacteria. Appl. Spectrosc. 2000, 54, 1471–1479. [Google Scholar] [CrossRef]
- Kirschner, C.; Maquelin, K.; Pina, P.; Thi, N.N.; Choo-Smith, L.-P.; Sockalingum, G.; Sandt, C.; Ami, D.; Orsini, F.; Doglia, S. Classification and identification of enterococci: A comparative phenotypic, genotypic, and vibrational spectroscopic study. J. Clin. Microbiol. 2001, 39, 1763–1770. [Google Scholar] [CrossRef] [PubMed]
- Bağcıoğlu, M.; Fricker, M.; Johler, S.; Ehling-Schulz, M. Detection and identification of Bacillus cereus, Bacillus cytotoxicus, Bacillus thuringiensis, Bacillus mycoides and Bacillus weihenstephanensis via machine learning based FTIR Spectroscopy. Front. Microbiol. 2019, 10, 902. [Google Scholar] [CrossRef]
- Vogt, S.; Löffler, K.; Dinkelacker, A.G.; Bader, B.; Autenrieth, I.; Peter, S.M.; Liese, J. Fourier-transform infrared (FTIR) spectroscopy for typing of clinical Enterobacter cloacae complex isolates. Front. Microbiol. 2019, 10, 2582. [Google Scholar] [CrossRef]
- Bouhedja, W.; Sockalingum, G.; Pina, P.; Allouch, P.; Bloy, C.; Labia, R.; Millot, J.; Manfait, M. ATR-FTIR spectroscopic investigation of E. coli transconjugants β-lactams-resistance phenotype. FEBS Lett. 1997, 412, 39–42. [Google Scholar] [CrossRef]
- Lechowicz, L.; Urbaniak, M.; Adamus-Białek, W.; Kaca, W. The use of infrared spectroscopy and artificial neural networks for detection of uropathogenic Escherichia coli strains’ susceptibility to cephalothin. Acta Biochim. Pol. 2013, 60, 713–718. [Google Scholar] [CrossRef]
- Amiali, N.M.; Golding, G.R.; Sedman, J.; Simor, A.E.; Ismail, A.A. Rapid identification of community-associated methicillin-resistant Staphylococcus aureus by Fourier transform infrared spectroscopy. Diagn. Microbiol. Infect. Dis. 2011, 70, 157–166. [Google Scholar] [CrossRef]
- Sharaha, U.; Rodriguez-Diaz, E.; Sagi, O.; Riesenberg, K.; Salman, A.; Bigio, I.J.; Huleihel, M. Fast and reliable determination of Escherichia coli susceptibility to antibiotics: Infrared microscopy in tandem with machine learning algorithms. J. Biophotonics 2019, 12, e201800478. [Google Scholar] [CrossRef]
- Goodacre, R.; Burton, R.; Kaderbhai, N.; Woodward, A.M.; Kell, D.B.; Rooney, P.J. Rapid identification of urinary tract infection bacteria using hyperspectral whole-organism fingerprinting and artificial neural networks. Microbiology 1998, 144, 1157–1170. [Google Scholar] [CrossRef]
- Bosch, A.; Miñán, A.; Vescina, C.; Degrossi, J.; Gatti, B.; Montanaro, P.; Messina, M.; Franco, M.; Vay, C.; Schmitt, J. Fourier transform infrared spectroscopy for rapid identification of nonfermenting gram-negative bacteria isolated from sputum samples from cystic fibrosis patients. J. Clin. Microbiol. 2008, 46, 2535–2546. [Google Scholar] [CrossRef] [PubMed]
- Coutinho, C.P.; Sá-Correia, I.; Lopes, J.A. Use of Fourier transform infrared spectroscopy and chemometrics to discriminate clinical isolates of bacteria of the Burkholderia cepacia complex from different species and ribopatterns. Anal. Bioanal. Chem. 2009, 394, 2161–2171. [Google Scholar] [CrossRef] [PubMed]
- Nivens, D.E.; Chambers, J.Q.; Anderson, T.R.; Tunlid, A.; Smit, J.; White, D.C. Monitoring microbiol adhesion and biofilm formation by attenuated total reflection/Fourier transform infrared spectroscopy. J. Microbiol. Methods 1993, 17, 199–213. [Google Scholar] [CrossRef]
- Donlan, R.; Piede, J.; Heyes, C.; Sanii, L.; Murga, R.; Edmonds, P.; El-Sayed, I.; El-Sayed, M. Model system for growing and quantifying Streptococcus pneumoniae biofilms in situ and in real time. Appl. Environ. Microbiol. 2004, 70, 4980–4988. [Google Scholar] [CrossRef] [PubMed]
- Sivakesava, S.; Irudayaraj, J.; Debroy, C. Differentiation of microorganisms by FTIR-ATR and NIR spectroscopy. Trans. ASAE 2004, 47, 951–957. [Google Scholar] [CrossRef]
- Sousa, C.; Silva, L.; Grosso, F.; Lopes, J.; Peixe, L. Development of a FTIR-ATR based model for typing clinically relevant Acinetobacter baumannii clones belonging to ST98, ST103, ST208 and ST218. J. Photochem. Photobiol. B Biol. 2014, 133, 108–114. [Google Scholar] [CrossRef] [PubMed]
- Mossoba, M.M.; Al-Khaldi, S.F.; Kirkwood, J.; Fry, F.S.; Sedman, J.; Ismail, A.A. Printing microarrays of bacteria for identification by infrared microspectroscopy. Vib. Spectrosc. 2005, 38, 229–235. [Google Scholar] [CrossRef]
- Kirkwood, J.; Al-Khaldi, S.F.; Mossoba, M.M.; Sedman, J.; Ismail, A.A. Fourier transform infrared bacteria identification with the use of a focal-plane-array detector and microarray printing. Appl. Spectrosc. 2004, 58, 1364–1368. [Google Scholar] [CrossRef]
- Erukhimovitch, V.; Pavlov, V.; Talyshinsky, M.; Souprun, Y.; Huleihel, M. FTIR microscopy as a method for identification of bacterial and fungal infections. J. Pharm. Biomed. Anal. 2005, 37, 1105–1108. [Google Scholar] [CrossRef]
- Loutherback, K.; Chen, L.; Holman, H.-Y.N. Open-channel microfluidic membrane device for long-term FT-IR spectromicroscopy of live adherent cells. Anal. Chem. 2015, 87, 4601–4606. [Google Scholar] [CrossRef]
- Lasch, P.; Stämmler, M.; Zhang, M.; Baranska, M.; Bosch, A.; Majzner, K. FT-IR hyperspectral imaging and artificial neural network analysis for identification of pathogenic bacteria. Anal. Chem. 2018, 90, 8896–8904. [Google Scholar] [CrossRef] [PubMed]
- Rogalski, A. History of infrared detectors. Opto-Electron. Rev. 2012, 20, 279–308. [Google Scholar] [CrossRef]
- Hu, J.; Bohn, P.W. Optical biosensing of bacteria and bacterial communities. J. Anal. Test. 2017, 1, 4. [Google Scholar] [CrossRef] [PubMed][Green Version]
- Rebrošová, K.; Šiler, M.; Samek, O.; Růžička, F.; Bernatová, S.; Holá, V.; Ježek, J.; Zemánek, P.; Sokolová, J.; Petráš, P. Rapid identification of staphylococci by Raman spectroscopy. Sci. Rep. 2017, 7, 14846. [Google Scholar] [CrossRef]
- Willemse-Erix, D.F.; Scholtes-Timmerman, M.J.; Jachtenberg, J.-W.; van Leeuwen, W.B.; Horst-Kreft, D.; Schut, T.C.B.; Deurenberg, R.H.; Puppels, G.J.; van Belkum, A.; Vos, M.C. Optical fingerprinting in bacterial epidemiology: Raman spectroscopy as a real-time typing method. J. Clin. Microbiol. 2009, 47, 652–659. [Google Scholar] [CrossRef]
- Almarashi, J.F.; Kapel, N.; Wilkinson, T.S.; Telle, H.H. Raman spectroscopy of bacterial species and strains cultivated under reproducible conditions. Spectrosc. Int. J. 2012, 27, 361–365. [Google Scholar] [CrossRef]
- Ayala, O.; Wakeman, C.; Pence, I.; O’Brien, C.; Werkhaven, J.; Skaar, E.; Mahadevan-Jansen, A. Characterization of bacteria causing acute otitis media using Raman microspectroscopy. Anal. Methods 2017, 9, 1864–1871. [Google Scholar] [CrossRef]
- Kloß, S.; Lorenz, B.; Dees, S.; Labugger, I.; Rösch, P.; Popp, J. Destruction-free procedure for the isolation of bacteria from sputum samples for Raman spectroscopic analysis. Anal. Bioanal. Chem. 2015, 407, 8333–8341. [Google Scholar] [CrossRef]
- Kloß, S.; Kampe, B.; Sachse, S.; Rösch, P.; Straube, E.; Pfister, W.; Kiehntopf, M.; Popp, J.R. Culture independent Raman spectroscopic identification of urinary tract infection pathogens: A proof of principle study. Anal. Chem. 2013, 85, 9610–9616. [Google Scholar] [CrossRef]
- Harz, M.; Kiehntopf, M.; Stöckel, S.; Rösch, P.; Straube, E.; Deufel, T.; Popp, J. Direct analysis of clinical relevant single bacterial cells from cerebrospinal fluid during bacterial meningitis by means of micro-Raman spectroscopy. J. Biophotonics 2009, 2, 70–80. [Google Scholar] [CrossRef]
- Rusciano, G.; Capriglione, P.; Pesce, G.; Abete, P.; Carnovale, V.; Sasso, A. Raman spectroscopy as a new tool for early detection of bacteria in patients with cystic fibrosis. Laser Phys. Lett. 2013, 10, 075603. [Google Scholar] [CrossRef]
- Howell, S.C.; Haffajee, A.D.; Pagonis, T.C.; Guze, K.A. Laser raman spectroscopy as a potential chair-side microbiological diagnostic device. J. Endod. 2011, 37, 968–972. [Google Scholar] [CrossRef] [PubMed]
- Mello, C.; Ribeiro, D.; Novaes, F.; Poppi, R.J. Rapid differentiation among bacteria that cause gastroenteritis by use of low-resolution Raman spectroscopy and PLS discriminant analysis. Anal. Bioanal. Chem. 2005, 383, 701–706. [Google Scholar] [CrossRef] [PubMed]
- de Siqueira Oliveira, F.S.; Giana, H.E.; Silveira, L. Discrimination of selected species of pathogenic bacteria using near-infrared Raman spectroscopy and principal components analysis. J. Biomed. Opt. 2012, 17, 107004. [Google Scholar] [CrossRef]
- Schmilovitch, Z.; Mizrach, A.; Alchanatis, V.; Kritzman, G.; Korotic, R.; Irudayaraj, J.; Debroy, C. Detection of bacteria with low-resolution Raman spectroscopy. Trans. ASAE 2005, 48, 1843–1850. [Google Scholar] [CrossRef]
- Ho, C.-S.; Jean, N.; Hogan, C.A.; Blackmon, L.; Jeffrey, S.S.; Holodniy, M.; Banaei, N.; Saleh, A.A.; Ermon, S.; Dionne, J. Rapid identification of pathogenic bacteria using Raman spectroscopy and deep learning. Nat. Commun. 2019, 10, 1–8. [Google Scholar] [CrossRef] [PubMed]
- Kerr, L.T.; Byrne, H.J.; Hennelly, B.M. Optimal choice of sample substrate and laser wavelength for Raman spectroscopic analysis of biological specimen. Anal. Methods 2015, 7, 5041–5052. [Google Scholar] [CrossRef]
- Berger, A.J.; Zhu, Q. Identification of oral bacteria by Raman microspectroscopy. J. Mod. Opt. 2003, 50, 2375–2380. [Google Scholar] [CrossRef]
- Maquelin, K.; Choo-Smith, L.-P.; van Vreeswijk, T.; Endtz, H.P.; Smith, B.; Bennett, R.; Bruining, H.A.; Puppels, G.J. Raman spectroscopic method for identification of clinically relevant microorganisms growing on solid culture medium. Anal. Chem. 2000, 72, 12–19. [Google Scholar] [CrossRef]
- Ayala, O.D.; Doster, R.S.; Manning, S.D.; O’Brien, C.M.; Aronoff, D.M.; Gaddy, J.A.; Mahadevan-Jansen, A. Raman microspectroscopy differentiates perinatal pathogens on ex vivo infected human fetal membrane tissues. J. Biophotonics 2019, 12, e201800449. [Google Scholar] [CrossRef]
- Schröder, U.-C.; Bokeloh, F.; O’Sullivan, M.; Glaser, U.; Wolf, K.; Pfister, W.; Popp, J.; Ducrée, J.; Neugebauer, U. Rapid, culture-independent, optical diagnostics of centrifugally captured bacteria from urine samples. Biomicrofluidics 2015, 9, 044118. [Google Scholar] [CrossRef] [PubMed]
- Schröder, U.-C.; Ramoji, A.; Glaser, U.; Sachse, S.; Leiterer, C.; Csaki, A.; Hübner, U.; Fritzsche, W.; Pfister, W.; Bauer, M. Combined dielectrophoresis–Raman setup for the classification of pathogens recovered from the urinary tract. Anal. Chem. 2013, 85, 10717–10724. [Google Scholar] [CrossRef] [PubMed]
- Ayala, O.D.; Wakeman, C.A.; Pence, I.J.; Gaddy, J.A.; Slaughter, J.C.; Skaar, E.P.; Mahadevan-Jansen, A. Drug-resistant Staphylococcus aureus strains reveal distinct biochemical features with Raman microspectroscopy. ACS Infect. Dis. 2018, 4, 1197–1210. [Google Scholar] [CrossRef] [PubMed]
- López-Díez, E.C.; Goodacre, R. Characterization of microorganisms using UV resonance Raman spectroscopy and chemometrics. Anal. Chem. 2004, 76, 585–591. [Google Scholar] [CrossRef]
- Jarvis, R.M.; Goodacre, R. Ultra-violet resonance Raman spectroscopy for the rapid discrimination of urinary tract infection bacteria. FEMS Microbiol. Lett. 2004, 232, 127–132. [Google Scholar] [CrossRef][Green Version]
- Neugebauer, U.; Schmid, U.; Baumann, K.; Holzgrabe, U.; Ziebuhr, W.; Kozitskaya, S.; Kiefer, W.; Schmitt, M.; Popp, J. Characterization of bacterial growth and the influence of antibiotics by means of UV resonance Raman spectroscopy. Biopolym. Orig. Res. Biomol. 2006, 82, 306–311. [Google Scholar] [CrossRef]
- Efrima, S.; Zeiri, L. Understanding SERS of bacteria. J. Raman Spectrosc. Int. J. Orig. Work All Asp. Raman Spectrosc. Incl. High. Order Process. Also Brillouin Rayleigh Scatt. 2009, 40, 277–288. [Google Scholar] [CrossRef]
- Zeiri, L.; Bronk, B.; Shabtai, Y.; Czege, J.; Efrima, S. Silver metal induced surface enhanced Raman of bacteria. Colloids Surf. A Physicochem. Eng. Asp. 2002, 208, 357–362. [Google Scholar] [CrossRef]
- Efrima, S.; Bronk, B. Silver colloids impregnating or coating bacteria. J. Phys. Chem. B 1998, 102, 5947–5950. [Google Scholar] [CrossRef]
- Jarvis, R.M.; Law, N.; Shadi, I.T.; O’Brien, P.; Lloyd, J.R.; Goodacre, R. Surface-enhanced Raman scattering from intracellular and extracellular bacterial locations. Anal. Chem. 2008, 80, 6741–6746. [Google Scholar] [CrossRef]
- Wang, Y.; Lee, K.; Irudayaraj, J. Silver nanosphere SERS probes for sensitive identification of pathogens. J. Phys. Chem. C 2010, 114, 16122–16128. [Google Scholar] [CrossRef]
- Kahraman, M.; Yazici, M.M.; Şahin, F.; Bayrak, Ö.F.; Çulha, M. Reproducible surface-enhanced Raman scattering spectra of bacteria on aggregated silver nanoparticles. Appl. Spectrosc. 2007, 61, 479–485. [Google Scholar] [CrossRef] [PubMed]
- Premasiri, W.; Chen, Y.; Williamson, P.; Bandarage, D.; Pyles, C.; Ziegler, L. Rapid urinary tract infection diagnostics by surface-enhanced Raman spectroscopy (SERS): Identification and antibiotic susceptibilities. Anal. Bioanal. Chem. 2017, 409, 3043–3054. [Google Scholar] [CrossRef] [PubMed]
- Kamińska, A.; Witkowska, E.; Kowalska, A.; Skoczyńska, A.; Ronkiewicz, P.; Szymborski, T.; Waluk, J. Rapid detection and identification of bacterial meningitis pathogens in ex vivo clinical samples by SERS method and principal component analysis. Anal. Methods 2016, 8, 4521–4529. [Google Scholar] [CrossRef]
- Liu, T.-Y.; Tsai, K.-T.; Wang, H.-H.; Chen, Y.; Chen, Y.-H.; Chao, Y.-C.; Chang, H.-H.; Lin, C.-H.; Wang, J.-K.; Wang, Y.-L. Functionalized arrays of Raman-enhancing nanoparticles for capture and culture-free analysis of bacteria in human blood. Nat. Commun. 2011, 2, 1–8. [Google Scholar] [CrossRef] [PubMed]
- Boardman, A.K.; Wong, W.S.; Premasiri, W.R.; Ziegler, L.D.; Lee, J.C.; Miljkovic, M.; Klapperich, C.M.; Sharon, A.; Sauer-Budge, A.F. Rapid detection of bacteria from blood with surface-enhanced Raman spectroscopy. Anal. Chem. 2016, 88, 8026–8035. [Google Scholar] [CrossRef] [PubMed]
- Wang, C.; Wang, J.; Li, M.; Qu, X.; Zhang, K.; Rong, Z.; Xiao, R.; Wang, S. A rapid SERS method for label-free bacteria detection using polyethylenimine-modified Au-coated magnetic microspheres and Au@ Ag nanoparticles. Analyst 2016, 141, 6226–6238. [Google Scholar] [CrossRef]
- Wang, J.; Wu, X.; Wang, C.; Rong, Z.; Ding, H.; Li, H.; Li, S.; Shao, N.; Dong, P.; Xiao, R. Facile synthesis of Au-coated magnetic nanoparticles and their application in bacteria detection via a SERS method. ACS Appl. Mater. Interfaces 2016, 8, 19958–19967. [Google Scholar] [CrossRef]
- Guven, B.; Basaran-Akgul, N.; Temur, E.; Tamer, U.; Boyacı, İ.H. SERS-based sandwich immunoassay using antibody coated magnetic nanoparticles for Escherichia coli enumeration. Analyst 2011, 136, 740–748. [Google Scholar] [CrossRef]
- Fan, Z.; Senapati, D.; Khan, S.A.; Singh, A.K.; Hamme, A.; Yust, B.; Sardar, D.; Ray, P.C. Popcorn-Shaped Magnetic Core–Plasmonic Shell Multifunctional Nanoparticles for the Targeted Magnetic Separation and Enrichment, Label-Free SERS Imaging, and Photothermal Destruction of Multidrug-Resistant Bacteria. Chem. A Eur. J. 2013, 19, 2839–2847. [Google Scholar] [CrossRef]
- Zhang, H.; Ma, X.; Liu, Y.; Duan, N.; Wu, S.; Wang, Z.; Xu, B. Gold nanoparticles enhanced SERS aptasensor for the simultaneous detection of Salmonella typhimurium and Staphylococcus aureus. Biosens. Bioelectron. 2015, 74, 872–877. [Google Scholar] [CrossRef] [PubMed]
- Ravindranath, S.P.; Wang, Y.; Irudayaraj, J. SERS driven cross-platform based multiplex pathogen detection. Sens. Actuators B Chem. 2011, 152, 183–190. [Google Scholar] [CrossRef]
- Nelson, W.; Manoharan, R.; Sperry, J. UV resonance Raman studies of bacteria. Appl. Spectrosc. Rev. 1992, 27, 67–124. [Google Scholar] [CrossRef]
- Wu, Q.; Nelson, W.; Elliot, S.; Sperry, J.; Feld, M.; Dasari, R.; Manoharan, R. Intensities of E. c oli Nucleic Acid Raman Spectra Excited Selectively from Whole Cells with 251-nm Light. Anal. Chem. 2000, 72, 2981–2986. [Google Scholar] [CrossRef] [PubMed]
- Jarvis, R.M.; Goodacre, R. Discrimination of bacteria using surface-enhanced Raman spectroscopy. Anal. Chem. 2004, 76, 40–47. [Google Scholar] [CrossRef] [PubMed]
- Vo-Dinh, T.; Liu, Y.; Fales, A.M.; Ngo, H.; Wang, H.N.; Register, J.K.; Yuan, H.; Norton, S.J.; Griffin, G.D. SERS nanosensors and nanoreporters: Golden opportunities in biomedical applications. Wiley Interdiscip. Rev. Nanomed. Nanobiotechnol. 2015, 7, 17–33. [Google Scholar] [CrossRef] [PubMed]
- Vo-Dinh, T.; Stokes, D.L. Surface-enhanced Raman scattering (SERS) for biomedical diagnostics. In Biomedical Photonics Handbook; CRC Press: Boca Raton, FL, USA, 2003; pp. 1653–1692. [Google Scholar]
- Zeiri, L.; Bronk, B.; Shabtai, Y.; Eichler, J.; Efrima, S. Surface-enhanced Raman spectroscopy as a tool for probing specific biochemical components in bacteria. Appl. Spectrosc. 2004, 58, 33–40. [Google Scholar] [CrossRef]
- Jarvis, R.M.; Brooker, A.; Goodacre, R. Surface-enhanced Raman scattering for the rapid discrimination of bacteria. Faraday Discuss. 2006, 132, 281–292. [Google Scholar] [CrossRef]
- Kahraman, M.; Zamaleeva, A.I.; Fakhrullin, R.F.; Culha, M. Layer-by-layer coating of bacteria with noble metal nanoparticles for surface-enhanced Raman scattering. Anal. Bioanal. Chem. 2009, 395, 2559. [Google Scholar] [CrossRef]
- Szymborski, T.; Witkowska, E.; Adamkiewicz, W.; Waluk, J.; Kamińska, A. Electrospun polymer mat as a SERS platform for the immobilization and detection of bacteria from fluids. Analyst 2014, 139, 5061–5064. [Google Scholar] [CrossRef]
- Li, X.; Xu, W.; Zhang, J.; Jia, H.; Yang, B.; Zhao, B.; Li, B.; Ozaki, Y. Self-assembled metal colloid films: Two approaches for preparing new SERS active substrates. Langmuir 2004, 20, 1298–1304. [Google Scholar] [CrossRef] [PubMed]
- Yang, L.; Li, P.; Liu, J. Progress in multifunctional surface-enhanced Raman scattering substrate for detection. RSC Adv. 2014, 4, 49635–49646. [Google Scholar] [CrossRef]
- Alexander, T.A. Applications of surface-enhanced Raman spectroscopy (SERS) for biosensing: An analysis of reproducible commercially available substrates. In Smart Medical and Biomedical Sensor Technology III.; International Society for Optics and Photonics: Bellingham, WA, USA, 2005; p. 600703. [Google Scholar]
- Wu, X.; Chen, J.; Li, X.; Zhao, Y.; Zughaier, S.M. Culture-free diagnostics of Pseudomonas aeruginosa infection by silver nanorod array based SERS from clinical sputum samples. Nanomed. Nanotechnol. Biol. Med. 2014, 10, 1863–1870. [Google Scholar] [CrossRef] [PubMed]
- Walter, A.; März, A.; Schumacher, W.; Rösch, P.; Popp, J. Towards a fast, high specific and reliable discrimination of bacteria on strain level by means of SERS in a microfluidic device. Lab Chip 2011, 11, 1013–1021. [Google Scholar] [CrossRef]
- Premasiri, W.R.; Moir, D.T.; Klempner, M.S.; Krieger, N.; Jones, G.; Ziegler, L.D. Characterization of the Surface Enhanced Raman Scattering (SERS) of Bacteria. J. Phys. Chem. B 2005, 109, 312–320. [Google Scholar] [CrossRef]
- Fan, C.; Hu, Z.; Mustapha, A.; Lin, M. Rapid detection of food-and waterborne bacteria using surface-enhanced Raman spectroscopy coupled with silver nanosubstrates. Appl. Microbiol. Biotechnol. 2011, 92, 1053–1061. [Google Scholar] [CrossRef]
- Mircescu, N.E.; Zhou, H.; Leopold, N.; Chiş, V.; Ivleva, N.P.; Niessner, R.; Wieser, A.; Haisch, C. Towards a receptor-free immobilization and SERS detection of urinary tract infections causative pathogens. Anal. Bioanal. Chem. 2014, 406, 3051–3058. [Google Scholar] [CrossRef]
- Liu, Y.; Chao, K.; Nou, X.; Chen, Y.-R. Feasibility of colloidal silver SERS for rapid bacterial screening. Sens. Instrum. Food Qual. Saf. 2009, 3, 100–107. [Google Scholar] [CrossRef]
- Trevisan, J.; Angelov, P.P.; Carmichael, P.L.; Scott, A.D.; Martin, F.L. Extracting biological information with computational analysis of Fourier-transform infrared (FTIR) biospectroscopy datasets: Current practices to future perspectives. Analyst 2012, 137, 3202–3215. [Google Scholar] [CrossRef]
- Lasch, P.; Chiriboga, L.; Yee, H.; Diem, M. Infrared spectroscopy of human cells and tissue: Detection of disease. Technol. Cancer Res. Treat. 2002, 1, 1–7. [Google Scholar] [CrossRef]
- Gautam, R.; Vanga, S.; Ariese, F.; Umapathy, S. Review of multidimensional data processing approaches for Raman and infrared spectroscopy. EPJ Tech. Instrum. 2015, 2, 1–38. [Google Scholar] [CrossRef]
- Butler, H.J.; Smith, B.R.; Fritzsch, R.; Radhakrishnan, P.; Palmer, D.S.; Baker, M.J. Optimised spectral pre-processing for discrimination of biofluids via ATR-FTIR spectroscopy. Analyst 2018, 143, 6121–6134. [Google Scholar] [CrossRef] [PubMed]
- Pence, I.; Mahadevan-Jansen, A. Clinical instrumentation and applications of Raman spectroscopy. Chem. Soc. Rev. 2016, 45, 1958–1979. [Google Scholar] [CrossRef] [PubMed]
- Baker, M.J.; Trevisan, J.; Bassan, P.; Bhargava, R.; Butler, H.J.; Dorling, K.M.; Fielden, P.R.; Fogarty, S.W.; Fullwood, N.J.; Heys, K.A. Using Fourier transform IR spectroscopy to analyze biological materials. Nat. Protocols 2014, 9, 1771. [Google Scholar] [CrossRef] [PubMed]
- Mariey, L.; Signolle, J.; Amiel, C.; Travert, J. Discrimination, classification, identification of microorganisms using FTIR spectroscopy and chemometrics. Vib. Spectrosc. 2001, 26, 151–159. [Google Scholar] [CrossRef]
- Moter, A.; Göbel, U.B. Fluorescence in Situ Hybridization (FISH) for Direct Visualization of Microorganisms. J Microbiol. Meth. 2000, 41, 85–112. [Google Scholar] [CrossRef]
- Moussata, D.; Goetz, M.; Gloeckner, A.; Kerner, M.; Campbell, B.; Hoffman, A.; Biesterfeld, S.; Flourie, B.; Saurin, J.-C.; Galle, P.R. Confocal laser endomicroscopy is a new imaging modality for recognition of intramucosal bacteria in inflammatory bowel disease in vivo. Gut 2011, 60, 26–33. [Google Scholar] [CrossRef]
- van der Waaij, L.A.; Harmsen, H.J.; Madjipour, M.; Kroese, F.G.; Zwiers, M.; Van Dullemen, H.; De Boer, N.; Welling, G.; Jansen, P.L. Bacterial population analysis of human colon and terminal ileum biopsies with 16S rRNA-based fluorescent probes: Commensal bacteria live in suspension and have no direct contact with epithelial cells. Inflam. Bowel Dis. 2005, 11, 865–871. [Google Scholar] [CrossRef]
- Kleessen, B.; Kroesen, A.; Buhr, H.; Blaut, M. Mucosal and invading bacteria in patients with inflammatory bowel disease compared with controls. Scand. J. Gastroenterol. 2002, 37, 1034–1041. [Google Scholar] [CrossRef]
- Takada, T.; Matsumoto, K.; Nomoto, K. Development of multi-color FISH method for analysis of seven Bifidobacterium species in human feces. J. Microbiol. Methods 2004, 58, 413–421. [Google Scholar] [CrossRef]
- Schwiertz, A.; Jacobi, M.; Frick, J.-S.; Richter, M.; Rusch, K.; Köhler, H. Microbiota in pediatric inflammatory bowel disease. J. Pediatr. 2010, 157, 240–244. [Google Scholar] [CrossRef] [PubMed]
- Fazli, M.; Bjarnsholt, T.; Høiby, N.; Givskov, M.; Tolker-Nielsen, T. PNA-based fluorescence in situ hybridization for identification of bacteria in clinical samples. In In Situ Hybridization Protocols. Methods in Molecular Biology (Methods and Protocols); Humana Press: New York, NY, USA, 2014; pp. 261–271. [Google Scholar]
- Bjarnsholt, T.; Kirketerp-Møller, K.; Jensen, P.Ø.; Madsen, K.G.; Phipps, R.; Krogfelt, K.; Høiby, N.; Givskov, M. Why chronic wounds will not heal: A novel hypothesis. Wound Repair Regen. 2008, 16, 2–10. [Google Scholar] [CrossRef] [PubMed]
- Hall-Stoodley, L.; Hu, F.Z.; Gieseke, A.; Nistico, L.; Nguyen, D.; Hayes, J.; Forbes, M.; Greenberg, D.P.; Dice, B.; Burrows, A. Direct detection of bacterial biofilms on the middle-ear mucosa of children with chronic otitis media. JAMA 2006, 296, 202–211. [Google Scholar] [CrossRef] [PubMed]
- Nistico, L.; Gieseke, A.; Stoodley, P.; Hall-Stoodley, L.; Kerschner, J.E.; Ehrlich, G.D. Fluorescence “in situ” hybridization for the detection of biofilm in the middle ear and upper respiratory tract mucosa. In Auditory and Vestibular Research; Humana Press: New York, NY, USA, 2009; pp. 191–213. [Google Scholar]
- Thornton, R.B.; Rigby, P.J.; Wiertsema, S.P.; Filion, P.; Langlands, J.; Coates, H.L.; Vijayasekaran, S.; Keil, A.D.; Richmond, P.C. Multi-species bacterial biofilm and intracellular infection in otitis media. BMC Pediatr. 2011, 11, 94. [Google Scholar] [CrossRef]
- Homøe, P.; Bjarnsholt, T.; Wessman, M.; Sørensen, H.C.F.; Johansen, H.K. Morphological evidence of biofilm formation in Greenlanders with chronic suppurative otitis media. Eur. Arch. Oto-rhino-Laryngol. 2009, 266, 1533–1538. [Google Scholar] [CrossRef]
- Wang, X.; Niazi, S.; Yukun, H.; Sun, W.; Wu, S.; Duan, N.; Hun, X.; Wang, Z. Homogeneous time-resolved FRET assay for the detection of Salmonella typhimurium using aptamer-modified NaYF 4: Ce/Tb nanoparticles and a fluorescent DNA label. Microchim. Acta 2017, 184, 4021–4027. [Google Scholar] [CrossRef]
- Shanehsaz, M.; Mohsenifar, A.; Hasannia, S.; Pirooznia, N.; Samaei, Y.; Shamsipur, M. Detection of Helicobacter pylori with a nanobiosensor based on fluorescence resonance energy transfer using CdTe quantum dots. Microchim. Acta 2013, 180, 195–202. [Google Scholar] [CrossRef]
- Cohen, N.; Zahavy, E.; Zichel, R.; Fisher, M. An internal standard approach for homogeneous TR–FRET immunoassays facilitates the detection of bacteria, biomarkers, and toxins in complex matrices. Anal. Bioanal. Chem. 2016, 408, 5179–5188. [Google Scholar] [CrossRef]
- Jolley, M.E.; Nasir, M.S. The use of fluorescence polarization assays for the detection of infectious diseases. Comb. Chem. High Throughput Screen. 2003, 6, 235–244. [Google Scholar] [CrossRef]
- Park, K.S.; Charles, R.C.; Ryan, E.T.; Weissleder, R.; Lee, H. Fluorescence polarization-based nucleic acid testing for rapid and cost-effective diagnosis of infectious disease. Chemistry 2015, 21, 16359. [Google Scholar] [CrossRef]
- Karsunke, X.Y.; Niessner, R.; Seidel, M. Development of a multichannel flow-through chemiluminescence microarray chip for parallel calibration and detection of pathogenic bacteria. Anal. Bioanal. Chem. 2009, 395, 1623. [Google Scholar] [CrossRef] [PubMed]
- Sanchez-Pescador, R.; Stempien, M.; Urdea, M. Rapid chemiluminescent nucleic acid assays for detection of TEM-1 beta-lactamase-mediated penicillin resistance in Neisseria gonorrhoeae and other bacteria. J. Clin. Microbiol. 1988, 26, 1934–1938. [Google Scholar] [CrossRef] [PubMed]
- Xiong, J.; Wang, W.; Zhou, Y.; Kong, W.; Wang, Z.; Fu, Z. Ultra-sensitive chemiluminescent detection of Staphylococcus aureus based on competitive binding of Staphylococcus protein A-modified magnetic beads to immunoglobulin G. Microchim. Acta 2016, 183, 1507–1512. [Google Scholar] [CrossRef]
- Dippel, A.B.; Anderson, W.A.; Park, J.H.; Yildiz, F.H.; Hammond, M.C. Development of Ratiometric Bioluminescent Sensors for in Vivo Detection of Bacterial Signaling. ACS Chem. Biol. 2020, 15, 904–914. [Google Scholar] [CrossRef] [PubMed]
- Hao, L.; Gu, H.; Duan, N.; Wu, S.; Ma, X.; Xia, Y.; Tao, Z.; Wang, Z. An enhanced chemiluminescence resonance energy transfer aptasensor based on rolling circle amplification and WS2 nanosheet for Staphylococcus aureus detection. Anal. Chim. acta 2017, 959, 83–90. [Google Scholar] [CrossRef]
- Zhu, P.; Shelton, D.R.; Li, S.; Adams, D.L.; Karns, J.S.; Amstutz, P.; Tang, C.-M. Detection of E. coli O157: H7 by immunomagnetic separation coupled with fluorescence immunoassay. Biosens. Bioelectron. 2011, 30, 337–341. [Google Scholar] [CrossRef]
- Banada, P.P.; Bhunia, A.K. Antibodies and immunoassays for detection of bacterial pathogens. In Principles of Bacterial Detection: Biosensors, Recognition Receptors and Microsystems; Springer: New York, NY, USA, 2008; pp. 567–602. [Google Scholar]
- Wang, L.; Zhao, W.; O’Donoghu, M.B.; Tan, W. Fluorescent nanoparticles for multiplexed bacteria monitoring. Bioconjugate Chem. 2007, 18, 297–301. [Google Scholar] [CrossRef]
- Mairhofer, J.; Roppert, K.; Ertl, P. Microfluidic systems for pathogen sensing: A review. Sensors 2009, 9, 4804–4823. [Google Scholar] [CrossRef]
- Delehanty, J.B.; Ligler, F.S. A microarray immunoassay for simultaneous detection of proteins and bacteria. Anal. Chem. 2002, 74, 5681–5687. [Google Scholar] [CrossRef]
- Gehring, A.G.; Albin, D.M.; Bhunia, A.K.; Reed, S.A.; Tu, S.-I.; Uknalis, J. Antibody Microarray Detection of Escherichia c oli O157: H7: Quantification, Assay Limitations, and Capture Efficiency. Anal. Chem. 2006, 78, 6601–6607. [Google Scholar] [CrossRef]
- Kartalov, E.P.; Zhong, J.F.; Scherer, A.; Quake, S.R.; Taylor, C.R.; French Anderson, W. High-throughput multi-antigen microfluidic fluorescence immunoassays. BioTechniques 2006, 40, 85–90. [Google Scholar] [CrossRef] [PubMed]
- Rowe-Taitt, C.A.; Golden, J.P.; Feldstein, M.J.; Cras, J.J.; Hoffman, K.E.; Ligler, F.S. Array biosensor for detection of biohazards. Biosens. Bioelectron. 2000, 14, 785–794. [Google Scholar] [CrossRef]
- Rajendran, V.K.; Bakthavathsalam, P.; Ali, B.M.J. Smartphone based bacterial detection using biofunctionalized fluorescent nanoparticles. Microchim. Acta 2014, 181, 1815–1821. [Google Scholar] [CrossRef]
- Nicolini, A.M.; Fronczek, C.F.; Yoon, J.-Y. Droplet-based immunoassay on a ‘sticky’nanofibrous surface for multiplexed and dual detection of bacteria using smartphones. Biosens. Bioelectron. 2015, 67, 560–569. [Google Scholar] [CrossRef] [PubMed]
- Shrivastava, S.; Lee, W.-I.; Lee, N.-E. Culture-free, highly sensitive, quantitative detection of bacteria from minimally processed samples using fluorescence imaging by smartphone. Biosens. Bioelectron. 2018, 109, 90–97. [Google Scholar] [CrossRef] [PubMed]
- Li, S.; Liu, J.; Chen, Z.; Lu, Y.; Low, S.S.; Zhu, L.; Cheng, C.; He, Y.; Chen, Q.; Su, B. Electrogenerated chemiluminescence on smartphone with graphene quantum dots nanocomposites for Escherichia Coli detection. Sens. Actuators B Chem. 2019, 297, 126811. [Google Scholar] [CrossRef]
- Wang, S.; Zheng, L.; Cai, G.; Liu, N.; Liao, M.; Li, Y.; Zhang, X.; Lin, J. A microfluidic biosensor for online and sensitive detection of Salmonella typhimurium using fluorescence labeling and smartphone video processing. Biosens. Bioelectron. 2019, 140, 111333. [Google Scholar] [CrossRef]
- Sung, Y.; Campa, F.; Shih, W.-C. Open-source do-it-yourself multi-color fluorescence smartphone microscopy. Biomed. Opt. Express 2017, 8, 5075–5086. [Google Scholar] [CrossRef]
- Müller, V.; Sousa, J.M.; Koydemir, H.C.; Veli, M.; Tseng, D.; Cerqueira, L.; Ozcan, A.; Azevedo, N.F.; Westerlund, F. Identification of pathogenic bacteria in complex samples using a smartphone based fluorescence microscope. RSC Adv. 2018, 8, 36493–36502. [Google Scholar] [CrossRef]
- Prati, F.; Regar, E.; Mintz, G.S.; Arbustini, E.; Di Mario, C.; Jang, I.-K.; Akasaka, T.; Costa, M.; Guagliumi, G.; Grube, E. Expert review document on methodology, terminology, and clinical applications of optical coherence tomography: Physical principles, methodology of image acquisition, and clinical application for assessment of coronary arteries and atherosclerosis. Eur. Heart J. 2010, 31, 401–415. [Google Scholar] [CrossRef]
- Rasmussen, K.; Reilly, C.; Li, Y.; Jones, R.S. Real-time imaging of anti-biofilm effects using CP-OCT. Biotechnol. Bioeng. 2016, 113, 198–205. [Google Scholar] [CrossRef] [PubMed]
- Mohan, M.; Nigam, V.K.; Poddar, R. Towards characterization of bacterial colonies and biofilms: An approach based on swept source optical coherence tomography. Optik 2019, 185, 592–598. [Google Scholar] [CrossRef]
- Wagner, M.; Horn, H. Optical coherence tomography in biofilm research: A comprehensive review. Biotechnol. Bioeng. 2017, 114, 1386–1402. [Google Scholar] [CrossRef] [PubMed]
- Nguyen, C.T.; Robinson, S.R.; Jung, W.; Novak, M.A.; Boppart, S.A.; Allen, J.B. Investigation of bacterial biofilm in the human middle ear using optical coherence tomography and acoustic measurements. Hear. Res. 2013, 301, 193–200. [Google Scholar] [CrossRef] [PubMed]
- Cho, N.H.; Lee, S.H.; Jung, W.; Jang, J.H.; Kim, J. Optical coherence tomography for the diagnosis and evaluation of human otitis media. J. Korean Med. Sci. 2015, 30, 328–335. [Google Scholar] [CrossRef] [PubMed]
- Bjarnsholt, T. The role of bacterial biofilms in chronic infections. Apmis 2013, 121, 1–58. [Google Scholar] [CrossRef]
- Preciado, D.; Nolan, R.M.; Joshi, R.; Krakovsky, G.M.; Zhang, A.; Pudik, N.A.; Kumar, N.K.; Shelton, R.L.; Boppart, S.A.; Bauman, N.M. Otitis media middle ear effusion identification and characterization using an optical coherence tomography otoscope. Otolaryngol. Head Neck Surg. 2020, 162, 367–374. [Google Scholar] [CrossRef]
- Monroy, G.L.; Pande, P.; Nolan, R.M.; Shelton, R.L.; Porter, R.G.; Novak, M.A.; Spillman, D.R.; Chaney, E.J.; McCormick, D.T.; Boppart, S.A. Noninvasive in vivo optical coherence tomography tracking of chronic otitis media in pediatric subjects after surgical intervention. J. Biomed. Opt. 2017, 22, 121614. [Google Scholar] [CrossRef]
- Monroy, G.L.; Won, J.; Dsouza, R.; Pande, P.; Hill, M.C.; Porter, R.G.; Novak, M.A.; Spillman, D.R.; Boppart, S.A. Automated classification platform for the identification of otitis media using optical coherence tomography. NPJ Digit. Med. 2019, 2, 1–11. [Google Scholar] [CrossRef]
- Hussain, A.; Banzhaf, C.; Themstrup, L.; Nielsen, P.; Jemec, G. A case report of differentiating staphylococcal scalded skin syndrome and toxic epidermal necrolysis by optical coherence tomography. Skin Res. Technol. 2015, 21, 363–365. [Google Scholar] [CrossRef]
- Tóth, L.; Vajas, A.; Csomor, P.; Berta, A.; Sziklai, I.; Karosi, T. Optical coherence tomography for biofilm detection in chronic rhinosinusitis with nasal polyposis. Eur. Arch. Oto-Rhino-Laryngol. 2013, 270, 555–563. [Google Scholar] [CrossRef] [PubMed]
- Zhao, Y.; Monroy, G.L.; You, S.; Shelton, R.L.; Nolan, R.M.; Tu, H.; Chaney, E.J.; Boppart, S.A. Rapid diagnosis and differentiation of microbial pathogens in otitis media with a combined Raman spectroscopy and low-coherence interferometry probe: Toward in vivo implementation. J. Biomed. Opt. 2016, 21, 107005. [Google Scholar] [CrossRef] [PubMed]
- Massad-Ivanir, N.; Shtenberg, G.; Zeidman, T.; Segal, E. Construction and characterization of porous SiO2/hydrogel hybrids as optical biosensors for rapid detection of bacteria. Adv. Funct. Mater. 2010, 20, 2269–2277. [Google Scholar] [CrossRef]
- Urmann, K.; Arshavsky-Graham, S.; Walter, J.-G.; Scheper, T.; Segal, E. Whole-cell detection of live lactobacillus acidophilus on aptamer-decorated porous silicon biosensors. Analyst 2016, 141, 5432–5440. [Google Scholar] [CrossRef] [PubMed]
- Sarkar, D.; Gunda, N.S.K.; Jamal, I.; Mitra, S.K. Optical biosensors with an integrated Mach-Zehnder Interferometer for detection of Listeria monocytogenes. Biomed. Microdevices 2014, 16, 509–520. [Google Scholar] [CrossRef] [PubMed]
- Janik, M.; Koba, M.; Celebańska, A.; Bock, W.J.; Śmietana, M. Live E. coli bacteria label-free sensing using a microcavity in-line Mach-Zehnder interferometer. Sci. Rep. 2018, 8, 17176. [Google Scholar] [CrossRef]
- Shapiro, J.A. The significances of bacterial colony patterns. Bioessays 1995, 17, 597–607. [Google Scholar] [CrossRef]
- Badieyan, S.; Dilmaghani-Marand, A.; Hajipour, M.J.; Ameri, A.; Razzaghi, M.R.; Rafii-Tabar, H.; Mahmoudi, M.; Sasanpour, P. Detection and discrimination of bacterial colonies with Mueller matrix imaging. Sci. Rep. 2018, 8, 1–10. [Google Scholar] [CrossRef]
- Bayraktar, B.; Banada, P.P.; Hirleman, E.D.; Bhunia, A.K.; Robinson, J.P.; Rajwa, B.P. Feature extraction from light-scatter patterns of Listeria colonies for identification and classification. J. Biomed. Opt. 2006, 11, 034006. [Google Scholar] [CrossRef]
- Bae, E.; Banada, P.P.; Huff, K.; Bhunia, A.K.; Robinson, J.P.; Hirleman, E.D. Biophysical modeling of forward scattering from bacterial colonies using scalar diffraction theory. Appl. Opt. 2007, 46, 3639–3648. [Google Scholar] [CrossRef]
- Banada, P.P.; Guo, S.; Bayraktar, B.; Bae, E.; Rajwa, B.; Robinson, J.P.; Hirleman, E.D.; Bhunia, A.K. Optical forward-scattering for detection of Listeria monocytogenes and other Listeria species. Biosens. Bioelectron. 2007, 22, 1664–1671. [Google Scholar] [PubMed]
- Kim, K.-P.; Singh, A.K.; Bai, X.; Leprun, L.; Bhunia, A.K. Novel PCR assays complement laser biosensor-based method and facilitate listeria species detection from food. Sensors 2015, 15, 22672–22691. [Google Scholar] [PubMed]
- Mendonca, M.; Conrad, N.L.; Conceicao, F.R.; Moreira, A.N.; da Silva, W.P.; Aleixo, J.A.; Bhunia, A.K. Highly specific fiber optic immunosensor coupled with immunomagnetic separation for detection of low levels of Listeria monocytogenes and L. ivanovii. BMC microbiol. 2012, 12, 275. [Google Scholar]
- Koo, O.; Aroonnual, A.; Bhunia, A. Human heat-shock protein 60 receptor-coated paramagnetic beads show improved capture of Listeria monocytogenes in the presence of other Listeria in food. J. Appl. Microbiol. 2011, 111, 93–104. [Google Scholar]
- Singh, A.K.; Bettasso, A.M.; Bae, E.; Rajwa, B.; Dundar, M.M.; Forster, M.D.; Liu, L.; Barrett, B.; Lovchik, J.; Robinson, J.P. Laser optical sensor, a label-free on-plate Salmonella enterica colony detection tool. MBio 2014, 5. [Google Scholar] [CrossRef]
- Abdelhaseib, M.U.; Singh, A.K.; Bailey, M.; Singh, M.; El-Khateib, T.; Bhunia, A.K. Fiber optic and light scattering sensors: Complimentary approaches to rapid detection of Salmonella enterica in food samples. Food Control 2016, 61, 135–145. [Google Scholar]
- Huff, K.; Aroonnual, A.; Littlejohn, A.E.F.; Rajwa, B.; Bae, E.; Banada, P.P.; Patsekin, V.; Hirleman, E.D.; Robinson, J.P.; Richards, G.P. Light-scattering sensor for real-time identification of V ibrio parahaemolyticus, V ibrio vulnificus and V ibrio cholerae colonies on solid agar plate. Microb. Biotechnol. 2012, 5, 607–620. [Google Scholar]
- He, Y.; Reed, S.; Bhunia, A.K.; Gehring, A.; Nguyen, L.-H.; Irwin, P.L. Rapid identification and classification of Campylobacter spp. using laser optical scattering technology. Food Microbiol. 2015, 47, 28–35. [Google Scholar]
- Genuer, V.; Gal, O.; Méteau, J.; Marcoux, P.; Schultz, E.; Lacot, É.; Maurin, M.; Dinten, J.-M. Optical Elastic Scattering for Early Label-Free Identification of Clinical Pathogens. In Advanced Biomedical and Clinical Diagnostic and Surgical Guidance Systems XIV; International Society for Optics and Photonics: Bellingham, WA, USA, 2016; p. 96980A. [Google Scholar]
- Choi, J.-W.; Pu, A.; Psaltis, D. Bacteria detection in a microfluidic channel utilizing electromagnetic cellular polarization and optical scattering. In Proceedings of the 2006 Digest of the LEOS Summer Topical Meetings, Quebec City, QC, Canada, 17–19 July 2006; IEEE: Piscataway, NJ, USA, 2006; pp. 17–18. [Google Scholar]
- Sendra, H.; Murialdo, S.; Passoni, L. Dynamic laser speckle to detect motile bacterial response of Pseudomonas aeruginosa. J. Phys. Conf. Ser. 2007, 90, 012–064. [Google Scholar]
- Loutfi, H.; Pellen, F.; Le Jeune, B.; Lteif, R.; Kallassy, M.; Le Brun, G.; Abboud, M. Real-time monitoring of bacterial growth kinetics in suspensions using laser speckle imaging. Sci. Rep. 2020, 10, 408. [Google Scholar]
- Han, S.; No, H.; Baek, Y.; Park, H.; Lee, K.; Yang, S.; Park, Y. Rapid antimicrobial susceptibility test using spatiotemporal analysis of laser speckle dynamics of bacterial colonies. BioRxiv 2019, 853168. [Google Scholar] [CrossRef]
- Kniggendorf, A.-K.; Meinhardt-Wollweber, M. Of microparticles and bacteria identification–(resonance) Raman micro-spectroscopy as a tool for biofilm analysis. Water Res. 2011, 45, 4571–4582. [Google Scholar] [PubMed]
- Gora, M.J.; Suter, M.J.; Tearney, G.J.; Li, X. Endoscopic optical coherence tomography: Technologies and clinical applications. Biomed. Opt. Express 2017, 8, 2405–2444. [Google Scholar] [PubMed]
- Kim, J.A.; Wales, D.J.; Thompson, A.J.; Yang, G.Z. Fiber-Optic SERS Probes Fabricated Using Two-Photon Polymerization for Rapid Detection of Bacteria. Adv. Opt. Mater. 2020, 8, 1901934. [Google Scholar]
- Alves, I.P.; Reis, N.M. Microfluidic smartphone quantitation of Escherichia coli in synthetic urine. Biosens. Bioelectron. 2019, 145, 111624. [Google Scholar] [PubMed]
- Le, N.; Subhash, H.M.; Kilpatrick-Liverman, L.; Wang, R.K. Noninvasive multimodal imaging by integrating optical coherence tomography with autofluorescence imaging for dental applications. J. Biophotonics 2020, 13, e202000026. [Google Scholar] [PubMed]


| Modality | Spectral Information Used for Bacteria Classification | Sample | Limitations |
|---|---|---|---|
| FTIR | Gram-positive vs. Gram-negative [38,39] Polysaccharide: 900–1200 cm−1 Amide (proteins/peptides): 1500–1800 cm−1 Cell membrane fatty acid chains (-CH3, -CH2, -CH stretch): 2800–3000 cm−1 | Cultured isolates (i.e., Pseudomonas aeruginosa, Klebsiella pneumoniae, Enterobacter cloacae, and Acinetobacter baumannii) | Strong water absorption requiring dried samples; Limited information via direct visual analysis; needs multivariate analysis methods to provide discrimination; Samples cultured up to 24 hr at 37 °C ideal for measurements |
| Bacteria Species/Strain Differentiation [27,40,41,42,43,44,45,46,47,48,49] Polysaccharide: 900–1200 cm−1 Proteins/Free amino acids/Polysaccharides: 1200–1450 cm−1 RNA/DNA/Phospholipids: 1200–1250 cm−1 Proteins:1500–1700 cm−1 Fatty acids: 2800–3000 cm−1 | Cultured isolates (i.e., Pseudomonas, Bacillus, Staphylococcus, Candida, Enterococcus, and Streptococcus, Enterobacter) | ||
| Antibiotics Resistance [50,51,52,53] Nucleic acid: 1200–1300 cm−1 Carbohydrates: 950–1200 cm−1 | Cultured patient specimens (i.e., Escherichia coli and Staphylococcus) | ||
| Identification of Bacteria from Patient Samples [54,55,56] | Sputum (cystic fibrosis) and urine (urinary tract infections) | ||
| ATR-FTIR | Bacterial biofilms [57,58] Polysaccharide: 950–1200 cm−1 Amide I: 1650 cm−1 Amide II: 1550 cm−1 Species/strain differentiation [59,60] Phospholipids/DNA/RNA: 1185–1500 cm−1 Carbohydrates:900–1185 cm−1 | In vitro (i.e., Caulobacter and Streptococcus) Cultured isolates (i.e., Acinetobacter baumannii) | Lack of spatial sampling; ATR accessories needed for measurements; Additional processing steps required for comparable absorption spectra; Limited information via direct visual analysis; needs multivariate analysis methods to provide discrimination |
| FTIR-Imaging | Cultures printed in microarray and microfluidics [61,62,63,64] Differentiation of strain and Gram-positive vs. Gram-negative [65] | i.e., Listeria, Enterobacter, Klebsiella, Escherichia, Staphylococcus, Bacillus, and Pseudomonas | 10 µm resolution; difficult to probe single bacterial cell; Specialized microscope slides (i.e., zinc selenide crystals) to reduce background and requires more sophisticated optical elements (i.e., FPA detectors, IR-transmissive lenses); Limited information via direct visual analysis; needs multivariate analysis methods to provide discrimination |
| Raman Modality | Spectral Information Used for Bacteria Classification | Sample | Limitation |
|---|---|---|---|
| Conventional RS | Bacteria species/strain differentiation [71,82,83,84] Amino/nucleic acids: 700–1100 cm−1 Amide I, II, III: 1640–80, 1552, and 1220–1310 cm−1 | Cultured clinical oral Streptococci ssp. Cultured Escherichiacoli (E. coli) strains, Haemophilus influenzae/Moraxella catarrhalis/Streptococcus. Pneumoniae (S. pneumoniae), Group B Streptococcus/E. coli, and Staphylococcus aureus (S. aureus) | Requires low Raman background microscope slides such as calcium fluoride or quartz; Limited information via direct visual analysis; needs machine learning methods to provide discrimination |
| Culture-free patient samples [85,86] DNA: 788, 1093, and 1578 cm−1 Proteins: 1004, 1250, and 1658 cm−1 CH-vibrations: 1341 and 1452 cm−1 | Urine (lab-on-a-chip device) | ||
| Antibiotic resistance [87] Amino acids/DNA: 765–935 cm−1 CH2/CH3 bending:1431–1464 cm−1: Carotenoids: 1159 and 1523 cm−1 | Cultured S. aureus mutant strains | ||
| UV Resonance (~244 nm) | Bacteria classification [88,89] Nucleic acids: 1475–1600 cm−1 | Cultured urine isolates, Bacillus strains | Photo-degradation effect causing cell damage; Limited information via direct visual analysis; needs machine learning methods to provide discrimination |
| Antibiotic resistance [90] Nucleic acid/protein ratio: 1480/1607 cm−1 | Cultured Bacillus pumilus | ||
| Surface-enhanced Raman spectroscopy (culture-free) | Nanoparticle growth external or inside cells [91,92,93,94] External (cell wall features) Amino acids, proteins, carboxylate, flavin adenine dinucleotide (FAD), lipids, and DNA Internal: Cytosolic protein (1250 cm−1) and nucleic acids | E. coli, Pseudomonas aeruginosa, Methicillin-resistant Staphylococcus aureus and Listeria spp., Geobacter sulfurreducens, and Bacillus megaterium(B. megaterium) | Nanoparticles need to be in close proximity (<3 nm) with cell surface; Material, shape and size dramatically affect signal strength and spectral profile |
| Mixture of nanoparticles with bacteria Live vs. dead bacteria [95] Gram-positive vs. Gram-negative [96] | E. coli O157, Salmonella typhimurium(S. typhimurium), S. aureus, and B. megaterium | ||
| Label-free SERS substrate Urinary tract infection [97] Bacterial meningitis [98] Human blood [99,100] Surface charge: poly-electrolyte coated magnetic nanoparticles [101] | Lactobacillus plantarum, E. coli, S. aureus, Pseudomonas aeruginosa, Klebsiella oxytoca, S. pneumoniae, Haemophilus influenzae | ||
| SERS biomarker assays | SERS biomarker assays (indirect detection) Antibody assays [102,103,104] Aptamer assays [105,106] | S. aureus, E. coli, Multi-drug resistant S. typhimurium, S. aureus, and E. coli |
| Purpose | Modality | Sample Types | Accuracy (%)/LOD |
|---|---|---|---|
| Species-specific detection via ligand binding | FISH | Biopsy tissue [133,134,135] | NA |
| Fecal matter [136,137] | NA | ||
| In vivo biofilms [24,138,140,141,142,143] | NA | ||
| FRET | Cell suspension [144,145,146] | 15–300 CFU/mL | |
| Blood cultures [156] | 10 ng/mL | ||
| Fluorescence polarization | Whole blood [148] | 1 CFU/mL | |
| Fluorescence biosensor | Cell suspension [149,158,159,160,161,165,166] | 102–108 CFU/mL | |
| Mixed cell suspension [163,164] | 102–103 CFU/mL | ||
| Interferometry | Mixed cell suspension [183,184] | 105–106 CFU/mL | |
| Cell suspension/biofilm growth [185] | 100 CFU/mL | ||
| Species and/or strain identification via machine learning | Vibrational spectroscopy | Clinical isolates [38,39,41,42,43,44,45,46,47,48,49,50,51,52,53,54,55,56,59,60,61,62,63,64,71,82,83,84,88,90] | 75–100% |
| Urine [85,86] | 107 CFU/mL, 100% | ||
| Biofilms [203] | NA | ||
| SERS biosensor | Clinical isolates [91,92,93,94,95,96,97,98,99,124] | 84–100% | |
| Urine [97] | 105 CFU/mL, 97% | ||
| Whole blood [99,100] | 11 CFU/mL, 100% | ||
| Cerebrospinal fluid [98] | NA | ||
| Polarimetry | Bacterial cultures [187] | NA | |
| ELS | Bacterial cultures [188,189,190,191,192,193,194,195,196,197,198] | 80–98% | |
| Urine [197] | 107 CFU/mL | ||
| Bacterial growth kinetics | OCT | In vitro biofilms [170,171,174] | NA |
| In vivo biofilms [173,174,175,176,177,178,179,180,181] | NA | ||
| LSCI | Bacterial cultures [191,194,200,201] | NA |
Publisher’s Note: MDPI stays neutral with regard to jurisdictional claims in published maps and institutional affiliations. |
© 2020 by the authors. Licensee MDPI, Basel, Switzerland. This article is an open access article distributed under the terms and conditions of the Creative Commons Attribution (CC BY) license (http://creativecommons.org/licenses/by/4.0/).
Share and Cite
Locke, A.; Fitzgerald, S.; Mahadevan-Jansen, A. Advances in Optical Detection of Human-Associated Pathogenic Bacteria. Molecules 2020, 25, 5256. https://doi.org/10.3390/molecules25225256
Locke A, Fitzgerald S, Mahadevan-Jansen A. Advances in Optical Detection of Human-Associated Pathogenic Bacteria. Molecules. 2020; 25(22):5256. https://doi.org/10.3390/molecules25225256
Chicago/Turabian StyleLocke, Andrea, Sean Fitzgerald, and Anita Mahadevan-Jansen. 2020. "Advances in Optical Detection of Human-Associated Pathogenic Bacteria" Molecules 25, no. 22: 5256. https://doi.org/10.3390/molecules25225256
APA StyleLocke, A., Fitzgerald, S., & Mahadevan-Jansen, A. (2020). Advances in Optical Detection of Human-Associated Pathogenic Bacteria. Molecules, 25(22), 5256. https://doi.org/10.3390/molecules25225256