
Influence of Sputtering Temperature of TiO2 Deposited onto Reduced Graphene Oxide Nanosheet as Efficient Photoanodes in Dye-Sensitized Solar Cells

 , , , ,
 ,
,  and
and
Abstract
1. Introduction
2. Experimental Details
2.1. Materials
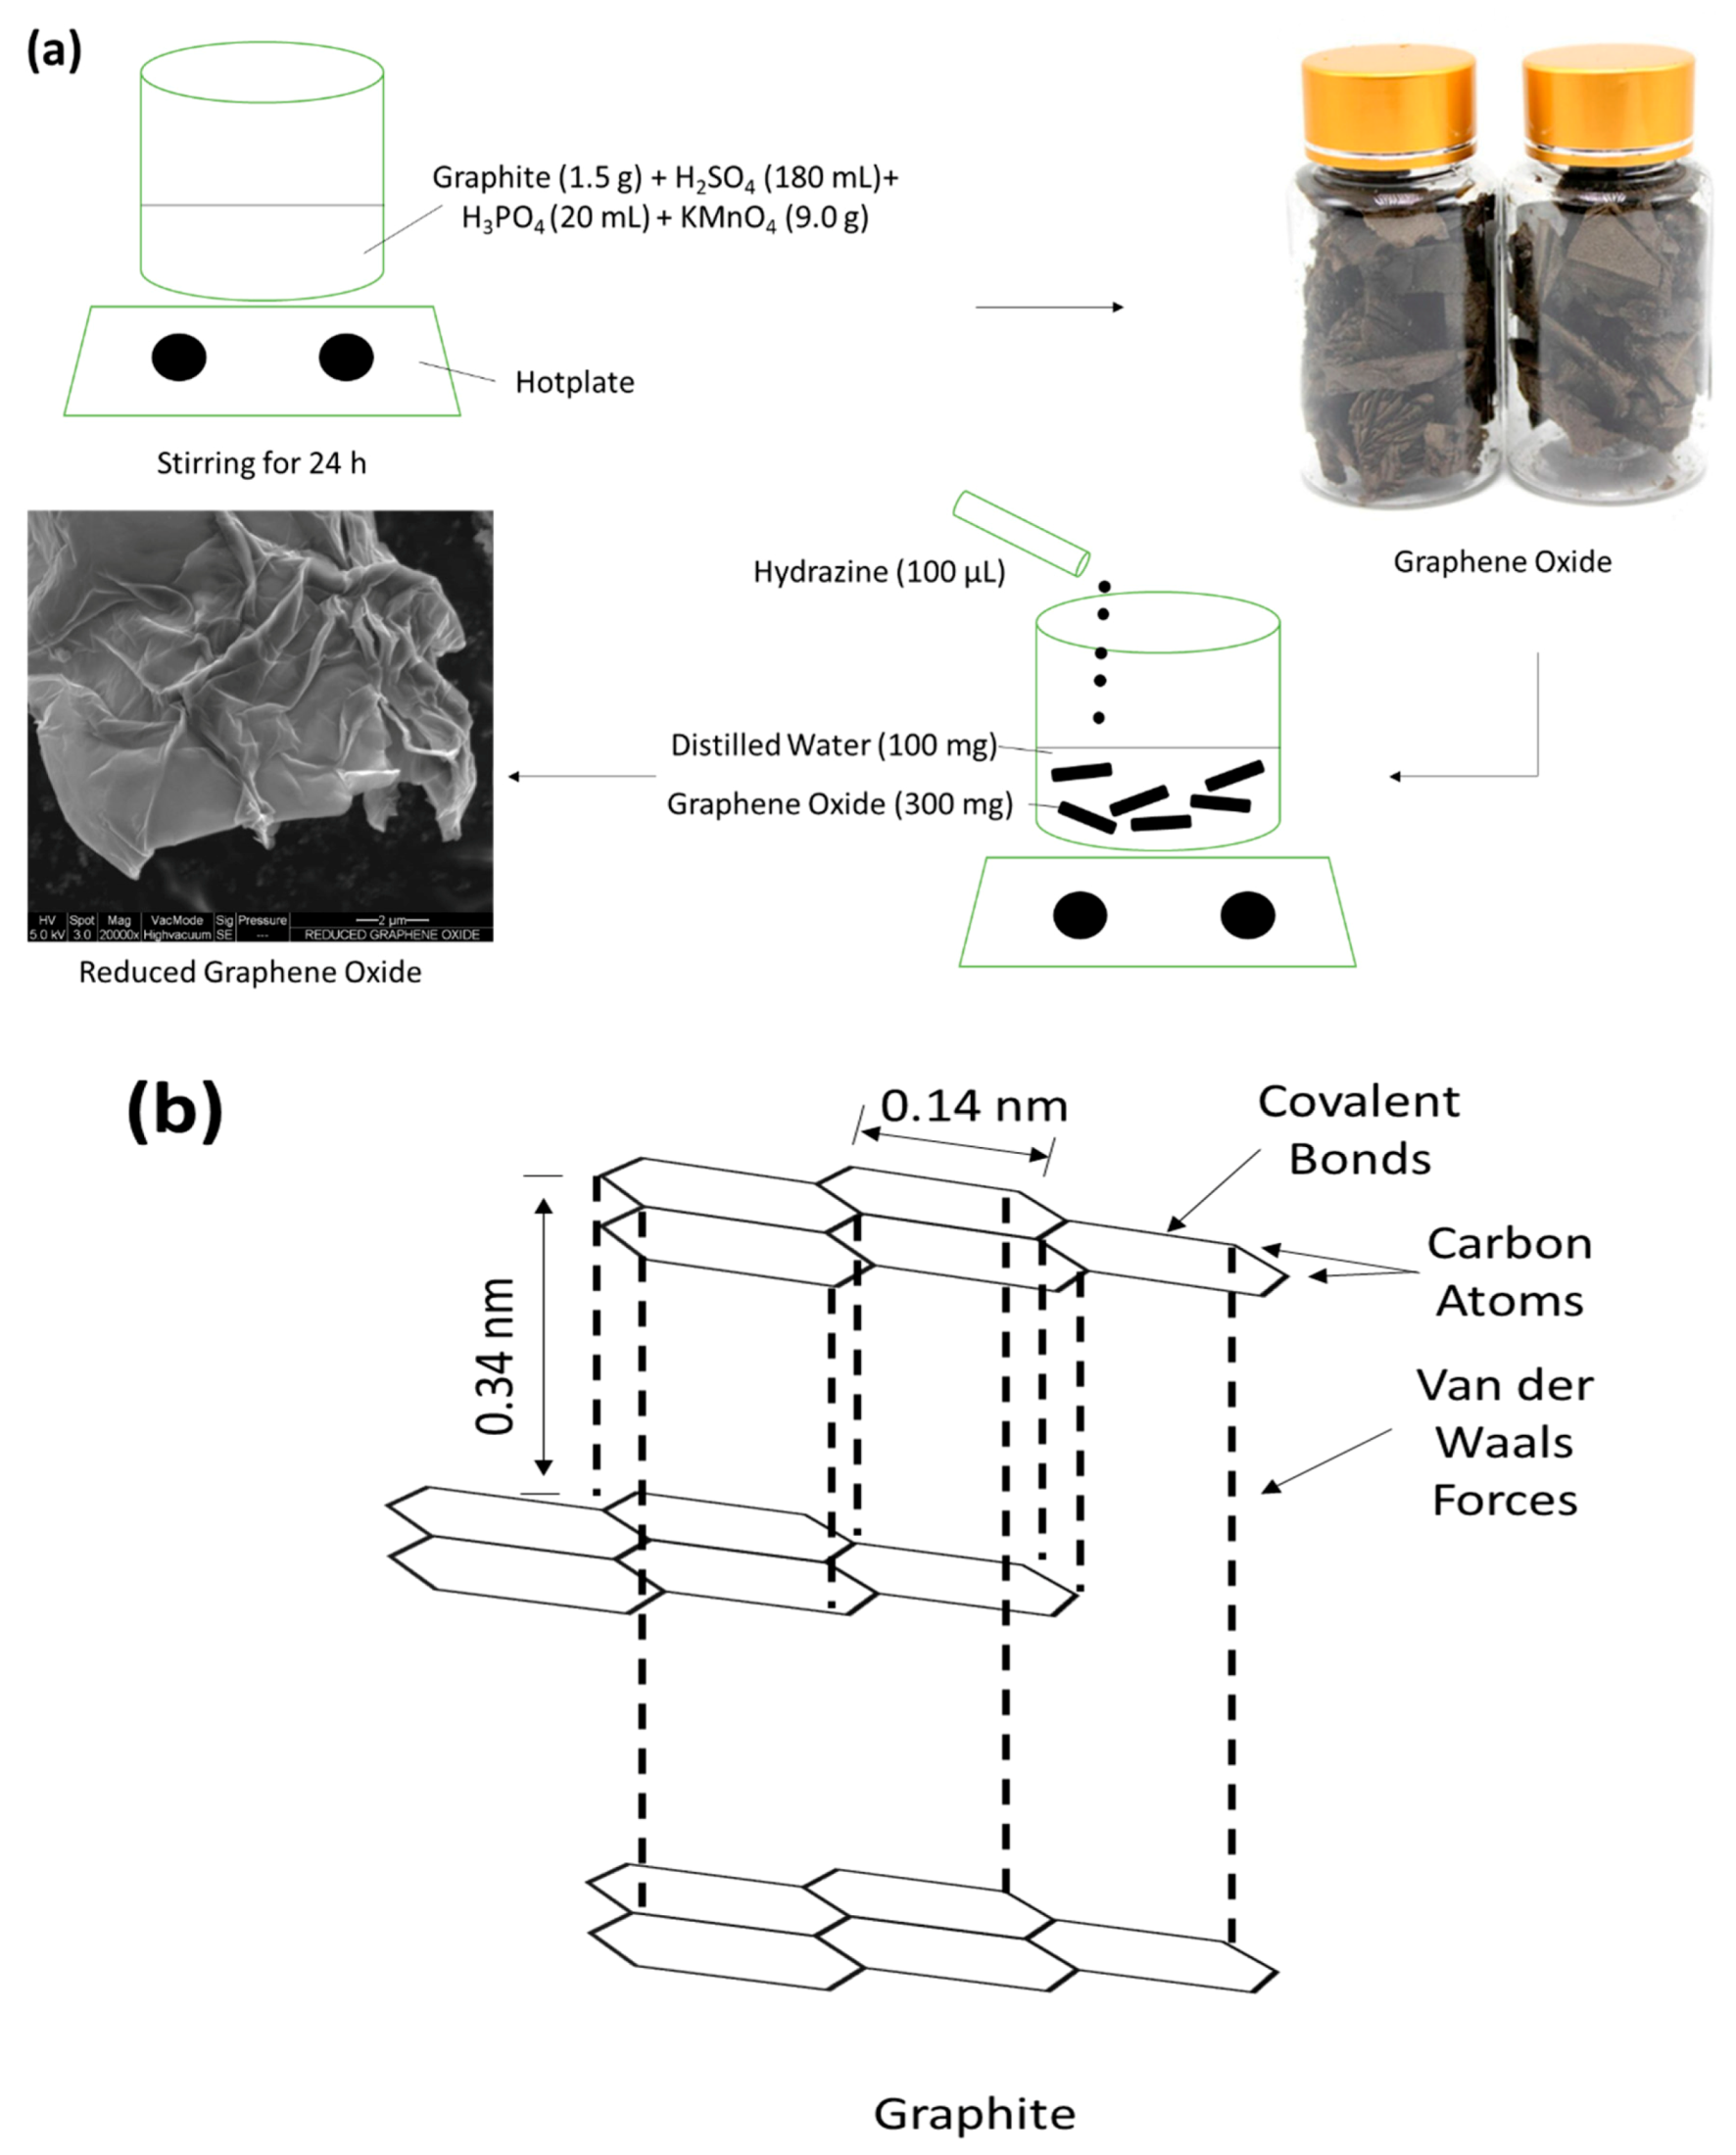
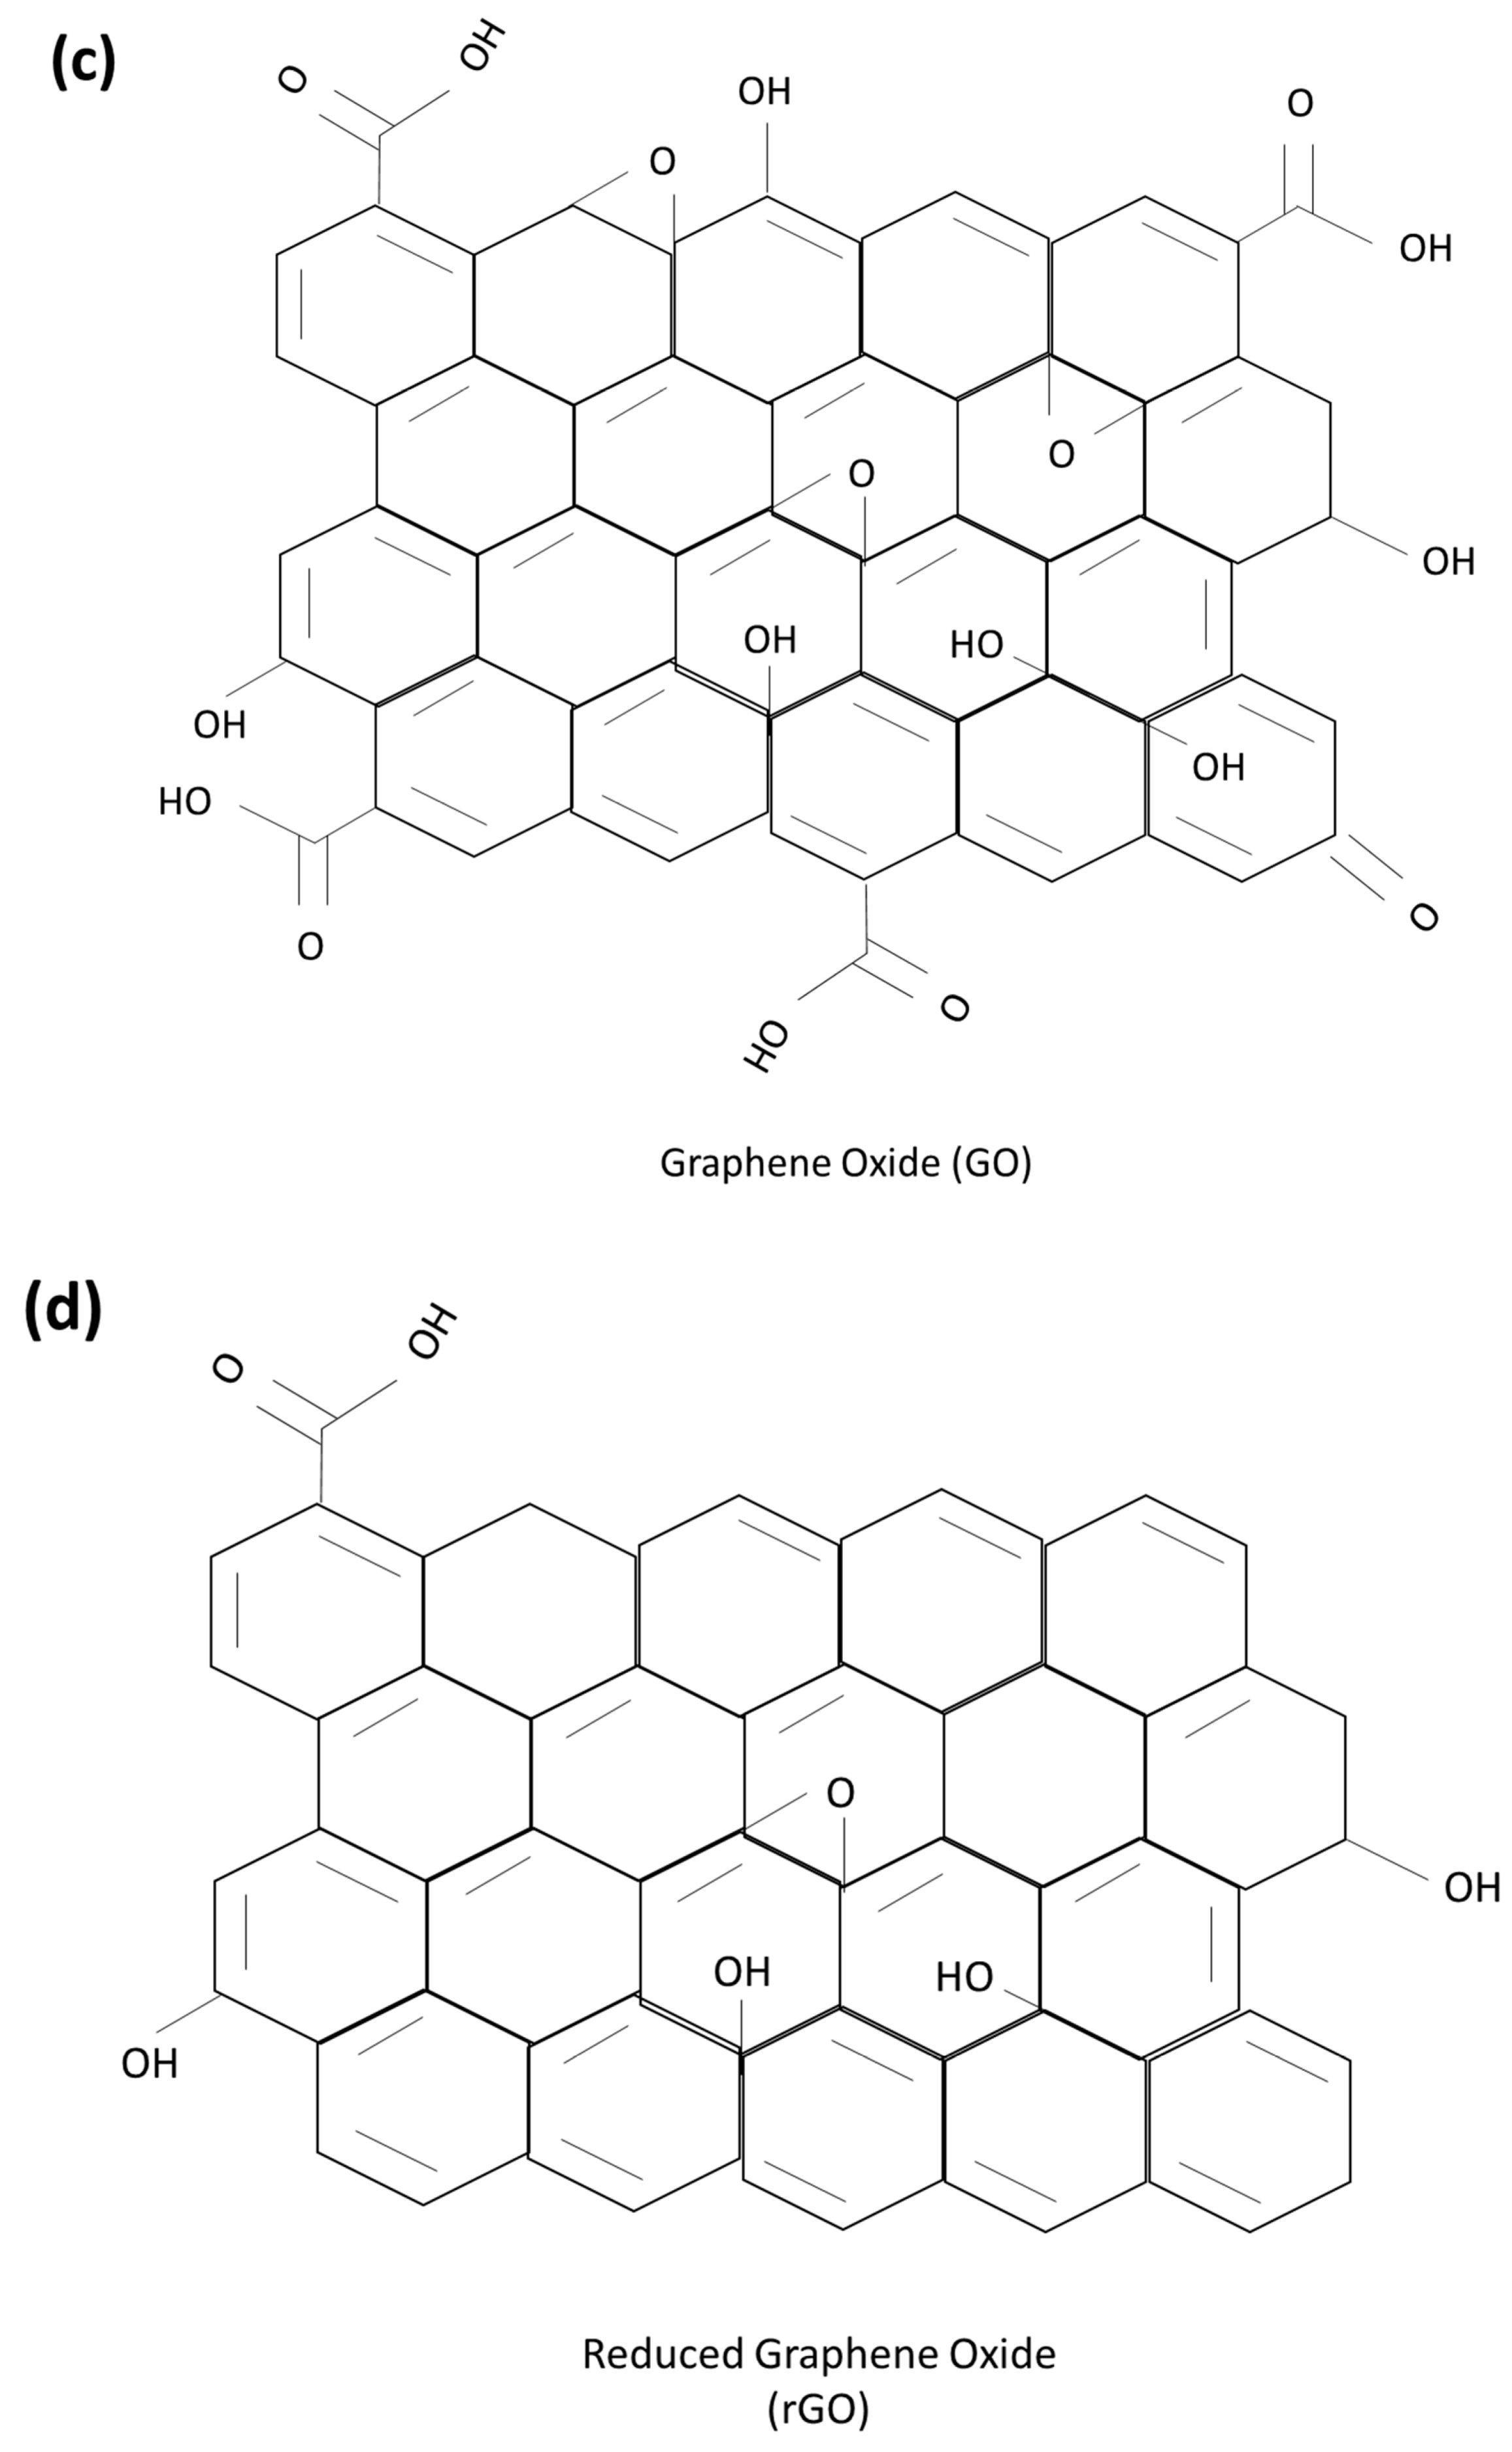
2.2. GO and rGO Preparation
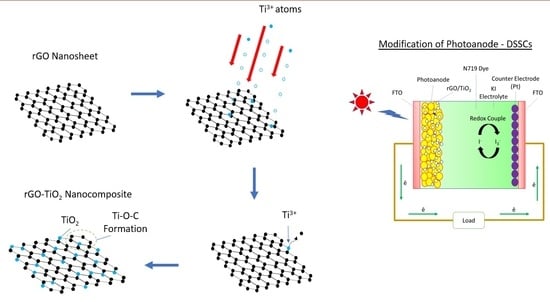
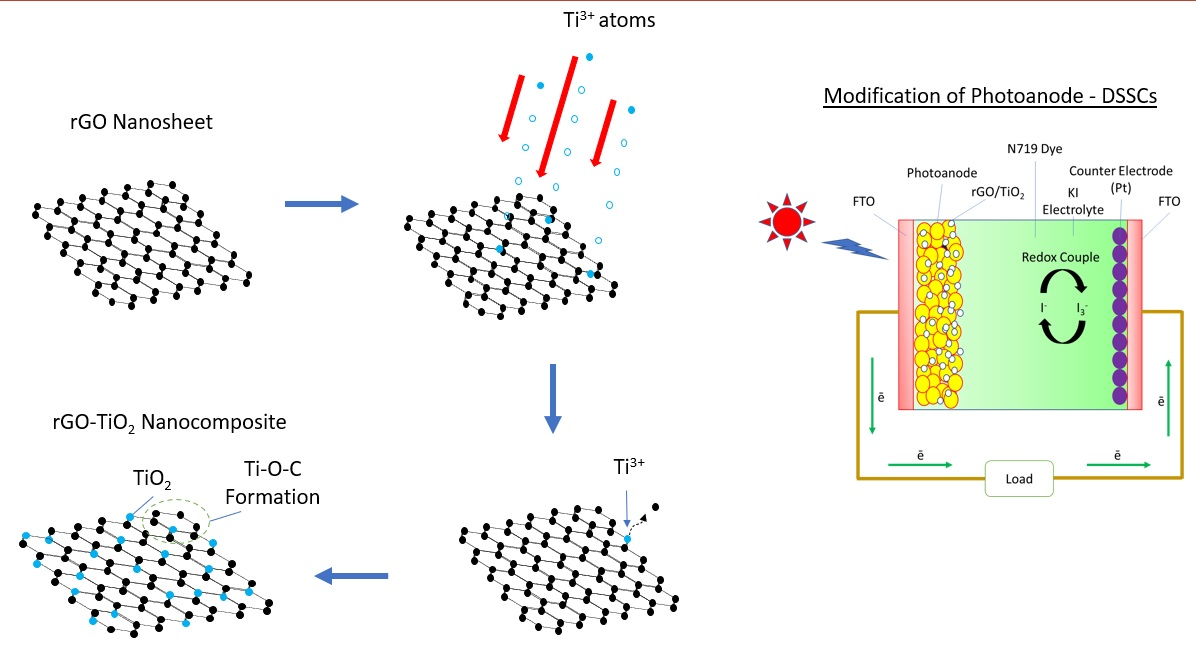
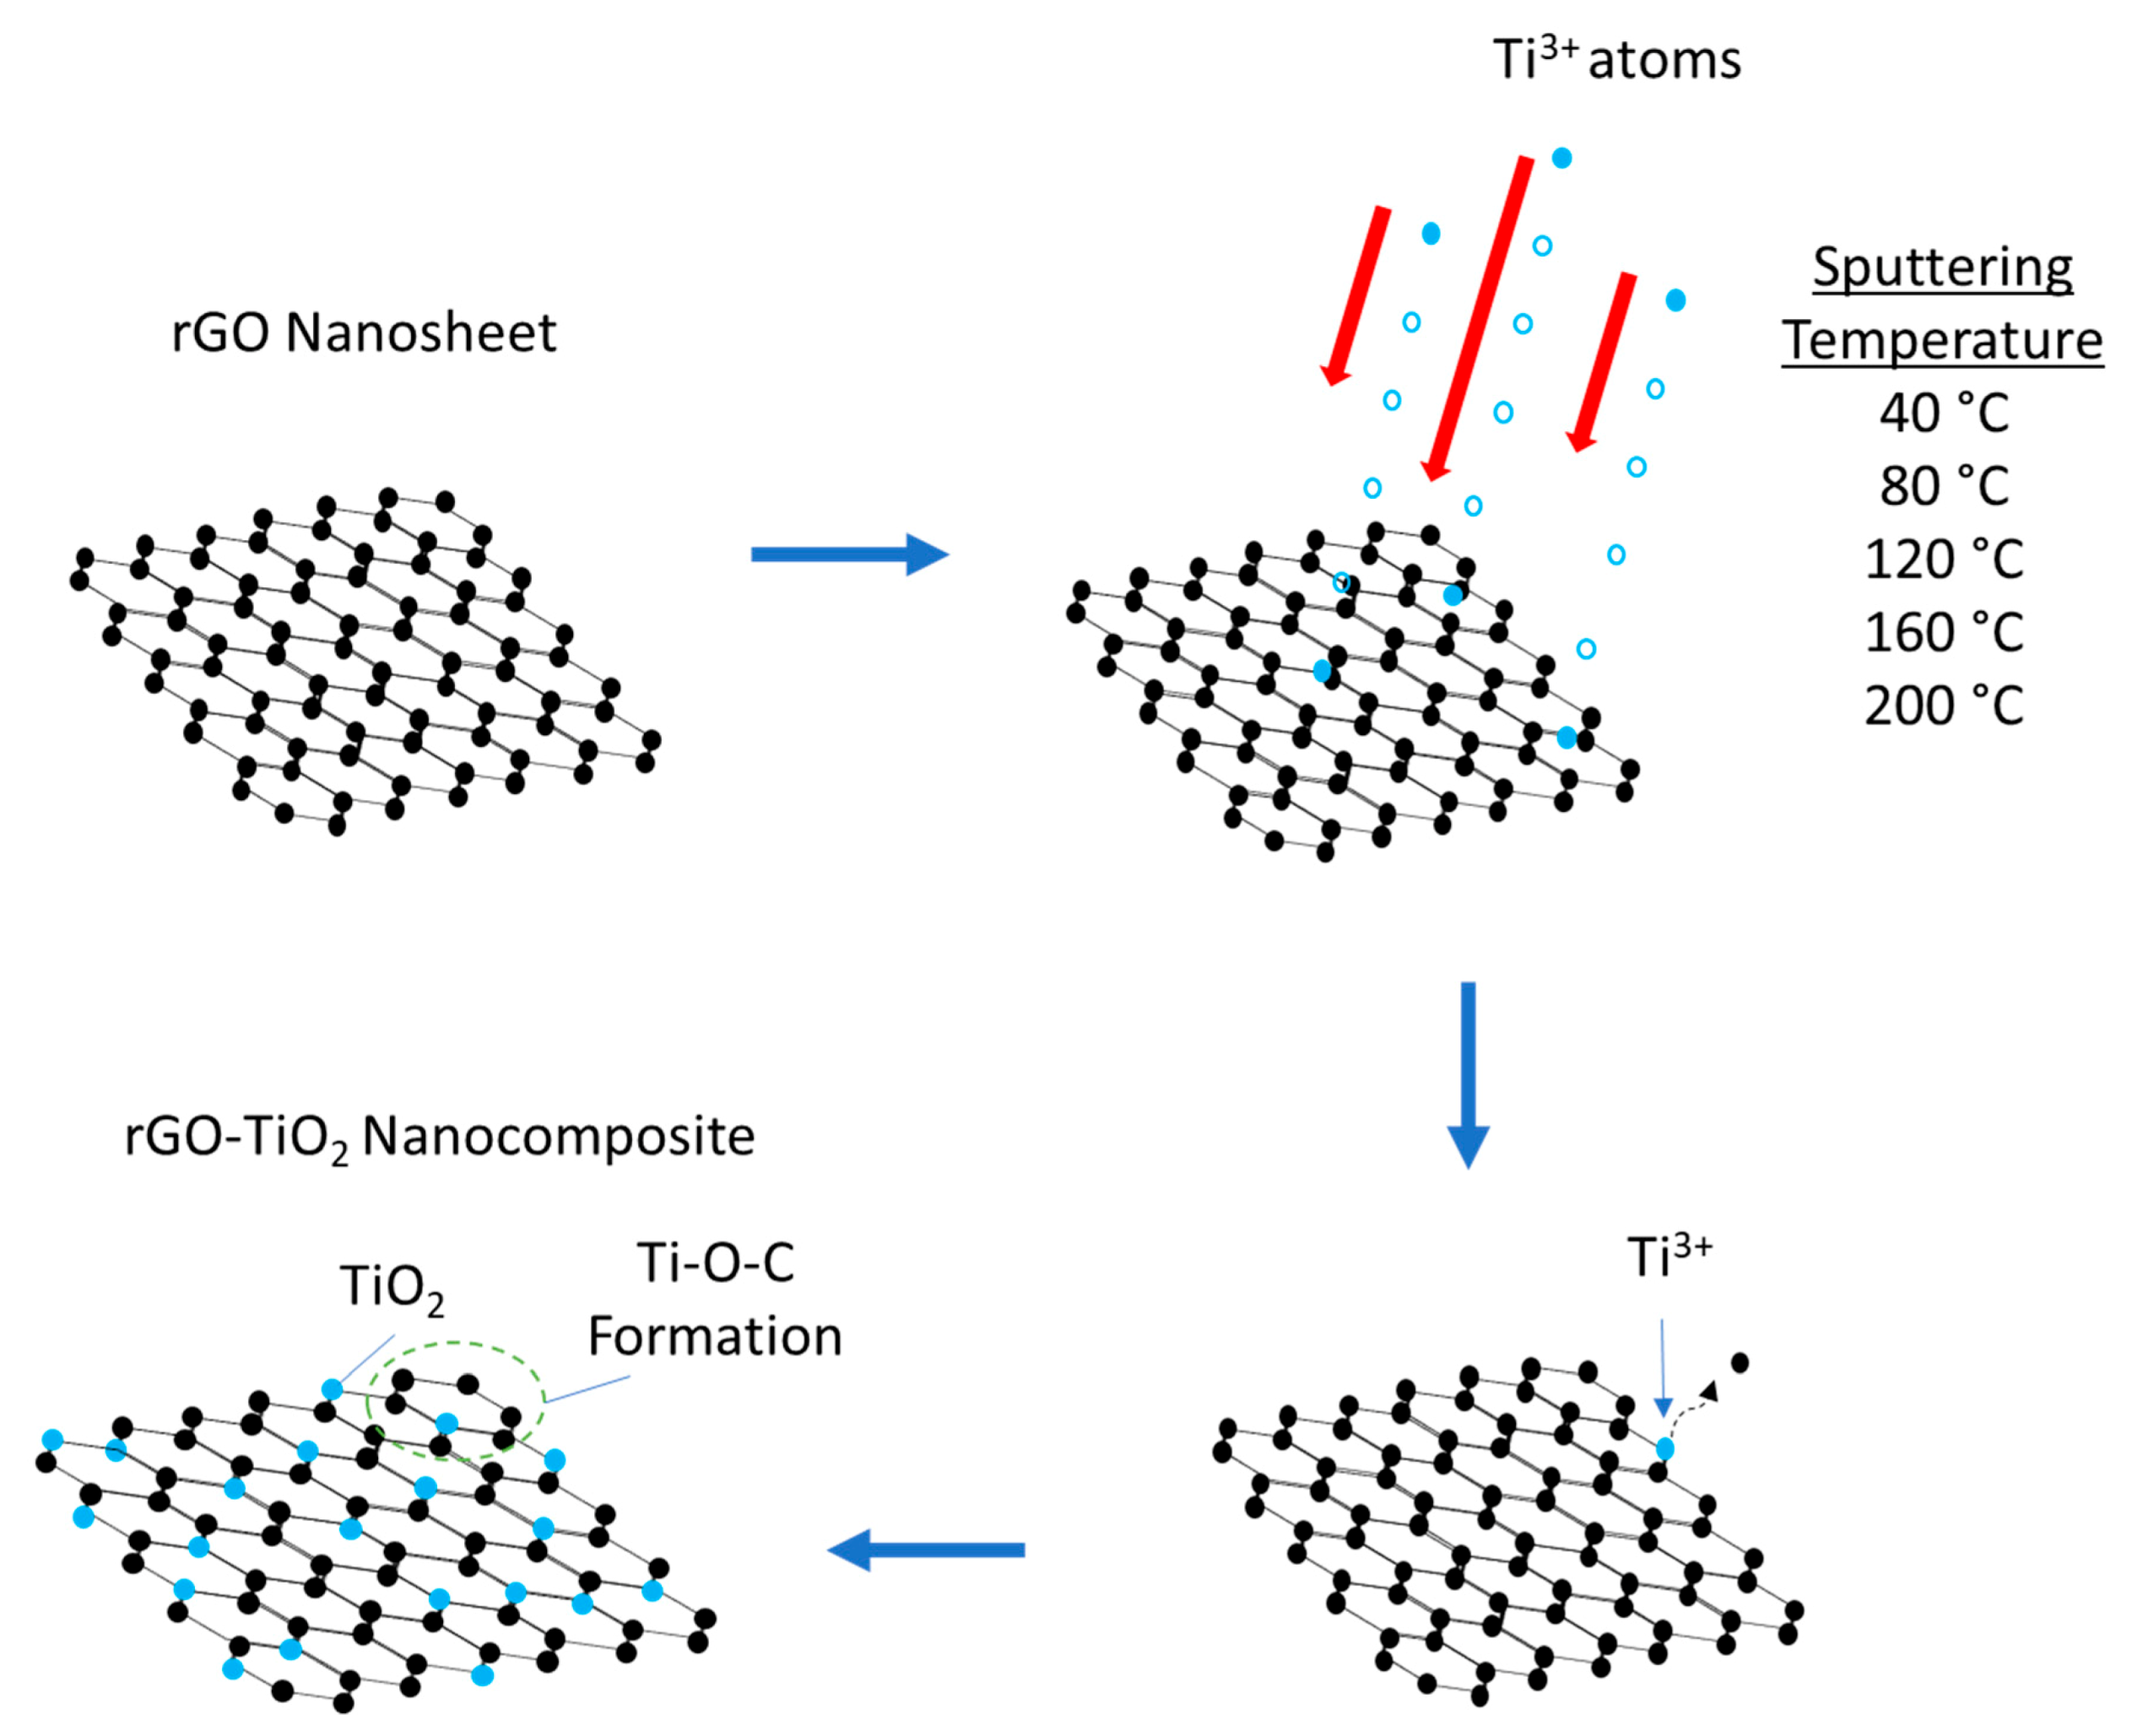
2.3. rGO-TiO2 Nanocomposite Formation
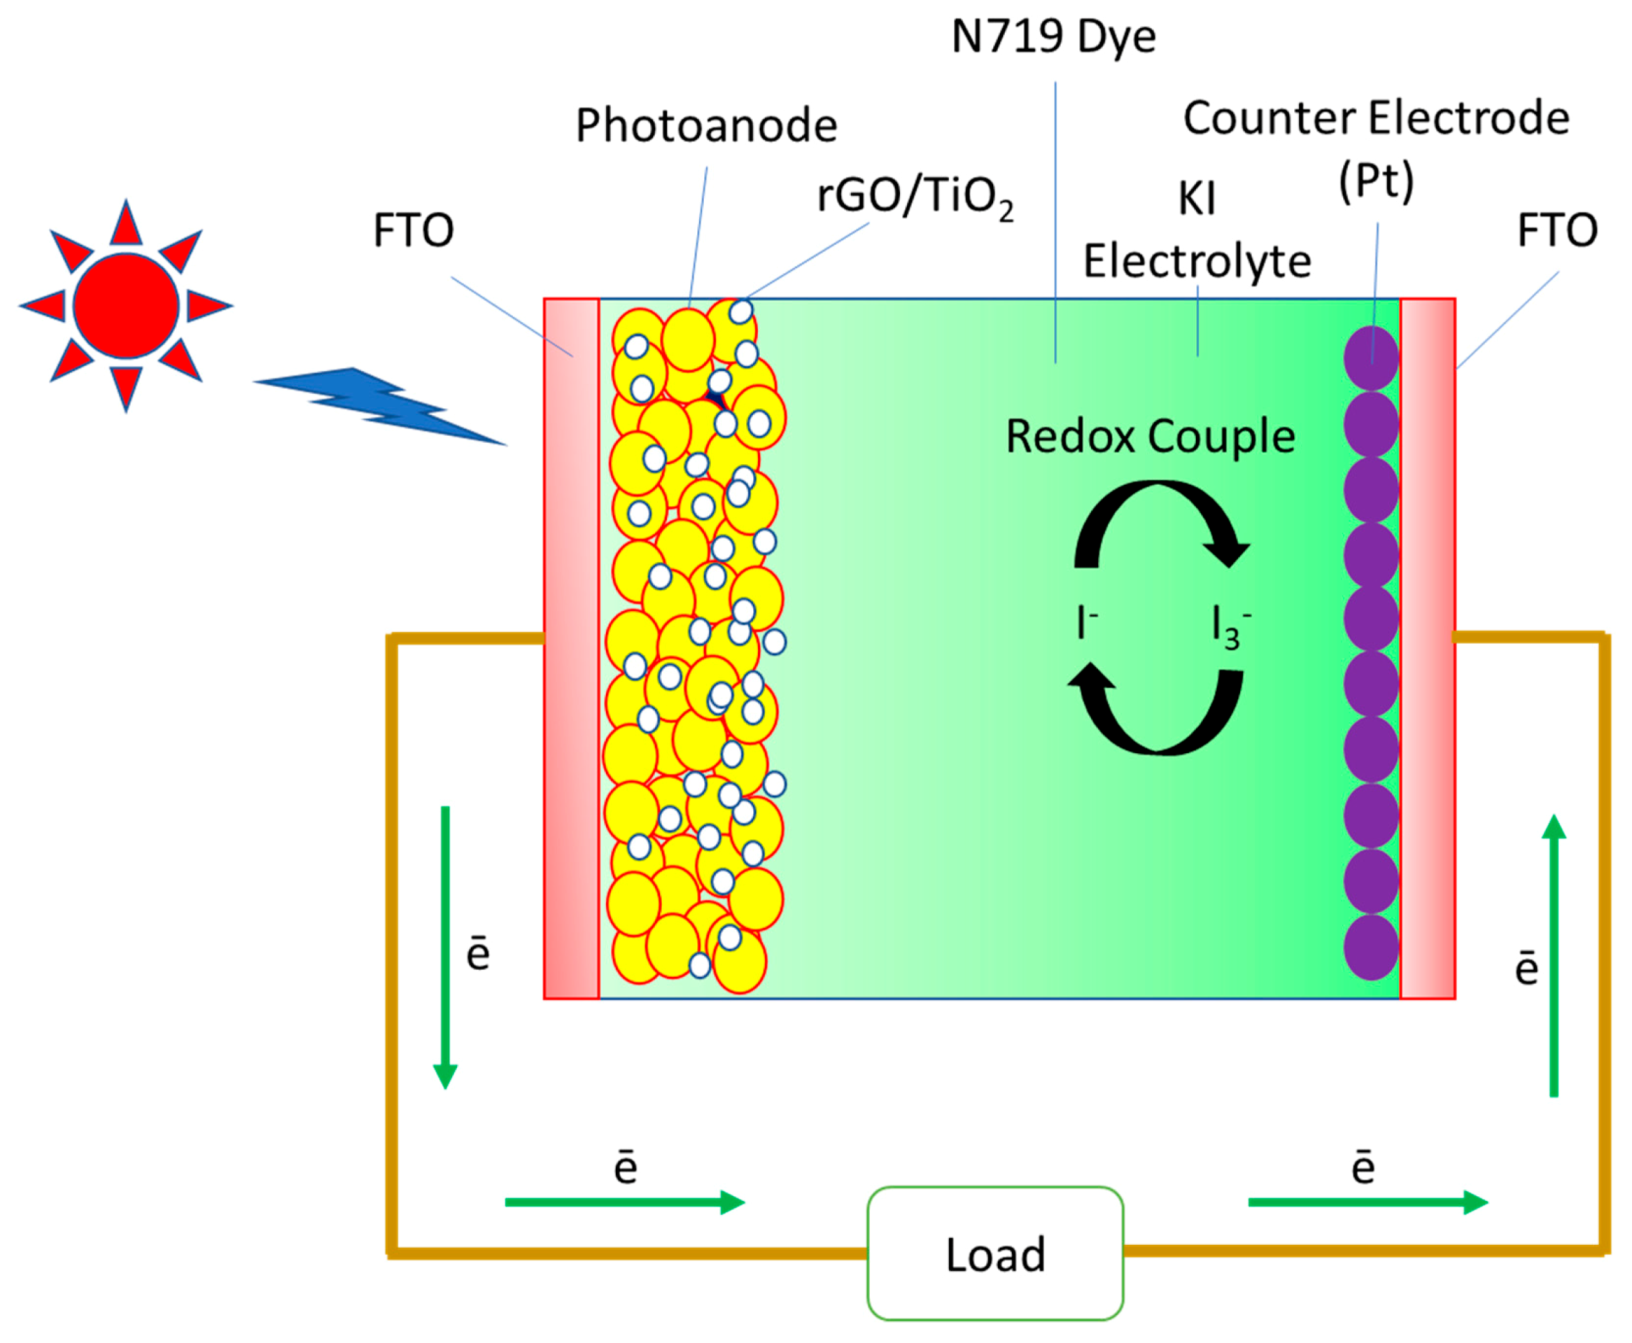
2.4. DSSCs Fabrication
2.5. Characterization
3. Results and Discussion
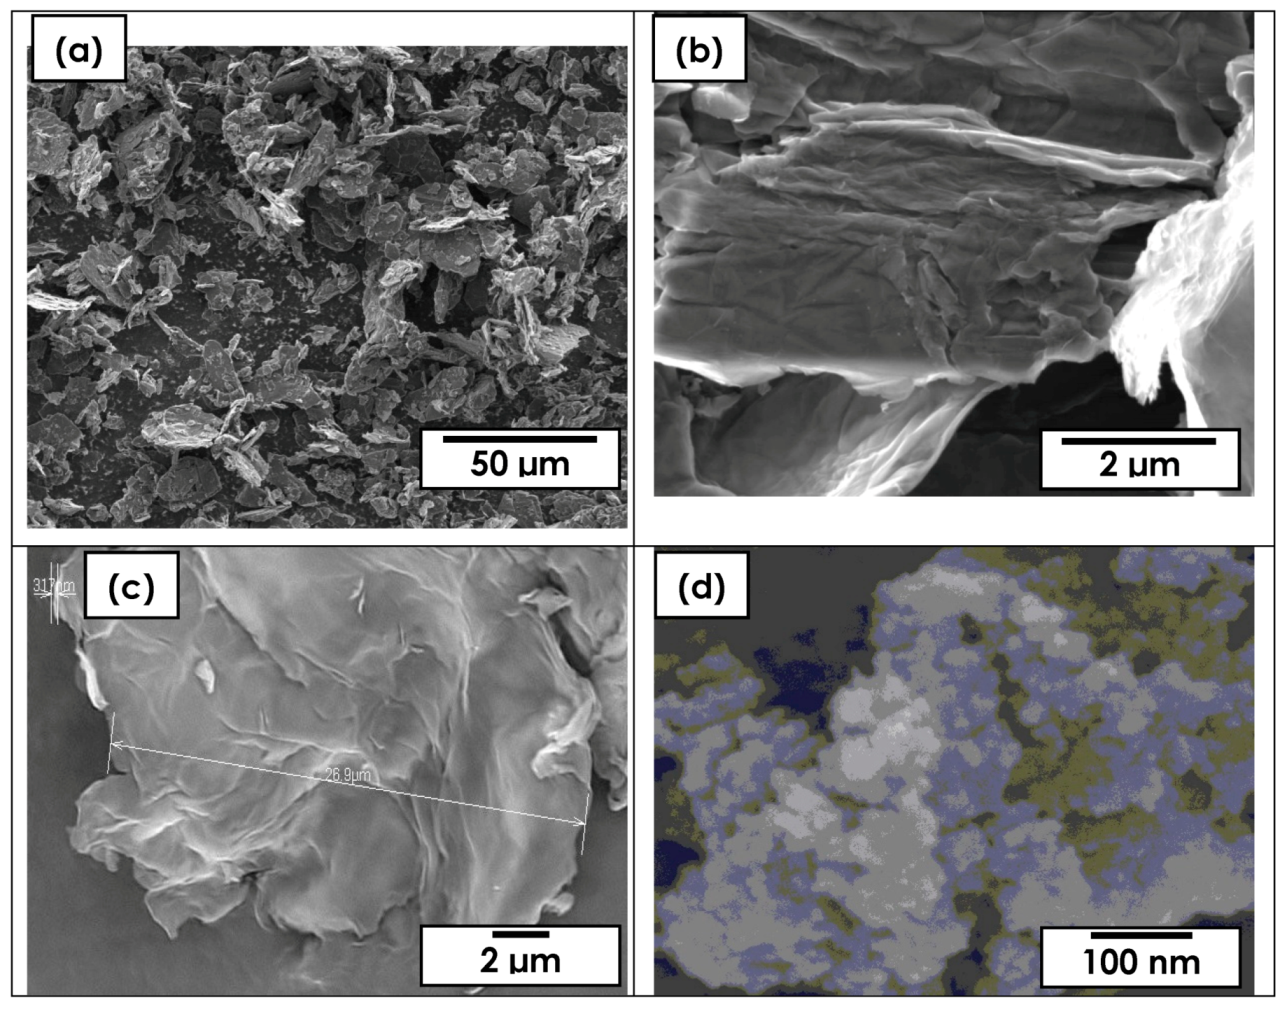
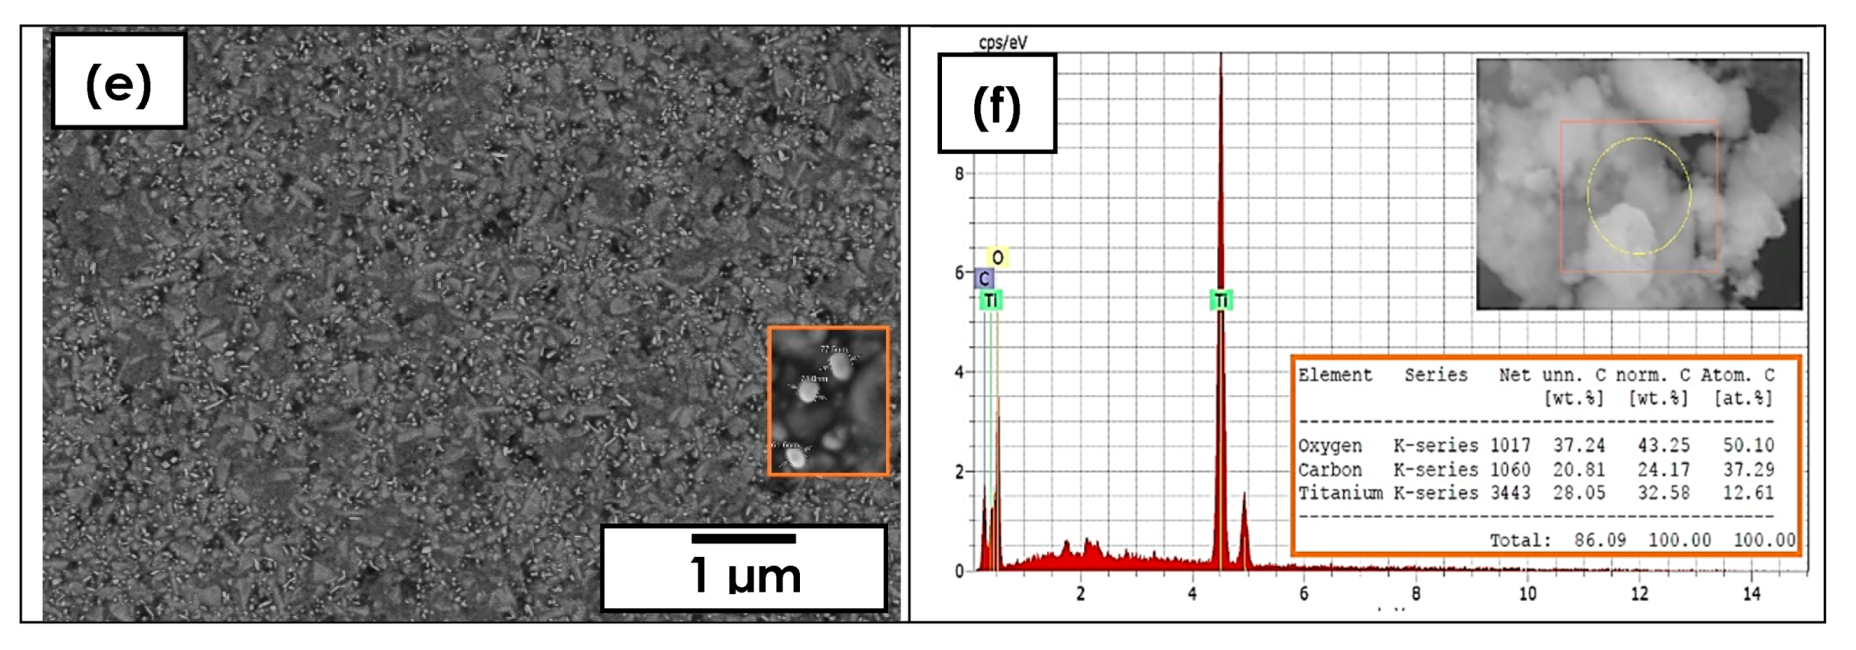
3.1. Morphology
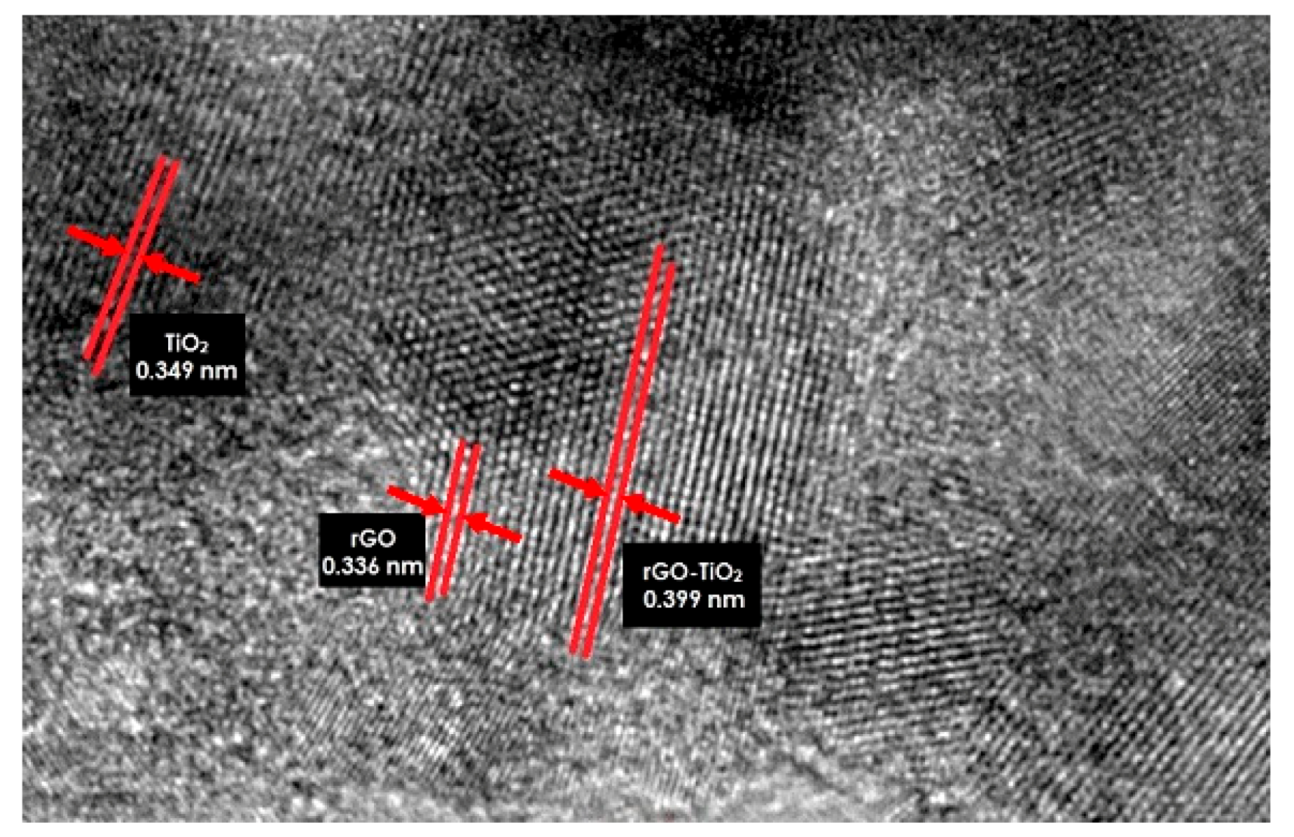
3.2. HRTEM
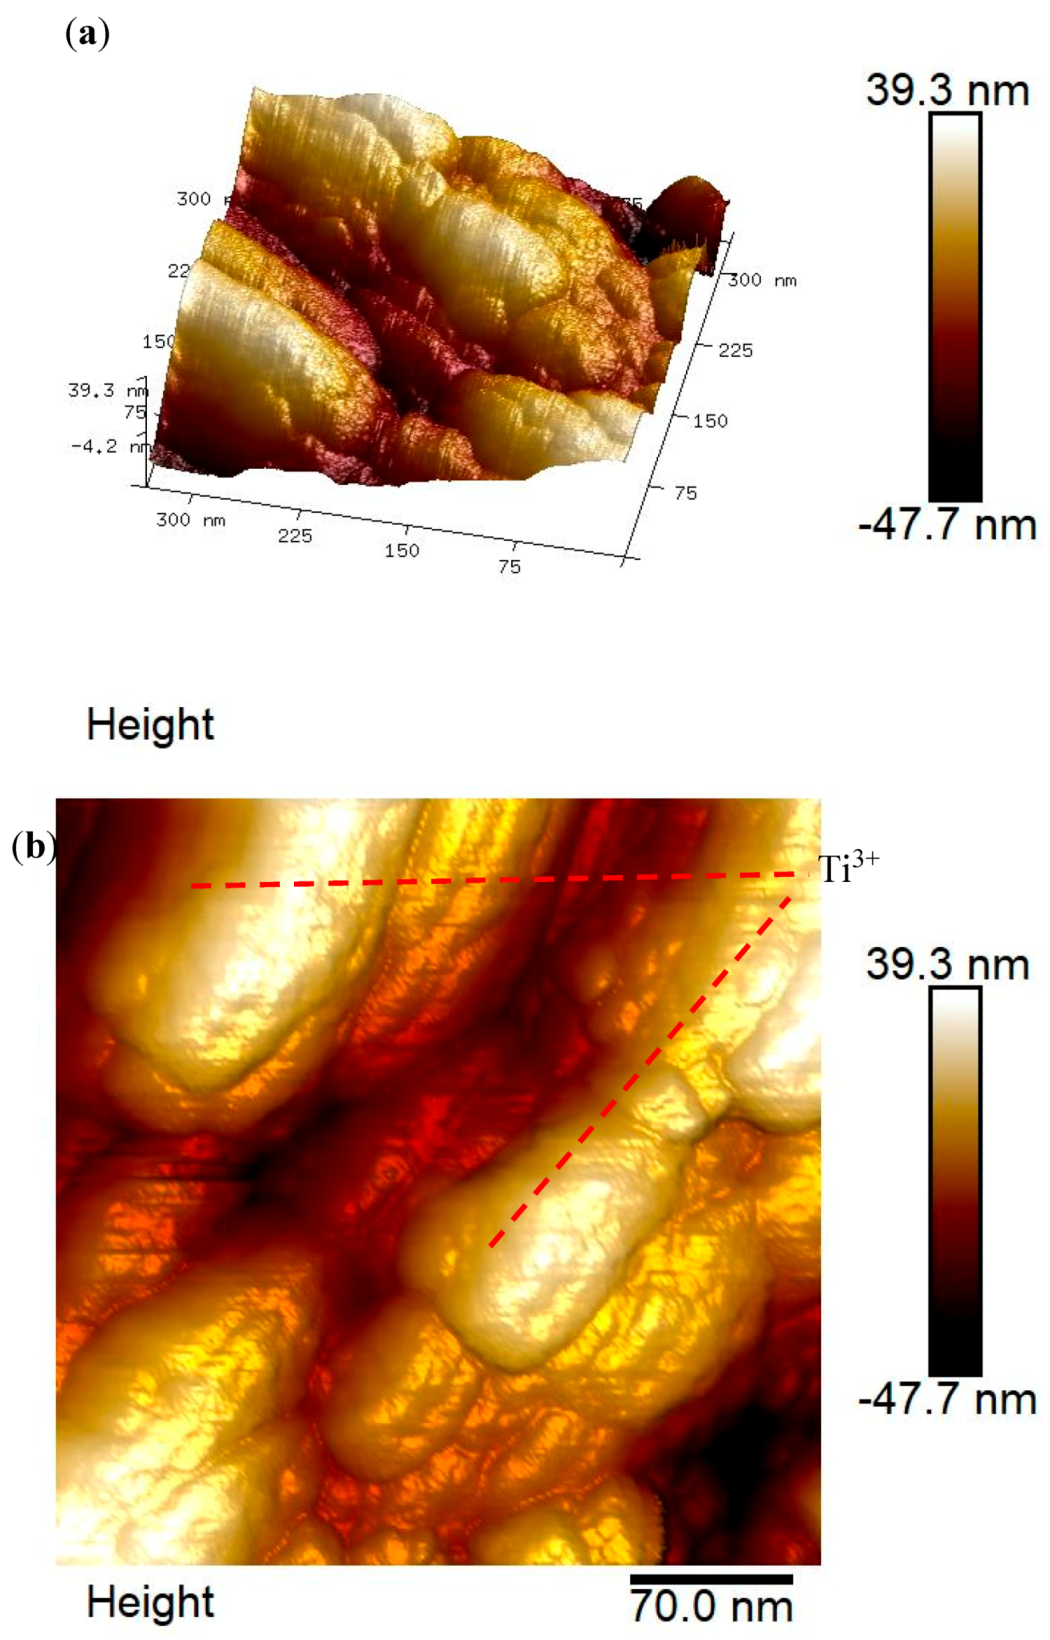
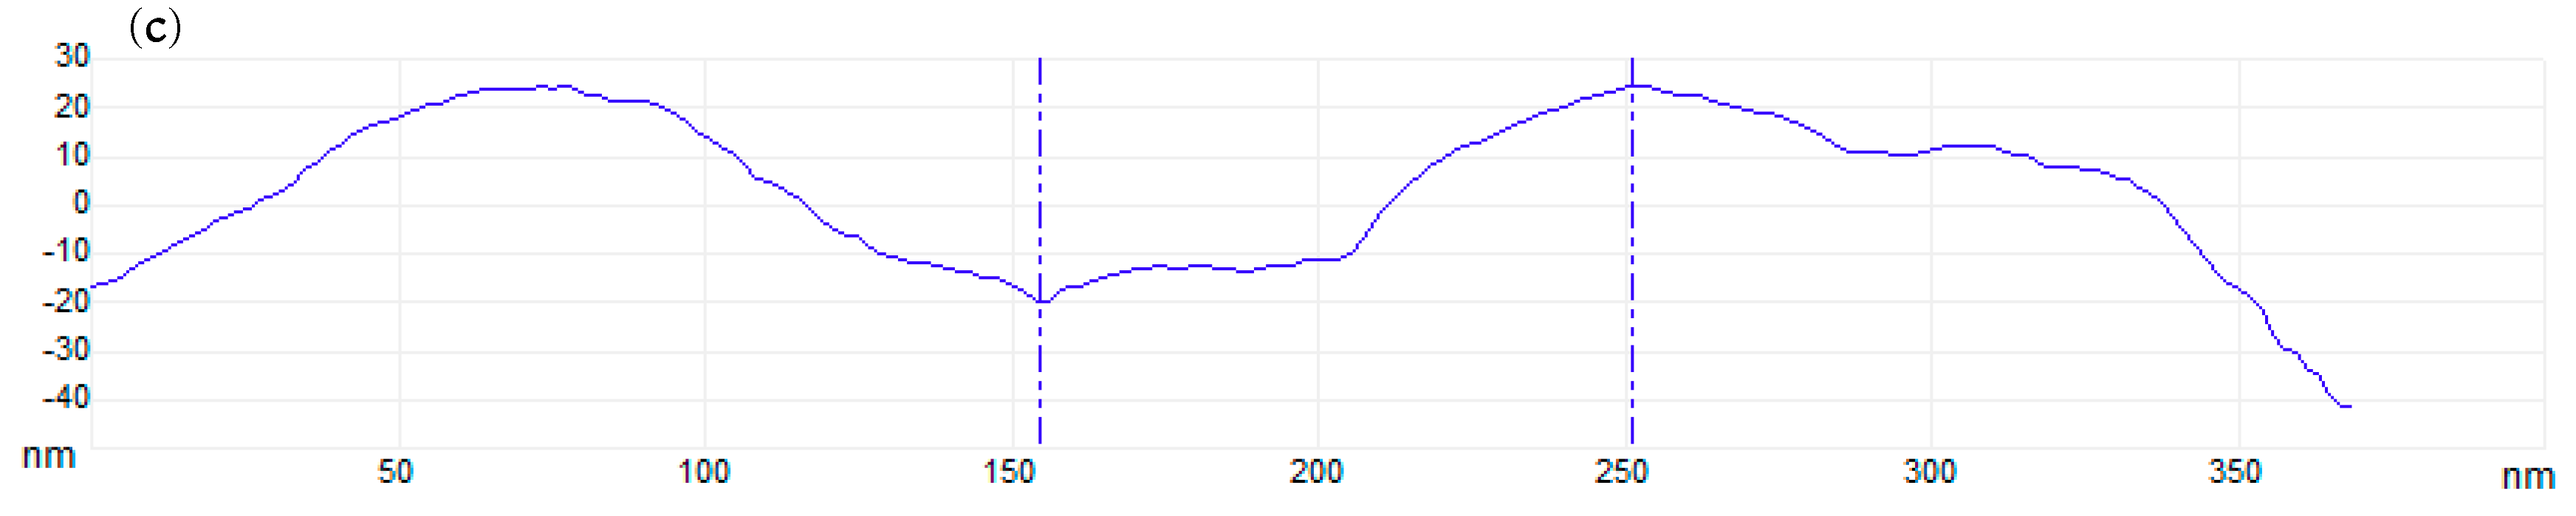
3.3. AFM
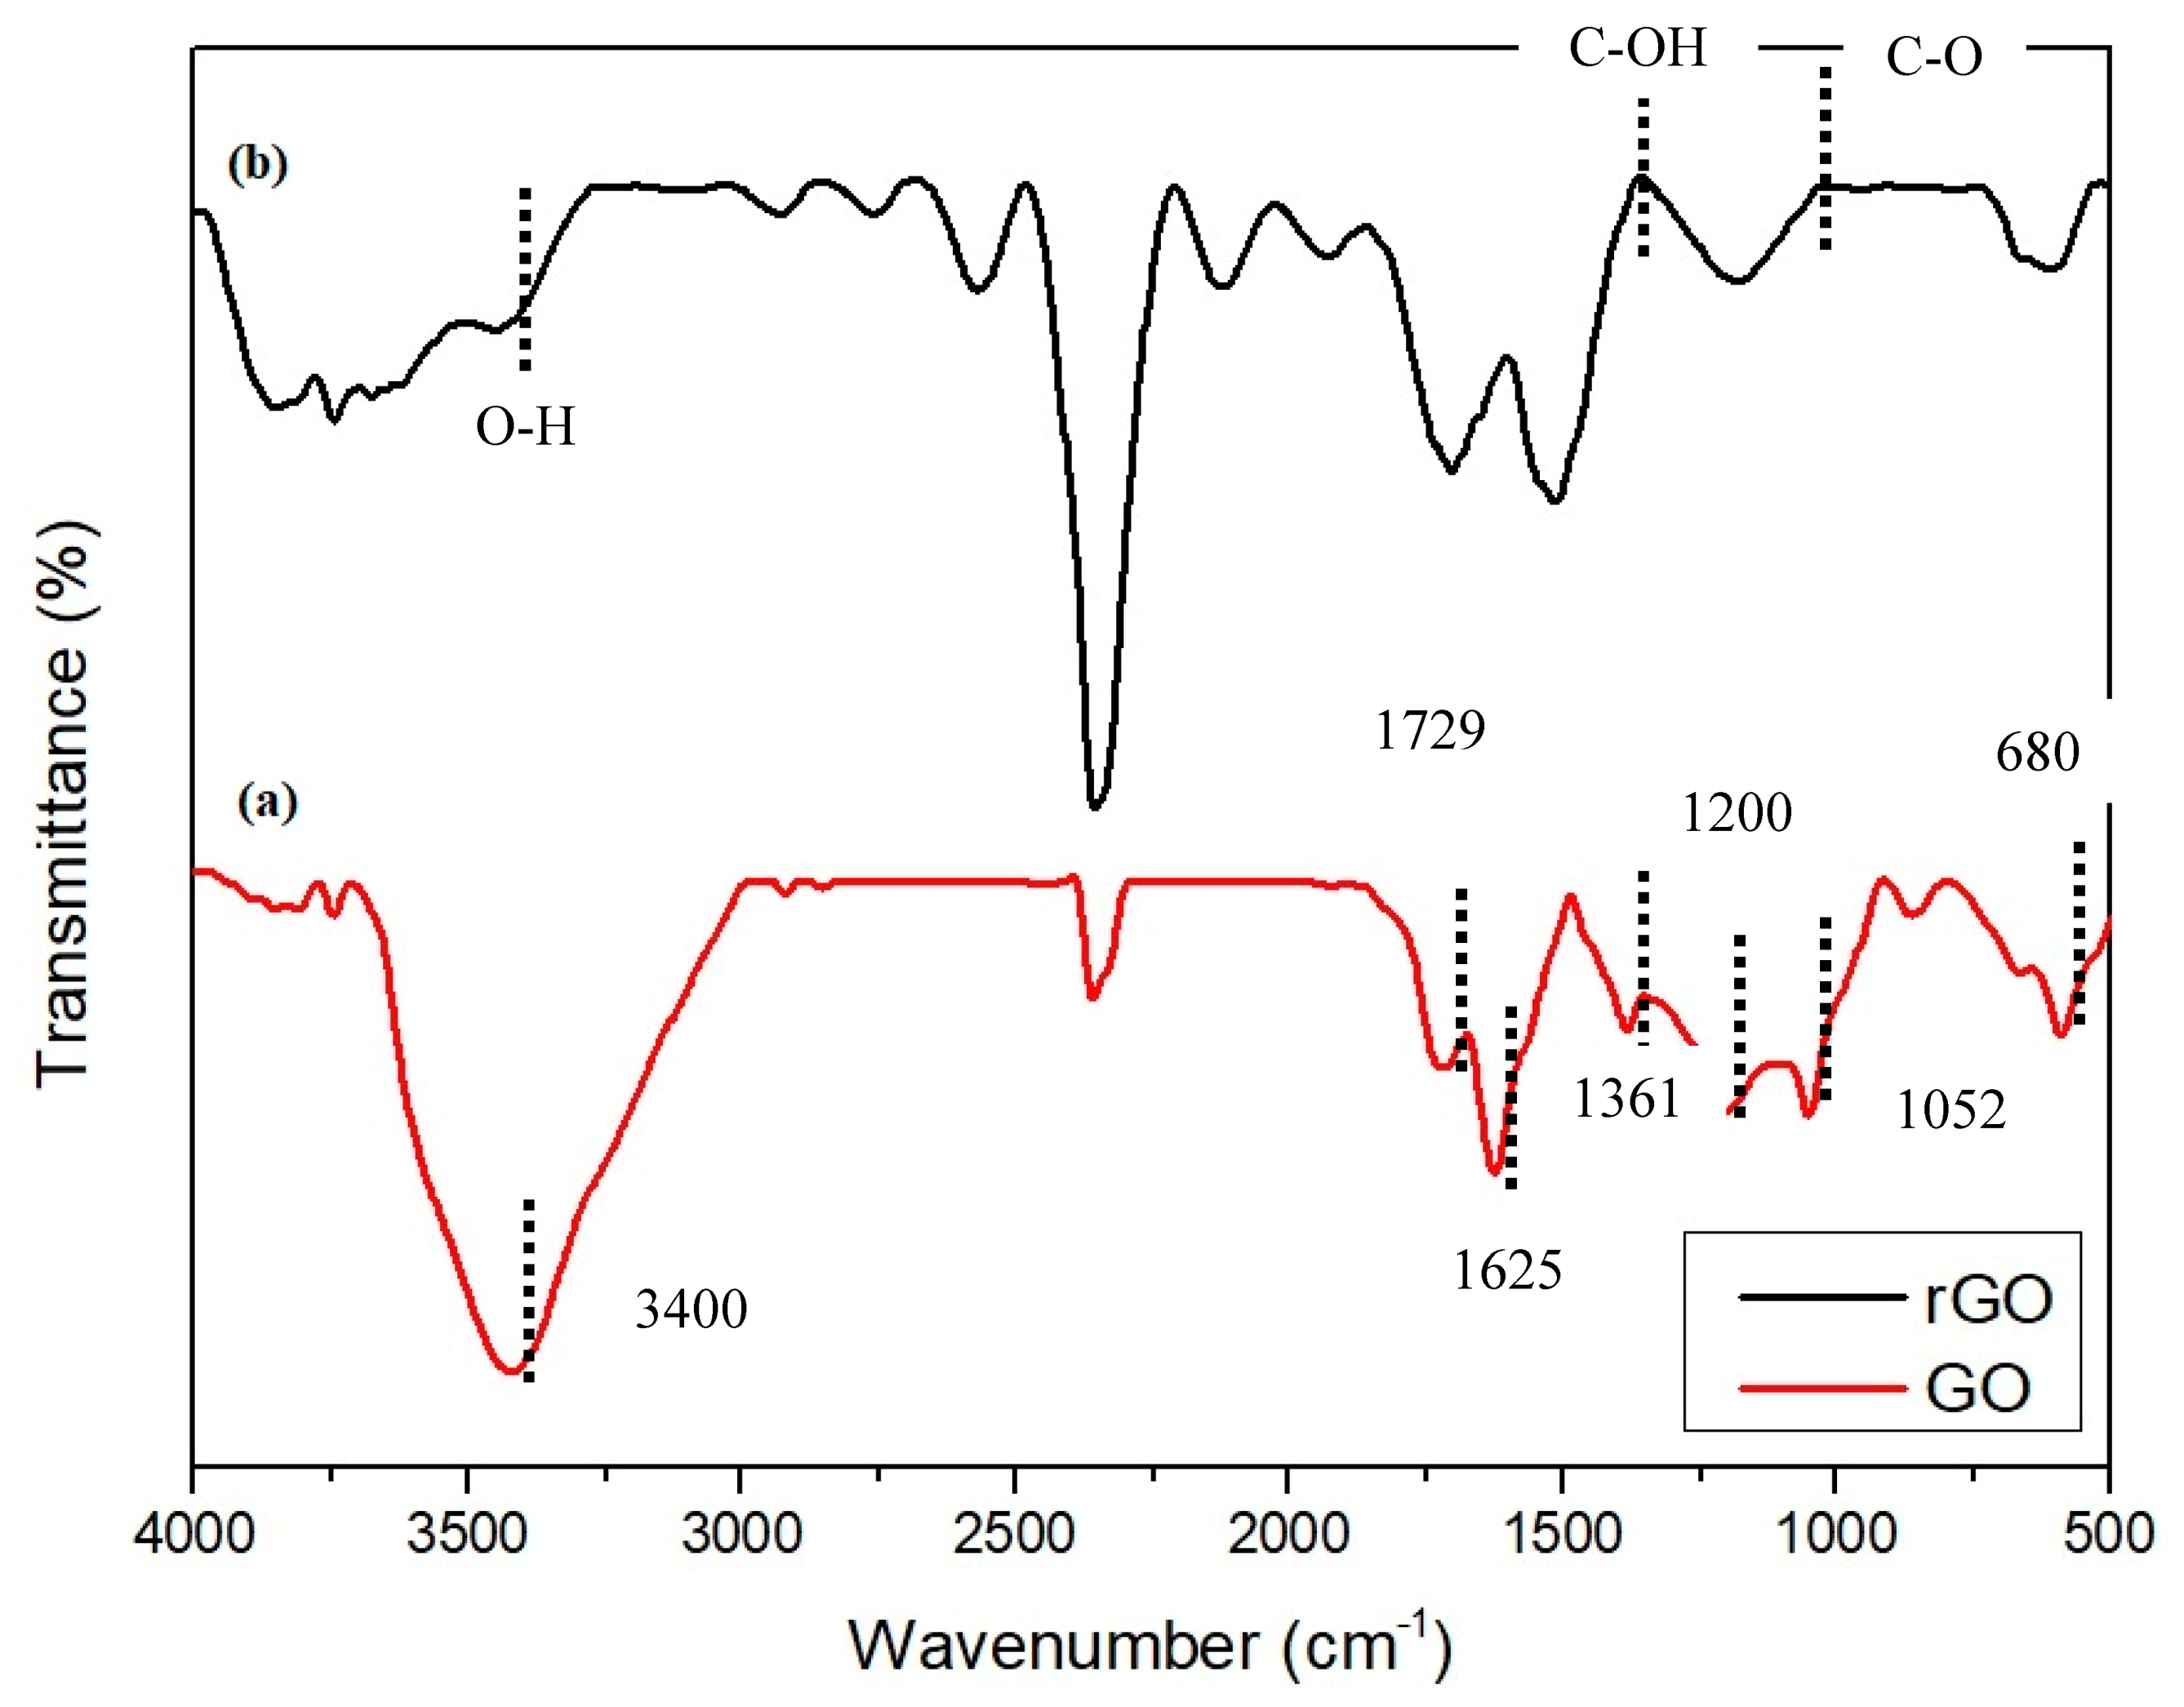
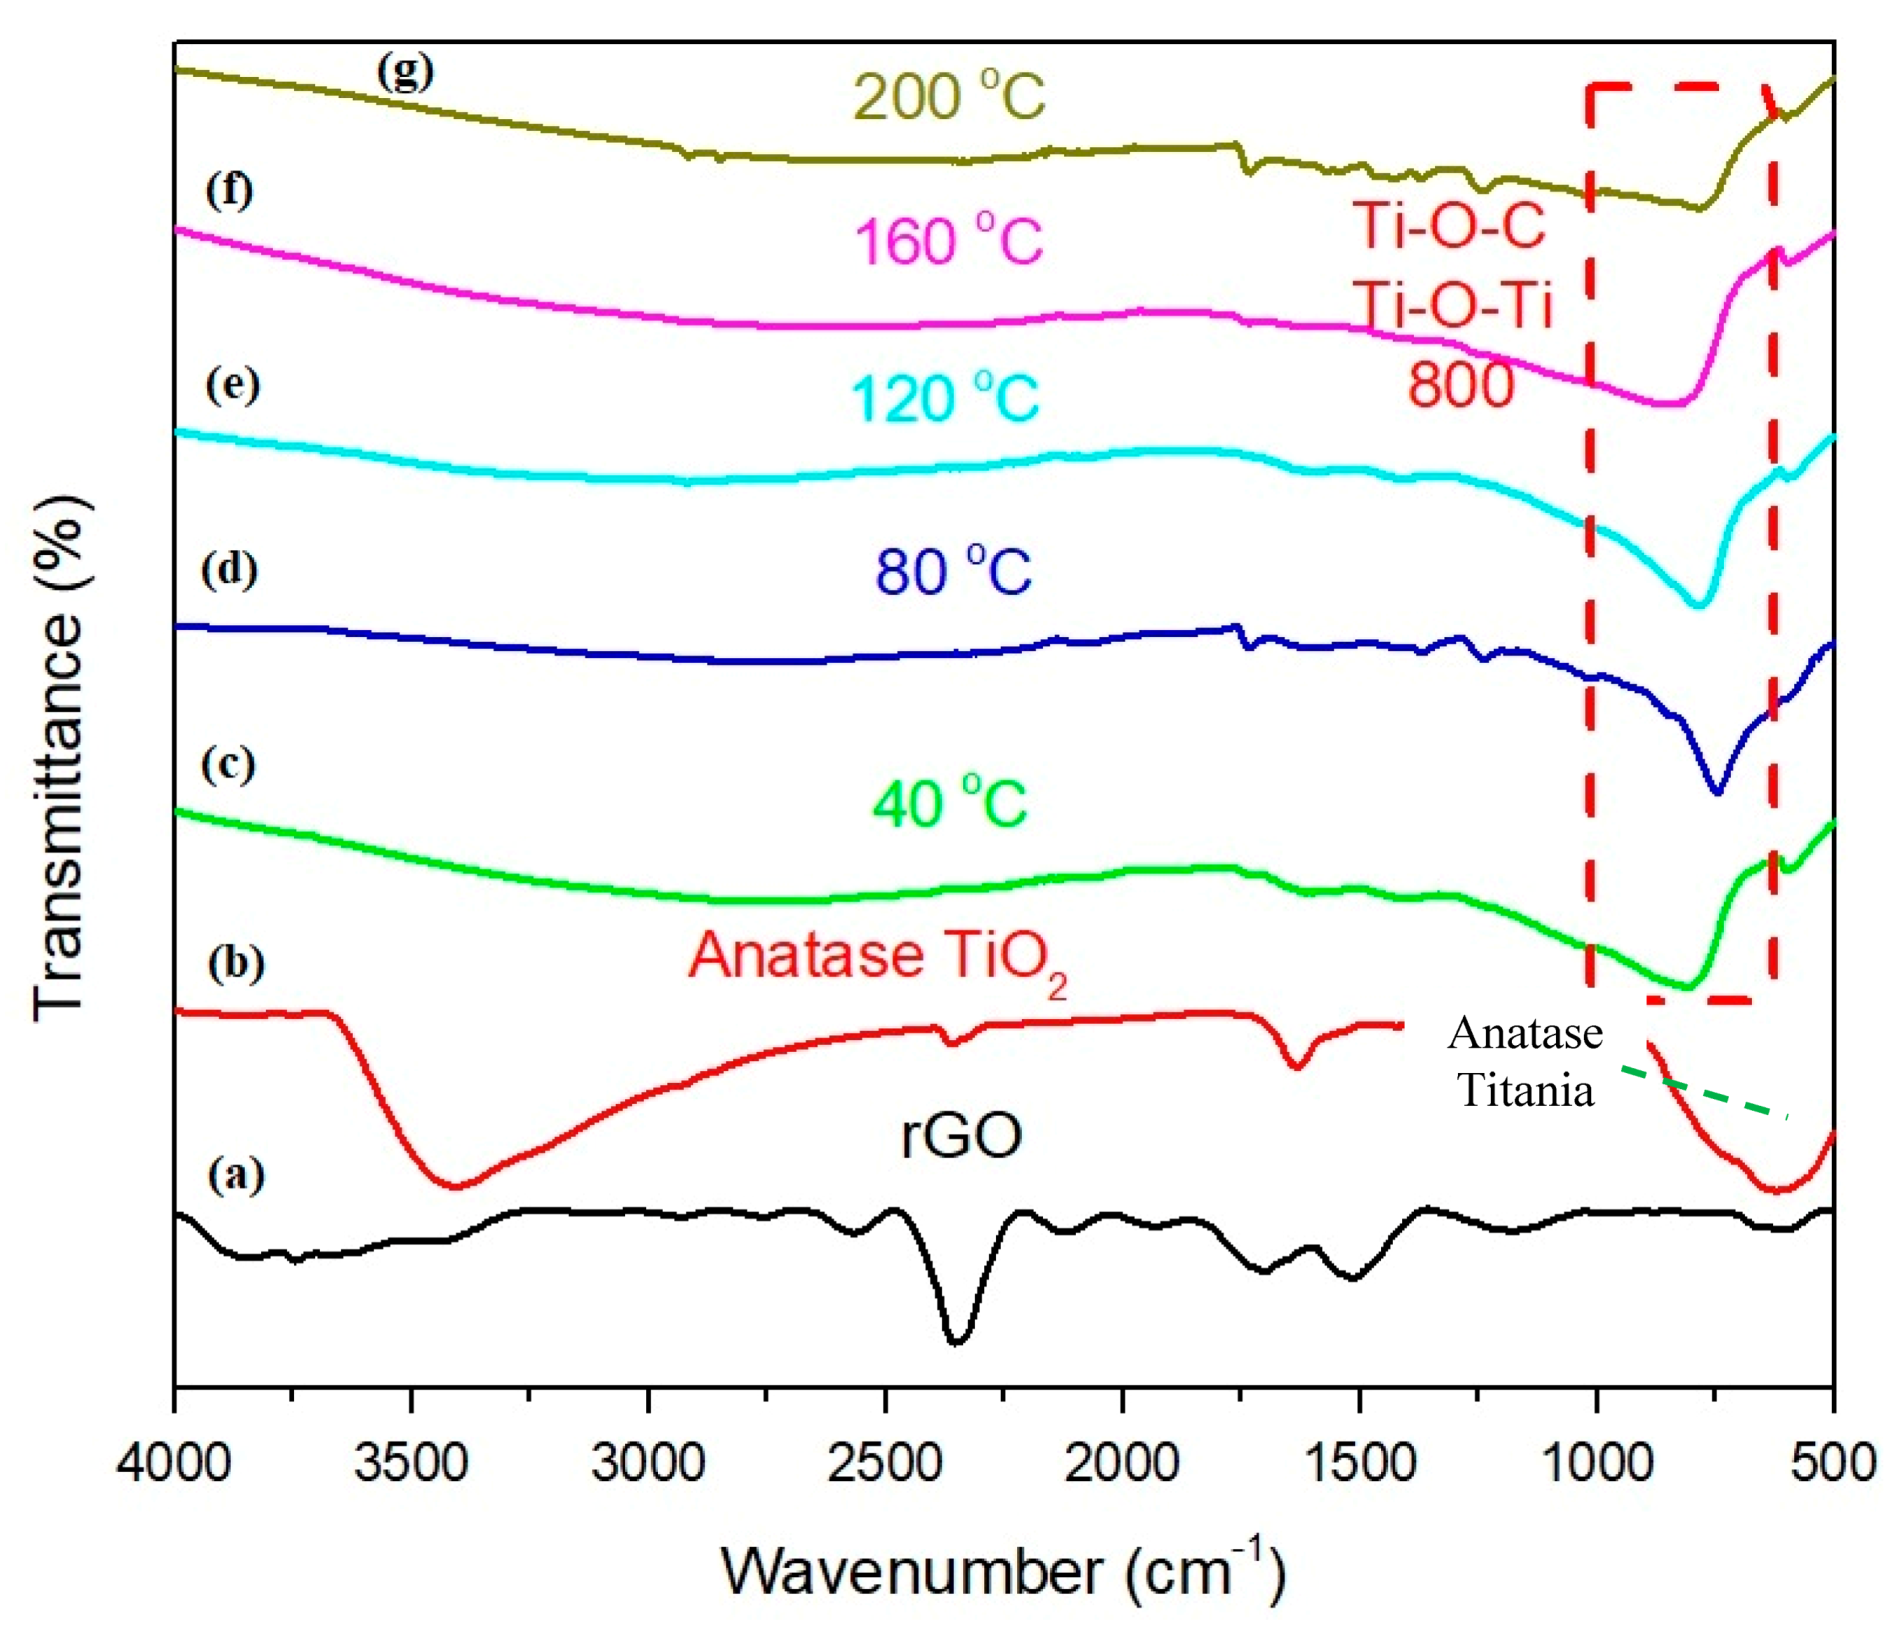
3.4. FTIR
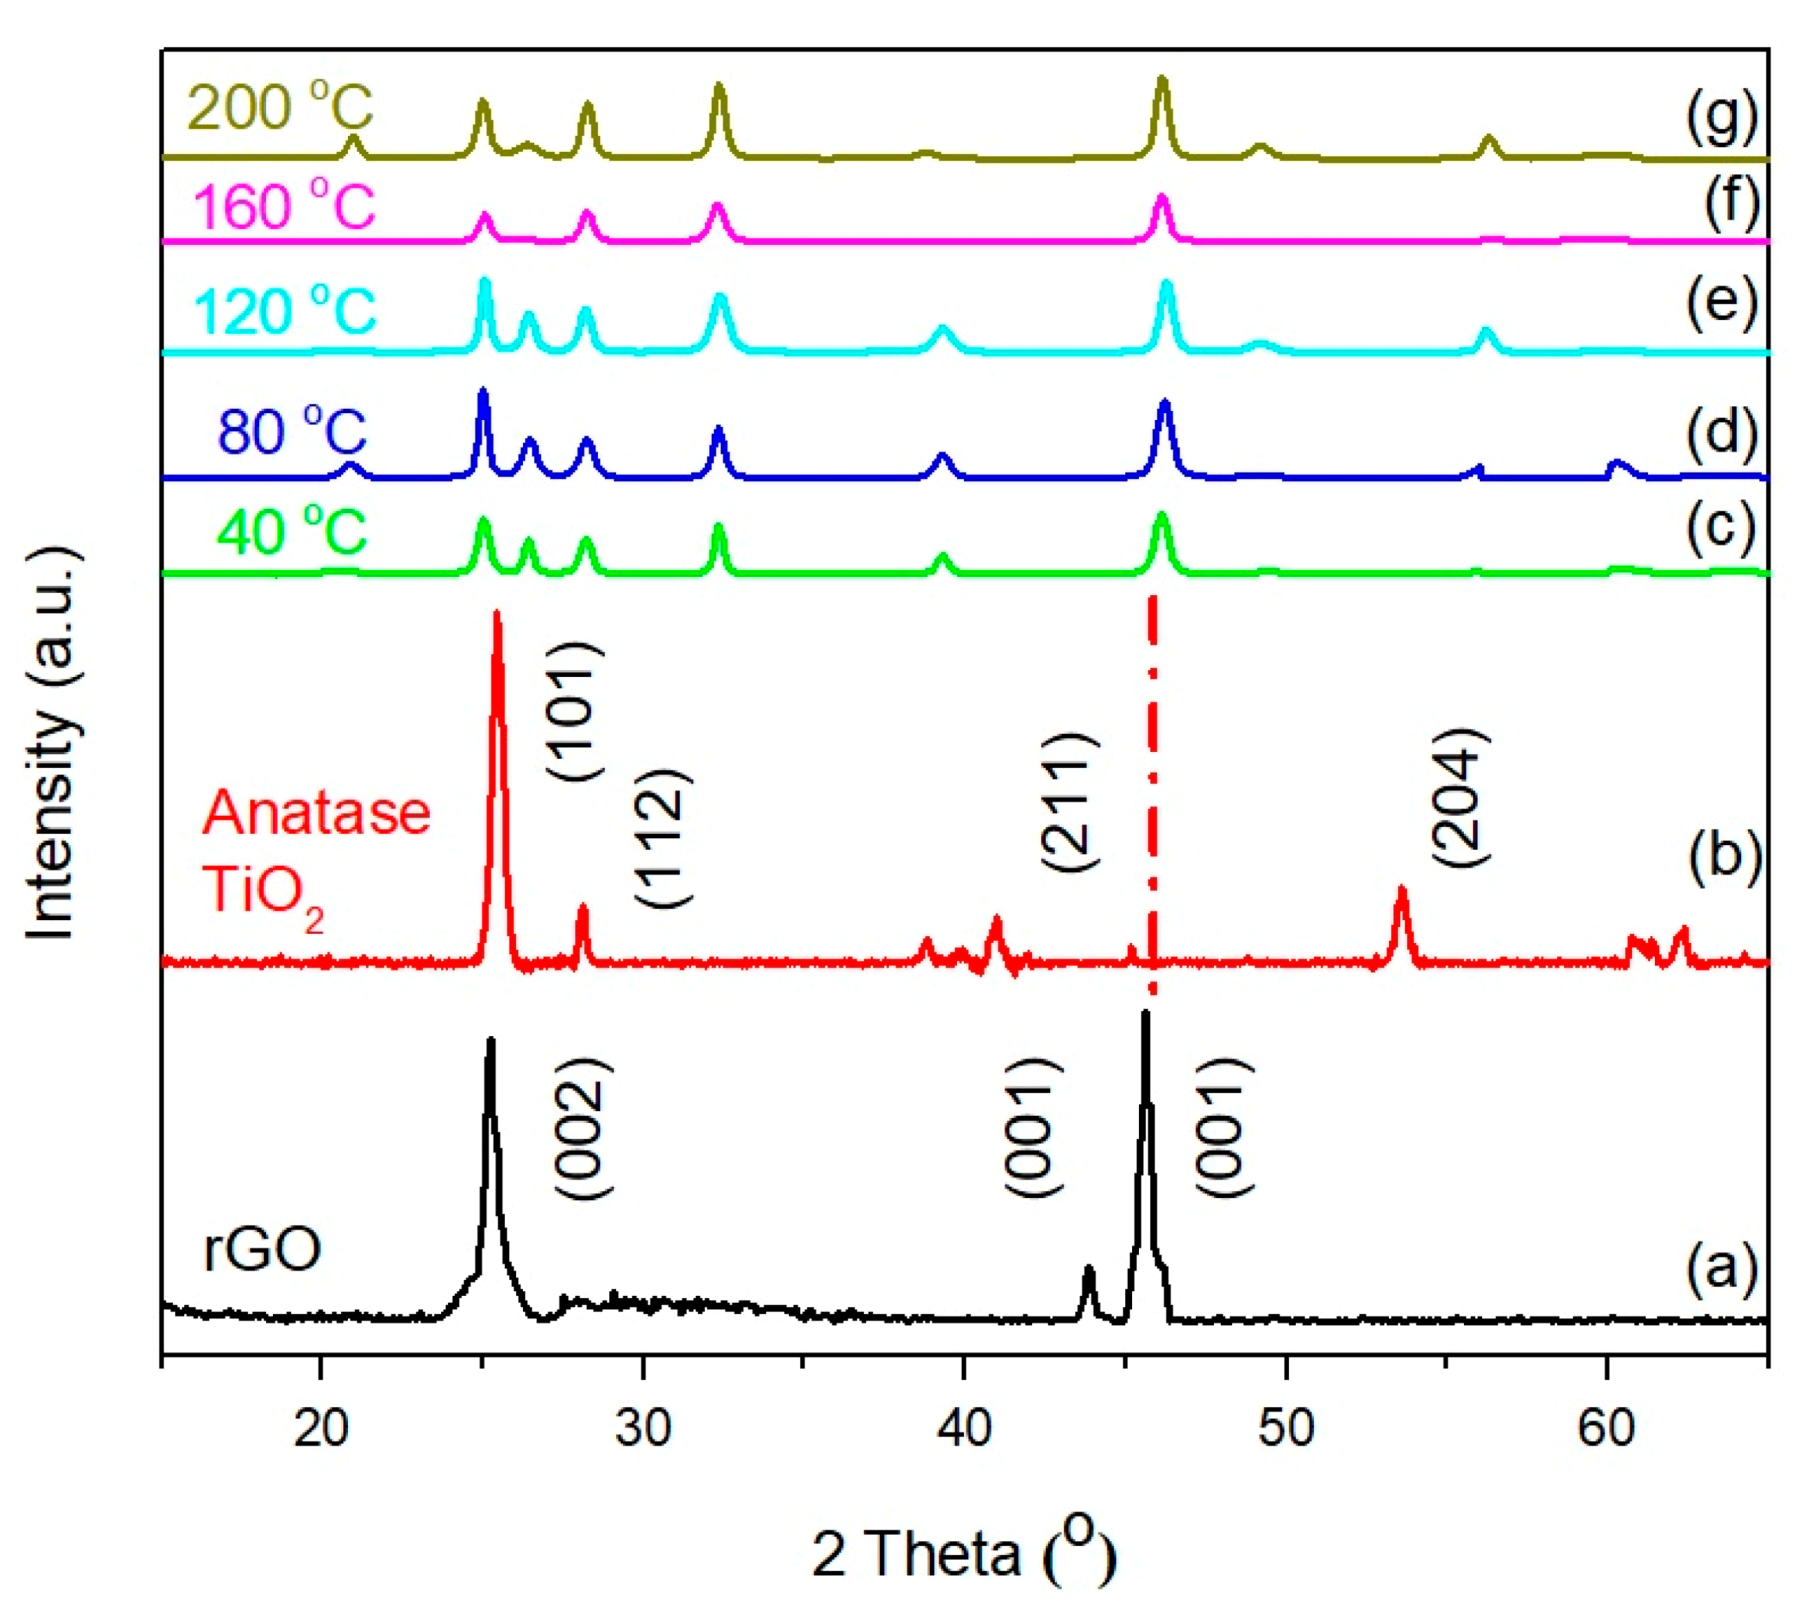
3.5. XRD
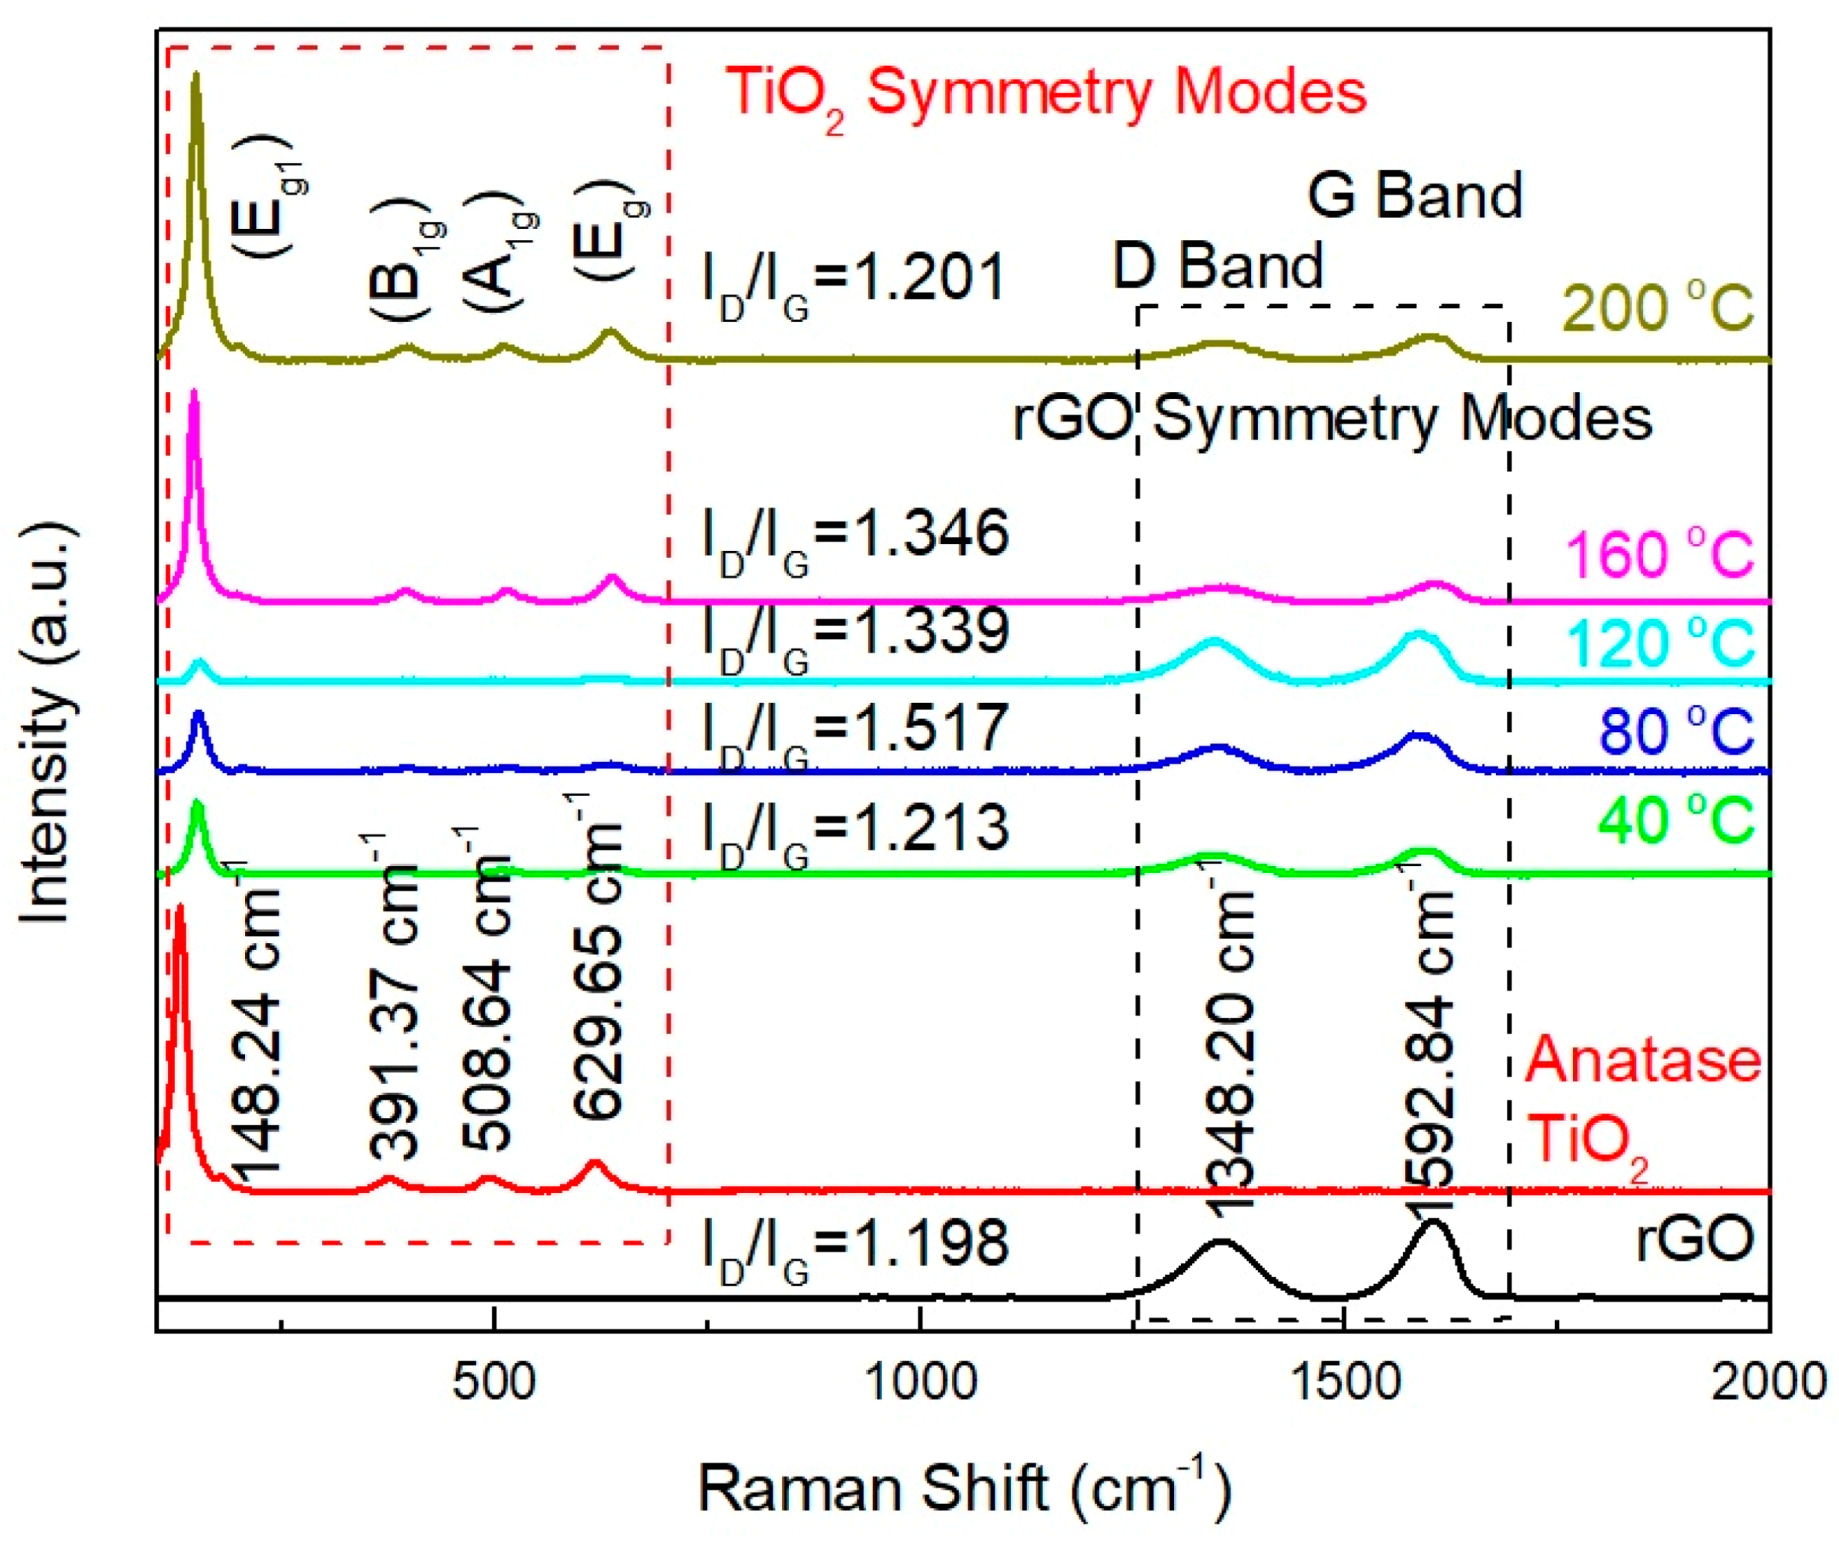
3.6. Raman
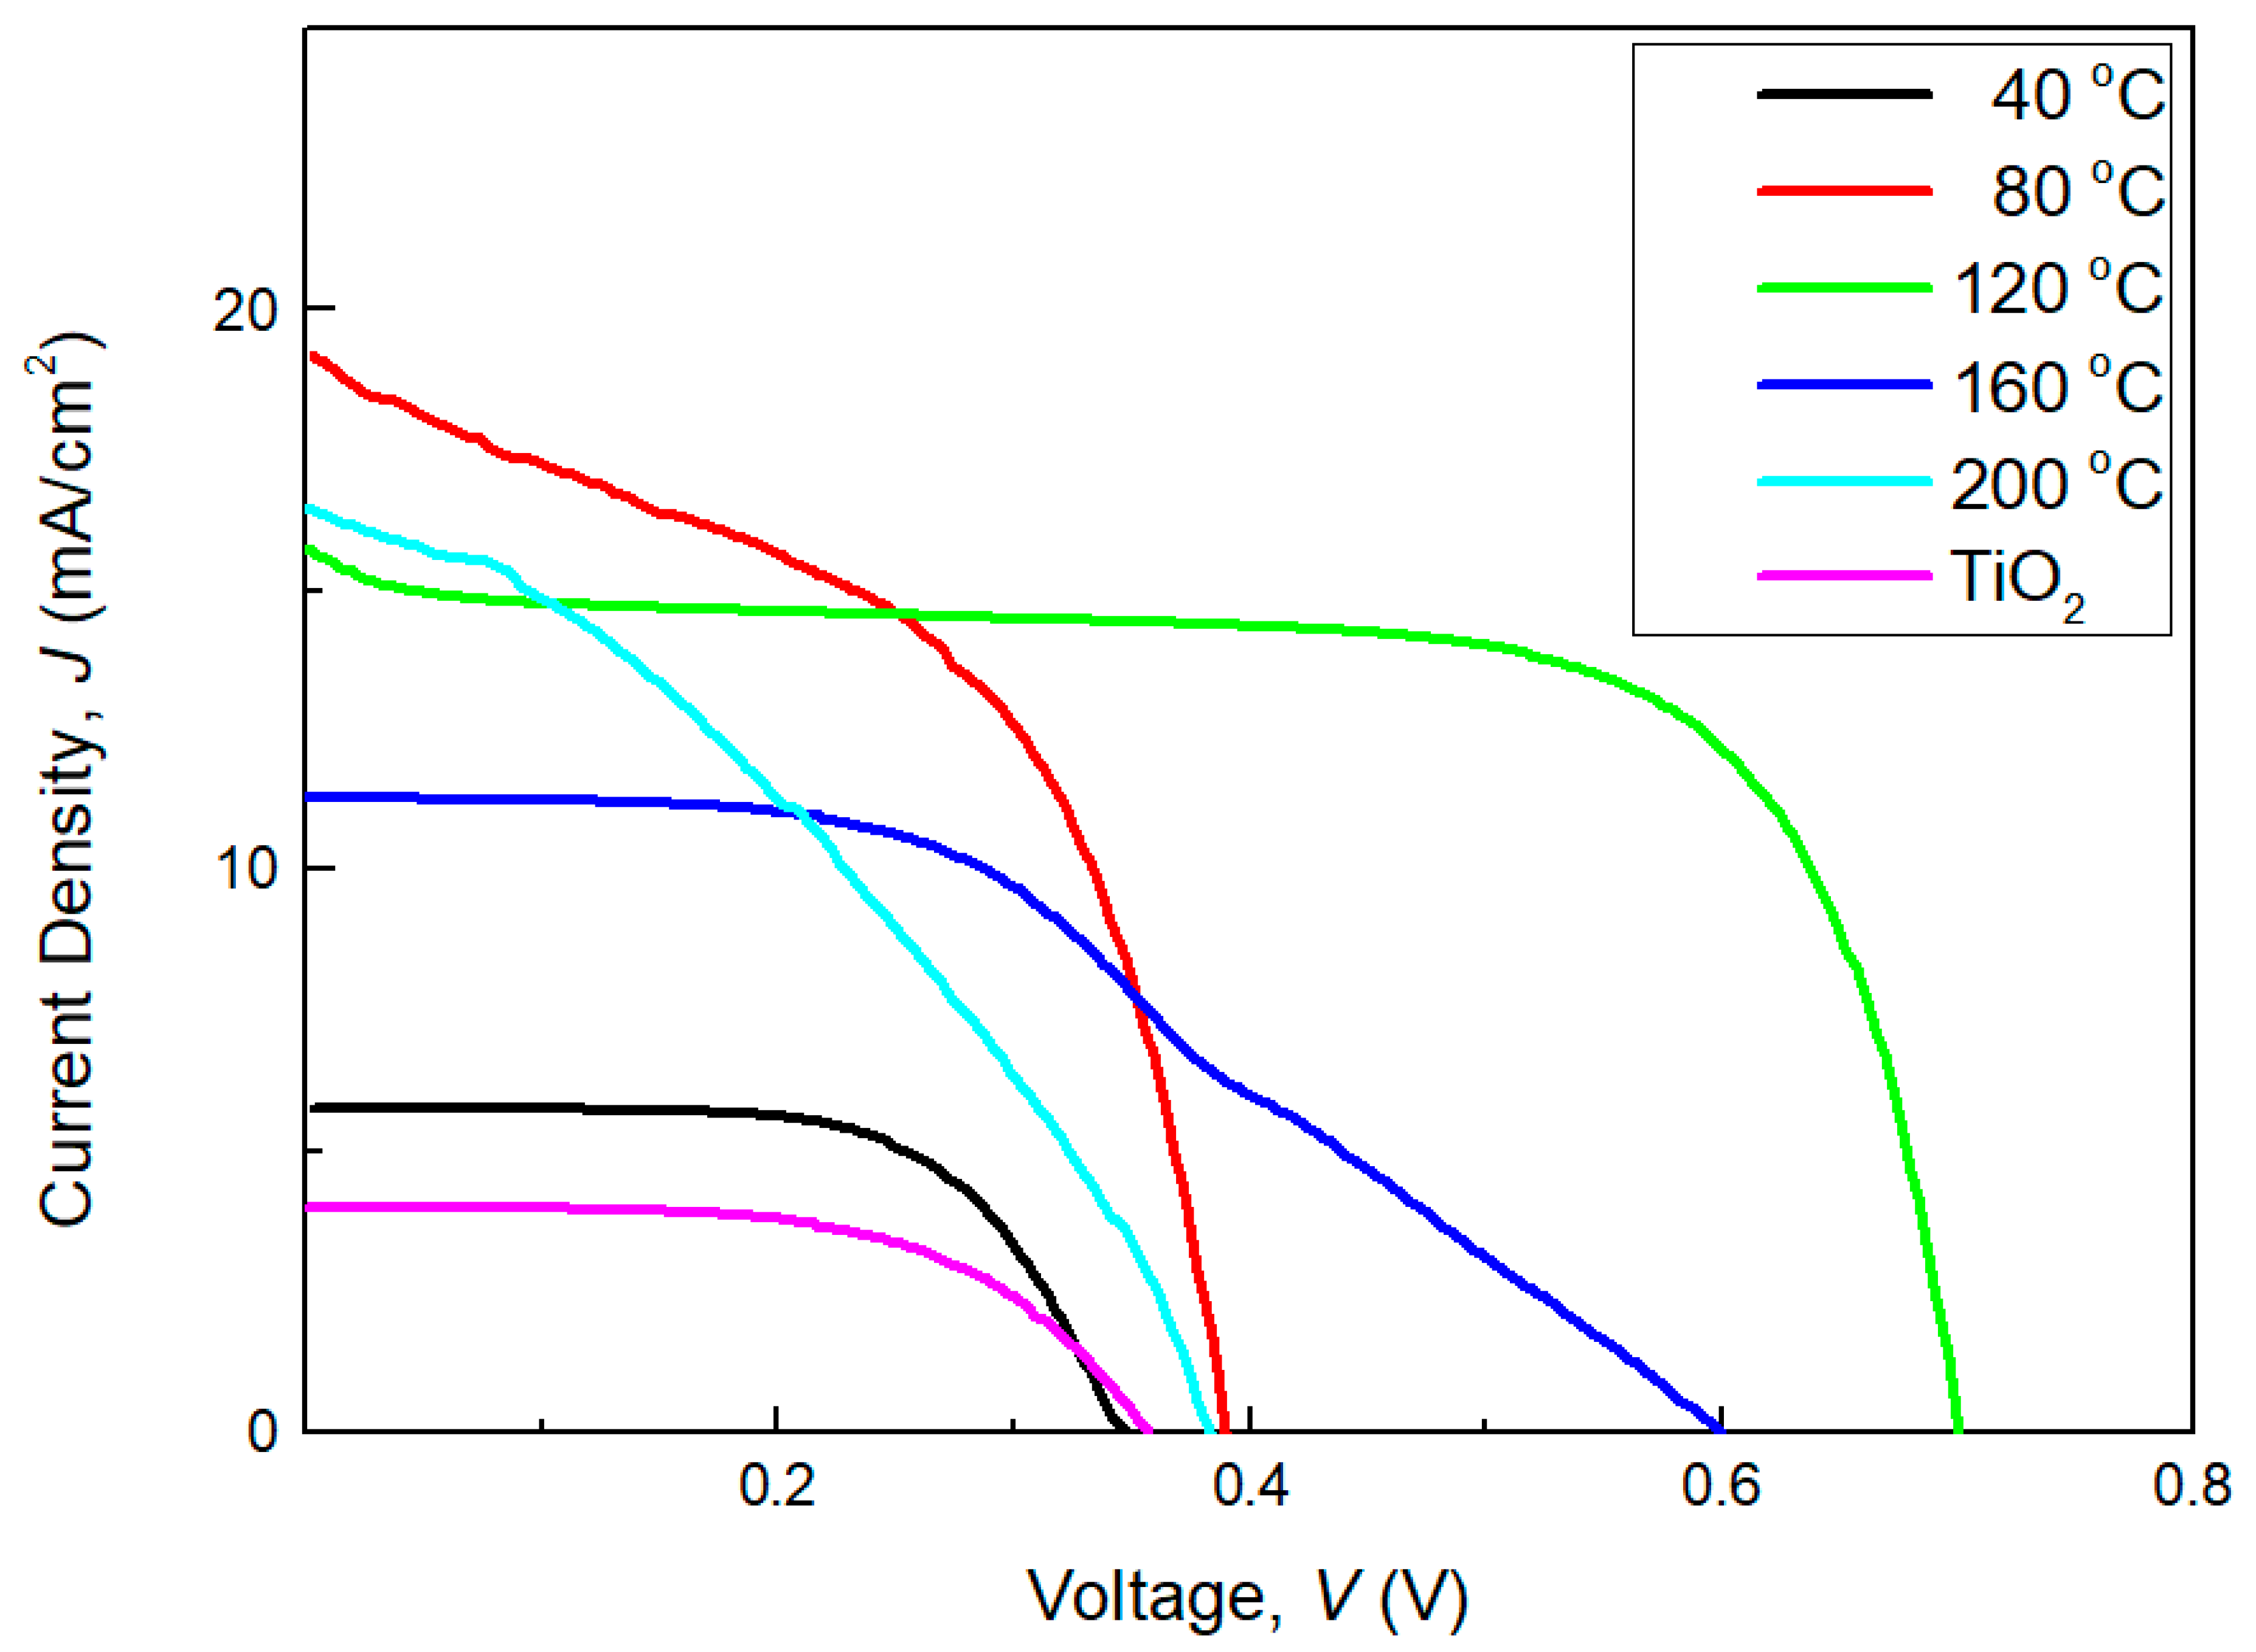
3.7. DSSCs
4. Conclusions
Author Contributions
Funding
Conflicts of Interest
References
- Khan, N.; Dilshad, S.; Khalid, R.; Kalair, A.R.; Abas, N. Review of energy storage and transportation of energy. Energy Storage 2019, 1, 1–49. [Google Scholar] [CrossRef]
- Bais, A.F.; Lucas, A.F.; Bornman, J.F.; Williamson, C.E.; Sulzberger, B.; Austin, A.T.; Wilson, S.R.; Andrady, A.L.; Bernhard, G.; McKenzie, R.L.; et al. Environmental effects of ozone depletion, UV radiation and interactions with climate change: UNEP Environmental Effects Assessment Panel, update 2017. Photochem. Photobiol. Sci. 2018, 17, 127–179. [Google Scholar] [CrossRef] [PubMed]
- Tefera, T.D.; Ali, S.F. Impacts of climate change on fish production and its implications on food security in developing countries. Int. J. Food Nutr. Res. 2019, 3, 1–13. [Google Scholar]
- Islam, M.T.; Huda, N.; Abdullah, A.B.; Saidur, R. A comprehensive review of state-of-the-art concentrating solar power (CSP) technologies: Current status and research trends. Renew. Sustain. Energy Rev. 2018, 91, 987–1018. [Google Scholar] [CrossRef]
- Munshi, A.H.; Sasidharan, N.; Pinkayan, S.; Barth, K.L.; Sampath, W.S.; Ongsakul, W. Thin-film CdTe photovoltaics–The technology for utility scale sustainable energy generation. Sol. Energy 2018, 173, 511–516. [Google Scholar] [CrossRef]
- Shubbak, M.H. Advances in solar photovoltaics: Technology review and patent trends. Renew. Sustain. Energy Rev. 2019, 115, 109383. [Google Scholar] [CrossRef]
- Green, M.A.; Dunlop, E.D.; Levi, D.H.; Hohl-Ebinger, J.; Yoshita, M.; Ho-Baillie, A.W.Y. Solar cell efficiency tables (version 54). Prog. Photovolt. Res. Appl. 2019, 27, 565–575. [Google Scholar] [CrossRef]
- Khatri, I.; Matsuura, J.; Sugiyama, M.; Nakada, T. Effect of heat-bias soaking on cesium fluoride-treated CIGS thin film solar cells. Prog. Photovolt. Res. Appl. 2019, 27, 22–29. [Google Scholar] [CrossRef]
- Fadaam, S.A.; Mustafa, M.H.; AlRazaK, A.H.A.; Shihab, A.A. Enhanced efficiency of CdTe Photovoltaic by thermal evaporation Vacuum. Energy Procedia 2019, 157, 635–643. [Google Scholar] [CrossRef]
- Wen, X.; Chen, C.; Lu, S.; Li, K.; Kondrotas, R.; Zhao, Y.; Chen, W.; Gao, L.; Wang, C.; Zhang, J.; et al. Vapor transport deposition of antimony selenide thin film solar cells with 7.6% efficiency. Nat. Commun. 2018, 9, 1–10. [Google Scholar] [CrossRef]
- Carella, A.; Borbone, F.; Centore, R. Research progress on photosensitizers for DSSC. Front. Chem. 2018, 6, 1–24. [Google Scholar] [CrossRef] [PubMed]
- Basu, K. Investigation of Heterostructure Photoanodes for Solar Energy Conversion; Université du Québec, Institut National de la Recherche Scientifique: Quebec City, QC, Canada, 2018. [Google Scholar]
- Liu, J.; Li, Y.; Arumugam, S.; Tudor, J.; Beeby, S. Investigation of low temperature processed titanium dioxide (TiO2) films for printed dye sensitized solar cells (DSSCs) for large area flexible applications. Mater. Today Proc. 2018, 5, 13846–13854. [Google Scholar] [CrossRef]
- Mbonyiryivuze, A.; Zongo, S.; Diallo, A.; Bertrand, S.; Minani, E.; Yadav, L.L.; Mwakikunga, B.W.; Dhlamini, S.M.; Maaza, M. Titanium Dioxide Nanoparticles Biosynthesis for Dye Sensitized Solar Cells Application. Phys. Mater. Chem. 2015, 3, 12–17. [Google Scholar]
- Qian, R.; Zong, H.; Schneider, J.; Zhou, G.; Zhao, T.; Li, Y.; Yang, J.; Bahnemann, D.W.; Pan, J.H. Charge carrier trapping, recombination and transfer during TiO2 photocatalysis: An overview. Catal. Today 2019, 335, 78–90. [Google Scholar] [CrossRef]
- Ding, H.; Zhang, S.; Chen, J.T.; Hu, X.P.; Du, Z.F.; Qiu, Y.X.; Zhao, D.L. Reduction of graphene oxide at room temperature with vitamin C for RGO–TiO2 photoanodes in dye-sensitized solar cell. Thin Solid Film. 2015, 584, 29–36. [Google Scholar] [CrossRef]
- Peiris, D.; Ekanayake, P.; Petra, M.I. Stacked rGO–TiO2 photoanode via electrophoretic deposition for highly efficient dye-sensitized solar cells. Org. Electron. 2018, 59, 399–405. [Google Scholar] [CrossRef]
- Kumar, K.A.; Subalakshmi, K.; Senthilselvan, J. Effect of co-sensitization in solar exfoliated TiO2 functionalized rGO photoanode for dye-sensitized solar cell applications. Mater. Sci. Semicond. Process. 2019, 96, 104–115. [Google Scholar] [CrossRef]
- Manikandan, V.; Palai, A.K.; Mohanty, S.; Nayak, S.K. Hydrothermally synthesized self-assembled multi-dimensional TiO2/Graphene oxide composites with efficient charge transfer kinetics fabricated as novel photoanode for dye sensitized solar cell. J. Alloys Compd. 2019, 793, 400–409. [Google Scholar] [CrossRef]
- Mahmood, T.; Aslam, M.; Naeem, A. Graphene/Metal oxide nanocomposite usage as photoanode in dye-sensitized and perovskite solar cells. In Reconfigurable Materials; IntechOpen: London, UK, 2020. [Google Scholar]
- Wu, W.-T.; Yang, S.H.; Hsu, C.M.; Wu, W.T. Study of graphene nanoflake as counter electrode in dye sensitized solar cells. Diam. Relat. Mater. 2016, 65, 91–95. [Google Scholar] [CrossRef]
- Tang, B.; Yu, H.; Peng, H.; Wang, Z.; Li, S.; Ma, T.; Huang, W. Graphene based photoanode for DSSCs with high performances. RSC Adv. 2018, 8, 29220–29227. [Google Scholar] [CrossRef]
- Wei, W.; Wang, H.; Wang, C.; Luo, H. Advanced Nanomaterials and Nanotechnologies for Solar Energy. Int. J. Photoenergy 2019, 2019, 8437964. [Google Scholar] [CrossRef]
- Kumar, V.; Bansal, A.; Gupta, R. Synthesis of rGO/TiO2 Nanocomposite for the Efficient Photocatalytic Degradation of RhB Dye. In Sustainable Engineering; Springer: Berlin/Heidelberg, Germany, 2019; pp. 265–280. [Google Scholar]
- Deshmukh, S.P.; Kale, D.P.; Kar, S.; Shisath, S.R.; Bhanvase, B.A.; Saharan, V.K.; Sonawane, S.H. Ultrasound assisted preparation of rGO/TiO2 nanocomposite for effective photocatalytic degradation of methylene blue under sunlight. Nano Struct. Nano Objects 2020, 21, 100407. [Google Scholar] [CrossRef]
- Khavar, A.H.C.; Moussavi, G.; Mahjoub, A.R. The preparation of TiO2@ rGO nanocomposite efficiently activated with UVA/LED and H2O2 for high rate oxidation of acetaminophen: Catalyst characterization and acetaminophen degradation and mineralization. Appl. Surf. Sci. 2018, 440, 963–973. [Google Scholar] [CrossRef]
- Leal, J.F.; Cruz, S.M.A.; Almeida, B.T.A.; Esteves, V.I.; Paula, A.; Marques, A.P.; Santos, E.B.H. TiO2–rGO nanocomposite as an efficient catalyst to photodegrade formalin in aquaculture’s waters, under solar light. Environ. Sci. Water Res. Technol. 2020, 6, 1018–1027. [Google Scholar] [CrossRef]
- Nouri, E.; Mohammadi, M.R.; Lianos, P. Impact of preparation method of TiO2-RGO nanocomposite photoanodes on the performance of dye-sensitized solar cells. Electrochim. Acta 2016, 219, 38–48. [Google Scholar] [CrossRef]
- Lim, S.P.; Pandimumar, A.; Huang, N.M.; Lim, H.N. Reduced graphene oxide-titania nanocomposite-modified photoanode for efficient dye-sensitized solar cells. Int. J. Energy Res. 2015, 39, 812–824. [Google Scholar] [CrossRef]
- Javed, H.M.A.; Qureshi, A.A.; Mustafa, M.S.; Que, W.; Mahr, M.S.; Shaheen, A.; Iqbal, J.; Saleem, S.; Jamshaid, M.; Mahmood, A. Advanced Ag/rGO/TiO2 ternary nanocomposite based photoanode approaches to highly-efficient plasmonic dye-sensitized solar cells. Opt. Commun. 2019, 453, 124408. [Google Scholar] [CrossRef]
- Low, F.W.; Lai, C.W.; Hamid, S.B.A. Surface modification of reduced graphene oxide film by Ti ion implantation technique for high dye-sensitized solar cells performance. Ceram. Int. 2017, 43, 625–633. [Google Scholar] [CrossRef]
- Low, F.W.; Lai, C.W.; Hamid, S.B.A. Easy preparation of ultrathin reduced graphene oxide sheets at a high stirring speed. Ceram. Int. 2015, 41, 5798–5806. [Google Scholar] [CrossRef]
- Low, F.W.; Lai, C.W.; Asim, N.; Akhtaruzzaman, M.; Alghoul, M.; Tiong, S.K.; Amin, N. An investigation on titanium doping in reduced graphene oxide by RF magnetron sputtering for dye-sensitized solar cells. Sol. Energy 2019, 188, 10–18. [Google Scholar] [CrossRef]
- Lavin-Lopez, M.D.P.; Romero, A.; Garrido, J.; Sanchez-Silva, L.; Valverde, J.L. Influence of different improved hummers method modifications on the characteristics of graphite oxide in order to make a more easily scalable method. Ind. Eng. Chem. Res. 2016, 55, 12836–12847. [Google Scholar] [CrossRef]
- Park, S.; An, J.; Potts, J.R.; Velamakanni, A.; Murali, S.; Ruoff, R.S. Hydrazine-reduction of graphite-and graphene oxide. Carbon 2011, 49, 3019–3023. [Google Scholar] [CrossRef]
- Cho, C.-P.; Wu, H.-Y.; Lin, C.-C. Impacts of sputter-deposited platinum thickness on the performance of dye-sensitized solar cells. Electrochim. Acta 2013, 107, 488–493. [Google Scholar] [CrossRef]
- Panepinto, A.; Michiels, M.; Durrschnabel, M.T.; Molina-Luna, L.; Bittencourt, C.; Cormier, P.-A.; Snyders, R. Synthesis of anatase (core)/rutile (shell) nanostructured TiO2 thin films by magnetron sputtering methods for dye-sensitized solar cell applications. ACS Appl. Energy Mater. 2019, 3, 759–767. [Google Scholar] [CrossRef]
- Tan, L.-L.; Ong, W.-J.; Chai, S.-P.; Mohamed, A.R. Reduced graphene oxide-TiO2 nanocomposite as a promising visible-light-active photocatalyst for the conversion of carbon dioxide. Nanoscale Res. Lett. 2013, 8, 1–9. [Google Scholar] [CrossRef]
- Rochman, R.A.; Wahyuningsih, S.; Ramelan, A.H.; Hanif, Q.A. Preparation of nitrogen and sulphur Co-doped reduced graphene oxide (rGO-NS) using N and S heteroatom of thiourea. In IOP Conference Series: Materials Science and Engineering; IOP Publishing: Bristol, UK, 2019. [Google Scholar]
- Praveen, P.; Viruthagiri, G.; Mugundan, S.; Shanmugam, N. Structural, optical and morphological analyses of pristine titanium di-oxide nanoparticles–Synthesized via sol–gel route. Spectrochim. Acta Part A Mol. Biomol. Spectrosc. 2014, 117, 622–629. [Google Scholar] [CrossRef]
- Gillespie, P.N.O.; Martsinovich, N. Origin of charge trapping in TiO2/reduced graphene oxide photocatalytic composites: Insights from theory. ACS Appl. Mater. Interfaces 2019, 11, 31909–31922. [Google Scholar] [CrossRef]
- Lazarte, J.P.L.; Dipasupil, R.C.; Pasco, G.Y.S.; Eusebio, R.C.P.; Orbecido, A.H.; Doong, R.; Bautista-Patacsil, L. Synthesis of reduced graphene oxide/titanium dioxide nanotubes (rGO/TNT) composites as an electrical double layer capacitor. Nanomaterials 2018, 8, 934. [Google Scholar] [CrossRef] [PubMed]
- Yadav, H.M.; Kim, J.-S. Solvothermal synthesis of anatase TiO2-graphene oxide nanocomposites and their photocatalytic performance. J. Alloys Compd. 2016, 688, 123–129. [Google Scholar] [CrossRef]
- Low, F.W.; Lai, C.W.; Hamid, S.B.A. Study of reduced graphene oxide film incorporated of TiO2 species for efficient visible light driven dye-sensitized solar cell. J. Mater. Sci. Mater. Electron. 2017, 28, 3819–3836. [Google Scholar] [CrossRef]
- Castrejón-Sánchez, V.H.; Enrique, C.; Camacho-Lopez, M. Quantification of phase content in TiO2 thin films by Raman spectroscopy. Superf. Vacío 2014, 27, 88–92. [Google Scholar]
- Hodkiewicz, J. Characterizing carbon materials with Raman spectroscopy. Thermo Sci. Appl. Note 2010, 51946, 1–5. [Google Scholar]
- Raja, R.; Govindaraj, M.; Antony, M.D.; Krishnan, K.; Velusamy, E.; Sambandam, A.; Subbaiah, M.; Rayar, V.W. Effect of TiO2/reduced graphene oxide composite thin film as a blocking layer on the efficiency of dye-sensitized solar cells. J. Solid State Electrochem. 2017, 21, 891–903. [Google Scholar] [CrossRef]
- Pichot, F.; Pitts, J.R.; Gregg, B.A. Low-temperature sintering of TiO2 colloids: Application to flexible dye-sensitized solar cells. Langmuir 2000, 16, 5626–5630. [Google Scholar] [CrossRef]
- Hasan, M.R.; Hamid, S.B.A.; Basirun, W.J.; Suhaimy, S.H.M.; Mat, A.N.C. A sol–gel derived, copper-doped, titanium dioxide–reduced graphene oxide nanocomposite electrode for the photoelectrocatalytic reduction of CO2 to methanol and formic acid. RSC Adv. 2015, 5, 77803–77813. [Google Scholar] [CrossRef]


| Composite Formation | Optimized Concentration | Dopants | Method | Findings | Ref. |
|---|---|---|---|---|---|
| rGO/TiO2 | 3 wt% | GO | solvothermal | ACT degradation and mineralization on photocatalytic | [26] |
| TiO2-rGO | 0.5 wt% | GO | hydrothermal | FM photodegradation | [27] |
| TiO2-rGO | 0.4 wt% | GO | hydrothermal | DSSCs | [28] |
| rGO-TiO2 | 0.5mg | rGO | hydrothermal | DSSCs | [29] |
| Ag/rGO/TiO2 | - | GO | solvothermal | Plasmonic DSSCs | [30] |
| Sputtering Temperature, °C | Short Circuit Current, Jsc | Open Circuit Current, Voc | Maximum Power Current, Jmp | Maximum Power Voltage, Vmp | Fill Factor, FF | Efficiency, η |
|---|---|---|---|---|---|---|
| TiO2 | 3.98 | 0.36 | 2.82 | 0.28 | 0.55 | 0.79 |
| 40 | 5.75 | 0.35 | 5.07 | 0.25 | 0.63 | 1.27 |
| 80 | 19.18 | 0.39 | 12.58 | 0.30 | 0.50 | 3.74 |
| 120 | 15.74 | 0.70 | 12.16 | 0.60 | 0.66 | 7.27 |
| 160 | 11.31 | 0.60 | 9.69 | 0.30 | 0.43 | 2.92 |
| 200 | 16.46 | 0.38 | 14.85 | 0.10 | 0.24 | 1.50 |
Sample Availability: Samples of the compounds are not available from the authors. |
Publisher’s Note: MDPI stays neutral with regard to jurisdictional claims in published maps and institutional affiliations. |
© 2020 by the authors. Licensee MDPI, Basel, Switzerland. This article is an open access article distributed under the terms and conditions of the Creative Commons Attribution (CC BY) license (http://creativecommons.org/licenses/by/4.0/).
Share and Cite
Low, F.W.; Chin Hock, G.; Kashif, M.; Samsudin, N.A.; Chau, C.F.; Indah Utami, A.R.; Aminul Islam, M.; Heah, C.Y.; Liew, Y.M.; Lai, C.W.; et al. Influence of Sputtering Temperature of TiO2 Deposited onto Reduced Graphene Oxide Nanosheet as Efficient Photoanodes in Dye-Sensitized Solar Cells. Molecules 2020, 25, 4852. https://doi.org/10.3390/molecules25204852
Low FW, Chin Hock G, Kashif M, Samsudin NA, Chau CF, Indah Utami AR, Aminul Islam M, Heah CY, Liew YM, Lai CW, et al. Influence of Sputtering Temperature of TiO2 Deposited onto Reduced Graphene Oxide Nanosheet as Efficient Photoanodes in Dye-Sensitized Solar Cells. Molecules. 2020; 25(20):4852. https://doi.org/10.3390/molecules25204852
Chicago/Turabian StyleLow, Foo Wah, Goh Chin Hock, Muhammad Kashif, Nurul Asma Samsudin, Chien Fat Chau, Amaliyah Rohsari Indah Utami, Mohammad Aminul Islam, Cheng Yong Heah, Yun Ming Liew, Chin Wei Lai, and et al. 2020. "Influence of Sputtering Temperature of TiO2 Deposited onto Reduced Graphene Oxide Nanosheet as Efficient Photoanodes in Dye-Sensitized Solar Cells" Molecules 25, no. 20: 4852. https://doi.org/10.3390/molecules25204852
APA StyleLow, F. W., Chin Hock, G., Kashif, M., Samsudin, N. A., Chau, C. F., Indah Utami, A. R., Aminul Islam, M., Heah, C. Y., Liew, Y. M., Lai, C. W., Amin, N., & Tiong, S. K. (2020). Influence of Sputtering Temperature of TiO2 Deposited onto Reduced Graphene Oxide Nanosheet as Efficient Photoanodes in Dye-Sensitized Solar Cells. Molecules, 25(20), 4852. https://doi.org/10.3390/molecules25204852