Article

Overexpression of GbF3′5′H1 Provides a Potential to Improve the Content of Epicatechin and Gallocatechin

1
Co-Innovation Center for the Sustainable Forestry in Southern China, College of Forestry, Nanjing Forestry University, 159 Longpan Road, Nanjing 210037, China
2
Research Center for Pomology, Institute of Botany, Jiangsu Province and Chinese Academy of Sciences, Qian Hu Hou Cun No.1, Nanjing 210014, China
3
Department of Forest and Conservation Sciences, Faculty of Forestry, University of British Columbia, Vancouver, BC V6T 1Z4, Canada
*
Author to whom correspondence should be addressed.
Molecules 2020, 25(20), 4836; https://doi.org/10.3390/molecules25204836
Submission received: 8 September 2020 / Revised: 15 October 2020 / Accepted: 16 October 2020 / Published: 20 October 2020

Abstract

:
The flavonoids in Ginkgo biloba L. (ginkgo) have important medicinal uses due to their antioxidant, antitumor, and blood circulation-promoting effects. However, the genetic mechanisms underlying flavonoid biosynthesis in ginkgo remain elusive. Flavonoid 3′, 5′-hydroxylase (F3′5′H) is an important enzyme in flavonoid synthesis. We detected a novel differentially expressed GbF3′5′H1 gene homologous to the F3′5′H enzyme involved in the flavonoid synthesis pathway through transcriptome sequencing. In this study, we characterized this gene, performed an expression analysis, and heterologously overexpressed GbF3′5′H1 in Populus. Our results showed that GbF3′5′H1 is abundant in the leaf and highly expressed during April. We also found four metabolites closely related to flavonoid biosynthesis. Importantly, the contents of 4′,5-dihydroxy-7-glucosyloxyflavanone, epicatechin, and gallocatechin were significantly higher in transgenic plants than in nontransgenic plants. Our findings revealed that the GbF3′5′H1 gene functions in the biosynthesis of flavonoid-related metabolites, suggesting that GbF3′5′H1 represents a prime candidate for future studies (e.g., gene-editing) aiming to optimize ginkgo flavonoid production, especially that of flavan-3-ols.

1. Introduction

Flavonoids represent a large class of secondary metabolites in plants and have many physiological functions [1]. Flavonoids are considered an important part of the plant chemical defense mechanism [2]. Flavonoid scaffolds are formed from the building blocks of a phenylpropanoid precursor (p-coumaroyl-CoA) and polyketide condensing unit (malonyl-CoA) by a series of reactions, including oxidation, reduction, condensation, and isomerization [3,4]. The scaffolds are then further modified to produce various subclasses of flavonoids by different classes of enzymes [5]. Some genes involved in flavonoid synthesis have been studied [6,7,8], and the biosynthetic pathway of flavonoids in Arabidopsis thaliana has been well-studied [9]. The Arabidopsis enzymes of the central flavonoid pathway are encoded by single genes, with the exception of flavonol synthase [4]. In contrast, the flavonoid biosynthetic pathway in ginkgo is complex, and each step is regulated by a multigene family. Recent evidence has revealed that flavonoid biosynthesis is regulated by several crucial enzyme-encoding genes [8]. Although the catalytic activities of several ginkgo homologs (GbCHS, GbCHI, GbF3H, and GbFLS) have been characterized in Escherichia coli [7,10,11,12], it is still unclear how these enzymes participate in flavonoid synthesis in plants because of the absence of related mutants.
Ginkgo biloba L. (ginkgo) is an ancient relic plant. As it is the only extant species in the division Ginkgophyta, it is considered to be a “living fossil” [13]. Ginkgo originated more than 200 million years ago, and it is a unique species on its own branch of the plant phylogenetic tree [14]. Due to its high environmental adaptability, stress tolerance, ornamental value, and medicinal utilization value, it has been introduced to many countries and regions [15]. Additionally, it is an important medicinal tree, because its leaves contain flavonoids and terpene lactones with useful pharmacological activities [16,17,18]. Currently, Ginkgo biloba extract (EGB) is one of the most famous products of this species and has been widely used for purposes, including the prevention of Alzheimer’s disease and cerebrovascular dysfunction disorders [19,20,21,22]. While there are many difficulties in the supply of ginkgo leaves, and chemical synthesis is far from meeting business production needs, there is great potential for development and economic value. Moreover, breeding to improve flavonoid productivity cannot be accomplished through genetic transformation, because no regeneration system has been established for ginkgo [23].
To better understand the process and mechanism of flavonoid biosynthesis, the transcriptome profiling of gingko leaves with different flavonoid contents was performed, and 457 genes were found to be significantly differentially expressed between a relatively high and a relatively low flavonoid content library (from the National Center for Biotechnology Information (NCBI) Short Reads Archive (SRA) database, accession number SRP137637) [18]. The flavonoid 3′,5′-hydroxylase (F3′5′H) enzyme gene has a wide range of flavonoid substrate activities and is involved in the biosynthetic pathways leading to flavonols (myricetin and quercetin) and flavan-3-ols (e.g., catechin, epicatechin, and epigallocatechin) [24,25]. Therefore, based on the annotated transcriptome sequences, we chose the differentially expressed F3′5′H1 gene to further explore its important role in ginkgo flavonoid biosynthesis and metabolism. The F3′5′H gene, which encodes a cytochrome P450 monooxygenase (CYP) and belongs to the CYP75A subfamily, has been thoroughly investigated in the ornamental plant Petunia hybrida [6]. F3′5′Hs have also been isolated and characterized in various other plants, such as Solanum lycopersicum [3], Vitis vinifera [26], Antirrhinum kelloggii [27], and Pericallis × hybrida [28]. However, no reports of the cloning, characterization, and function of F3′5′H from ginkgo are available.
In this study, our major objectives were to characterize and functionally analyze the F3′5′H1 gene of ginkgo, including molecular cloning, multiple alignment, phylogenetic analysis, expression patterns, and heterologous overexpression. In addition, a metabolomic analysis was performed on nontransgenic (CK) and transgenic seedlings to determine whether differentially expressed metabolites were linked to flavonoid biosynthesis and metabolism. The findings of this study not only provided information for the characterization and function of GbF3′5′H1 in this species but, also, helped increase the understanding of the underlying molecular mechanisms of flavonoid synthesis.

2. Results

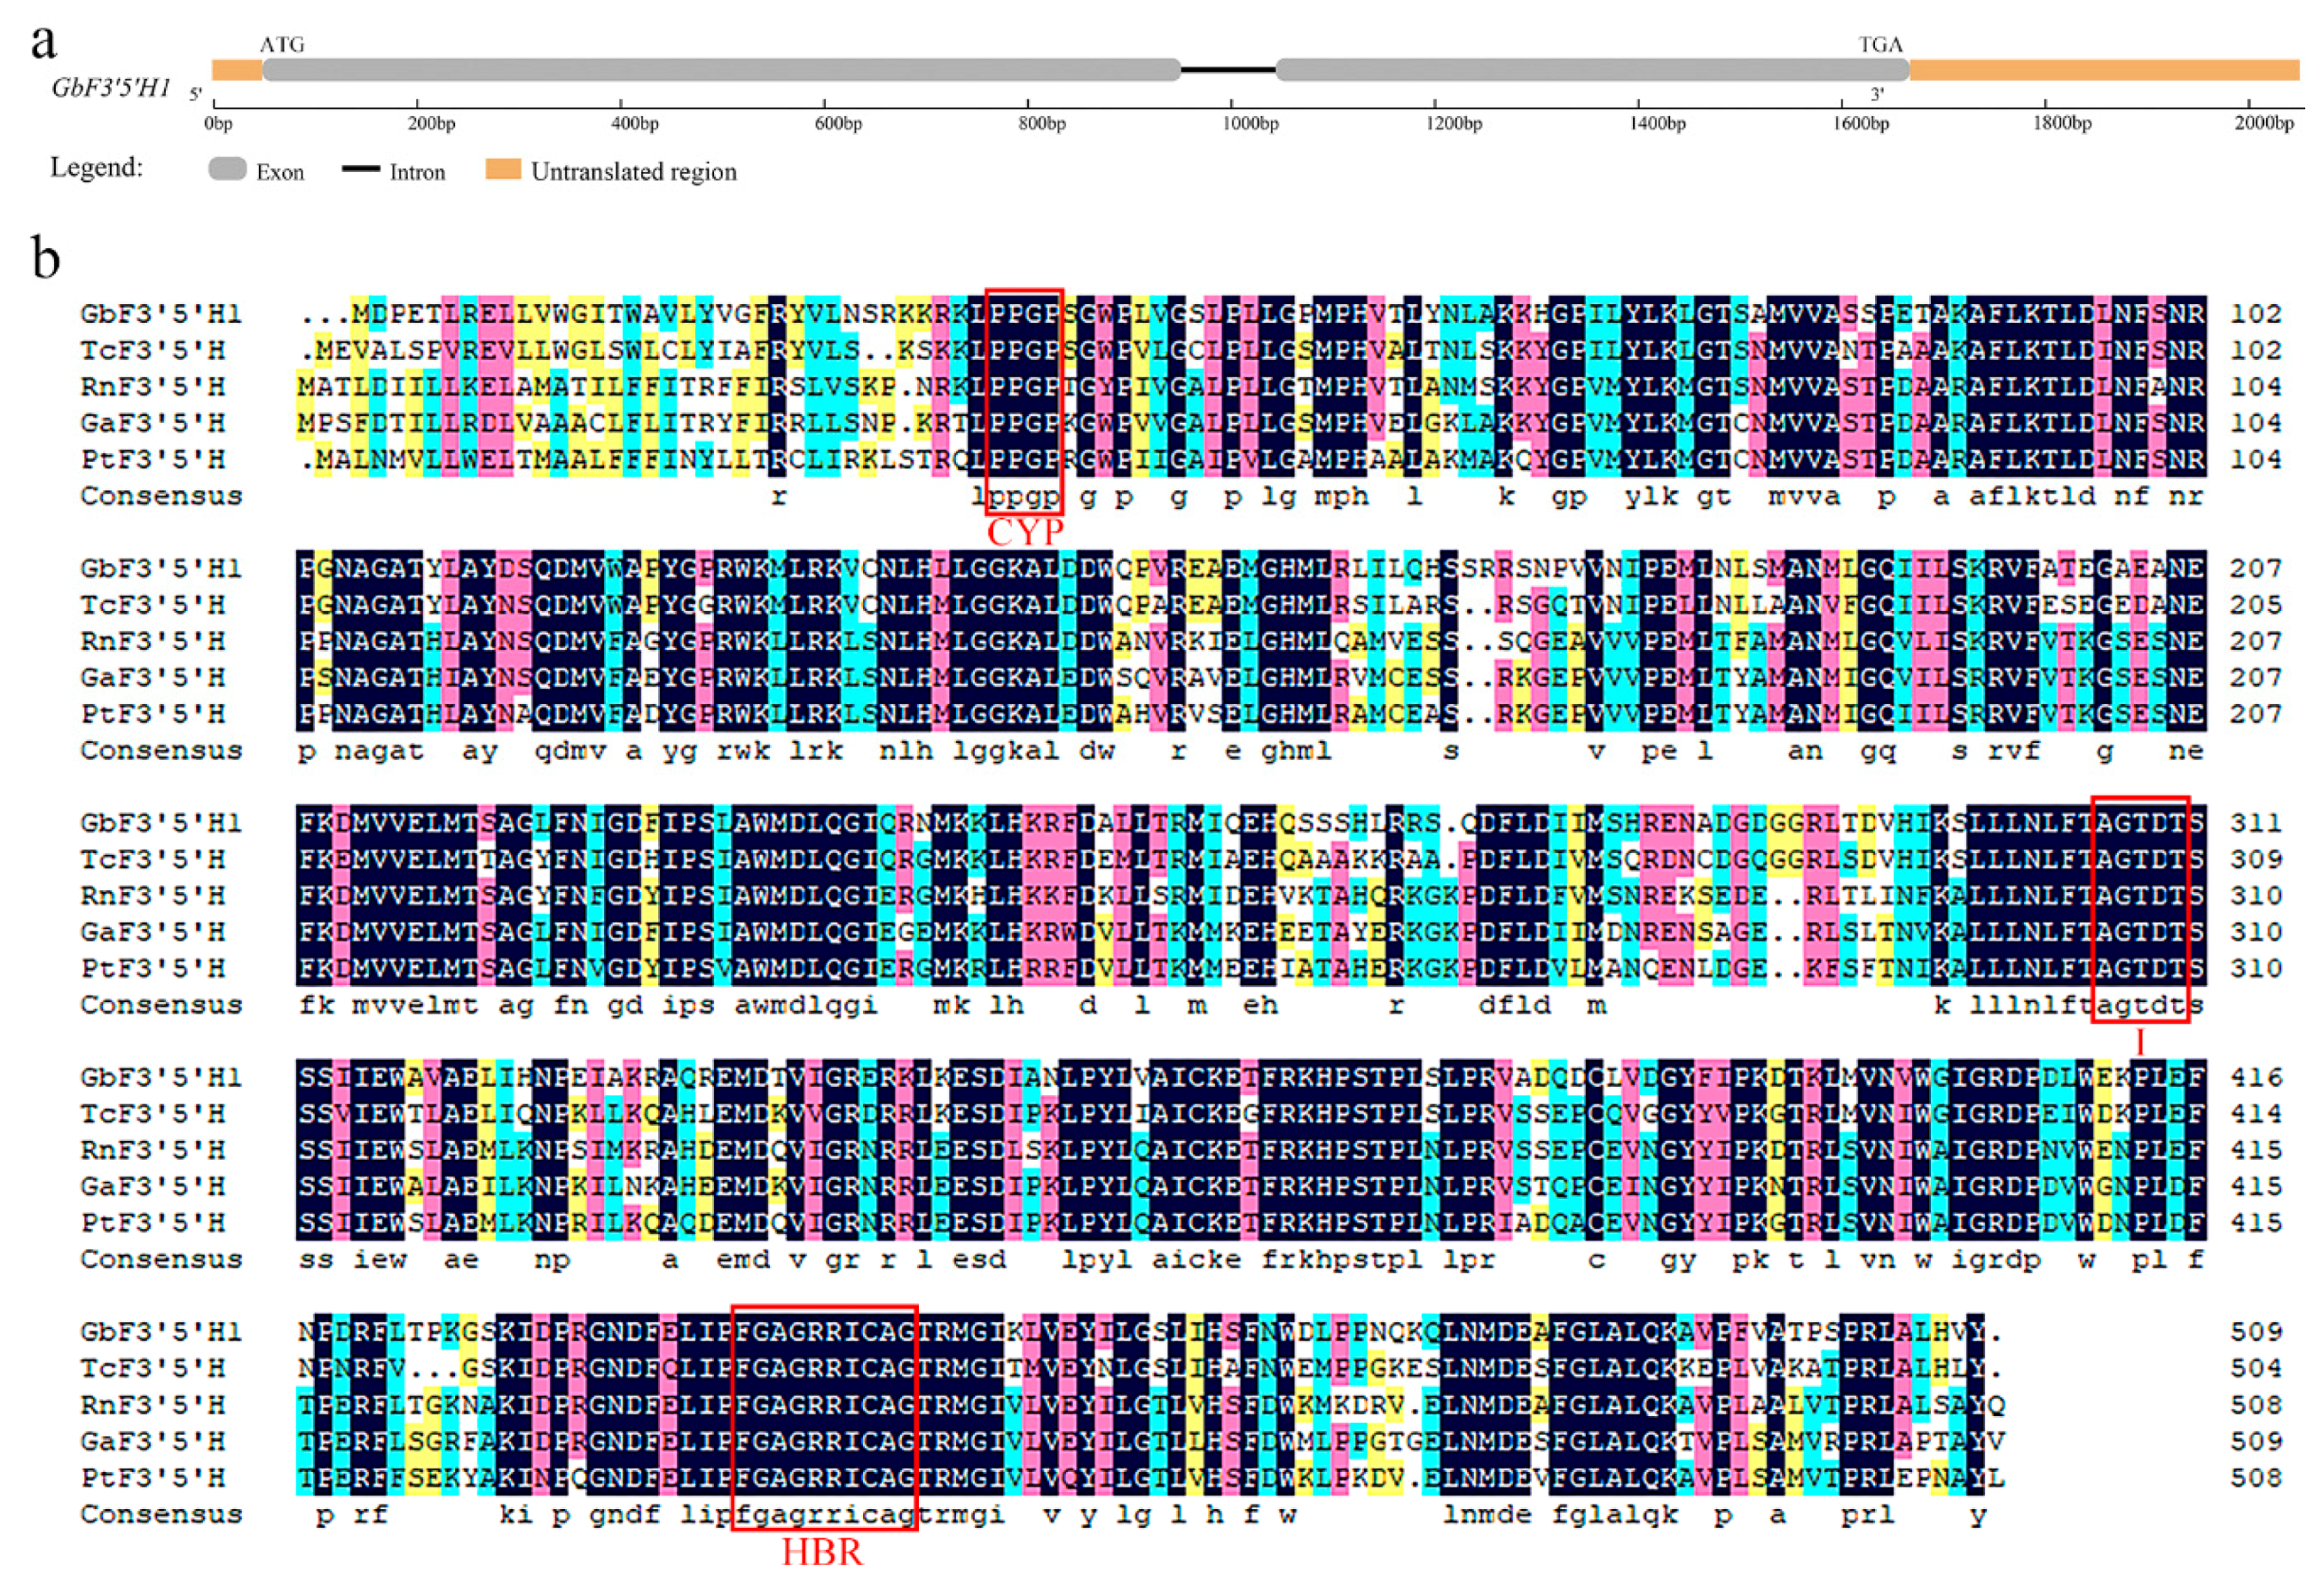
2.1. Isolation and Characterization of Ginkgo GbF3′5′H1

Based on annotated transcriptome sequences [18], we chose to further explore the important role of the differentially expressed F3′5′H protein in the flavonoid biosynthetic pathway and metabolism of ginkgo. To isolate the F3′5′H gene, 5′ RACE and 3′ RACE were performed to obtain the full-length cDNA for the putative F3′5′H gene, and the resulting gene was named GbF3′5′H1 (accession number MN862535 in GenBank). The full-length sequence of this cDNA was 1959 bp, containing an open reading frame (ORF) of 1527 bp, flanked by a 42-bp 5′-untranslated region (UTR) and a 387-bp 3′-UTR; the termination codon was TGA (Supplementary Data 1). A comparison of the exon/intron structures of the ginkgo genomic DNA and cDNA sequences indicated that this gene contains two exons and one intron (no coding amino acid) (Figure 1a).
Bioinformatics software was used to predict the protein structure of GbF3′5′H1, and the results showed that the cDNA encoded a polypeptide comprising 509 amino acids. The molecular weight of the protein encoded by GbF3′5′H1 was 57.33 kDa, and the theoretical isoelectric point (pI) was 9.19. The grand average of hydropathicity (GRAVY) was -0.185 (hydrophilic protein), and the aliphatic index was 94.85. The instability index (II) was computed to be 40.07, which classifies the protein as unstable. The TMHMM and Phobius software prediction showed that GbF3′5′H1 had one transmembrane signal. Moreover, the SOPMA program was used to predict the secondary structure of GbF3′5′H1. The results indicated that the GbF3′5′H1 protein contained 48.92% alpha helices, of which 35.36% were random coils, 10.61% were extended strands, and 5.11% were beta turns. The InterPro online results classified the functional protein encoded by GbF3′5′H1 as a member of the CYP, E-class, group I (IPR002401) protein family.

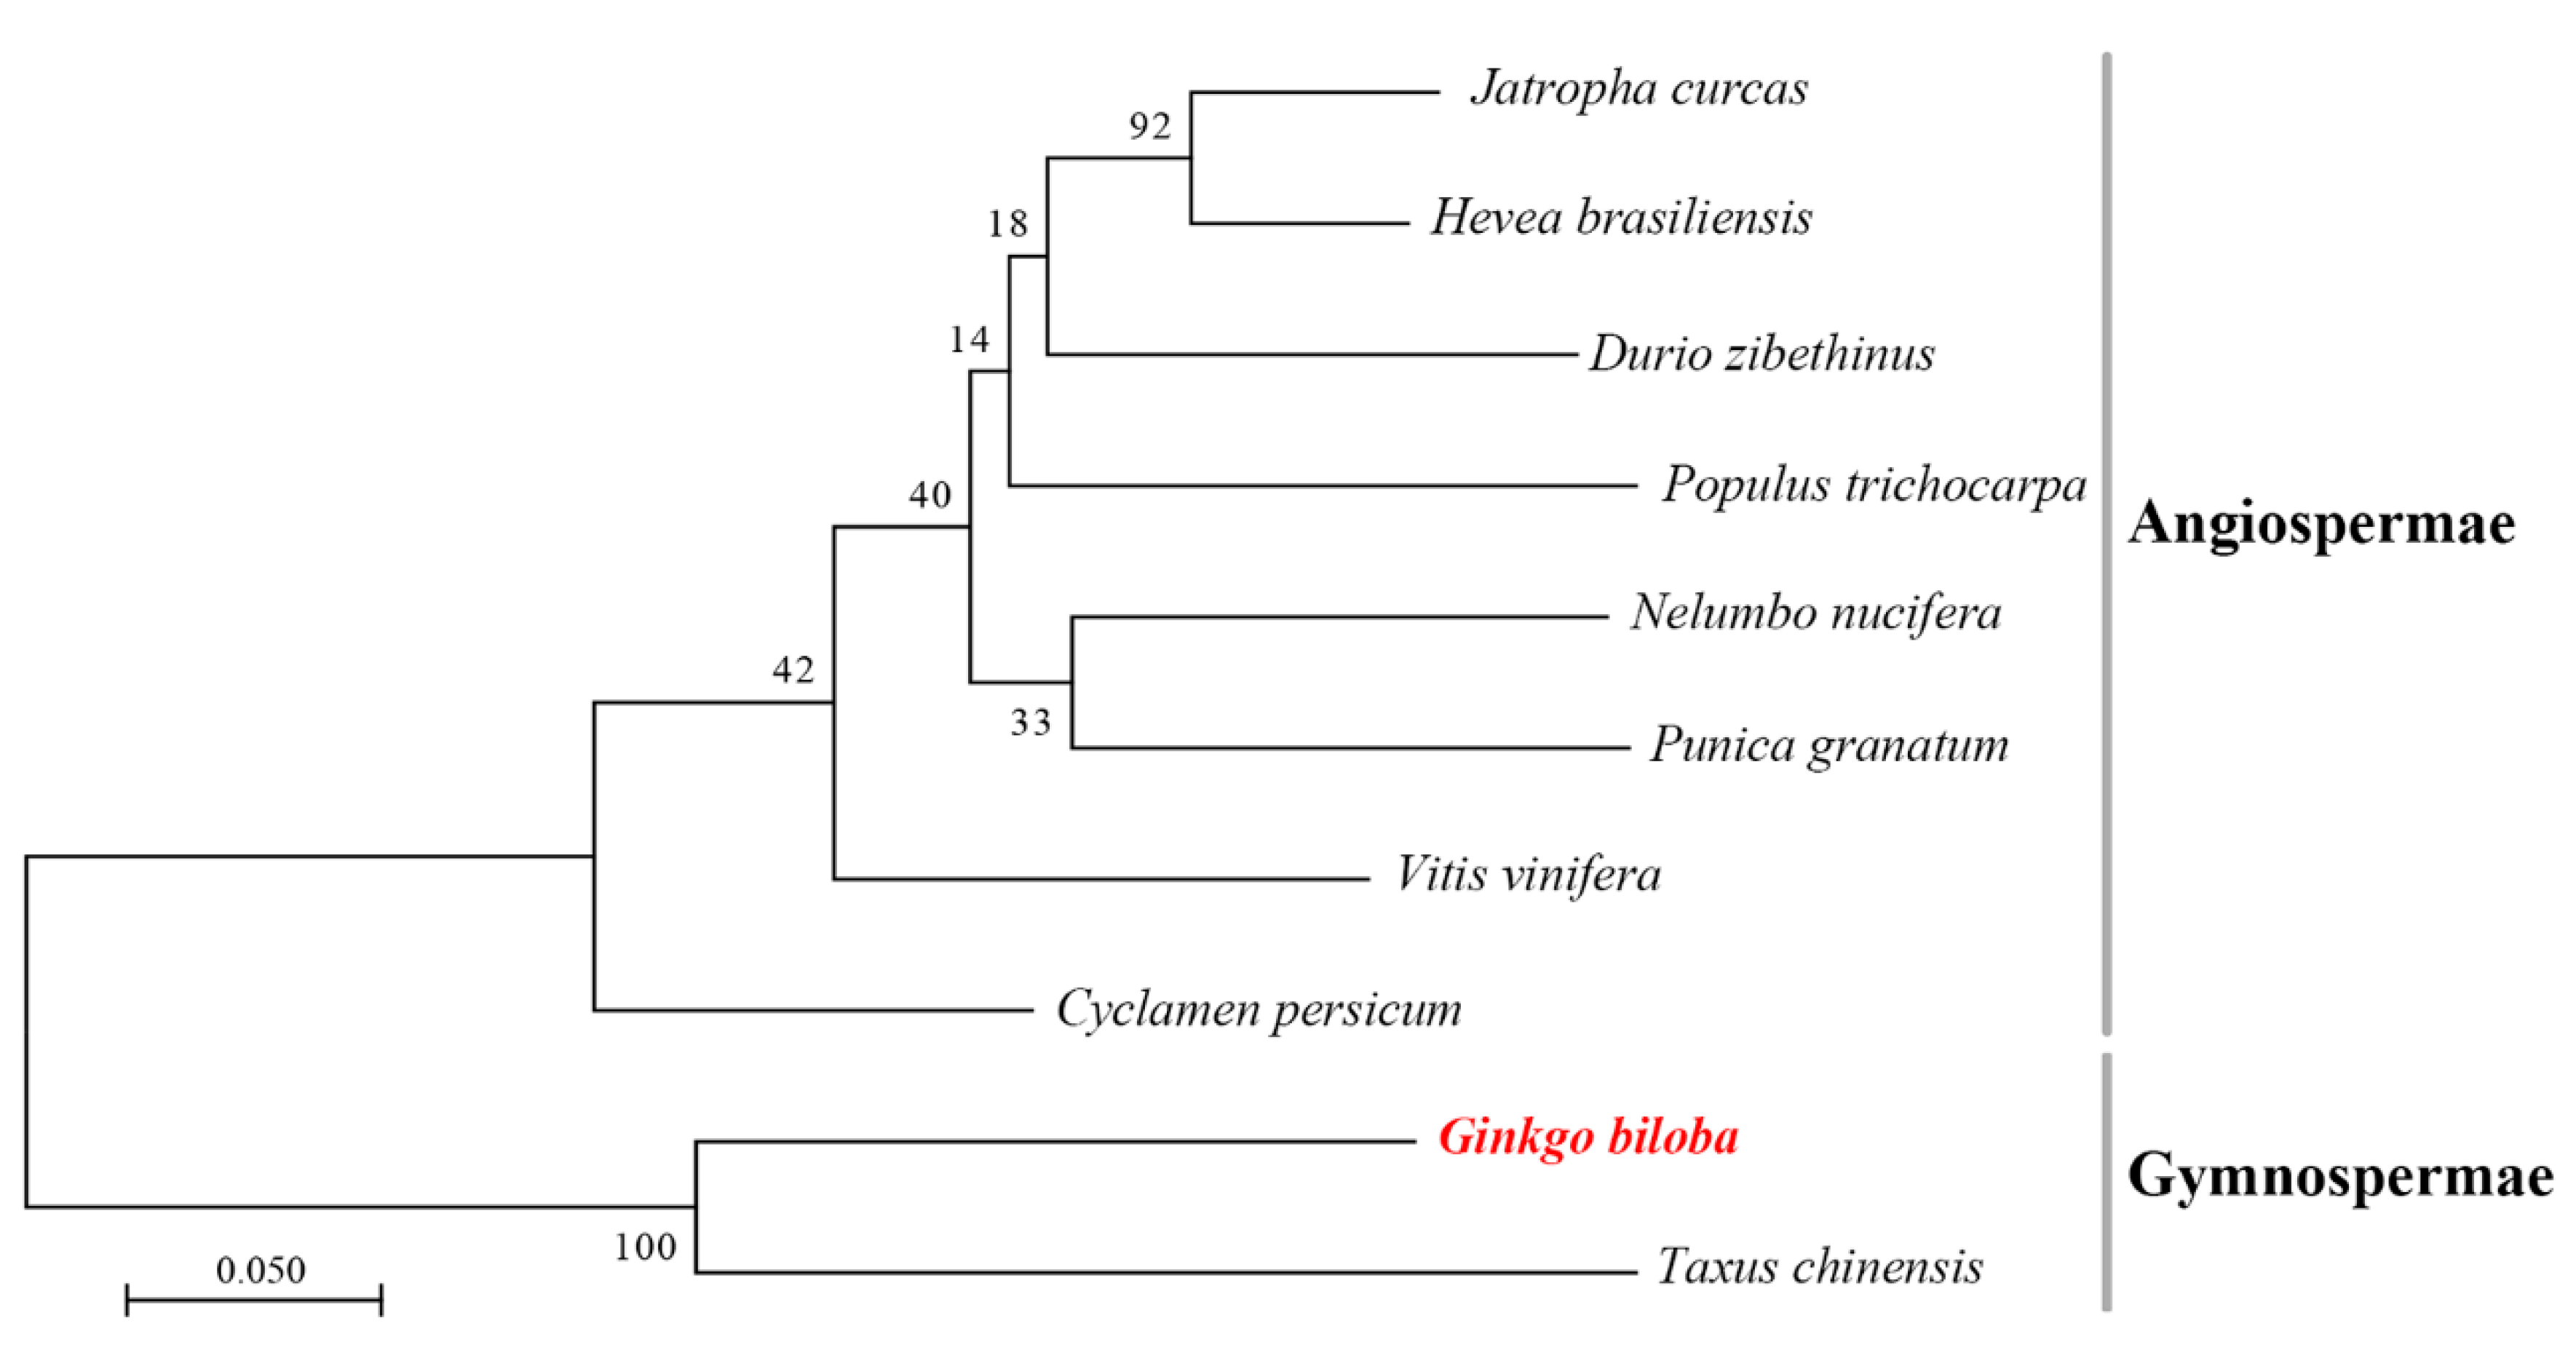
2.2. Multiple Alignment and Phylogenetic Analysis of GbF3′5′H1

The multiple alignments of GbF3′5′H1 with F3′5′Hs from other plants showed that GbF3′5′H1 has many highly conserved residues compared with the known F3′5′Hs sequences (Figure 1b). This result revealed that F3′5′Hs contain the following three highly conserved regions: (i) the proline/proline/glycine/proline (PPGP) motif in the N-terminus, (ii) the I helical region “AGTDT”, and, (iii) the heme-binding region (HBR) near the carboxy (C)-terminus “FGAGRRICAG”. In addition, the multiple alignment analysis showed that the main difference between the amino acid sequence of GbF3′5′H1 and those of F3′5′H proteins in other species is the presence of approximately 30 amino acids at the N terminus, and this sequence mainly contains hydrophobic amino acid residues.
To understand the evolutionary relationships between the GbF3′5′H1 protein and the F3′5′H proteins of other species, the amino acid sequences of 10 F3′5′H proteins were aligned. A phylogenetic tree based on this multiple sequence alignment showed that the 10 proteins were clustered into two distinct groups representing Gymnospermae and Angiospermae (Figure 2). GbF3′5′H1 had the closest relationships with Taxus chinensis, and the clustering analysis results were reliable. These two proteins were grouped with Gymnospermae, which is in accordance with the classification of these plant species. The other homologous proteins were relatively distantly related to GbF3′5′H1 and belonged to Angiospermae, but all the F3′5′H proteins of close relationships or the same family were clustered together. These relationships showed the evolutionary conservation and diversity of plant F3′5′Hs.

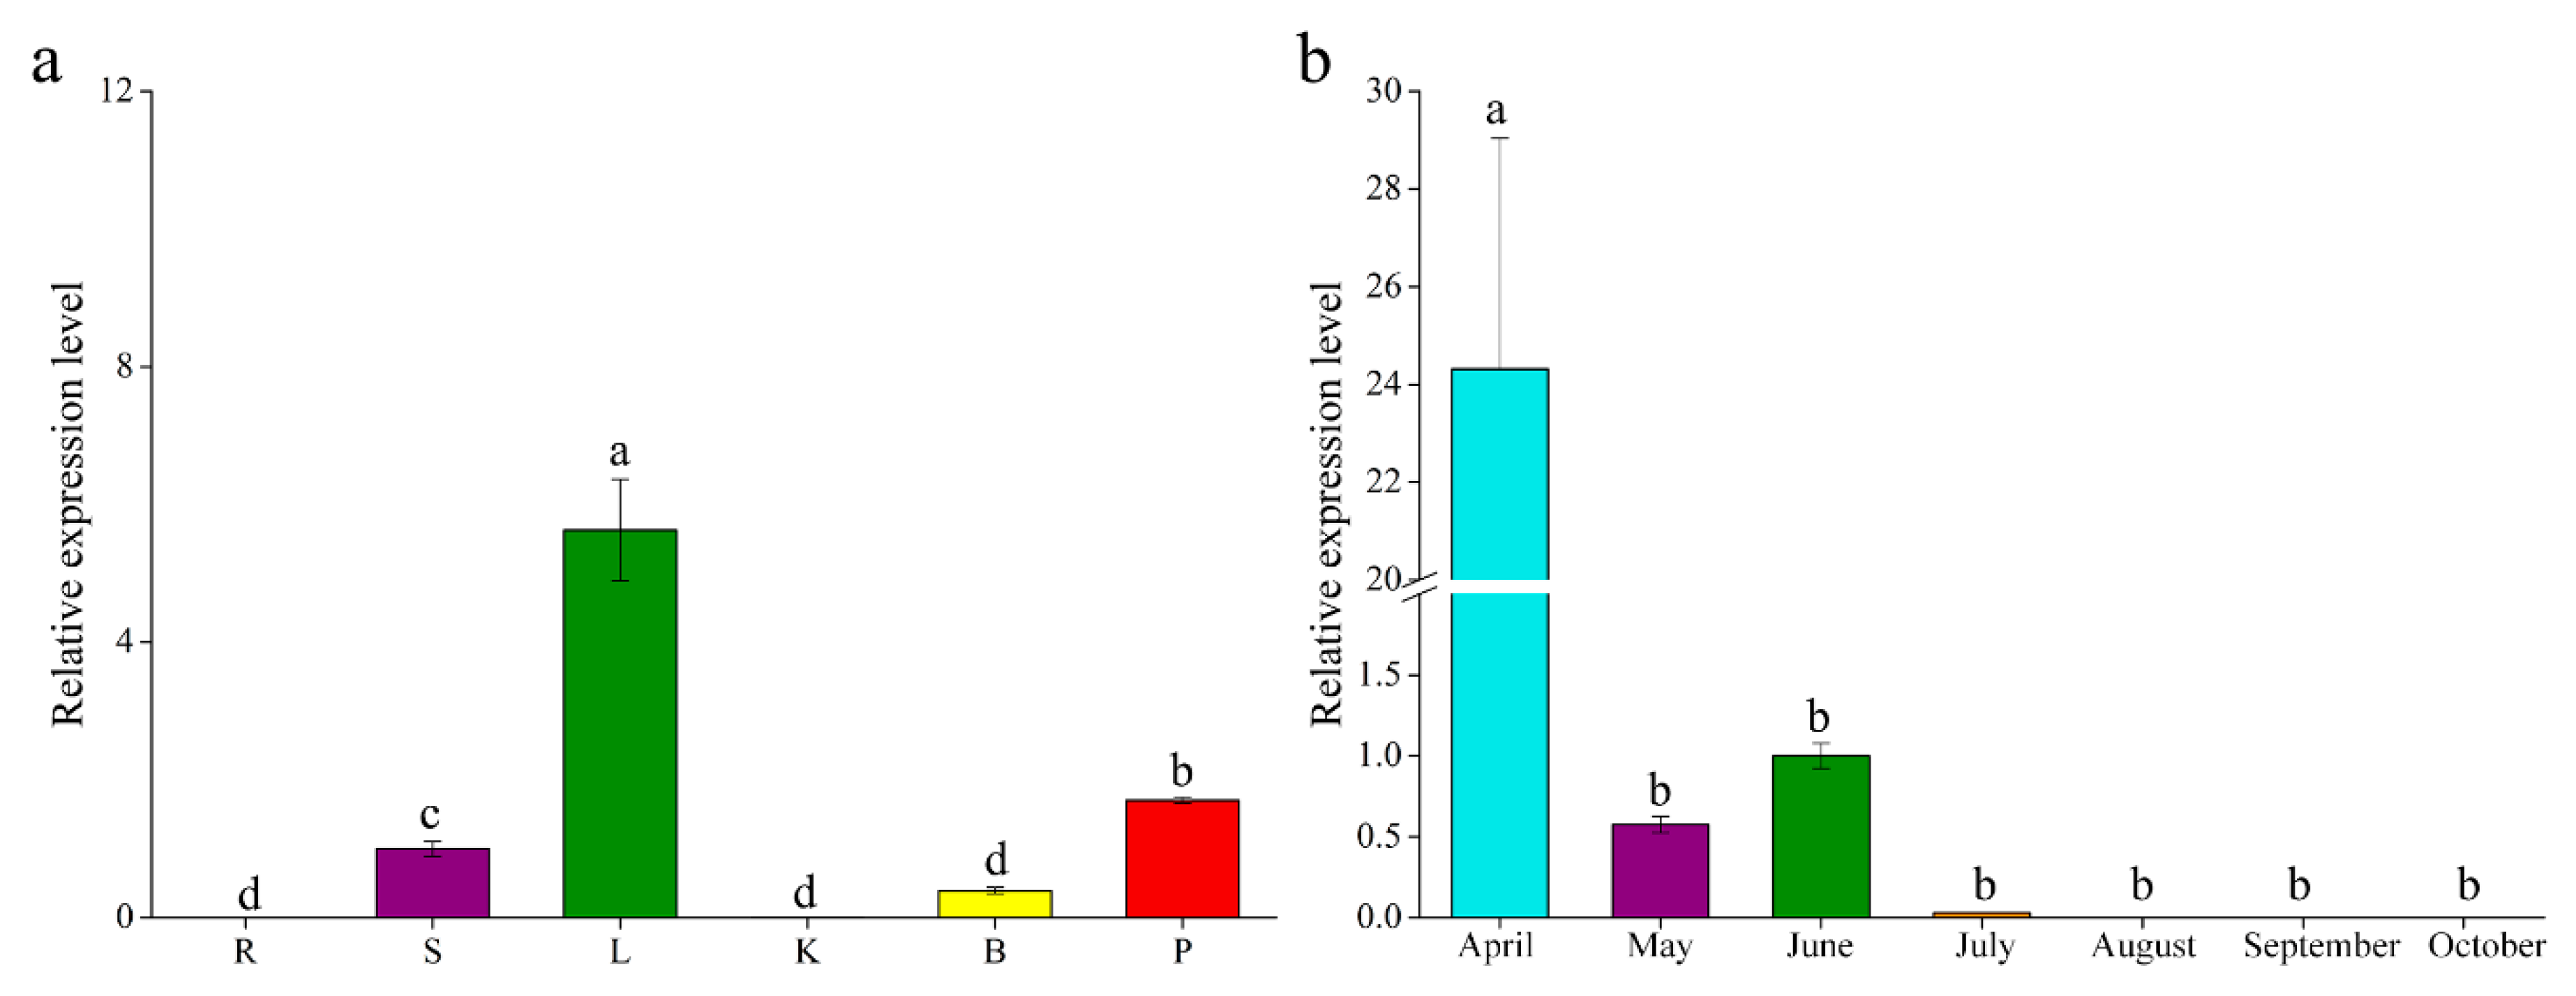
2.3. Expression Patterns of GbF3′5′H1

To analyze the expression of GbF3′5′H1, we measured its transcript levels by quantitative real-time PCR (qRT-PCR) in different tissues and at different leaf stages in ginkgo. The expression analysis showed that GbF3′5′H1 accumulated in the leaf (significantly more than in other tissues), followed by the petiole, and no expression was observed in the root and kernel (Figure 3a). There are seven stages in the development of ginkgo leaves from April to October (Figure 3b), and the accumulation of GbF3′5′H1 transcripts was the highest in ginkgo leaves in April (more than 24 times higher than that in June and significantly higher than that in other periods), and the signal was notably weak in July (only 0.3 times its expression in June). There was no expression in the leaves from August to October.

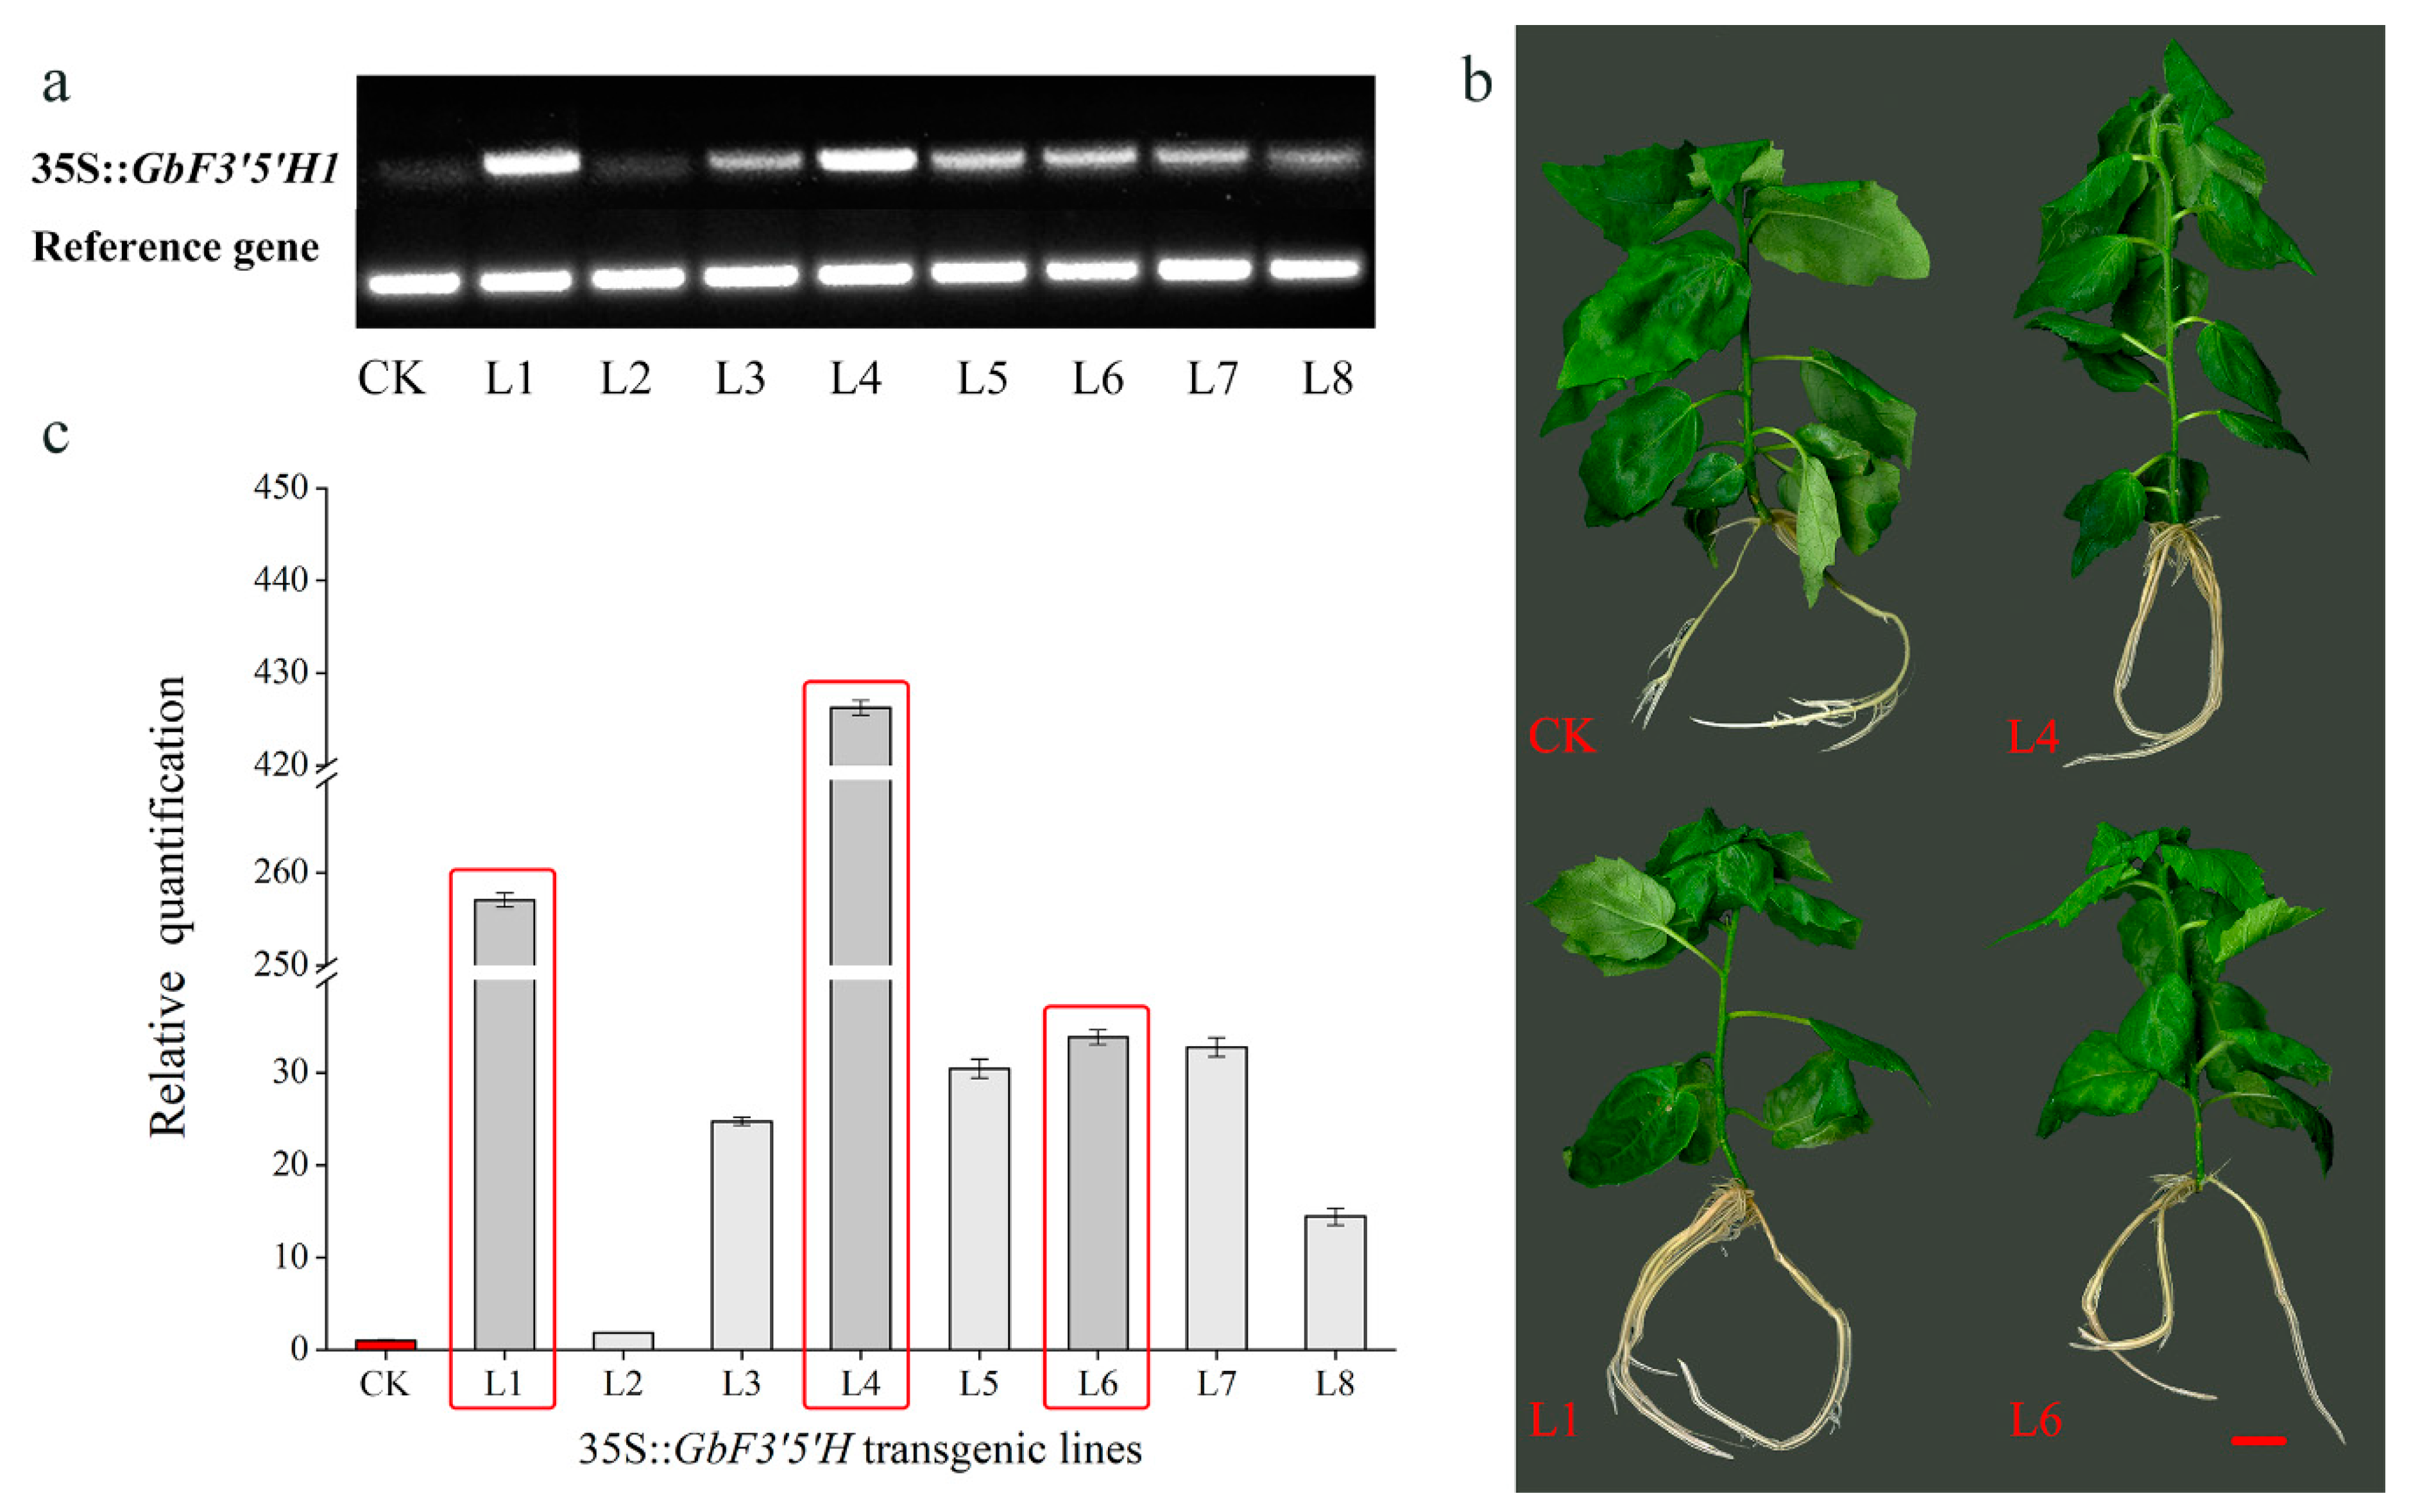
2.4. Heterologous Overexpression of GbF3′5′H1 in Populus

To investigate the function of GbF3′5′H1 in vivo, multiple 35S:GbF3′5′H1 Populus transgenic lines were obtained and then validated by PCR. Eight independent transgenic lines were used to detect the expression level of GbF3′5′H1 via semiquantitative qPCR (sqPCR) and qRT-PCR (Figure 4a,c). The results indicated that GbF3′5′H1 was successfully expressed in all eight transgenic lines, and its expression levels were similar in the sqPCR and qRT-PCR analyses. The qRT-PCR results showed that the expression level of GbF3′5′H1 in transgenic line 4 was the highest (the relative expression level was 426 times that of the control), followed by those of lines 1 and 6. The expression levels of all eight transgenic lines were higher than those of the CK poplars. After verifying the transgenic plants, we selected three transgenic overexpression lines (L1, L4, and L6) for subsequent experiments (Figure 4b). Moreover, we randomly selected six transgenic overexpression lines to observe their growth performance phenotypes at 45 days. The results showed no significant differences in the number of adventitious roots developed, maximum length of adventitious roots, and plant height compared with those of CK plants (Table S1). Hence, we concluded that there was very little difference in the growth phenotypes of the CK and transgenic plants at 45 days (Figure 4b).

2.5. Comparison of Flavonoid-Related Metabolites in CK and Transgenic Populus

Nontargeted gas chromatography-mass spectrometry (GC-MS) analysis showed that a total of 199 metabolites were identified (Supplementary Data 2). Among them, 45 significantly different metabolites were found between the CK and transgenic groups. The contents of 17 significantly different metabolites were higher in transgenic plants than that in CK plants. These 45 significantly different metabolites were mainly divided into the following nine super classes: organooxygen compounds (5); organic oxygen compounds (6); organic acids and derivatives (8); phenylpropanoids and polyketides (3); lipids and lipid-like molecules (3); nucleosides, nucleotides, and analogs (2); benzenoids (2); a homogeneous nonmetal compound (1); and an organoheterocyclic compound (1). In addition, the remaining 14 significantly different metabolites were unclassified. Four metabolites were closely related to flavonoid biosynthesis (Table 1). The contents of 4′,5-dihydroxy-7-glucosyloxyflavanone, epicatechin, and gallocatechin were significantly higher in the transgenic plants than in the CK plants by approximately 3.0, 2.5, and 2.3 times, respectively (Table 1). In total, three flavonoid-related metabolites showed significantly higher contents in the transgenic seedlings than in the CK.

3. Discussion

Flavonoids are among the most prevalent and biologically significant classes of secondary metabolites in ginkgo leaves [18,29]. In this study, we detected a differentially expressed F3′5′H gene known to be homologous to enzymes involved in the flavonoid synthesis pathway through transcriptome sequencing. A better understanding of the underlying molecular mechanism of flavonoid biosynthesis and its regulation could provide novel insights into improving the content of flavonoid-related metabolites. Thus, we cloned and characterized the GbF3′5′H1 gene and assessed its expression in different tissues and at different leaf development stages. Moreover, we heterologously overexpressed GbF3′5′H1 in Populus to investigate its function and then identified four metabolites closely related to flavonoid biosynthesis, including three metabolites with contents that were significantly higher in transgenic plants than in CK plants. These results confirmed that the GbF3′5′H1 gene functions in the biosynthesis of flavonoid-related metabolites, especially flavan-3-ols.

3.1. Sequencing and Phylogenetic Analysis

In this study, a 1959-bp full-length cDNA of the GbF3′5′H1 gene, encoding a 509 amino acid protein, was isolated from ginkgo. Our multiple alignment showed that the deduced GbF3′5′H1 sequence exhibited high homology to the sequences of other plant F3′5′H proteins (Figure 1b). F3′5′H encodes a hydroxylase in the CYP family [30]. In this study, we found that the GbF3′5′H1 gene contains several important structures, such as the C-terminal HBR, CYP motif, I helical region, and differential N-terminal amino acid sequence. This finding is consistent with other conserved sequences of F3′5′H proteins reported previously [3,28,31,32]. Among them, the C-terminal HBR “FGAGRRICAG” is a necessary sequence of CYP enzymes that is highly conserved among different species. This sequence is regulated by cysteine (Cys); this residue is at the center, and the amino acids to its left and right form specific structures around the Cys [33]. The CYP motif “PPGP” is also highly conserved in different species and serves as a hinge between the globular part of the protein and the membrane anchor [34,35]. The “AGTDT” of the I helical region is also highly conserved, and it is believed that this motif can promote the formation of oxygen molecules, acts as the binding region for proton transfer, and affects the selection and binding of substrates [36,37]. In addition, the differences in the amino acid sequences of F3′5′Hs in different species mainly lies in approximately 30 amino acids at the N terminus; this region is mainly hydrophobic. This sequence is the signal sequence indicating the membrane insertion point (known as a termination transfer signal), which mainly contains hydrophobic amino acid residues that can be anchored on the membrane [38], and this sequence is the main difference among the F3′5′H genes from different species. These facts indicate that GbF3′5′H1 belongs to the CYP family and is highly homologous to F3′5′H sequences from other species.
Through gene structural analysis, we found that GbF3′5′H1 had two exons and one intron (Figure 1a). Previous studies have shown that exons directly encode proteins and that introns affect RNA synthesis during transcription [39,40]. In addition, an interaction occurs between introns and the corresponding coding sequences after shearing, which plays an important role in the regulation of mRNA transport and gene expression [41,42,43]. Hence, the evolutionary and functional roles of the GbF3′5′H1 intron remain to be studied. Moreover, F3′5′H protein sequences have been reported in divergent species across the plant kingdom [31,32,35,44]. In the present study, the phylogenetic tree indicated that GbF3′5′H1 has a distinct and ancient relationship with the F3′5′Hs of other species in Gymnospermae, which is in accordance with the classifications of the plant species [45,46]. These results showed that the F3′5′H1 protein in ginkgo is highly conserved and may have similar functions to those of the F3′5′H proteins in Taxus chinensis. These relationships reflect the evolutionary conservation and diversity of plant F3′5′Hs.

3.2. Differential Expression Patterns

Ginkgo is a widely used medicinal plant with high utilization value due to its flavonoids [20,47,48]. A pharmacological study by Ahlemeyer et al. (2003) indicated that the therapeutic use of ginkgo extract is beneficial for Alzheimer’s disease [20]. Moreover, ginkgo flavonoids was shown to treat cardiovascular diseases through diverse mechanisms [48]. Therefore, the differential expression patterns of the GbF3′5′H1 gene, which is involved in the flavonoid biosynthetic pathway, could aid in further assessing the possible functions of flavonoids. Our expression analysis indicated that GbF3′5′H1 accumulated in the leaf at a level significantly higher than that in other tissues (except for the aging leaves after September) (Figure 3a), implying that this gene might play important roles in the leaf. This finding is consistent with the higher content of flavonoids in ginkgo leaves than in other tissues, and the leaf of ginkgo is the most commonly used part of the plant, with the greatest medicinal value [18,49]. Previous studies indicated that the mRNA transcripts of F3′5′H accumulated in the petals of Petunia hybrida and Pericallis × hybrida [28,31]. This finding is different from the results of this study; this difference may be because ginkgo is a woody plant without petals, while the plants with high expression in the petals are herbaceous plants, mostly with ornamental value, and the petals are their most important ornamental parts. In addition, additional studies of GbF3′5′H1 expression during leaf development showed that its expression was highest in April (Figure 3b). The differential expression of this gene during leaf development might be one of the key mechanisms underlying the production of flavonoids. Some studies have shown that the flavonoid content of ginkgo leaves was relatively high in May [18,50]. Thus, there may be a delay between the expression of this gene and the synthesis of flavonoids. The high expression of this gene in April and the accumulation and synthesis of flavonoids in ginkgo could gradually lead to a higher flavonoid content in May.

3.3. Functional Analysis

At present, research on genes involved in flavonoid synthesis in ginkgo is limited to in vitro enzyme activity analysis, gene expression analysis, and flavonoid content collaborative analysis [7,10,11,12], and no experiment has suggested the endogenous functions of these compounds in woody plants. Flavonoids are secondary metabolites unique to plants that have antioxidation, antitumor, and blood circulation-promoting effects [29,51]. Since no genetic transformation and regeneration system is available for ginkgo, this study investigated the biological function of the GbF3′5′H1 gene by genetically transforming poplar, a woody model plant. After this gene was overexpressed in Populus, a nontargeted GC-MS analysis showed four metabolites closely related to flavonoid biosynthesis (Table 1), and the overexpression of the GbF3′5′H1 gene in Populus promoted the production of three metabolites: 4′,5-dihydroxy-7-glucosyloxyflavanone, epicatechin, and gallocatechin. A functional analysis of F3′5H from Camellia sinensis by Wang et al., (2014) showed that F3′5H plays a critical role in the accumulation of catechins [52]. Although the results of this study are different from those of Wang et al., (2014), catechin, epicatechin, and epigallocatechin are flavan-3-ols. Taken together, these results showed that the F3′5H gene has a wide range of flavonoid substrate activities and suggested that the heterologous overexpression of GbF3′5′H1 can produce a large amount of flavan-3-ol content.
Boase et al. [53] obtained the F3′5′H gene of cyclamen through rapid amplification of cDNA ends (RACE) cloning technology and changed the color of cyclamen petals by means of antisense suppression. Such reverse genetic methods will be helpful to further study the function of GbF3′5′H1 and should be pursued in the future. The regulation of flavonoid metabolism is a complex process. The overexpression of one GbF3′5′H1 gene was not expected to alter all of the wide variety of flavonoid compounds, but notably, three metabolites related to flavonoids were significantly increased in this study. F3′5′H competes with flavanone 3-hydroxylase, flavonoid 3′-hydroxylase, and flavonol synthase, and the competition among these enzymes affects the balance among the final products [44,54]. Therefore, we intend to further study the influences of other key enzyme-coding genes on flavonoid-related metabolites.

4. Materials and Methods

4.1. Plant Materials and Growth Conditions

Ginkgo trees grown at Nanjing Forestry University (118°81′’E, 32°08′’N, Jiangsu Province) were sampled. Leaves were collected at different developmental stages once per month from April to October to investigate gene expression patterns. After collection, the plant materials were rapidly frozen in liquid nitrogen and placed in an ultralow temperature freezer at −80 °C until use.
Tissue culture seedlings of the hybrid poplar, Populus davidiana × Populus bolleana, were grown at a temperature of 25 °C (day) and 18 °C (night) under a 16-h light and 8-h dark photoperiod. The cultured plantlets were cultivated on Murashige and Skoog medium (pH = 5.8) supplemented with 0.3% (w/v) Gelrite and 3.0% (w/v) sucrose.

4.2. Cloning of the GbF3′5′H1 Gene

Total RNA was extracted from ginkgo leaves using the RNAprep Pure Plant kit (Tiangen, Beijing, China). Specific primers were designed based on ginkgo transcriptome data [18] that included functional annotation of the F3′5′H protein. The full-length cDNA sequence of GbF3′5′H1 was cloned using rapid amplification of cDNA ends (RACE) technology. Nested primers were designed to amplify full-length cDNA via the SMARTer RACE 5′/3′ Kit (Clontech, Japan) per the manufacturer’s manual. These primers (GbF3′5′H1_5′OUTER, GbF3′5′H1_3′OUTER, GbF3′5′H1_5′INNER, and GbF3′5′H1_3′INNER) were designed using Oligo 6.0 software (Table S2). Then, PCR products were separated by 1% agarose gel extraction and transformed into Escherichia coli competent cells using pMD19-T vector insertion (Takara, Japan). The colonies were checked using PCR, the positive colonies were selected, and Sanger sequencing was performed. The full-length cDNA sequencing of GbF3′5′H1 was obtained by splicing the 5′ and 3′ RACE sequences, and NCBI ORF Finder was used to predict the open reading frame (ORF). The GbF3′5′H1 ORF was amplified using the following PCR program: 95 °C for 3 min, 33 cycles of 95 °C for 30 s, 55 °C for 40 s, and 72 °C for 90 s, and a final extension at 72 °C for 10 min. Then, the target fragment was ligated into the pMD19-T vector and transformed into Escherichia coli TOP 10 cells. Positive clones were identified and sent for Sanger sequencing. In addition, the genomic DNA of ginkgo leaves was extracted using a Plant Genomic DNA Kit (cetyltrimethylammonium bromide (CTAB)) (Zoman, Beijing, China) to analyze the structural characteristics of the GbF3′5′H1 gene.

4.3. Bioinformatics Analysis

DNA and protein sequence analyses were conducted using BioEdit. The structure of the GbF3′5′H1 gene was visualized using the Gene Structure Display Server (http://gsds.cbi.pku.edu.cn/). The physical and chemical properties were predicted using ExPASy ProtParam (http://web.expasy.org/protparam/). The secondary structure was predicted by the online program self-optimized prediction method with alignment (SOPMA) (https://npsa-prabi.ibcp.fr/cgi-bin/npsa_automat.pl?page=npsa_sopma.html). Homologous sequences were obtained by searching for homologous alignments using the online Basic Local Alignment Search tool (BLAST) (https://blast.ncbi.nlm.nih.gov/). The deduced amino acid sequences and other downloaded protein sequences homologous to F3′5′H were used for multiple alignments using DNAMAN software. In addition, a phylogenetic tree was constructed using MEGA 7.0 software [55] by the maximum likelihood method based on a Poisson correction model [56] with 1000 bootstrap replications. The analysis included twelve amino acid sequences.

4.4. Quantitative Real-Time PCR (qRT-PCR) Analysis

To test the transcript expression levels of the GbF3′5′H1 gene, qRT-PCR was carried out. Total RNA was extracted using an RNAprep Pure Plant kit (Tiangen, Beijing, China), which was then reverse-transcribed using a PrimeScript RT Master Mix (Takara, Dalian, China) to synthesize first-strand cDNA according to the manufacturer’s instructions. The cDNA was diluted 5 times as a template. Primers for qRT-PCR amplification of GbF3′5′H1 (named GbF3′5′H1_qPCR in Table S2) and the internal reference gene (named the ginkgo reference gene in Table S2) were designed. A qRT-PCR analysis was performed using a FastStart Universal SYBR Green Master with 6-Carboxyl-X-Rhodamine (ROX) for the RT-PCR kit (Roche, Indianapolis, IN, USA) in accordance with the manufacturer’s instructions on the Applied Biosystems (ABI) ViiA 7 Real-time PCR platform. The reaction volume was 10 μL, and the PCR program was as follows: 95 °C for 2 min, 40 cycles at 95 °C for 15 s, and 95 °C for 1 min. Relative expression levels were calculated by the 2−ΔΔCt method [57]. The glyceraldehyde-3-phosphate dehydrogenase gene (forward primer (5′-3′): GGTGCCAAAAAGGTGGTCAT and reverse primer (5′-3′): CAACAACGAACATGGGAGCAT) was used as a ginkgo reference gene. Elongation factor 1 alpha (forward primer (5′-3′): GGCAAGGAGAAGGTACACAT and reverse primer (5′-3′): CAATCACACGCTTGTCAATA) was used as a Populus reference gene. All data are expressed as the mean ± standard deviation. The data were analyzed using Duncan’s multiple range test in SPSS 22.0 software (SPSS Inc., Chicago, IL, USA). A p-value < 0.05 was considered statistically significant.

4.5. Transformation of Populus and Detection of Transgenic Populus Lines

The ORF of GbF3′5′H1 was cloned into the entry vector pCR8/GW/TOPO (Invitrogen, USA). After verification by sequencing (primer named BP detection in Table S2), the fragment inserted in the entry vector was transferred to the destination vector pBI121 with a C-terminal HA-tag by an LR reaction (Table S2). The resulting vector (35S:GbF3′5′H1) was a high-copy vector with overexpression elements (35S promoter from the cauliflower mosaic virus (CaMV)). The constructed vector, 35S:GbF3′5′H1, was transformed into Agrobacterium tumefaciens strain EHA105 for the Populus davidiana × Populus bolleana transformation based on a previous method [58]. After screening using kanamycin resistance, CK and putatively transformed Populus lines were validated by semiquantitative qPCR (sqPCR) and qRT-PCR, as described above (named GbF3′5′H1_qPCR in Table S2).

4.6. Nontargeted Metabolic Assay

To determine whether the overexpression of GbF3′5′H1 affected the synthesis of flavonoid-related metabolites in the transgenic plants, we used nontargeted metabolic analysis to detect differentially expressed metabolites and to determine the concentrations of metabolites in transgenic Populus leaves.

4.6.1. Sample Preparation and GC-MS Processing

The leaves of three different CK Populus lines and three different transgenic Populus lines (L1, L4, and L6) were collected from plants grown under the same conditions. Notably, three transgenic clones of each transgenic line were collected by a mixed sampling method. In the Supplementary Data 2, GbF3′5′H1-1 represents the transgenic Populus line 4, GbF3′5′H1-2 represents the transgenic Populus line 1, and GbF3′5′H1-3 represents the transgenic Populus line 6. Each plant sample was accurately weighed to 60 mg and put into a 1.5-mL centrifuge tube, and 40 μL of internal standard (L-2- chlorophenylalanine, 0.3 mg/mL) was added. Two small steel balls and 360 μL of cold methanol were successively added and placed in the refrigerator at −80 °C for 2 min. Then, the balls were placed in a grinding machine and ground at 60 Hz for 2 min, and ultrasonic extraction was performed in an ice water bath for 30 min. Then, 200 μL of chloroform was added and vortexed (2 min), and 400 μL of water was added and vortexed (2 min). The samples were ultrasonically extracted in an ice water bath for 30 min and then incubated at −20 °C for 30 min. These samples were centrifuged at 12,000 rpm and 4 °C (10 min). The quality control (QC) sample was prepared by mixing aliquots of all samples to form a pooled sample. The sample was dried with a centrifugal concentrator, and 80 μL of 15-mg/mL methoxylamine hydrochloride in pyridine was subsequently added. The resultant mixture was vortexed vigorously for 2 min and incubated for 90 min at 37 °C. A total of 80 μL of N,O-bis (trimethylsilyl) trifluoroacetamide (BATFA) (with 1% trimethylchlorosilane (TMCS)) and 20 μL of n-hexane was added to the mixture, which was vortexed vigorously (2 min) and then derivatized at 70 °C (60 min).
All samples were placed at ambient temperature for 40 min before GC-MS analysis. The derivative samples were analyzed on an Agilent 7890B gas chromatography system with an Agilent 5977A MSD system (Agilent Technologies Inc., CA, USA). The subsequent GC-MS processing and analysis referred to the Chen et al. [59] study.

4.6.2. Data Preprocessing and Statistical Analysis

ChemStation (version E.02.02.1431, Agilent, USA) software was used to convert the raw data (.D format) to. CDF format, and then the. CDF data were imported into ChromaTOF software (version 4.34, LECO, St Joseph, MI, USA) for data processing. The metabolites were annotated with the Fiehn or national institute of standards and technology (NIST) database. After alignment with the Statistic Compare component, raw data processing and statistical analysis were performed based on research by Ning et al. [60] and Xiong et al. [61], respectively.

4.6.3. Selection of Differentially Expressed Metabolites

Differentially expressed metabolites were selected based on the combination of a statistically significant threshold of variable influence on projection (VIP) values obtained from the orthogonal partial least squares discriminant analysis (OPLS-DA) model and p-values from a two-tailed Student’s t-test on the normalized peak areas from different groups. Metabolites with VIP values larger than 1.0 and p-values less than 0.05 were considered differentially expressed metabolites.

5. Conclusions

In this study, we isolated and characterized the full-length 2051-bp GbF3′5′H1 gene (full-length cDNA sequence was 1959-bp), which encodes a protein of 509 amino acids, from ginkgo. We found that the expression of GbF3′5′H1 was the highest in the leaf and during April. Furthermore, nontargeted GC-MS analysis showed that the overexpression of GbF3′5′H1 can increase the contents of the flavonoid-related metabolites 4′,5-dihydroxy-7-glucosyloxyflavanone, epicatechin, and gallocatechin in transgenic Populus; these results help to reveal the role of GbF3′5′H1 in plant metabolism. Our findings contribute to a better understanding of the underlying molecular mechanism of flavonoid biosynthesis and its regulation and help to provide a scientific basis to improve the accumulation of flavonoids in plants.

Supplementary Materials

The following are available online. Table S1: Statistics of adventitious root development and plant height in nontransgenic and transgenic Populus (45 d). Table S2: Primers for GbF3′5′H1 gene cloning, vector construction, and expression analysis. Supplementary Data 1: The full-length cDNA and amino acid sequences of GbF3′5′H1. Supplementary Data 2: All metabolites were identified by nontargeted GC-MS analysis.

Author Contributions

L.-A.X. and Y.W. conceived and designed the project. Y.W. performed the experiments, wrote the manuscript, and analyzed the data, with contributions from T.W., G.W., and L.-A.X. Y.X. helped to complete the experiments. T.W. and L.-A.X. revised the manuscript. All authors have read and agreed to the published version of the manuscript.

Funding

This study was supported by the National Natural Science Foundation of China (31971689), the Special Fund for Forest Scientific Research in Public Welfare (201504105), the Agricultural Science and Technology Independent Innovation Funds of Jiangsu Province (CX(16)1005), the National Key Research and Development Program of China (2017YFD0600700), the Postgraduate Research & Practice Innovation Program of Jiangsu Province (KYCX18_0954), and the Priority Academic Program Development of Jiangsu Higher Education Institutions (PAPD).

Conflicts of Interest

The authors declare no conflict of interest.

References

  1. Huang, W.; Sun, W.; Wang, Y. Isolation and molecular characterisation of flavonoid 3′-hydroxylase and flavonoid 3′, 5′-hydroxylase genes from a traditional Chinese medicinal plant, Epimedium Sagittatum. Gene 2012, 497, 125–130. [Google Scholar] [CrossRef]
  2. Pourcel, L.; Routaboul, J.; Cheynier, V.; Lepiniec, L.; Debeaujon, I. Flavonoid oxidation in plants: From biochemical properties to physiological functions. Trends Plant Sci. 2007, 12, 29–36. [Google Scholar] [CrossRef] [PubMed]
  3. Olsen, K.M.; Hehn, A.; Jugdé, H.; Slimestad, R.; Larbat, R.; Bourgaud, F.; Lillo, C. Identification and characterisation of CYP75A31, a new flavonoid 3′5′-hydroxylase, isolated from Solanum lycopersicum. BMC Plant Biol. 2010, 10, 21. [Google Scholar] [CrossRef] [Green Version]
  4. Winkel-Shirley, B. It takes a garden. How work on diverse plant species has contributed to an understanding of flavonoid metabolism. Plant Physiol. 2001, 127, 1399–1404. [Google Scholar] [CrossRef] [PubMed]
  5. Meng, J.; Wang, B.; He, G.; Wang, Y.; Tang, X.; Wang, S.; Ma, Y.; Fu, C.; Chai, G.; Zhou, G. Metabolomics integrated with transcriptomics reveals redirection of the phenylpropanoids metabolic flux in Ginkgo biloba. J. Agric. Food Chem. 2019, 67, 3284–3291. [Google Scholar] [CrossRef]
  6. Holton, T.A.; Brugliera, F.; Lester, D.R.; Tanaka, Y.; Hyland, C.D.; Menting, J.G.T.; Lu, C.-Y.; Farcy, E.; Stevenson, T.W.; Cornish, E.C. Cloning and expression of cytochrome P450 genes controlling flower colour. Nature 1993, 366, 276–279. [Google Scholar] [CrossRef]
  7. Pang, Y.; Shen, G.; Wu, W.; Liu, X.; Lin, J.; Tan, F.; Sun, X.; Tang, K. Characterization and expression of chalcone synthase gene from Ginkgo biloba. Plant Sci. 2005, 168, 1525–1531. [Google Scholar] [CrossRef]
  8. Sharma, M.; Chai, C.; Morohashi, K.; Grotewold, E.; Snook, M.E.; Chopra, S. Expression of flavonoid 3′-hydroxylase is controlled by P1, the regulator of 3-deoxyflavonoid biosynthesis in maize. BMC Plant Biol. 2012, 12, 196–209. [Google Scholar] [CrossRef] [Green Version]
  9. Lepiniec, L.; Debeaujon, I.; Routaboul, J.-M.; Baudry, A.; Pourcel, L.; Nesi, N.; Caboche, M. Genetics and biochemistry of seed flavonoids: A review. Annu. Rev. Plant Biol. 2006, 57, 405–430. [Google Scholar] [CrossRef]
  10. Shen, G.; Pang, Y.; Wu, W.; Deng, Z.; Zhao, L.; Cao, Y.; Sun, X.; Tang, K. Cloning and characterization of a flavanone 3-hydroxylase gene from Ginkgo biloba. Biosci. Rep. 2006, 26, 19–29. [Google Scholar] [CrossRef] [PubMed]
  11. Cheng, H.; Li, L.; Cheng, S.; Cao, F.; Wang, Y.; Yuan, H. Molecular cloning and function assay of a chalcone isomerase gene (GbCHI) from Ginkgo biloba. Plant Cell Rep. 2011, 30, 49–62. [Google Scholar] [CrossRef]
  12. Xu, F.; Li, L.; Zhang, W.; Cheng, H.; Sun, N.; Cheng, S.; Wang, Y. Isolation, characterization, and function analysis of a flavonol synthase gene from Ginkgo biloba. Mol. Biol. Rep. 2012, 39, 2285–2296. [Google Scholar] [CrossRef]
  13. Singh, B.; Kaur, P.; Gopichand; Singh, R.D.; Ahuja, P.S. Biology and chemistry of Ginkgo biloba. Fitoterapia 2008, 79, 401–418. [Google Scholar] [CrossRef] [PubMed]
  14. Gong, W.; Chen, C.; Dobeš, C.; Fu, C.-X.; Koch, M.A. Phylogeography of a living fossil: Pleistocene glaciations forced Ginkgo biloba L. (Ginkgoaceae) into two refuge areas in China with limited subsequent postglacial expansion. Mol. Phylogenet. Evol. 2008, 48, 1094–1105. [Google Scholar] [CrossRef]
  15. Liu, H.; Cao, F.; Yin, T.; Chen, Y. A Highly dense genetic map for Ginkgo biloba constructed using sequence-based markers. Front. Plant Sci. 2017, 8, 1041. [Google Scholar] [CrossRef] [Green Version]
  16. Wu, Y.; Zhou, Q.; Huang, S.; Wang, G.; Xu, L.-A. SNP development and diversity analysis for Ginkgo biloba based on transcriptome sequencing. Trees 2019, 33, 587–597. [Google Scholar] [CrossRef]
  17. Van Beek, T.A. Chemical analysis of Ginkgo biloba leaves and extracts. J. Chromatogr. A 2002, 967, 21–55. [Google Scholar] [CrossRef]
  18. Wu, Y.; Guo, J.; Zhou, Q.; Xin, Y.; Wang, G.; Xu, L.-A. De novo transcriptome analysis revealed genes involved in flavonoid biosynthesis, transport and regulation in Ginkgo biloba. Ind. Crops Prod. 2018, 124, 226–235. [Google Scholar] [CrossRef]
  19. DeFeudis, F.V. A brief history of EGb 761 and its therapeutic uses. Pharmacopsychiatry 2003, 36, S2–S7. [Google Scholar] [CrossRef] [PubMed]
  20. Ahlemeyer, B.; Krieglstein, J. Pharmacological studies supporting the therapeutic use of Ginkgo biloba extract for Alzheimer’s disease. Pharmacopsychiatry 2003, 36, S8–S14. [Google Scholar] [CrossRef]
  21. Bastianetto, S.; Ramassamy, C.; Dore, S.; Christen, Y.; Poirier, J.; Quirion, R. The Ginkgo biloba extract (EGb 761) protects hippocampal neurons against cell death induced by beta-amyloid. Eur. J. Neurosci. 2000, 12, 1882–1890. [Google Scholar] [CrossRef]
  22. Chen, Q.; Yan, J.; Meng, X.; Xu, F.; Zhang, W.; Liao, Y.; Qu, J. Molecular cloning, characterization, and functional analysis of acetyl-CoA C-acetyltransferase and mevalonate kinase genes involved in terpene trilactone biosynthesis from Ginkgo biloba. Molecules 2017, 22, 74. [Google Scholar] [CrossRef] [Green Version]
  23. Wang, L.; Shi, H.; Wu, J.; Cao, F. Alternative partial root-zone irrigation enhances leaf flavonoid accumulation and water use efficiency of Ginkgo biloba. New For. 2015, 47, 377–391. [Google Scholar] [CrossRef]
  24. De Vetten, N.; ter Horst, J.; van Schaik, H.P.; de Boer, A.; Mol, J.; Koes, R. A cytochrome b5 is required for full activity of flavonoid 3′,5′-hydroxylase, a cytochrome P450 involved in the formation of blue flower colors. Proc. Natl. Acad. Sci. USA 1999, 96, 778–783. [Google Scholar] [CrossRef] [Green Version]
  25. Jeong, S.T.; Goto-Yamamoto, N.; Hashizume, K.; Esaka, M. Expression of the flavonoid 3′-hydroxylase and flavonoid 3′,5′-hydroxylase genes and flavonoid composition in grape (Vitis vinifera). Plant Sci. 2006, 170, 61–69. [Google Scholar] [CrossRef]
  26. Falginella, L.; Castellarin, S.D.; Testolin, R.; Gambetta, G.A.; Morgante, M.; Di Gaspero, G. Expansion and subfunctionalisation of flavonoid 3′,5′-hydroxylases in the grapevine lineage. BMC Genom. 2010, 11, 562. [Google Scholar] [CrossRef] [Green Version]
  27. Ishiguro, K.; Taniguchi, M.; Tanaka, Y. Functional analysis of Antirrhinum kelloggii flavonoid 3′-hydroxylase and flavonoid 3′,5′-hydroxylase genes; critical role in flower color and evolution in the genus Antirrhinum. J. Plant Res. 2012, 125, 451–456. [Google Scholar] [CrossRef] [PubMed]
  28. Sun, Y.; Huang, H.; Meng, L.; Hu, K.; Dai, S.-L. Isolation and functional analysis of a homolog of flavonoid 3′,5′-hydroxylase gene from Pericallis × hybrida. Physiol. Plant. 2013, 149, 151–159. [Google Scholar] [CrossRef]
  29. Yao, L.H.; Jiang, Y.M.; Shi, J.; TomS-BarberN, F.A.; Datta, N.; Singanusong, R.; Chen, S.S. Flavonoids in food and their health benefits. Plant Foods Hum. Nutr. 2004, 59, 113–122. [Google Scholar] [CrossRef]
  30. Werck-Reichhart, D.; Feyereisen, R. Cytochromes P450: A success story. Genome Biol. 2000, 1, reviews3003. [Google Scholar] [CrossRef] [Green Version]
  31. Wang, J.; Ming, F.; Han, Y.; Shen, D. Flavonoid-3′,5′-hydroxylase from phalaenopsis: A novel member of cytochrome P450s, its cDNA cloning, endogenous expression and molecular modeling. Biotechnol. Lett. 2006, 28, 327–334. [Google Scholar] [CrossRef]
  32. Liu, S.; Ju, J.; Xia, G. Identification of the flavonoid 3′-hydroxylase and flavonoid 3′,5′-hydroxylase genes from Antarctic moss and their regulation during abiotic stress. Gene 2014, 543, 145–152. [Google Scholar] [CrossRef]
  33. Bolwell, G.P.; Bozak, K.; Zimmerlin, A. Plant cytochrome p450. Phytochemistry 1994, 37, 1491–1506. [Google Scholar] [CrossRef]
  34. Nebert, D.W.; Gonzalez, F.J. P450 Genes: Structure, evolution, and regulation. Annu. Rev. Biochem. 1987, 56, 945–993. [Google Scholar] [CrossRef] [PubMed]
  35. Nielsen, K.M.; Podivinsky, E. cDNA cloning and endogenous expression of a flavonoid 3′5′-hydroxylase from petals of lisianthus (Eustoma grandiflorum). Plant Sci. 1997, 129, 167–174. [Google Scholar] [CrossRef]
  36. Halkier, B.A. Catalytic reactivities and structure/function relationships of cytochrome P450 enzymes. Phytochemistry 1996, 43, 1–21. [Google Scholar] [CrossRef]
  37. Kraus, P.F.; Kutchan, T.M. Molecular cloning and heterologous expression of a cDNA encoding berbamunine synthase, a C—O phenol-coupling cytochrome P450 from the higher plant Berberis stolonifera. Proc. Natl. Acad. Sci. USA 1995, 92, 2071–2075. [Google Scholar] [CrossRef] [Green Version]
  38. Monier, S.; van Luc, P.; Kreibich, G.; Sabatini, D.D.; Adesnik, M. Signals for the incorporation and orientation of cytochrome P450 in the endoplasmic reticulum membrane. J. Cell. Biol. 1988, 107, 457–470. [Google Scholar] [CrossRef] [PubMed]
  39. Mattick, J.S.; Gagen, M.J. The evolution of controlled multitasked gene networks: The role of introns and other noncoding RNAs in the development of complex organisms. Mol. Biol. Evol. 2001, 18, 1611–1630. [Google Scholar] [CrossRef] [PubMed] [Green Version]
  40. Wiegand, H.L.; Lu, S.; Cullen, B.R. Exon junction complexes mediate the enhancing effect of splicing on mRNA expression. Proc. Natl. Acad. Sci. USA 2003, 100, 11327–11332. [Google Scholar] [CrossRef] [Green Version]
  41. Le Hir, H.; Nott, A.; Moore, M.J. How introns influence and enhance eukaryotic gene expression. Trends Biochem. Sci. 2003, 28, 215–220. [Google Scholar] [CrossRef]
  42. Zhao, X.; Li, H.; Bao, T. Analysis on the interaction between post-spliced introns and corresponding protein coding sequences in ribosomal protein genes. J. Theor. Biol. 2013, 328, 33–42. [Google Scholar] [CrossRef] [PubMed]
  43. Bo, S.; Li, H.; Zhang, Q.; Lu, Z.; Bao, T.; Zhao, X. Potential relations between post-spliced introns and mature mRNAs in the Caenorhabditis elegans genome. J. Theor. Biol. 2019, 467, 7–14. [Google Scholar] [CrossRef]
  44. Shimada, Y.; Nakano-Shimada, R.; Ohbayashi, M.; Okinaka, Y.; Kiyokawa, S.; Kikuchi, Y. Expression of chimeric P450 genes encoding flavonoid-3′,5′-hydroxylase in transgenic tobacco and petunia plants1. FEBS Lett. 1999, 461, 241–245. [Google Scholar] [CrossRef] [Green Version]
  45. Chamberlain, C.J. Gymnosperms, Structure and Evolution; University of Chicago Press: Chicago, IL, USA, 1935. [Google Scholar]
  46. Guan, R.; Zhao, Y.; Zhang, H.; Fan, G.; Liu, X.; Zhou, W.; Shi, C.; Wang, J.; Liu, W.; Liang, X.; et al. Draft genome of the living fossil Ginkgo biloba. GigaScience 2016, 5, 49. [Google Scholar] [CrossRef] [Green Version]
  47. Zhou, Q.; Mu, K.; Xu, M.; Ma, X.; Ni, Z.; Wang, J.; Xu, L.-A. Variation in the concentrations of major secondary metabolites in ginkgo leaves from different geographical populations. Forests 2017, 8, 266. [Google Scholar] [CrossRef] [Green Version]
  48. Zhou, W.; Chai, H.; Lin, P.H.; Lumsden, A.B.; Yao, Q.; Chen, C. Clinical use and molecular mechanisms of action of extract of Ginkgo biloba leaves in cardiovascular diseases. Cardiovasc. Drug Rev. 2010, 22, 309–319. [Google Scholar] [CrossRef] [Green Version]
  49. Cao, J.; Wang, H.; Zhang, W.; Cao, F.; Ma, G.; Su, E. Tailor-made deep eutectic solvents for simultaneous extraction of five aromatic acids from Ginkgo biloba leaves. Molecules 2018, 23, 3214. [Google Scholar] [CrossRef] [Green Version]
  50. Hasler, A.; Sticher, O.; Meier, B. Identification and determination of the flavonoids from Ginkgo biloba by high-performance liquid chromatography. J. Chromatog. A 1992, 605, 41–48. [Google Scholar] [CrossRef]
  51. Middleton, E., Jr.; Kandaswami, C.; Theoharides, T.C. The effects of plant flavonoids on mammalian cells: Implications for inflammation, heart disease, and cancer. Pharmacol. Rev. 2000, 52, 673–751. [Google Scholar]
  52. Wang, Y.-S.; Xu, Y.-J.; Gao, L.-P.; Yu, O.; Wang, X.-Z.; He, X.-J.; Jiang, X.-L.; Liu, Y.-J.; Xia, T. Functional analysis of Flavonoid 3′,5′-Hydroxylase from Tea plant (Camellia sinensis): Critical role in the accumulation of catechins. BMC Plant Biol. 2014, 14, 347. [Google Scholar] [CrossRef] [Green Version]
  53. Boase, M.R.; Lewis, D.H.; Davies, K.M.; Marshall, G.B.; Patel, D.; Schwinn, K.E.; Deroles, S.C. Isolation and antisense suppression of flavonoid 3′, 5′-hydroxylase modifies flower pigments and colour in cyclamen. BMC Plant Biol. 2010, 10, 107. [Google Scholar] [CrossRef] [Green Version]
  54. Holton, T.A.; Cornish, E.C. Genetics and biochemistry of anthocyanin biosynthesis. Plant Cell 1995, 7, 1071–1083. [Google Scholar] [CrossRef]
  55. Kumar, S.; Stecher, G.; Tamura, K. MEGA7: Molecular evolutionary genetics analysis version 7.0 for bigger datasets. Mol. Biol. Evol. 2016, 33, 1870–1874. [Google Scholar] [CrossRef] [Green Version]
  56. Zuckerkandl, E.; Pauling, L. Evolutionary divergence and convergence in proteins. In Evolving Genes and Proteins; Bryson, V., Vogel, H.J., Eds.; Academic Press: New York, NY, USA, 1965; pp. 97–166. [Google Scholar]
  57. Schmittgen, T.D.; Livak, K.J. Analyzing real-time PCR data by the comparative CT method. Nat. Protoc. 2008, 3, 1101–1108. [Google Scholar] [CrossRef]
  58. Xu, M.; Chen, C.; Cai, H.; Wu, L. Overexpression of PeHKT1;1 improves salt tolerance in populus. Genes 2018, 9, 475. [Google Scholar] [CrossRef] [PubMed] [Green Version]
  59. Chen, T.; Zhao, Q.; Wang, L.; Xu, Y.; Wei, W. Comparative metabolomic analysis of the green microalga Chlorella sorokiniana cultivated in the single culture and a consortium with bacteria for wastewater remediation. Appl. Biochem. Biotechnol. 2017, 183, 1062–1075. [Google Scholar] [CrossRef] [PubMed]
  60. Ning, M.; Wei, P.; Shen, H.; Wan, X.; Jin, M.; Li, X.; Shi, H.; Qiao, Y.; Jiang, G.; Gu, W.; et al. Proteomic and metabolomic responses in hepatopancreas of whiteleg shrimp Litopenaeus vannamei infected by microsporidian Enterocytozoon hepatopenaei. Fish Shellfish Immunol. 2019, 87, 534–545. [Google Scholar] [CrossRef] [PubMed]
  61. Xiong, Q.; Cao, C.; Shen, T.; Zhong, L.; He, H.; Chen, X. Comprehensive metabolomic and proteomic analysis in biochemical metabolic pathways of rice spikes under drought and submergence stress. Biochim. Biophys. Acta Proteins Proteom. 2019, 1867, 237–247. [Google Scholar] [CrossRef]
Figure 1. Sequence analysis of the GbF3′5′H1 gene. (a) Structural characteristics of the GbF3′5′H1 gene. The gray boxes represent the exons, and the thick black line represents the intron. (b) Alignment of the deduced amino acid sequence of GbF3′5′H1 and other known F3′5′Hs. The highly conserved regions of the F3′5′H proteins are shown by the three red boxes, which represent the following conserved domains: cytochrome P450 monooxygenase (CYP), the I helical region (I), and the heme-binding region (HBR). GbF3′5′H1, Ginkgo biloba; TcF3′5′H, Taxus chinensis (identity: 74.6%, GenBank: ATG29931.1); RnF3′5′H, Ribes nigrum (identity: 66.27%, GenBank: AGI16385.1); GaF3′5′H, Gossypium arboreum (identity: 67.60%, GenBank: KHF97502.1); and PtF3′5′H, Populus trichocarpa (identity: 64.97%, GenBank: XP_002314004.2). The dark blue color represents 100% identity. The red color represents 75% ≤ identity < 100%. The light blue color represents 50% ≤ identity < 75%. The yellow color represents 33% ≤ identity < 50%.
Molecules 25 04836 g001
Figure 2. Phylogenetic tree of F3′5′H proteins from different species. The maximum likelihood method was used to construct the tree and was supported by bootstrapping based on 1000 replications. The following are the protein sequences used in these trees: Hevea brasiliensis (GenBank: XP_021664632.1), Jatropha curcas (GenBank: XP_012065863.1), Punica granatum (GenBank: AUY62559.1), Durio zibethinus (GenBank: XP_022756700.1), Populus trichocarpa (GenBank: XP_002314004.2), Nelumbo nucifera (GenBank: ARQ79447.1), Vitis vinifera (GenBank: BAE47007.1), Cyclamen persicum (GenBank: ACX37698.1), and Taxus chinensis (GenBank: ATG29931.1).
Molecules 25 04836 g002
Figure 3. Gene expression patterns of GbF3′5′H1 in ginkgo as determined by quantitative real-time PCR (qRT-PCR). (a) Expression patterns of GbF3′5′H1 in various tissues: R = root, S = stem, L = leaf, K = kernel, B = bud, and P = petiole. The gene expression level in the stem was set to 1. GbF3′5′H1 gene expression in ginkgo leaves at different times (from April to October). GbF3′5′H1 gene expression level in June was set to 1. (b) Temporal expression pattern during April, May, June, July, August, September, and October. All the qRT-PCR data are shown as the mean ± standard deviation (error bar) of three biological replicates. Means with different letters are significantly different at p < 0.05, as determined by one-way ANOVA with Duncan’s multiple range tests.
Molecules 25 04836 g003
Figure 4. The expression levels of GbF3′5′H1 in the eight transgenic poplar lines and nontransgenic (CK) Populus determined using semiquantitative qPCR (sqPCR) (a) and qRT-PCR (b). (c) Growth phenotypes of the different CK and transgenic seedlings at 45 days. Bar scale = 1.0 cm.
Molecules 25 04836 g004
Table 1. The contents of flavonoid-related metabolites in Populus.
4′,5-dihydroxy-7-glucosyloxyflavanoneEpicatechinEpigallocatechinGallocatechin
Non-transgenic Populus0.26 ± 0.120.02 ± 0.010.03 ± 0.000.07 ± 0.02
Transgenic Populus0.77 ± 0.12 **0.05 ± 0.01 *0.04 ± 0.010.16 ± 0.01 **
Note: One-way analysis of variance with a post-hoc Duncan’s test with probabilities of p < 0.05 (*) and p < 0.01 (**).
Sample Availability: Not available.
Publisher’s Note: MDPI stays neutral with regard to jurisdictional claims in published maps and institutional affiliations.

