
Fast and Purification-Free Characterization of Bio-Nanoparticles in Biological Media by Electrical Asymmetrical Flow Field-Flow Fractionation Hyphenated with Multi-Angle Light Scattering and Nanoparticle Tracking Analysis Detection

 ,
,
Abstract
1. Introduction
2. Results and Discussion
2.1. Offline Hyphenation of EAF4-MALS and NTA
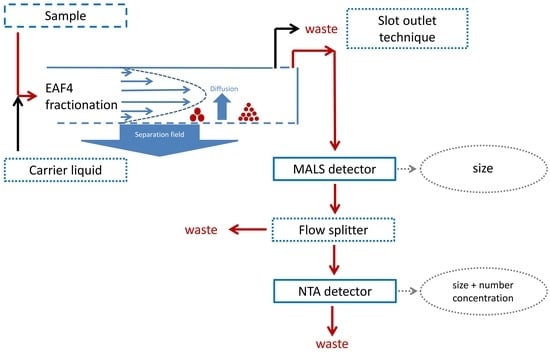
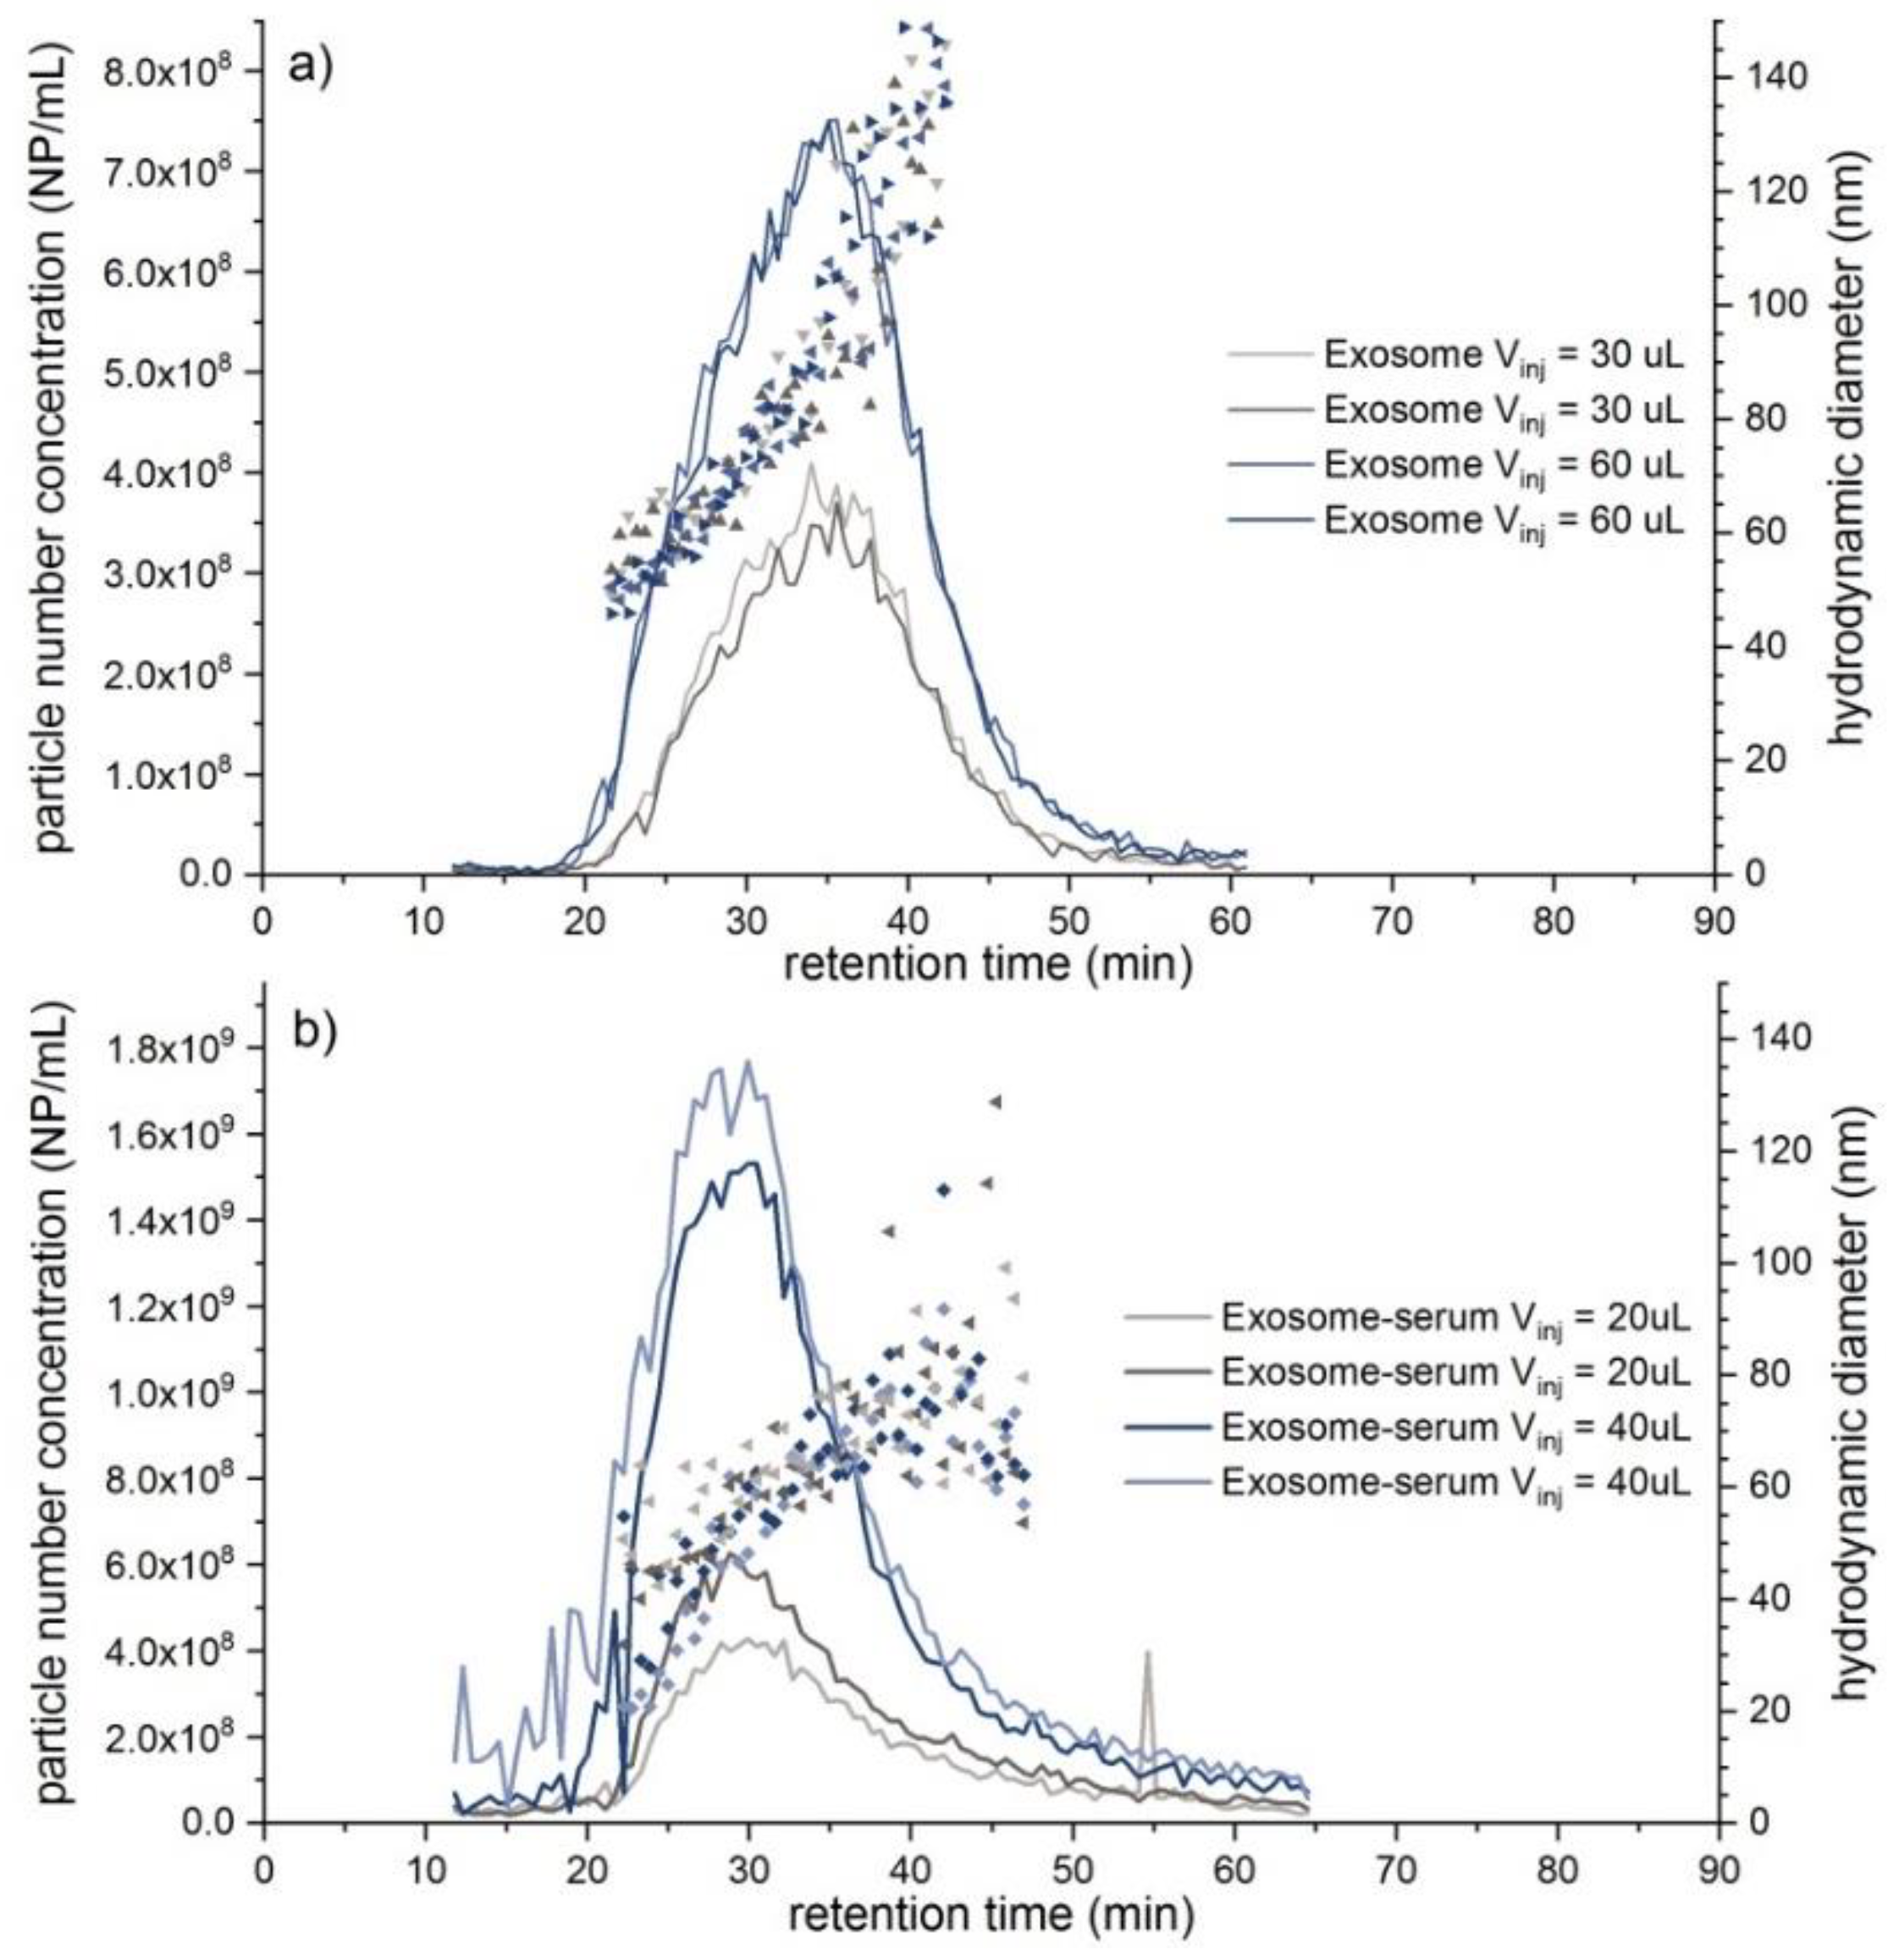
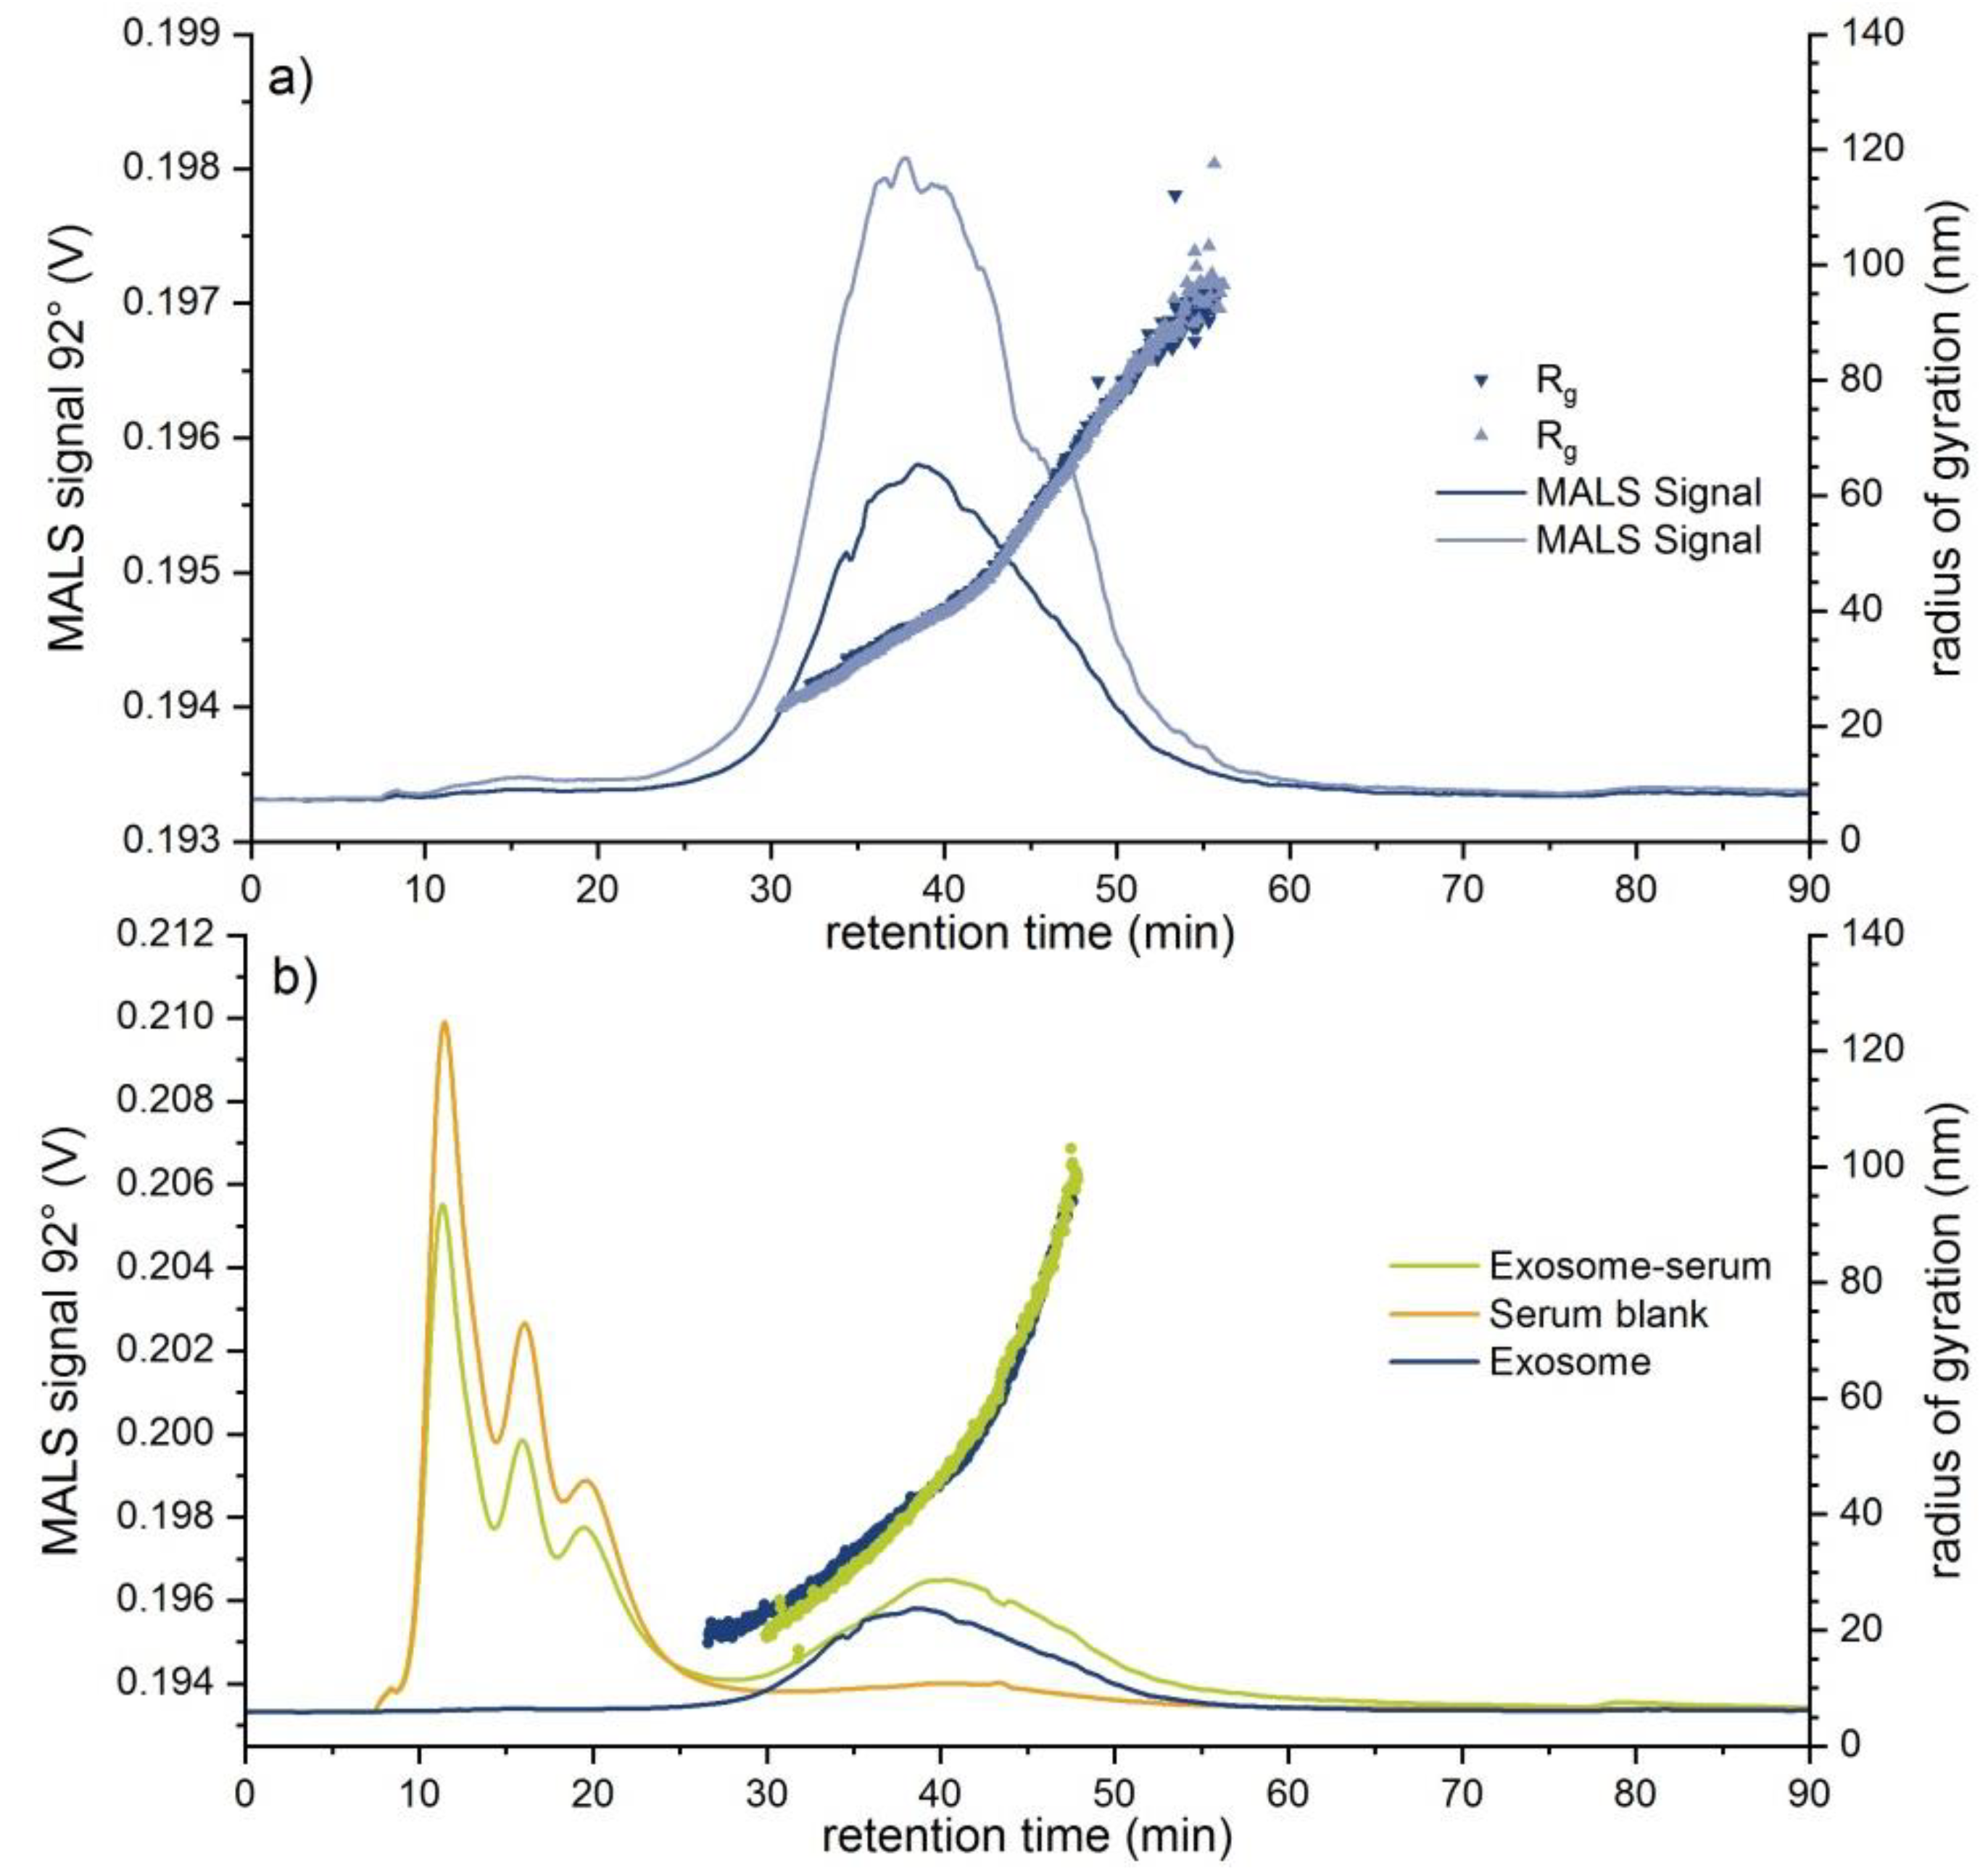
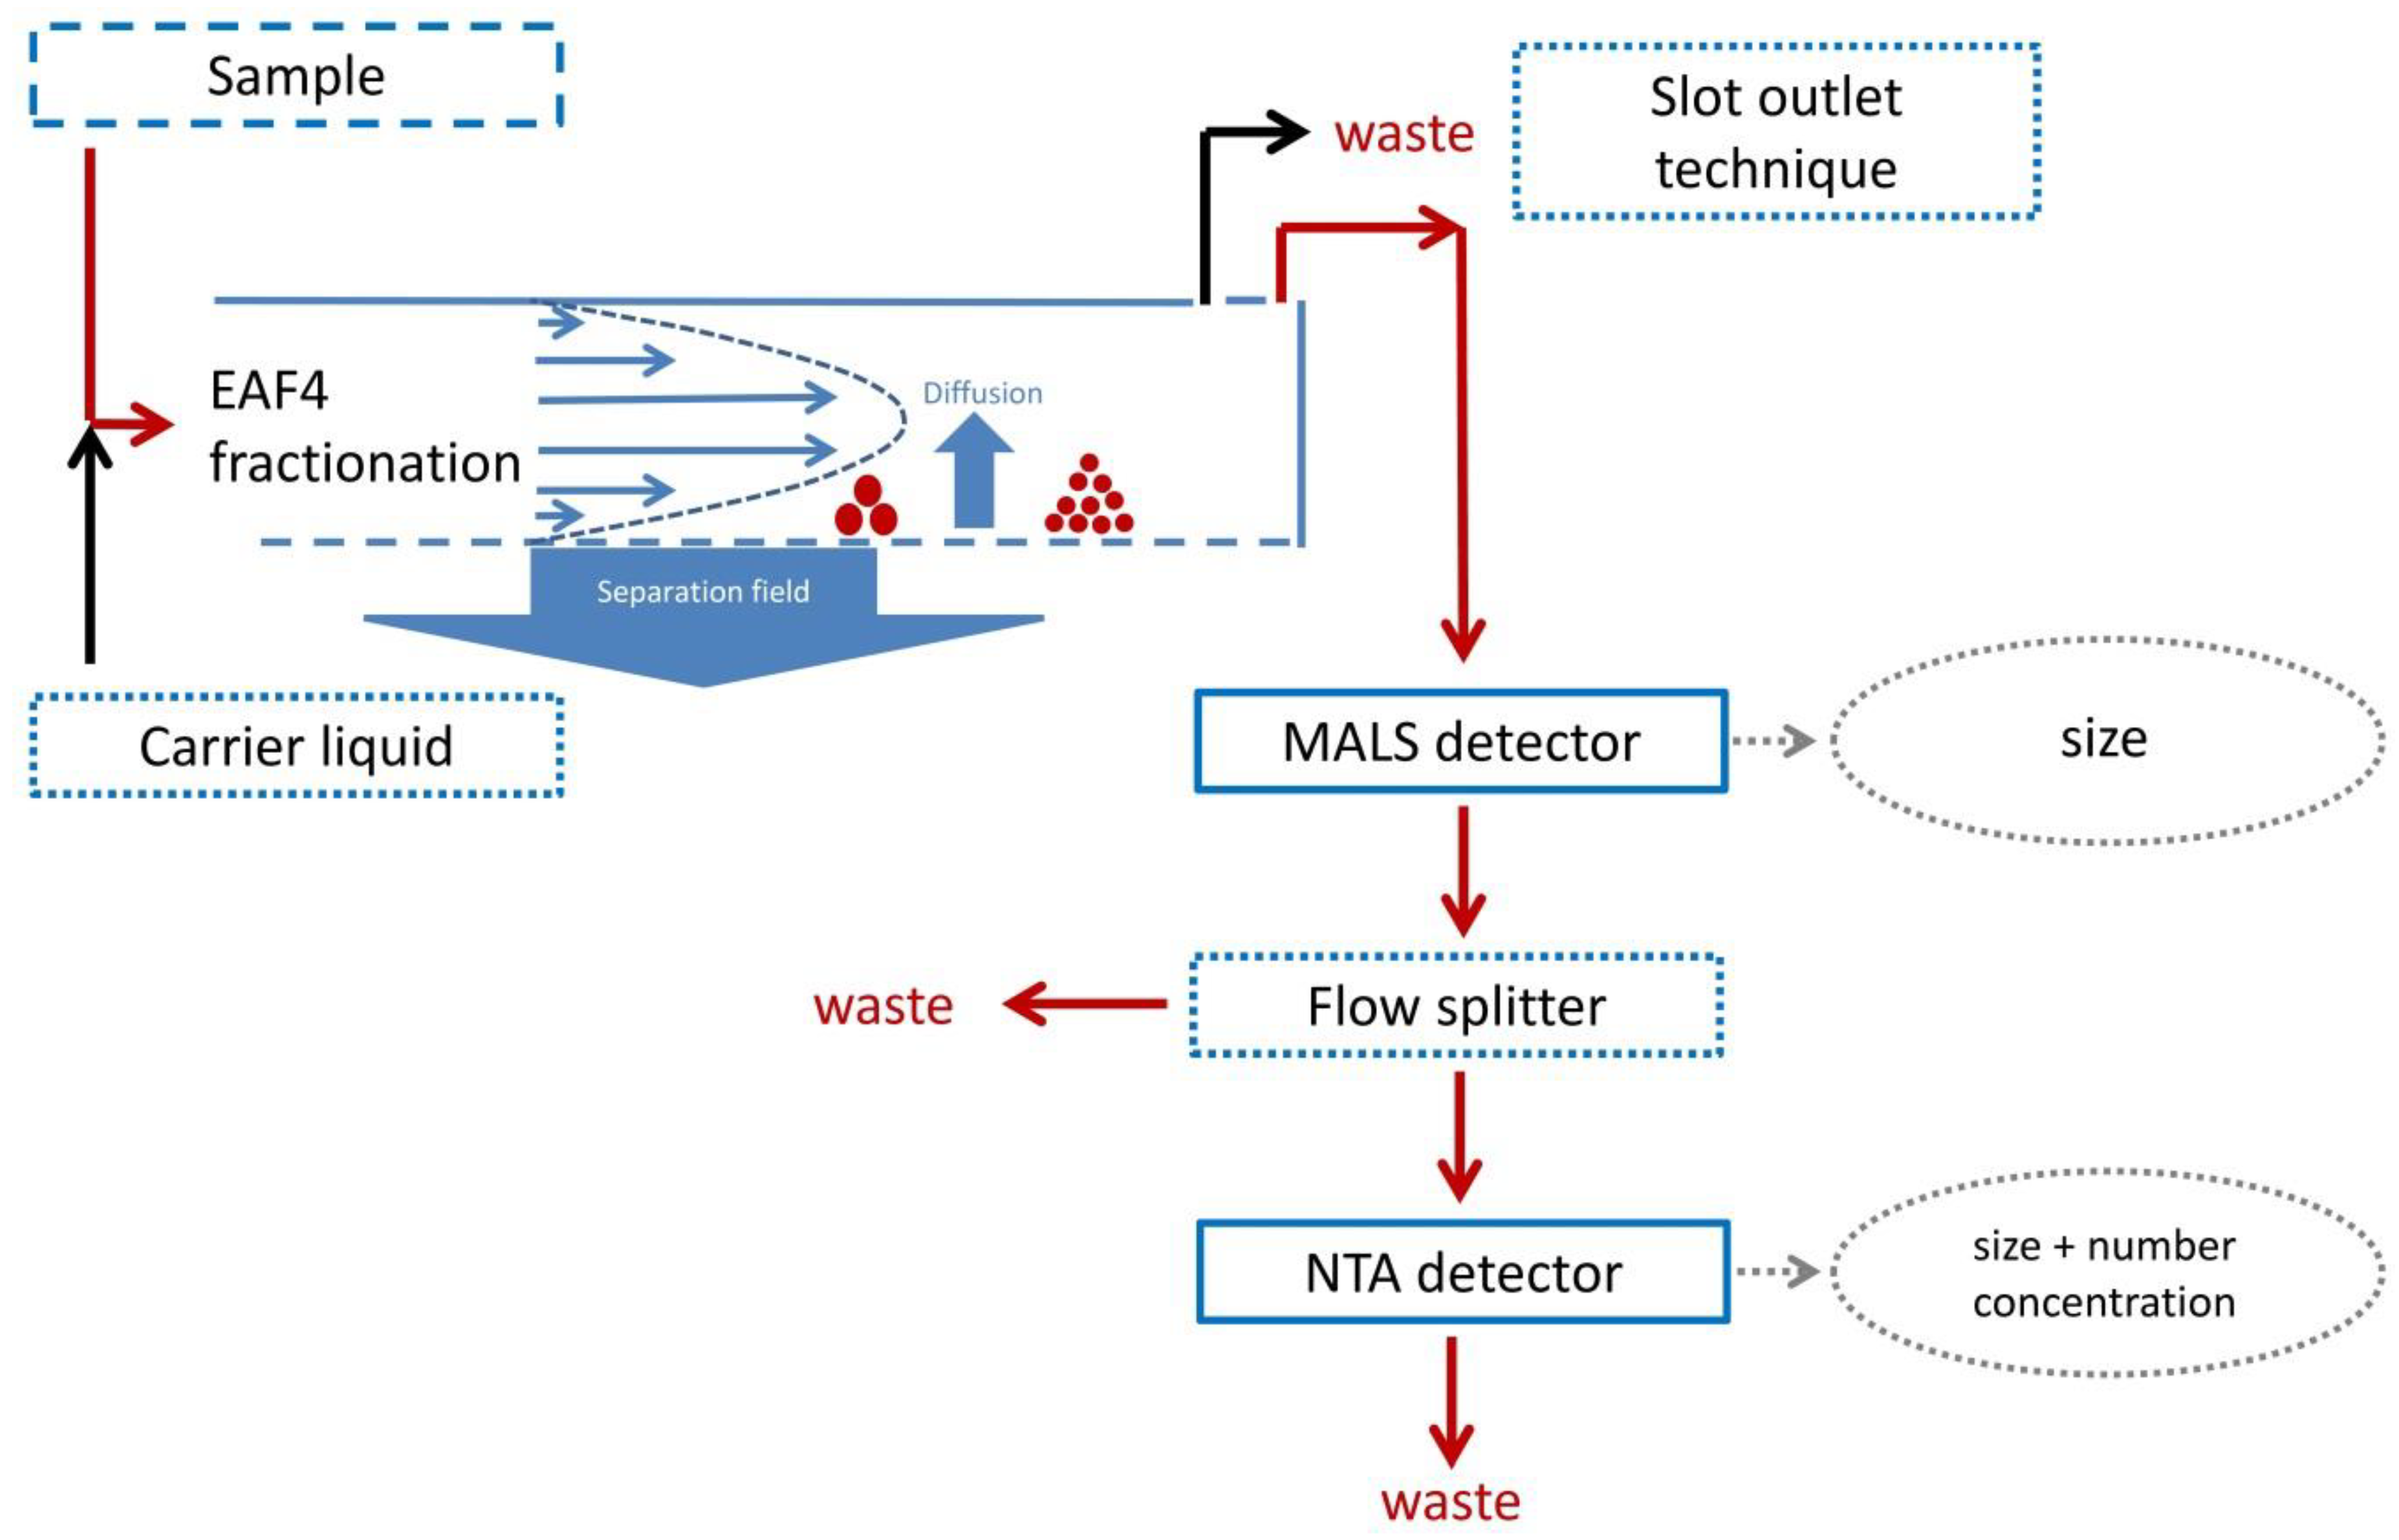
2.2. Online Hyphenation of EAF4-MALS and NTA
3. Materials and Methods
3.1. Chemicals and Samples
3.2. Sample Preparation
3.3. Instrumentation
3.4. Fractionation Method
4. Conclusions
Supplementary Materials
Author Contributions
Funding
Acknowledgments
Conflicts of Interest
References
- Fischer, K.; Schmidt, M. Pitfalls and novel applications of particle sizing by dynamic light scattering. Biomaterials 2016, 98, 79–91. [Google Scholar] [CrossRef] [PubMed]
- Bhagat, S.; Parikh, Y.; Singh, S.; Sengupta, S. A novel nanoliposomal formulation of the FDA approved drug Halofantrine causes cell death of Leishmania donovani promastigotes in vitro. Colloids Surf. A Physicochem. Eng. Asp. 2019, 582, 123852. [Google Scholar] [CrossRef]
- Singla, P.; Singh, O.; Sharma, S.; Betlem, K.; Aswal, V.K.; Peeters, M.; Mahajan, R.K. Temperature-dependent solubilization of the hydrophobic antiepileptic drug lamotrigine in different pluronic micelles—A spectroscopic, heat transfer method, small-angle neutron scattering, dynamic light scattering, and in vitro release study. ACS Omega 2019, 4, 11251–11262. [Google Scholar] [CrossRef] [PubMed]
- Caputo, F.; Clogston, J.; Calzolai, L.; Rösslein, M.; Prina-Mello, A. Measuring particle size distribution of nanoparticle enabled medicinal products, the joint view of EUNCL and NCI-NCL. A step by step approach combining orthogonal measurements with increasing complexity. J. Control. Release 2019, 299, 31–43. [Google Scholar] [CrossRef] [PubMed]
- Javeed, N.; Mukhopadhyay, D. Exosomes and their role in the micro-/macro-environment: A comprehensive review. J. Biomed. Res. 2017, 31, 386–394. [Google Scholar] [CrossRef]
- Bunggulawa, E.J.; Wang, W.; Yin, T.; Wang, N.; Durkan, C.; Wang, Y.; Wang, G. Recent advancements in the use of exosomes as drug delivery systems. J. Nanobiotechnol. 2018, 16, 81. [Google Scholar] [CrossRef]
- Contreras-Naranjo, J.C.; Wu, H.-J.; Ugaz, V.M. Microfluidics for exosome isolation and analysis: Enabling liquid biopsy for personalized medicine. Lab Chip 2017, 17, 3558–3577. [Google Scholar] [CrossRef]
- Liu, C.; Yang, Y.; Wu, Y. Recent advances in exosomal protein detection via liquid biopsy biosensors for cancer screening, diagnosis, and prognosis. AAPS J. 2018, 20, 41. [Google Scholar] [CrossRef]
- Woo, H.-K.; Park, J.; Ku, J.Y.; Lee, C.H.; Sunkara, V.; Ha, H.K.; Cho, Y.-K. Urine-based liquid biopsy: Non-invasive and sensitive AR-V7 detection in urinary EVs from patients with prostate cancer. Lab Chip 2019, 19, 87–97. [Google Scholar] [CrossRef]
- Mirzakhani, M.; Mohammadnia-Afrouzi, M.; Shahbazi, M.; Mirhosseini, S.A.; Hosseini, H.M.; Amani, J. The exosome as a novel predictive/diagnostic biomarker of rejection in the field of transplantation. Clin. Immunol. 2019, 203, 134–141. [Google Scholar] [CrossRef]
- Record, M.; Carayon, K.; Poirot, M.; Silvente-Poirot, S. Exosomes as new vesicular lipid transporters involved in cell–cell communication and various pathophysiologies. Biochim. Biophys. Acta (BBA) Mol. Cell Biol. Lipids 2014, 1841, 108–120. [Google Scholar] [CrossRef] [PubMed]
- Hessvik, N.P.; Llorente, A. Current knowledge on exosome biogenesis and release. Cell. Mol. Life Sci. 2018, 75, 193–208. [Google Scholar] [CrossRef] [PubMed]
- Bolea, E.; Jimenez-Lamana, J.; Laborda, F.; Abad-Alvaro, I.; Blade, C.; Arola, L.; Castillo, J.R. Detection and characterization of silver nanoparticles and dissolved species of silver in culture medium and cells by AsFlFFF-UV-Vis-ICPMS: Application to nanotoxicity tests. Analyst 2013, 139, 914–922. [Google Scholar] [CrossRef] [PubMed]
- Wagner, S.; Legros, S.; Loeschner, K.; Liu, J.; Navratilova, J.; Grombe, R.; Linsinger, T.P.J.; Larsen, E.H.; von der Kammer, F.; Hofmann, T. First steps towards a generic sample preparation scheme for inorganic engineered nanoparticles in a complex matrix for detection, characterization, and quantification by asymmetric flow-field flow fractionation coupled to multi-angle light scattering and ICP-MS. J. Anal. At. Spectrom. 2015, 30, 1286–1296. [Google Scholar] [CrossRef]
- Vidmar, J.; Buerki-Thurnherr, T.; Loeschner, K. Comparison of the suitability of alkaline or enzymatic sample pre-treatment for characterization of silver nanoparticles in human tissue by single particle ICP-MS. J. Anal. At. Spectrom. 2018, 33, 752–761. [Google Scholar] [CrossRef]
- Giddings, J.C. Field-flow fractionation: Analysis of macromolecular, colloidal, and particulate materials. Science (N. Y.) 1993, 260, 1456–1465. [Google Scholar] [CrossRef] [PubMed]
- Schimpf, M.E.; Caldwell, K.; Giddings, J.C. Field-Flow Fractionation Handbook; Wiley: New York, NY, USA, 2000. [Google Scholar]
- Contado, C. Field flow fractionation techniques to explore the “nano-world”. Anal. Bioanal. Chem. 2017, 409, 2501–2518. [Google Scholar] [CrossRef]
- Eskelin, K.; Lampi, M.; Meier, F.; Moldenhauer, E.; Bamford, D.H.; Oksanen, H.M. Asymmetric flow field flow fractionation methods for virus purification. J. Chromatogr. A 2016, 1469, 108–119. [Google Scholar] [CrossRef]
- Eskelin, K.; Lampi, M.; Meier, F.; Moldenhauer, E.; Bamford, D.H.; Oksanen, H.M. Halophilic viruses with varying biochemical and biophysical properties are amenable to purification with asymmetrical flow field-flow fractionation. Extremophiles 2017, 21, 1119–1132. [Google Scholar] [CrossRef]
- Carr, B.; Hole, P.; Malloy, A.; Nelson, P.; Smith, J. Applications of nanoparticle tracking analysis in nanoparticle research—A mini-review. Eur. J. Parenter. Sci. Pharm. Sci. 2009, 14, 45–50. [Google Scholar]
- Filipe, V.; Hawe, A.; Jiskoot, W. Critical evaluation of nanoparticle tracking analysis (NTA) by NanoSight for the measurement of nanoparticles and protein aggregates. Pharm. Res. 2010, 27, 796–810. [Google Scholar] [CrossRef] [PubMed]
- Dragovic, R.A.; Gardiner, C.; Brooks, A.S.; Tannetta, D.S.; Ferguson, D.J.P.; Hole, P.; Carr, B.; Redman, C.W.G.; Harris, A.L.; Dobson, P.J.; et al. Sizing and phenotyping of cellular vesicles using nanoparticle tracking analysis. Nanomed. Nanotechnol. Biol. Med. 2011, 7, 780–788. [Google Scholar] [CrossRef] [PubMed]
- Gardiner, C.; Ferreira, Y.J.; Dragovic, R.A.; Redman, C.W.G.; Sargent, I.L. Extracellular vesicle sizing and enumeration by nanoparticle tracking analysis. J. Extracell. Vesicles 2013, 2, 19671. [Google Scholar] [CrossRef] [PubMed]
- Ashby, J.; Flack, K.; Jimenez, L.A.; Duan, Y.; Khatib, A.-K.; Somlo, G.; Wang, S.E.; Cui, X.; Zhong, W. Distribution Profiling of Circulating MicroRNAs in Serum. Anal. Chem. 2014, 86, 9343–9349. [Google Scholar] [CrossRef]
- Shearn, A.I.U.; Aday, S.; Ben-Aicha, S.; Carnell-Morris, P.; Siupa, A.; Angelini, G.D.; Clayton, A.; Boulanger, C.; Punjabi, P.; Emanueli, C.; et al. Analysis of neat biofluids obtained during cardiac surgery using nanoparticle tracking analysis: Methodological considerations. Front. Cell Dev. Biol. 2020, 8, 367. [Google Scholar] [CrossRef]
- Kim, Y.B.; Yang, J.S.; Lee, G.B.; Moon, M.H. Evaluation of exosome separation from human serum by frit-inlet asymmetrical flow field-flow fractionation and multiangle light scattering. Anal. Chim. Acta 2020, 1124, 137–145. [Google Scholar] [CrossRef]
- Serrano-Pertierra, E.; Oliveira-Rodríguez, M.; Matos, M.; Gutiérrez, G.; Moyano, A.; Salvador, M.; Rivas, M.; Blanco-López, M.C. Extracellular vesicles: Current analytical techniques for detection and quantification. Biomolecules 2020, 10, 824. [Google Scholar] [CrossRef]
- Petersen, K.; Manangon, E.; Hood, J.; Wickline, S.; Fernandez, D.; Johnson, W.; Gale, B. A review of exosome separation techniques and characterization of B16-F10 mouse melanoma exosomes with AF4-UV-MALS-DLS-TEM. Anal. Bioanal. Chem. 2014, 406, 7855–7866. [Google Scholar] [CrossRef]
- Reshetov, V.; Zorin, V.; Siupa, A.; D’Hallewin, M.-A.; Guillemin, F.; Bezdetnaya, L. Interaction of liposomal formulations of meta-tetra (hydroxyphenyl) chlorin (temoporfin) with serum proteins: Protein binding and liposome destruction. Photochem. Photobiol. 2012, 88, 1256–1264. [Google Scholar] [CrossRef]
- Ribeiro, L.N.d.M.; Couto, V.M.; Fraceto, L.F.; de Paula, E. Use of nanoparticle concentration as a tool to understand the structural properties of colloids. Sci. Rep. 2018, 8, 982. [Google Scholar] [CrossRef]
- Monteiro, L.O.F.; Malachias, Â.; Pound-Lana, G.; Magalhães-Paniago, R.; Mosqueira, V.C.F.; Oliveira, M.C.; de Barros, A.L.B.; Leite, E.A. Paclitaxel-loaded pH-sensitive liposome: New insights on structural and physicochemical characterization. Langmuir 2018, 34, 5728–5737. [Google Scholar] [CrossRef] [PubMed]
- Parot, J.; Caputo, F.; Mehn, D.; Hackley, V.A.; Calzolai, L. Physical characterization of liposomal drug formulations using multi-detector asymmetrical-flow field flow fractionation. J. Control. Release 2020, 320, 495–510. [Google Scholar] [CrossRef] [PubMed]
- Bartczak, D.; Vincent, P.; Goenaga-Infante, H. Determination of size- and number-based concentration of silica nanoparticles in a complex biological matrix by online techniques. Anal. Chem. 2015, 87, 5482–5485. [Google Scholar] [CrossRef] [PubMed]
- Adkins, G.B.; Sun, E.; Coreas, R.; Zhong, W. Asymmetrical flow field flow fractionation coupled to nanoparticle tracking analysis for rapid online characterization of nanomaterials. Anal. Chem. 2020, 92, 7071–7078. [Google Scholar] [CrossRef]
- Prestel, H.; Niessner, R.; Panne, U. Increasing the sensitivity of asymmetrical flow field-flow fractionation: Slot outlet technique. Anal. Chem. 2006, 78, 6664–6669. [Google Scholar] [CrossRef]
- Leeman, M.; Islam, M.T.; Haseltine, W.G. Asymmetrical flow field-flow fractionation coupled with multi-angle light scattering and refractive index detections for characterization of ultra-high molar mass poly(acrylamide) flocculants. J. Chromatogr. A 2007, 1172, 194–203. [Google Scholar] [CrossRef]
- Contado, C.; Mehn, D.; Gilliland, D.; Calzolai, L. Characterization methods for studying protein adsorption on nano-polystyrene beads. J. Chromatogr. A 2019, 1606, 460383. [Google Scholar] [CrossRef]
- ISO International Organization for Standardization. ISO 19430:2016—Particle Size Analysis—Particle Tracking Analysis (PTA) Method; ISO: Geneva, Switzerland, 2016. [Google Scholar]
- Gioria, S.; Caputo, F.; Urbán, P.; Maguire, C.M.; Bremer-Hoffmann, S.; Prina-Mello, A.; Calzolai, L.; Mehn, D. Are existing standard methods suitable for the evaluation of nanomedicines: Some case studies. Nanomedicine 2018, 13, 539–554. [Google Scholar] [CrossRef]
- Hu, Y.; Crist, R.M.; Clogston, J.D. The utility of asymmetric flow field-flow fractionation for preclinical characterization of nanomedicines. Anal. Bioanal. Chem. 2019. [Google Scholar] [CrossRef]
- Kammer, F.v.d.; Baborowski, M.; Friese, K. Field-flow fractionation coupled to multi-angle laser light scattering detectors: Applicability and analytical benefits for the analysis of environmental colloids. Anal. Chim. Acta 2005, 552, 166–174. [Google Scholar] [CrossRef]
- Brewer, A.K.; Striegel, A.M. Characterizing the size, shape, and compactness of a polydisperse prolate ellipsoidal particle via quadruple-detector hydrodynamic chromatography. Analyst 2011, 136, 515–519. [Google Scholar] [CrossRef] [PubMed]
- Kato, H.; Nakamura, A.; Takahashi, K.; Kinugasa, S. Accurate size and size-distribution determination of polystyrene latex nanoparticles in aqueous medium using dynamic light scattering and asymmetrical flow field flow fractionation with multi-angle light scattering. Nanomaterials 2012, 2, 15–30. [Google Scholar] [CrossRef] [PubMed]
- von Smoluchowski, M. Zur kinetischen Theorie der Brownschen Molekularbewegung und der Suspensionen. Ann. Phys. 1906, 326, 756–780. [Google Scholar] [CrossRef]
- Sze, A.; Erickson, D.; Ren, L.; Li, D. Zeta-potential measurement using the Smoluchowski equation and the slope of the current-time relationship in electroosmotic flow. J. Colloid Interface Sci. 2003, 261, 402–410. [Google Scholar] [CrossRef]
- Jüttner, F. Handbuch der Elektrizität und des Magnetismus. Z. Elektrochem. Angew. Phys. Chem. 1921, 27, 582–583. [Google Scholar] [CrossRef]
- Hunter, R.J. Zeta Potential in Colloid Science. Principles and Applications; Academic Press Limited: London, UK, 1981. [Google Scholar]
- O’Brien, R.W.; Ward, D.N. The electrophoresis of a spheroid with a thin double layer. J. Colloid Interface Sci. 1988, 121, 402–413. [Google Scholar] [CrossRef]
- Kerker, M. The Scattering of Light and Other Electromagnetic Radiation; Academic Press, Inc.: New York, NY, USA, 1969; p. 160. [Google Scholar]
- Zimm, B.H. The scattering of light and the radial distribution function of high polymer solutions. J. Chem. Phys. 1948, 16, 1093–1099. [Google Scholar] [CrossRef]
- Andersson, M.; Wittgren, B.; Wahlund, K.-G. Accuracy in multiangle light scattering measurements for molar mass and radius estimations. model calculations and experiments. Anal. Chem. 2003, 75, 4279–4291. [Google Scholar] [CrossRef]
Sample Availability: Samples of the compounds are not available from the authors. |


| Sample | Injected Sample Volume V(inj) | Hydrodynamic Diameter Dh | Measured Particle Number Concentration | ||
|---|---|---|---|---|---|
| (µL) | Mode (nm) | ±Relative (%) | (NP mL−1) | ±Relative (%) | |
| PS100 | 25 | 97.5 | 0.6 | 3.75 × 10⁸ | 1.62 |
| 10 | 99.3 | 0.3 | 1.53 × 10⁸ | 4.20 | |
| PS100-DMEM | 25 | 117.7 | 0.8 | 3.28 × 10⁸ | 1.73 |
| 10 | 118.1 | 0.6 | 1.56 × 10⁸ | 3.93 | |
| Sample | MALS Results | NTA Results | EAF4 Evaluation | ||||
|---|---|---|---|---|---|---|---|
| Rg at Peak Maximum (nm) | Rg Range (nm) | Dh at Peak Maximum (nm) | Dh Range (nm) | Particle Concentration at Peak Maximum (NP mL−1) | Zeta Potential (mV) | Recovery (%) | |
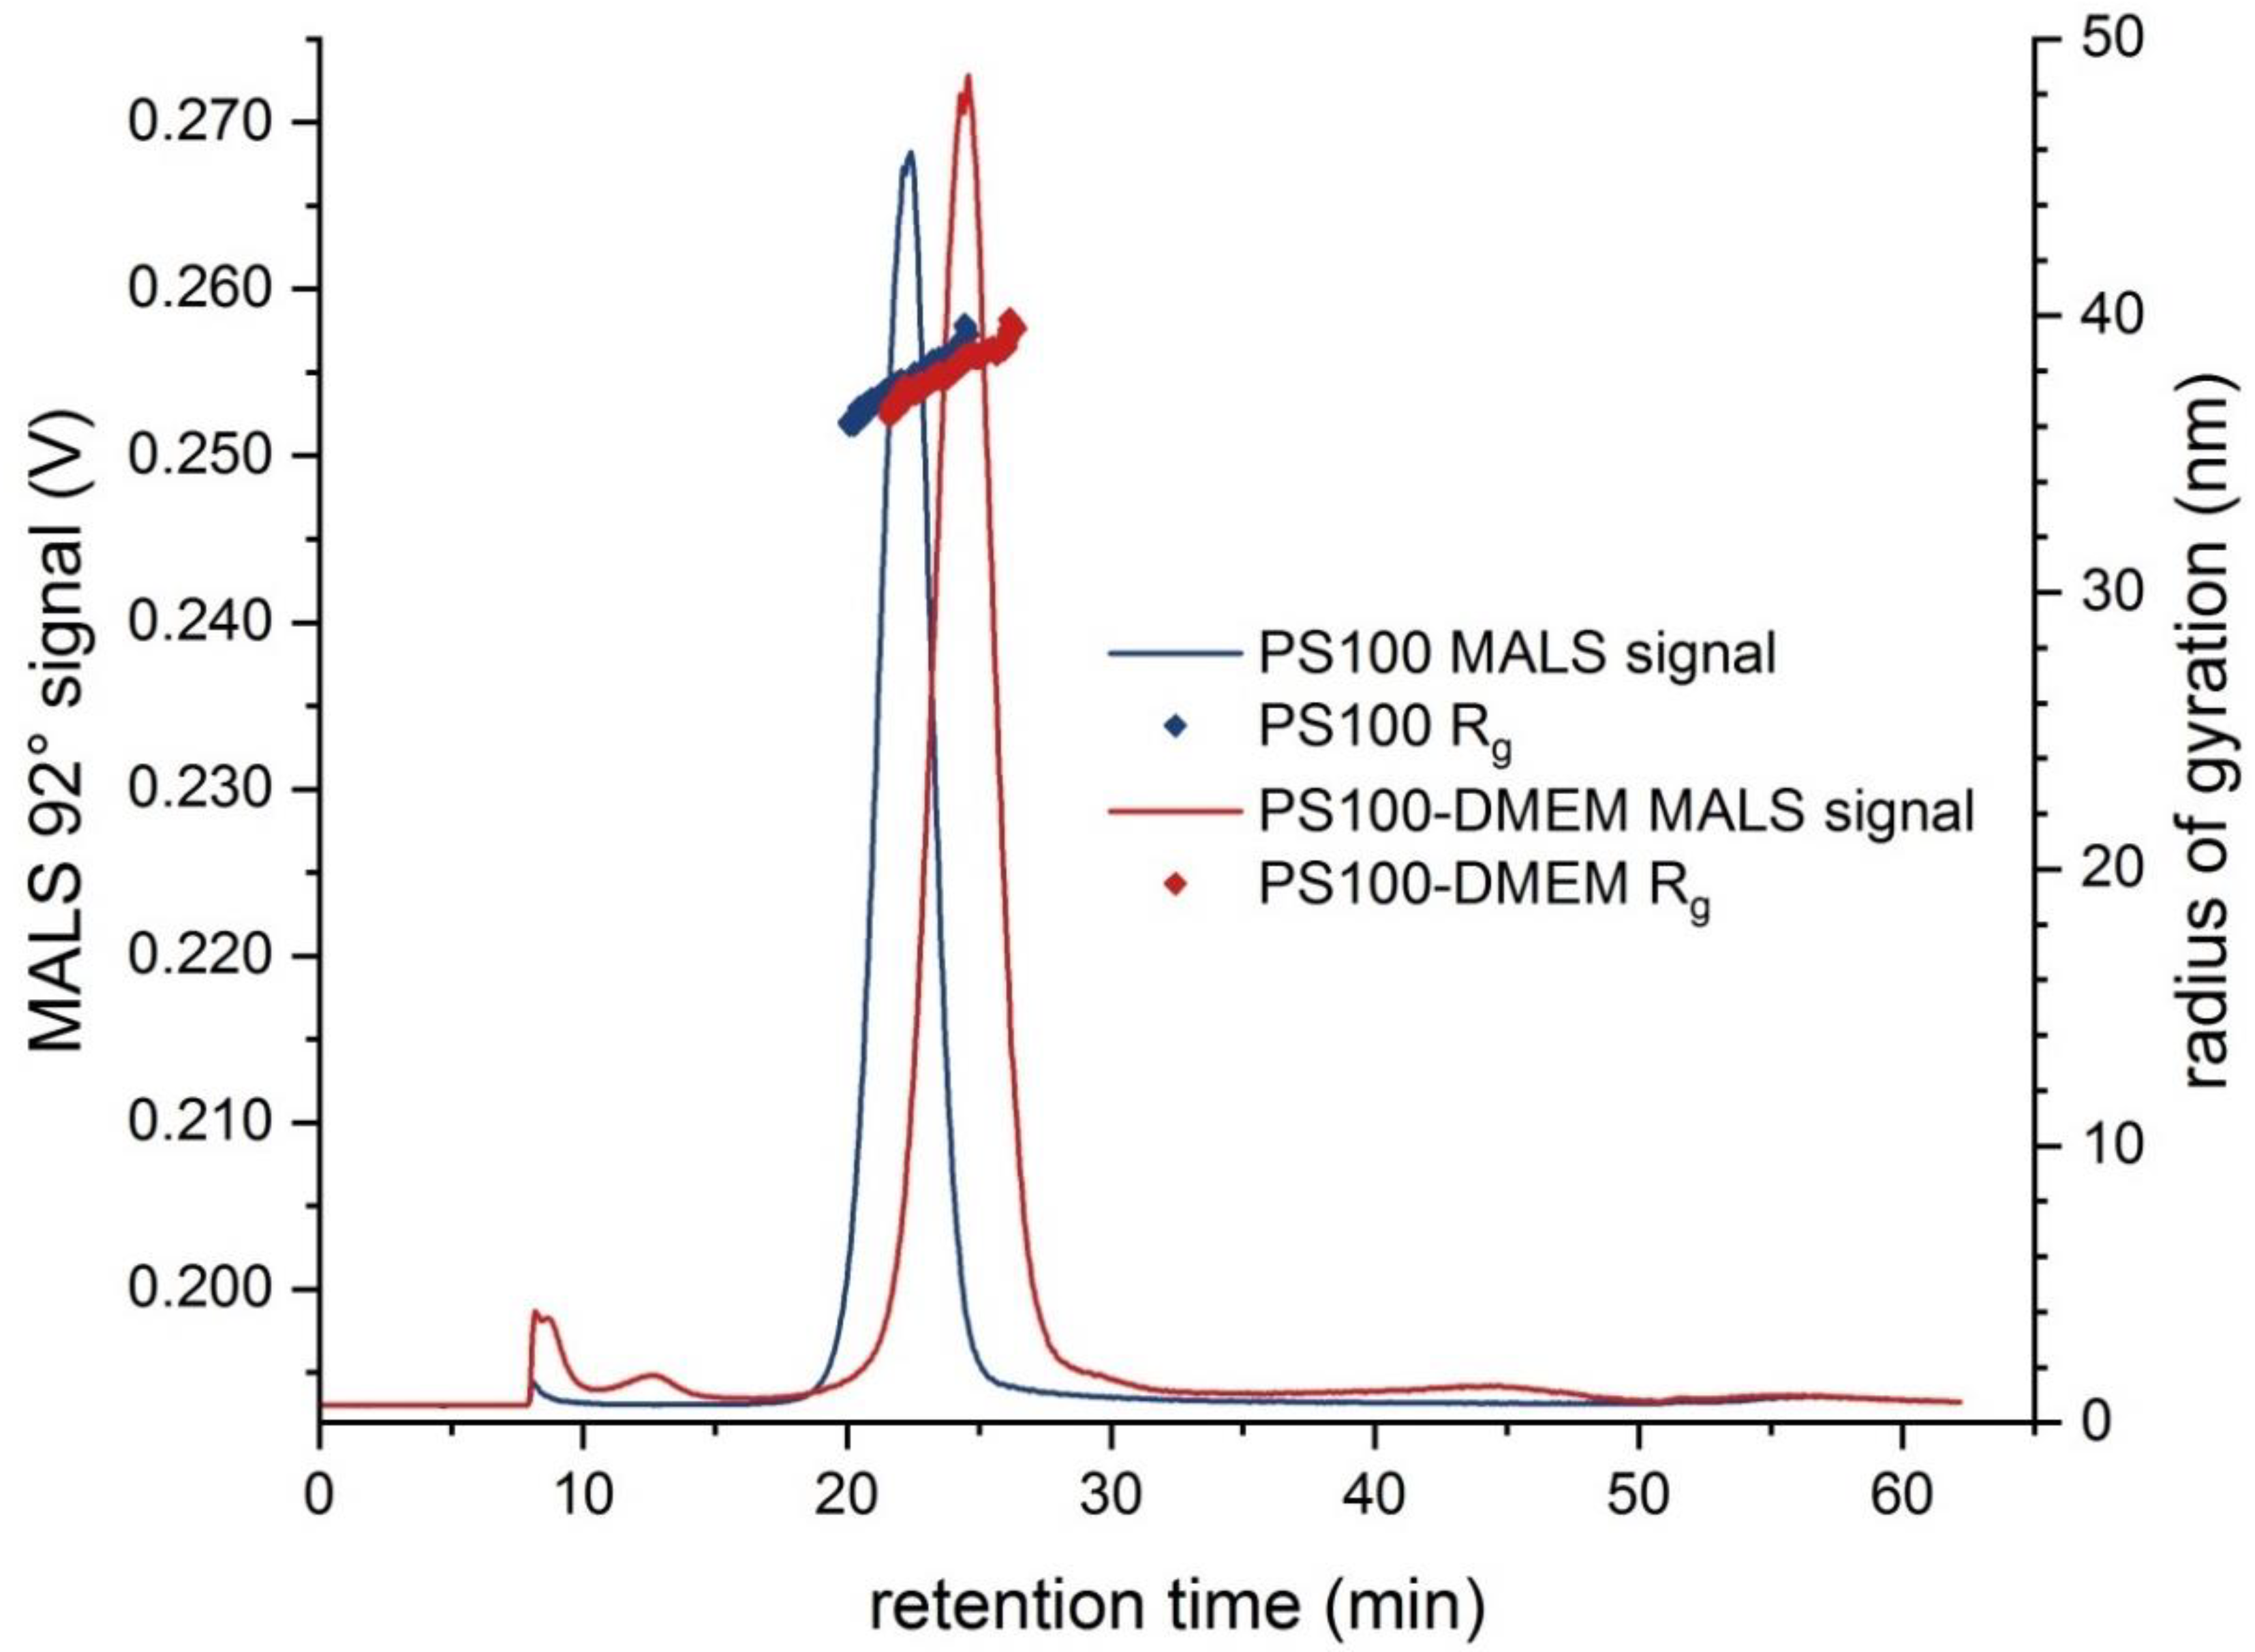
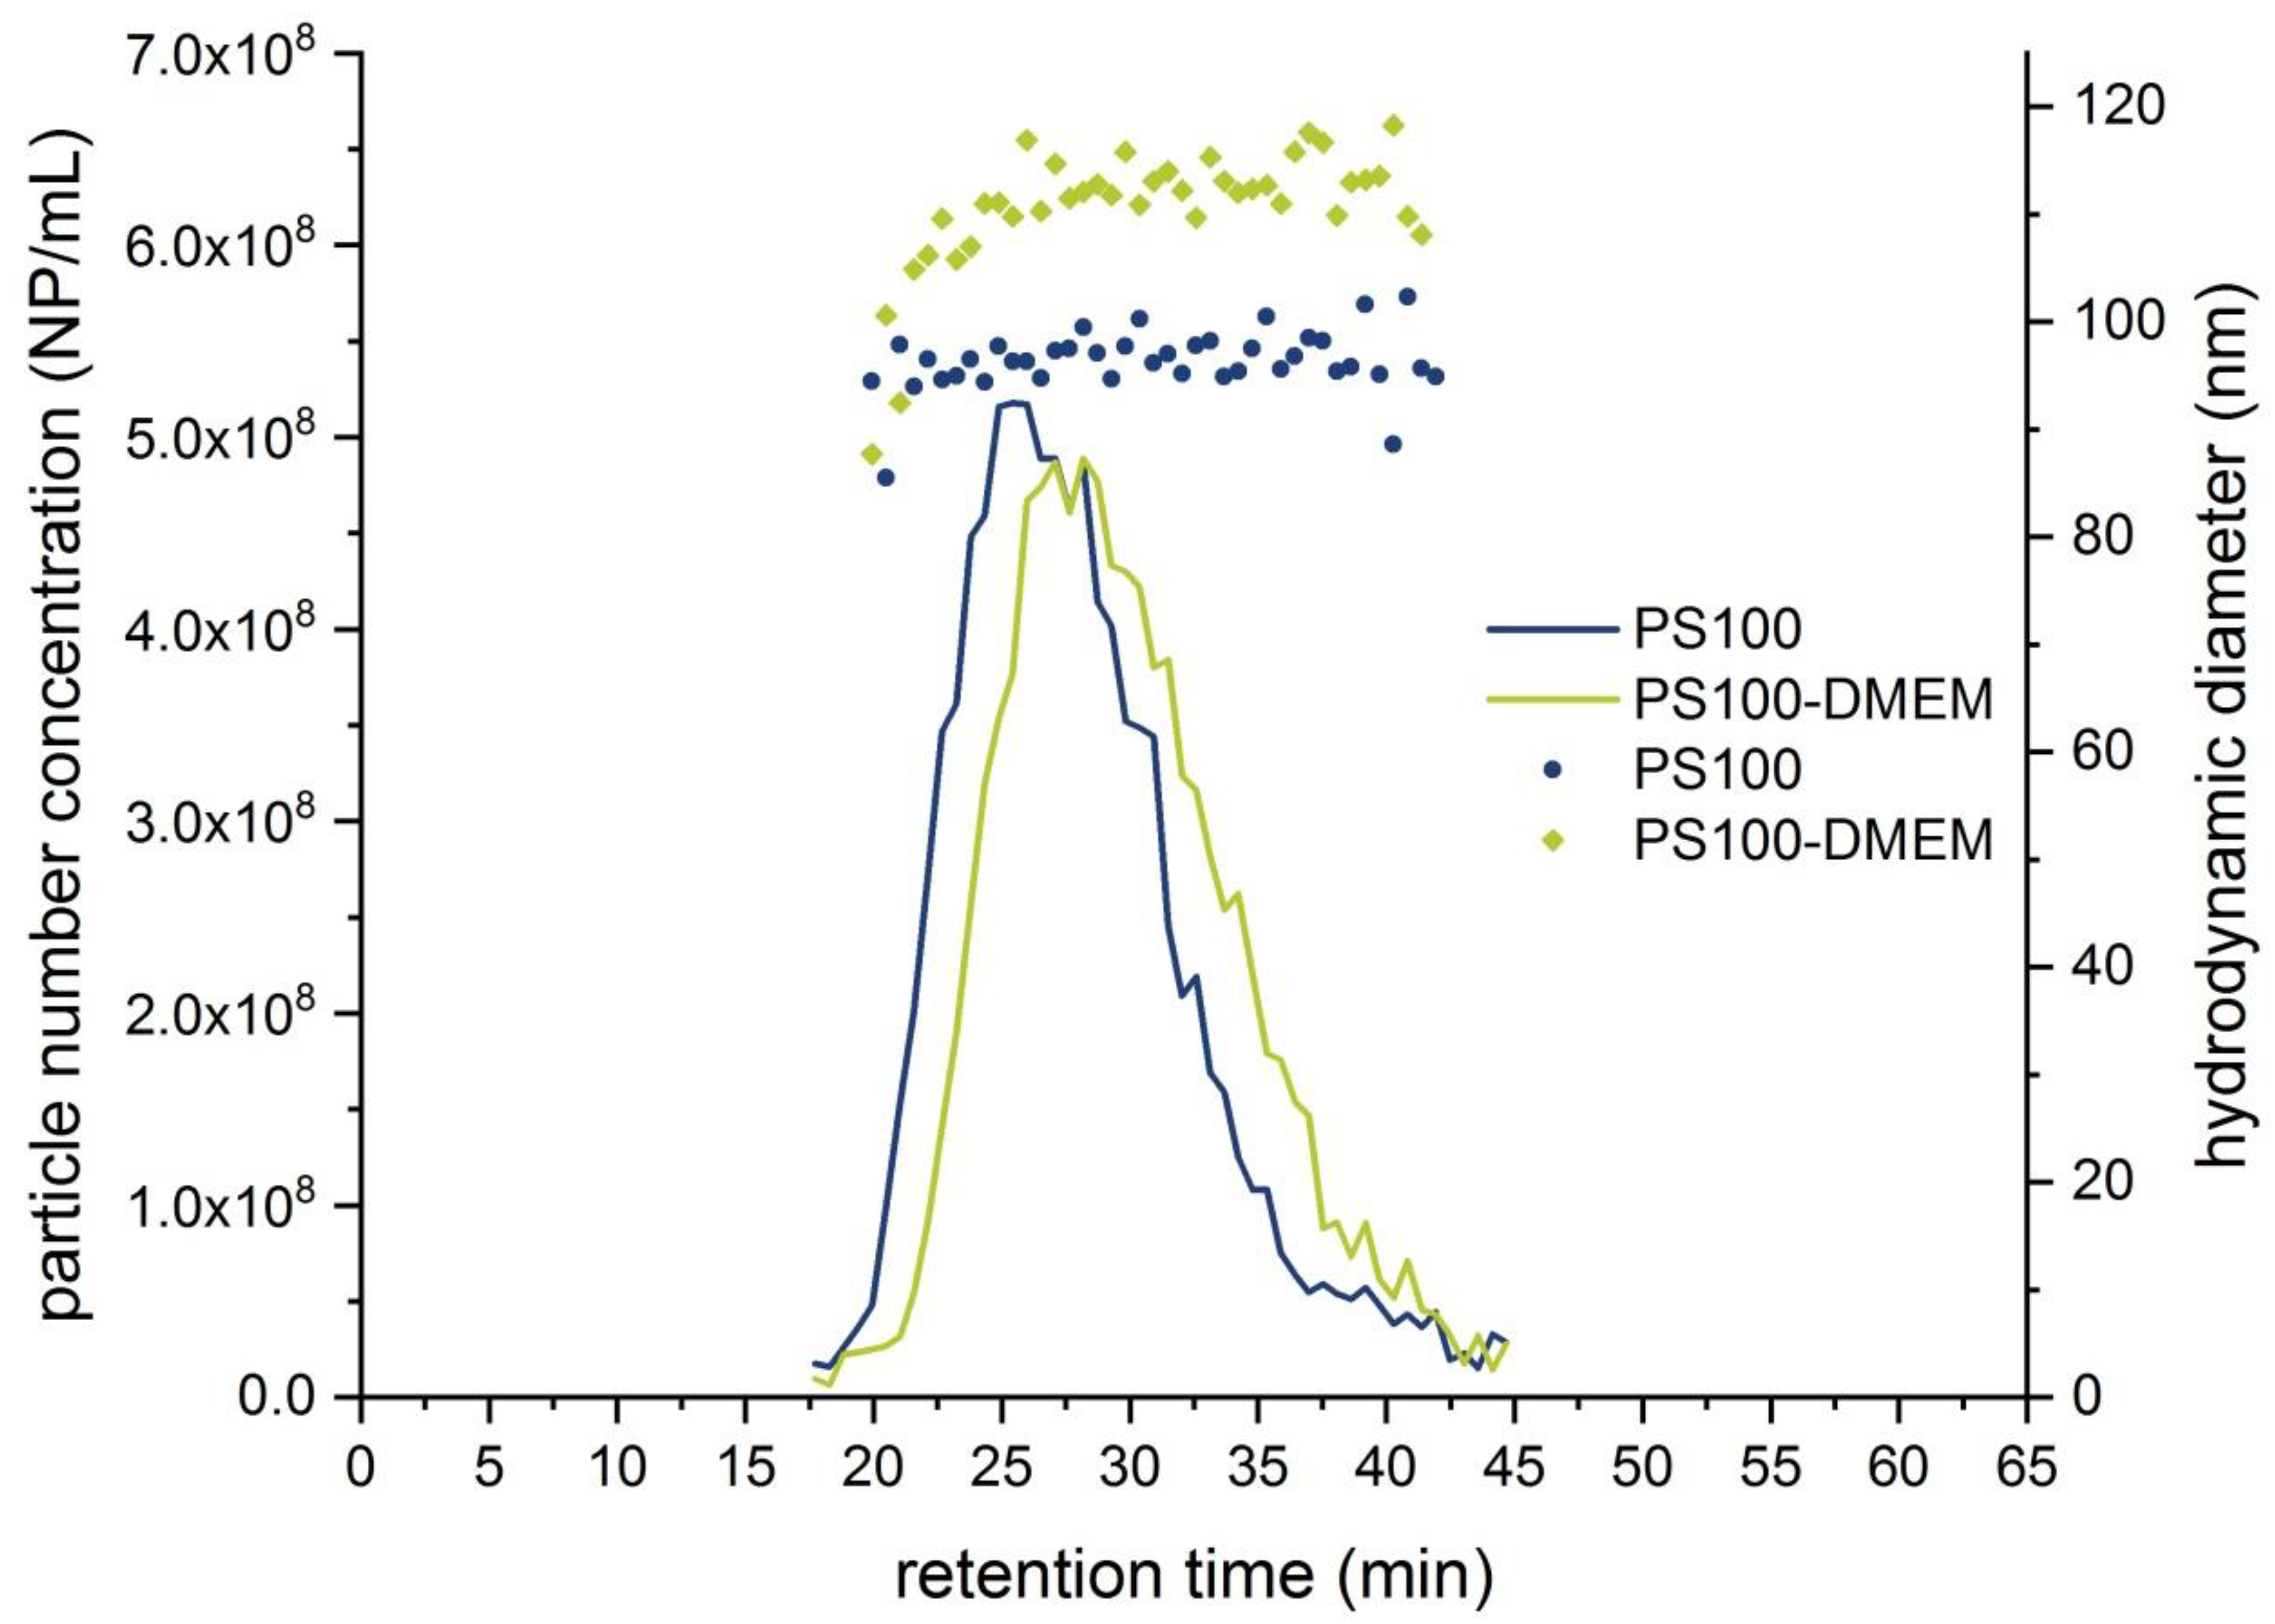
| PS100 | 37.5 ± 0.2 | 36–40 | 96.7 ± 0.5 | 95–102 | 5.20 × 10⁸ | −48.0 ± 3.0 | 90.7 ± 1.4 |
| PS100-DMEM | 37.3 ± 0.5 | 36–40 | 113.3 ± 3.0 | 105–119 | 4.90 × 10⁸ | −37.1 ± 1.9 | 100.0 ± 1.0 |
| Sample | MALS Results | NTA Results | EAF4 Evaluation | ||||
|---|---|---|---|---|---|---|---|
| Rg at Peak Maximum (nm) | Rg Range (nm) | Dh at Peak Maximum (nm) | Dh Range (nm) | Particle Concentration at Peak Maximum (NP mL−1) | Zeta Potential (mV) | Recovery (%) | |
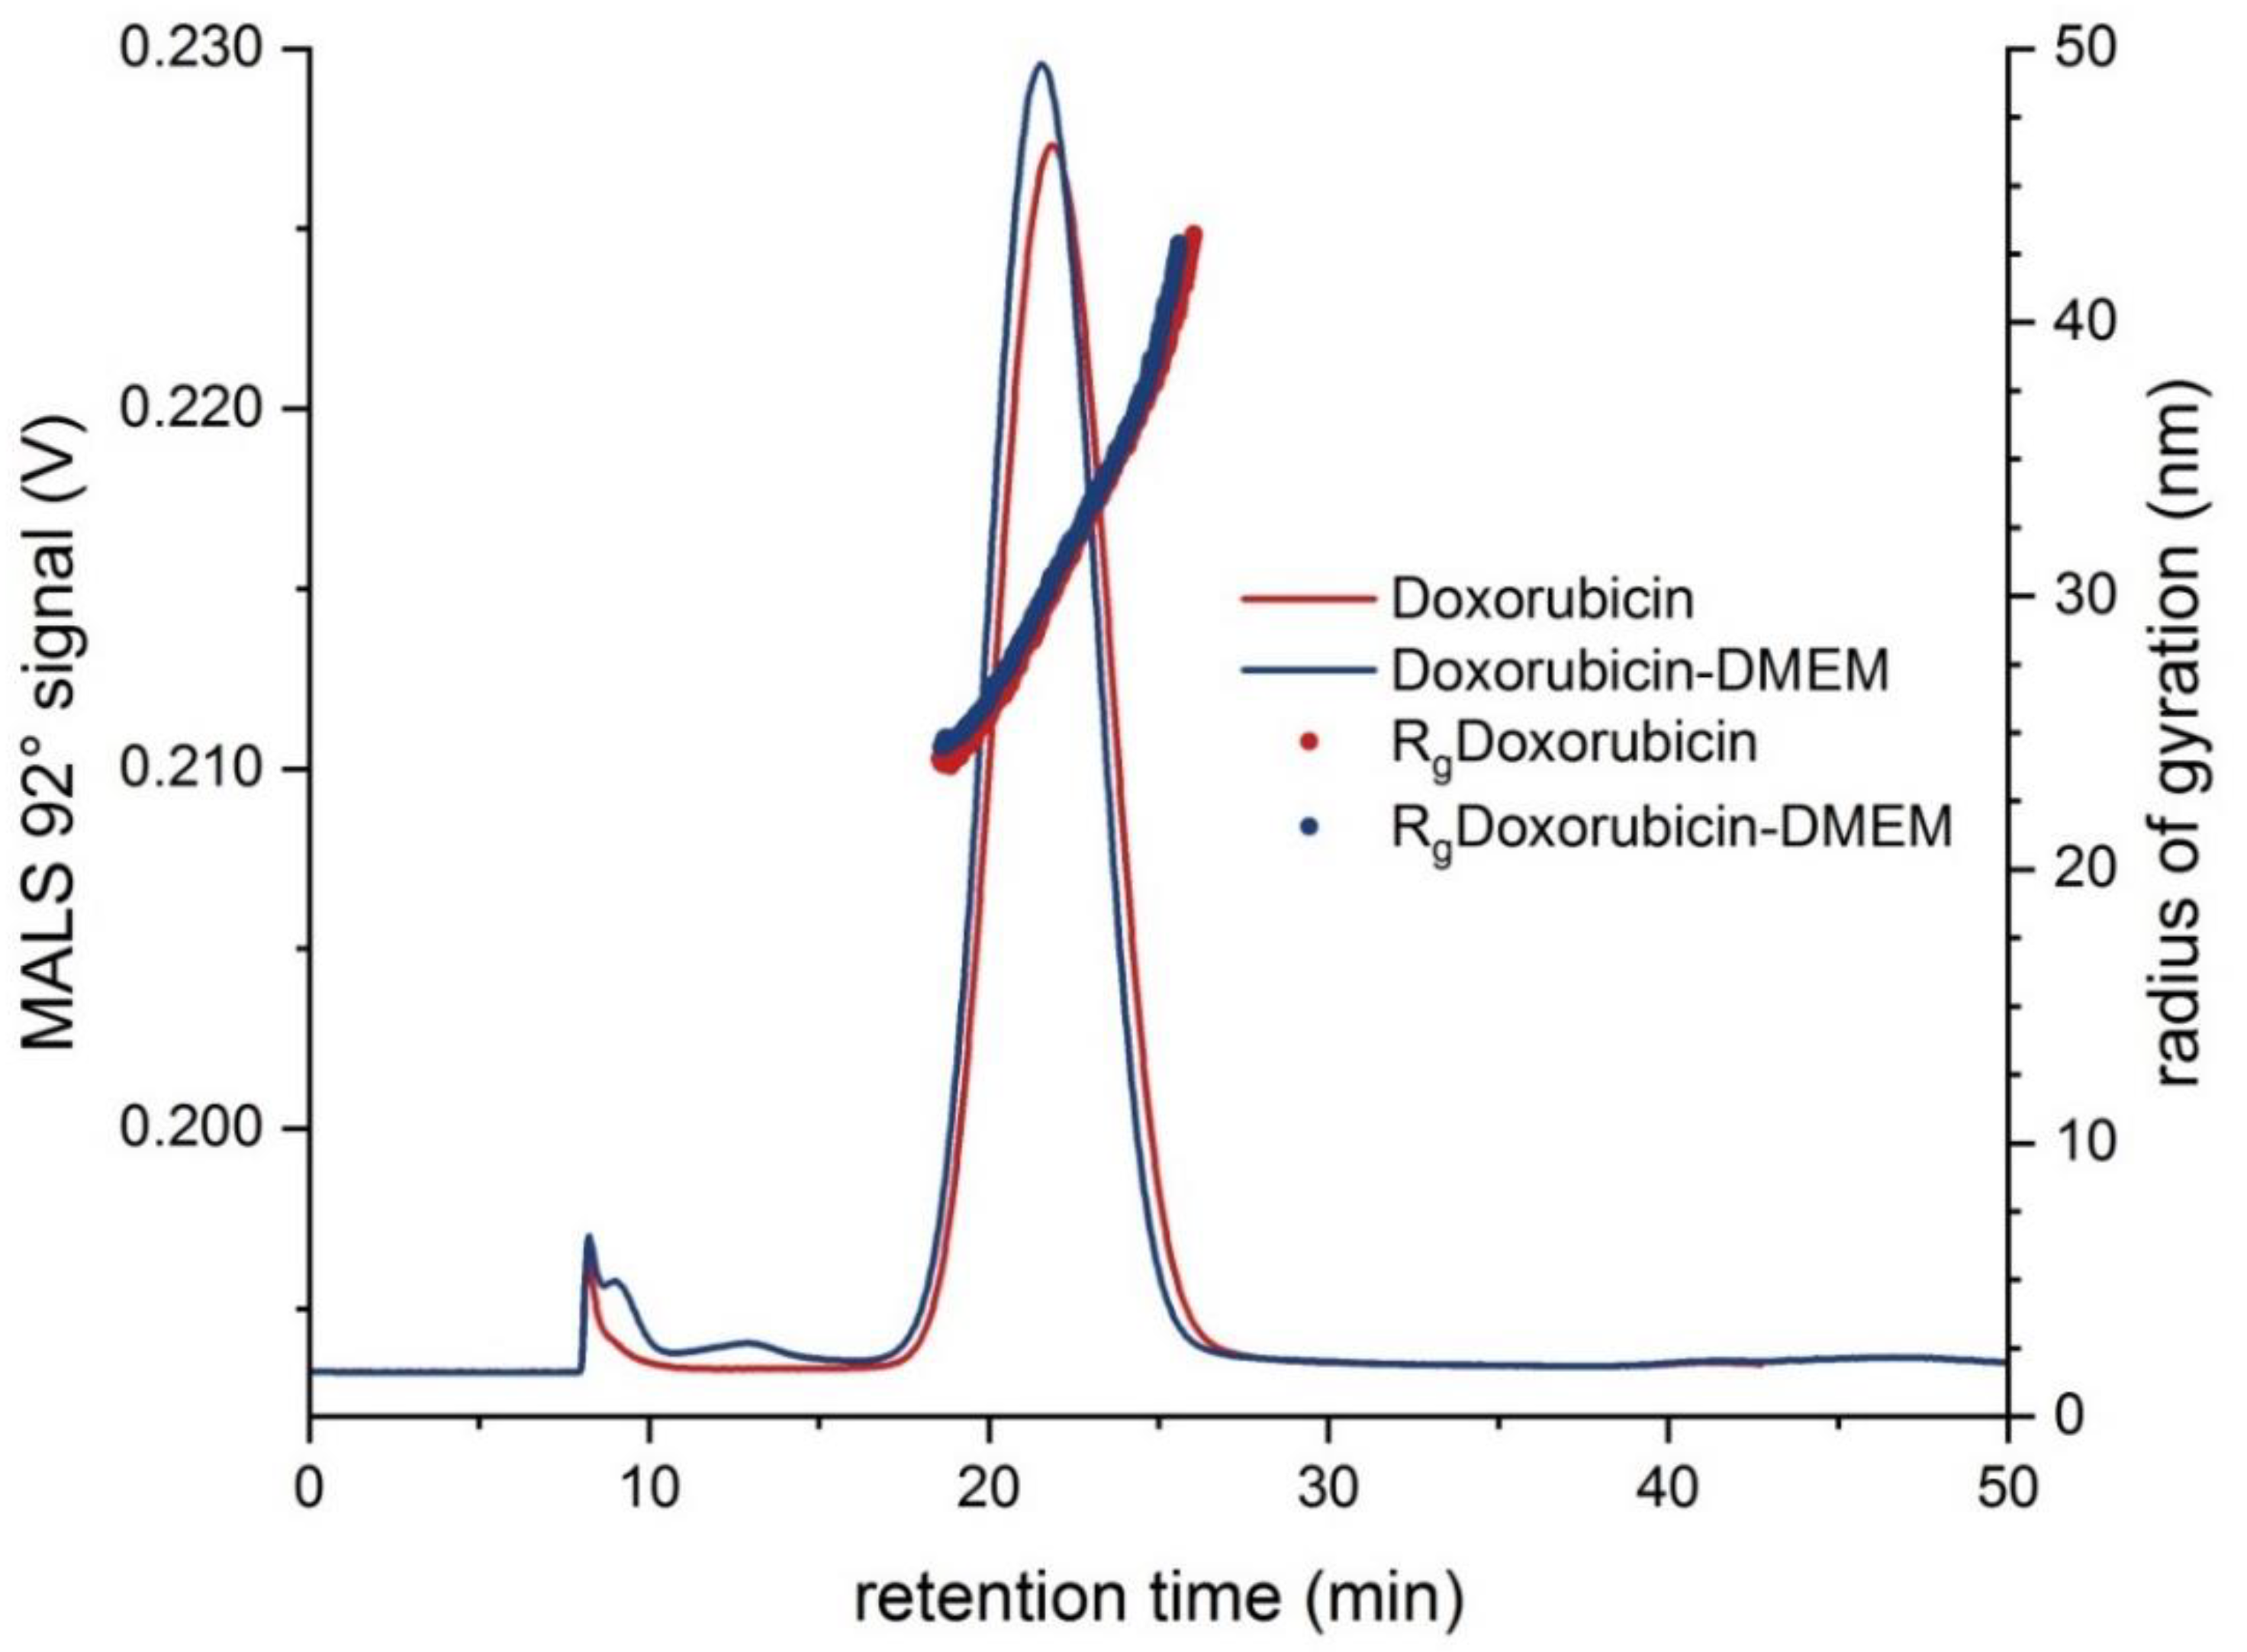
| Liposomal Doxorubicin HCl | 30.4 ± 0.7 | 24–41 | 76.9 ± 1.9 | 65–95 | 7.50 × 10⁸ | −34.6 ± 1.5 | 87.6 ± 1.6 |
| Doxorubicin-DMEM | 29.9 ± 0.3 | 24–41 | 72.9 ± 3.0 | 60–95 | 5.40 × 10⁸ | −45.2 ± 1.5 | 89.9 ± 1.9 |
| Sample | MALS Results | NTA Results | EAF4 Evaluation | ||||
|---|---|---|---|---|---|---|---|
| Rg at Peak Maximum (nm) | Rg Range (nm) | Dh at Peak Maximum (nm) | Dh Range (nm) | Particle Concentration at Peak Maximum (NP mL−1) | Zeta Potential (mV) | Recovery (%) | |
| Exosome Standard | 37.9 ± 1.5 | 23–100 | 98.2 ± 6.8 | 43–150 | 7.50 × 10⁸ | n.d. | n.d. |
| Exosome-serum | 43.3 ± 1.0 | 23–100 | 41.2 ± 11.9 | 35–90 | 1.60 × 10⁹ | n.d. | n.d. |
Publisher’s Note: MDPI stays neutral with regard to jurisdictional claims in published maps and institutional affiliations. |
© 2020 by the authors. Licensee MDPI, Basel, Switzerland. This article is an open access article distributed under the terms and conditions of the Creative Commons Attribution (CC BY) license (http://creativecommons.org/licenses/by/4.0/).
Share and Cite
Drexel, R.; Siupa, A.; Carnell-Morris, P.; Carboni, M.; Sullivan, J.; Meier, F. Fast and Purification-Free Characterization of Bio-Nanoparticles in Biological Media by Electrical Asymmetrical Flow Field-Flow Fractionation Hyphenated with Multi-Angle Light Scattering and Nanoparticle Tracking Analysis Detection. Molecules 2020, 25, 4703. https://doi.org/10.3390/molecules25204703
Drexel R, Siupa A, Carnell-Morris P, Carboni M, Sullivan J, Meier F. Fast and Purification-Free Characterization of Bio-Nanoparticles in Biological Media by Electrical Asymmetrical Flow Field-Flow Fractionation Hyphenated with Multi-Angle Light Scattering and Nanoparticle Tracking Analysis Detection. Molecules. 2020; 25(20):4703. https://doi.org/10.3390/molecules25204703
Chicago/Turabian StyleDrexel, Roland, Agnieszka Siupa, Pauline Carnell-Morris, Michele Carboni, Jo Sullivan, and Florian Meier. 2020. "Fast and Purification-Free Characterization of Bio-Nanoparticles in Biological Media by Electrical Asymmetrical Flow Field-Flow Fractionation Hyphenated with Multi-Angle Light Scattering and Nanoparticle Tracking Analysis Detection" Molecules 25, no. 20: 4703. https://doi.org/10.3390/molecules25204703
APA StyleDrexel, R., Siupa, A., Carnell-Morris, P., Carboni, M., Sullivan, J., & Meier, F. (2020). Fast and Purification-Free Characterization of Bio-Nanoparticles in Biological Media by Electrical Asymmetrical Flow Field-Flow Fractionation Hyphenated with Multi-Angle Light Scattering and Nanoparticle Tracking Analysis Detection. Molecules, 25(20), 4703. https://doi.org/10.3390/molecules25204703