Article

Comparison of Volatiles in Different Jasmine Tea Grade Samples Using Electronic Nose and Automatic Thermal Desorption-Gas Chromatography-Mass Spectrometry Followed by Multivariate Statistical Analysis

1
College of Horticulture, Fujian Agriculture and Forestry University, Fuzhou, Fujian 350002, China
2
Key Laboratory of Tea Science in Fujian Provincial University, Fujian Agriculture and Forestry University, Fuzhou, Fujian 350002, China
3
College of Pharmacy, Fujian University of Traditional Chinese Medicine, Fuzhou, Fujian 350122, China
4
Hengzheng Testing Technology Co., Ltd., Fuzhou, Fujian 350100, China
*
Authors to whom correspondence should be addressed.
These authors contributed equally to this work and should be considered co-first authors.
Molecules 2020, 25(2), 380; https://doi.org/10.3390/molecules25020380
Submission received: 23 November 2019 / Revised: 13 January 2020 / Accepted: 14 January 2020 / Published: 16 January 2020

Abstract

:
Chinese jasmine tea is a type of flower-scented tea, which is produced by mixing green tea with the Jasminum sambac flower repeatedly. Both the total amount and composition of volatiles absorbed from the Jasminum sambac flower are mostly responsible for its sensory quality grade. This study aims to compare volatile organic compound (VOC) differences in authoritative jasmine tea grade samples. Automatic thermal desorption-gas-chromatography-mass spectrometry (ATD-GC-MS) and electronic nose (E-nose), followed by multivariate data analysis is conducted. Consequently, specific VOCs with a positive or negative correlation to the grades are screened out. Partial least squares-discriminant analysis (PLS-DA) and hierarchical cluster analysis (HCA) show a satisfactory discriminant effect on rank. It is intriguing to find that the E-nose is good at distinguishing the grade difference caused by VOC concentrations but is deficient in identifying essential aromas that attribute to the unique characteristics of excellent grade jasmine tea.

Graphical Abstract

Chemical compounds studied in this article: methyl salicylate (PubChem CID: 4133), linalool (PubChem CID: 6549), linalool oxide (furanoid) (PubChem CID: 240), ethyl decanoate (PubChem CID: 8048)

1. Introduction

It is a general belief that the pleasant aroma of the Jasminum sambac flower can relieve the mood of depression [1]. Moreover, the health effect of tea also has been widely confirmed [2]. Both of these concepts make jasmine tea a popular tea worldwide [3,4]. Traditionally, the processing of jasmine tea, includes the following seven steps (shown in Figure S1) of tea dhool preprocessing, fresh flowers maintenance, tea and flower combination, scenting, flower removal, drying, and packing [5]. Current Chinese National Standards subdivide jasmine tea into six grades according to the number of times of repeated scenting which affects the quality of both the Jasminum sambac flower and the tea dhool [6,7]. The floral fragrance adsorption and persistence are critical factors related to jasmine tea grading [8].
Presently, there are existing studies on the evaluation of jasmine tea quality. Chen et al. observed the changes of volatile compounds during the scenting processes, and marked a serial of positive correlated compounds [3], for example. Lin et al. proposed a jasmine tea flavor (JTF) index (the ratio of peak area percentage of (Z)-3-hexenyl benzoate, α-farnesene, methyl anthranilate to linalool) as a novel quality evaluation index for jasmine tea’s volatile organic compound (VOC) evaluation [9]. Shen et al. believed the adsorption and retention of endogenous volatiles of tea was key for its quality [8]. Liang et al. analyzed the application of chemical composition and solution color to the difference of jasmine tea in its quality evaluation [10].
Electronic nose (E-nose) is another technique which has been widely used in product quality testing [11], medical diagnosis [12] and environmental monitoring [13], for example. E-nose can make a simple, fast and effective discrimination [14,15]. Its vital module is the sensor array of metal oxide films which can simulate the human nose and generate corresponding signals for gases. The response value of the e-nose is R/R0. R0 is the reference resistance obtained by cleaning the electronic nose before testing, and R is the sample resistance obtained during testing. While, E-nose is also a typical gray box system, which mainly constructs the discriminant model between input signals and output results through algorithm training [11], it means that, although the correct judgment could be given, it is still hard to tell which substances play a key role in grade contingencies.
Gas-chromatography- mass spectrometry (GC-MS), coupled with an enrichment pretreatment is the most commonly used method. Conventional existing enrichment methods include simultaneous distillation and extraction [16], headspace solid-phase microextraction [17], solid-phase extraction [18], accelerated solvent extraction [19] and more. Automatic thermal desorption (ATD) is a new prominent enrichment method, which has the advantages of convenient operation, a high enrichment rate, good reproducibility and no use of organic solvents. The combination of ATD to GC-MS has been used in air monitoring [20], analysis of pesticides in the atmosphere [21], material and emission analysis [22], food and aroma analysis [23] etcetera. The main advantage of applying ATD to the detection of jasmine aroma is the content of VOC enrichment could be much higher than that found by solid-phase microextraction (SPME).
The purpose of this study is to compare aroma characteristics within different jasmine tea grade samples through distinct techniques. A group of corresponding samples are subjected to research. Both electronic nose and automatic thermal desorption-gas-chromatography-mass spectrometry (ATD-GC-MS) are applied. Their discriminant effects are compared systematically. Accordingly, the rapid classification of jasmine tea is achieved using an electronic nose, while ATD-GC-MS detection followed by multivariate data analysis can provide a more profound understanding of the composition of volatile substances related to grading classification.

2. Materials and Methods

2.1. Sample Information

A group of authoritative jasmine tea grade samples (including six grades, indicated as 1G, 2G, 2G, 3G, 4G, 5G and 6G, three repeats per grade for automatic thermal desorption-gas-chromatography-mass spectrometry (ATD-GC-MS) tests, six repeats per grade for the E-nose test) prepared according to Chinese National Standards GB/T 34779-2017 [5], were provided by Fujian Tea Import and Export Company Limited. (Fuzhou city, Fujian province, China). All samples were stored in a refrigerator at 4 °C before analysis.

2.2. Chemicals

Volatiles standards, including methyl salicylate (PubChem CID: 4133; 99.5%), linalool (PubChem CID: 6549; ≥99.5%), linalool oxide (furanoid) (PubChem CID: 240; ≥99.5%), ethyl decanoate (PubChem CID: 8048; ≥99%), were purchased from Aladdin (Shanghai, China).

2.3. Automatic Thermal Desorption-Gas-Chromatography-Mass Spectrometry (ATD-GC-MS) Analysis

The volatile organic compound (VOC) of jasmine tea samples was analyzed using an ATD-GC-MS method, described by Zheng [24], with slight modification. A COLIN Tech Auto thermal desorption sampler (Chengdu Colin Analytical Technology Co., Ltd., Chengdu, China) and a Shimadzu 2010 gas-chromatography (GC) coupled with 8040 triple quadrupole mass spectrometry (TQ-MS) (Shimadzu Production Institute, Kyoto, Japan) was applied.

2.3.1. Extraction of Volatile Organic Compounds (VOC)

A QC-1S atmosphere sampling instrument (Beijing Kean Labor Insurance New Technology Co., Ltd., Beijing, China) was used for VOC extraction according to China’s National Environmental Protection Standards [25]. The VOC analysis method was the same as Zheng et al. [24]. Briefly, 3.0 g of sample was weighted into a headspace bottle and ethyl decanoate (100 ppm, 15 µL) was added to the samples as the internal standard. Then, the headspace bottle was sealed and equilibrated at 55 °C for 20 min. Afterward, the sorbent tube (Chengdu Colin Analytical Technology Co., Ltd., Chengdu, China) was connected to the atmosphere sampling instrument and headspace bottle according to the flow direction of the sorbent tube with polytetrafluoroethylene (PTFE) pipes. Finally, volatile components were collected at 200 mL/min flow rate for 30 min. After sample collection, both ends of the sorbent tube were sealed with PTFE caps and transported to the laboratory for analysis.

2.3.2. Thermal Desorption

Thermal desorption was conducted by a COLIN Tech Auto thermal desorption sampler (Chengdu Colin Analytical Technology Co., Ltd., Chengdu, China). The primary thermal desorption of sampling tube was carried out at 250 °C for 5 min. To introduce trapped compounds into the gas chromatograph, the cold trap was then heated rapidly from −25 °C to 300 °C. The temperature of the valve and transfer line were maintained at 200 °C during analysis. Then, the whole system was baked at 300 °C for 3 min in preparation for the next sample analysis.

2.3.3. Gas-Chromatography-Mass Spectrometry Analysis

Volatile organic compounds were identified using a 2010 GC coupled with an 8040 TQ-MS system (Shimadzu Corporation, Kyoto, Japan). The capillary column was a Shimadzu Rtx-5MS capillary column (30 m × 0.25 mm × 0.25 µm), and the carrier gas was helium at 1.0 mL/min. The split ratio was 1:40. The inlet temperature was 240 °C. The gradient temperature program was as follows: initial oven temperature was 40 °C, held for 3 min; 40–120 °C at 5 °C/min, held for 5 min; 120–240 °C at 30 °C/min, held for 8 min. The ionization mode of the MS was electron impact (EI). The temperatures of the interface and ion sources were 280 °C and 230 °C, respectively. The acquisition mode was full scan.

2.3.4. Identification of Volatile Organic Compounds (VOC)

Shown in Table 1, the volatile compounds were identified by matching their mass spectra fragmentation patterns, retention index with those stored mass spectra libraries (NIST 11.L and Wiley 7), and combining them with existing works of literature [3,4,26,27,28]. The relative content of identified compounds was obtained by comparing them with the peak area of internal standards (Table 2).

2.4. Electronic nose (E-Nose) Measurements

An ISENSO iNose E-nose system (Shanghai Ongshen Intelligent Technology Co., Ltd., Shanghai, China) was used to profile volatile fingerprints. Shown in Table S2, the gas detectors of the E-nose system were composed of ten metal oxide sensors (MOS), each of which was sensitive to different volatile organic compounds [29], respectively.
A portion of each sample (3.0 g) was weighed into a headspace bottle (60 mL) and equilibrated in a 55 °C water bath for 40 min. Then, the gas in the headspace was pumped over the sensor surfaces for 5 min at a constant flow rate of 800 mL/min. Finally, cleaning the probe with continuously pumped filtered air until all sensors’ baseline value returned to 1.00 was preparation for the next sample analysis. The stable value of each sensor was extracted for data processing.

2.5. Statistical Analysis

Soft independent modelling by class analogy (SIMCA) 14.1 (Umetrics AB, Umea, Sweden) was used for partial least squares-discriminant analysis (PLS-DA) and principal component analysis (PCA). The heatmap and hierarchical cluster analysis (HCA) was conducted using MetaboAnalyst web (https://www.metaboanalyst.ca/MetaboAnalyst/faces/home.xhtml). Statistical package for the social sciences (SPSS) 21.0 (IBM, Chicago, IL, USA) were applied for multivariate statistical analysis. The differences among six grades of jasmine tea samples were estimated through analysis of variance (ANOVA). Regarding rank correlation analysis, the correlation between the response and grade of each substance was analyzed, the compounds with both a positive linear correlation or a negative correlation were screened out, respectively.

3. Results and Discussion

3.1. Identification of Volatile Organic Compounds in the Jasmine Tea by Automatic Thermal Desorption-Gas-Chromatography-Mass Spectrometry Spectrometry

To investigate the aroma characteristics of tested Jasmine tea samples, their volatile compounds were subjected to ATD-GC-MS, and the average relative amounts of identified volatiles were compared. Typical total ion chromatograms (TICs) are presented in Figure S2.
A total of 18 samples, with six different grades (named 1G, 2G, 2G, 3G, 4G, 5G, and 6G) and three repeats per category, were subjected to investigation of their aroma characteristics. The identified VOC and their corresponding amounts (mean ± standard deviation) were summarized; their significant differences also were tested (Table 2; Table S4).
A total of sixty-three VOCs were identified (Table 1), including thirteen alcohols, five aldehydes, nineteen esters, twenty-three hydrocarbons, two ketones, one nitrogen compound, and one phenolic.

3.1.1. Alcohols

There were thirteen kinds of identified alcohol in the jasmine tea grade samples. Among these identified alcohols, linalool and benzyl alcohol, which are abundant in jasmine flowers [4,27,30], accounted for 52.32% and 30.91% of the total content of alcohol, respectively.
Linalool, imparts a floral, fruity, and woody odor in jasmine tea, and benzyl alcohol provides a sweet, roasted, mild, fruity and citrus-like aroma, were contained in both the tea dhool and jasmine flowers [4,27,31]. Here, the relative content of 3-hexen-1-ol in alcohols was lower than both linalool and benzyl alcohol. Meanwhile, they were closely related to the sensory attributes of grassy and lettuce-like aromas [27,32]. Furthermore, among alcohols, there were some volatile compounds with a negative correlation to the grade of jasmine tea, including cyclopentanone, 1-hexanol, (Z)-Linalool oxide and (E)-Linalool oxide. These four volatile compounds are found in green tea, and existing studies show that cyclopentanone, (Z)-Linalool oxide and (E)-Linalool oxide are negatively correlated with the grade of green tea [16,32]. It also was reported that phenyl ethyl alcohol, α-Terpineol, and geraniol were all derived from jasmine flowers, having floral or sweet odor [3,4,33].

3.1.2. Aldehydes

Five aldehydes, namely, benzaldehyde, decanal, hexanal, (E, E)-2,4-heptadienal and β-cyclocitral, were detected in all six grades of jasmine tea. Although aldehydes comprised 0.88% of the identified volatile organic compounds (VOC), they still contributed a lot to the aroma performance due to their low odor threshold [33]. Among aldehydes, benzaldehyde, which provided almond, sugar and burnt aroma notes, and decanal which supplied herbal, fatty and citrus aroma notes, were proven to play an essential role in aroma [4,26,27]. Here, all five aldehydes were negatively correlated with the grade of jasmine tea. Interestingly, these volatile compounds, which were harmful to the quality of jasmine tea, had been reported in green tea or originated from tea dhool [3,34,35]. Existing studies also demonstrated that hexanal and (E, E)-2,4-Heptadienal were negatively correlated with the grade of Japanese Matcha [34].

3.1.3. Esters

Nineteen esters were found in all grades of jasmine tea. They accounted for 63.47% of identified volatile organic compounds (VOC) and positively correlated with the grade. Benzyl acetate, (Z)-3-hexanol benzoate, methyl salicylate, and their predecessors have confirmed methyl anthranilate as the main volatile aroma components of jasmine tea, which was consistent with the results of this study [3,4,9]. Among them were benzyl acetate, having floral, fruity odor notes, and (Z)-3-hexanol benzoate, with green, spicy, woody notes while herbaceous ones have prominent aroma characteristics of jasmine flowers [26,27,28]. Methyl anthranilate was described as similar to a peachy, sweet, fruity grape-like fragrance originated from jasmine flowers [3,4,27]. Methyl salicylate was considered to be a sweet, spicy, minty, wintergreen-like odor, and recognized as a significant aroma compound of black tea [3,36]. It is noteworthy that most volatile compounds of esters were positively correlated with the grade of jasmine tea and came from Jasmine flowers.

3.1.4. Hydrocarbons

Twenty-two hydrocarbons were identified in the tea samples. Despite the large number, it had a limited contribution to the aroma of tea [32,37]. Among them, α-farnesene, having floral and herbaceous odor notes, was the most abundant and recognized as one of the vital aroma components in jasmine tea [3,4,9]. Furthermore, Myrcene, Germacrene D and α-Farnesene, and so forth, were positively correlated with the grade of jasmine tea and were reported to originate from jasmine flowers [3,30], while α-pinene and limonene were negatively correlated with the grade.

3.1.5. Ketones

Two ketones, namely 6-methyl-5-heptane-2-one and acetophenone, were identified. The 6-methyl-5-heptane-2-one was described as sweet, fruity, with orange odor notes, and previous studies confirmed that the compound showed an increasing trend in the processing of Oolong tea [9,38]. Regarding acetophenone, it was identified in Oolong tea [39], green tea [40], Pu’er tea [41] and Jasmine tea [27], but had little effect on the tea aroma. Moreover, there was a negative correlation between the relative content of 6-methyl-5-hapten-2-one and the quality grade.

3.1.6. Nitrogen Compound

The nitrogen compound detected in the tea samples was indole, which provided nutty, floral, mothball, and burnt aroma notes. It was known as one of the main aroma components of jasmine tea and was positively correlated with the grade [3,4,8].

3.1.7. Phenols

The phenol detected in the tea samples was eugenol. It may originate from the Jasmine Flower and be considered to be a clove-like spicy smell [8,9,26].

3.2. Multivariate Statistical Analysis of Identified Volatile Organic Compounds(VOC)

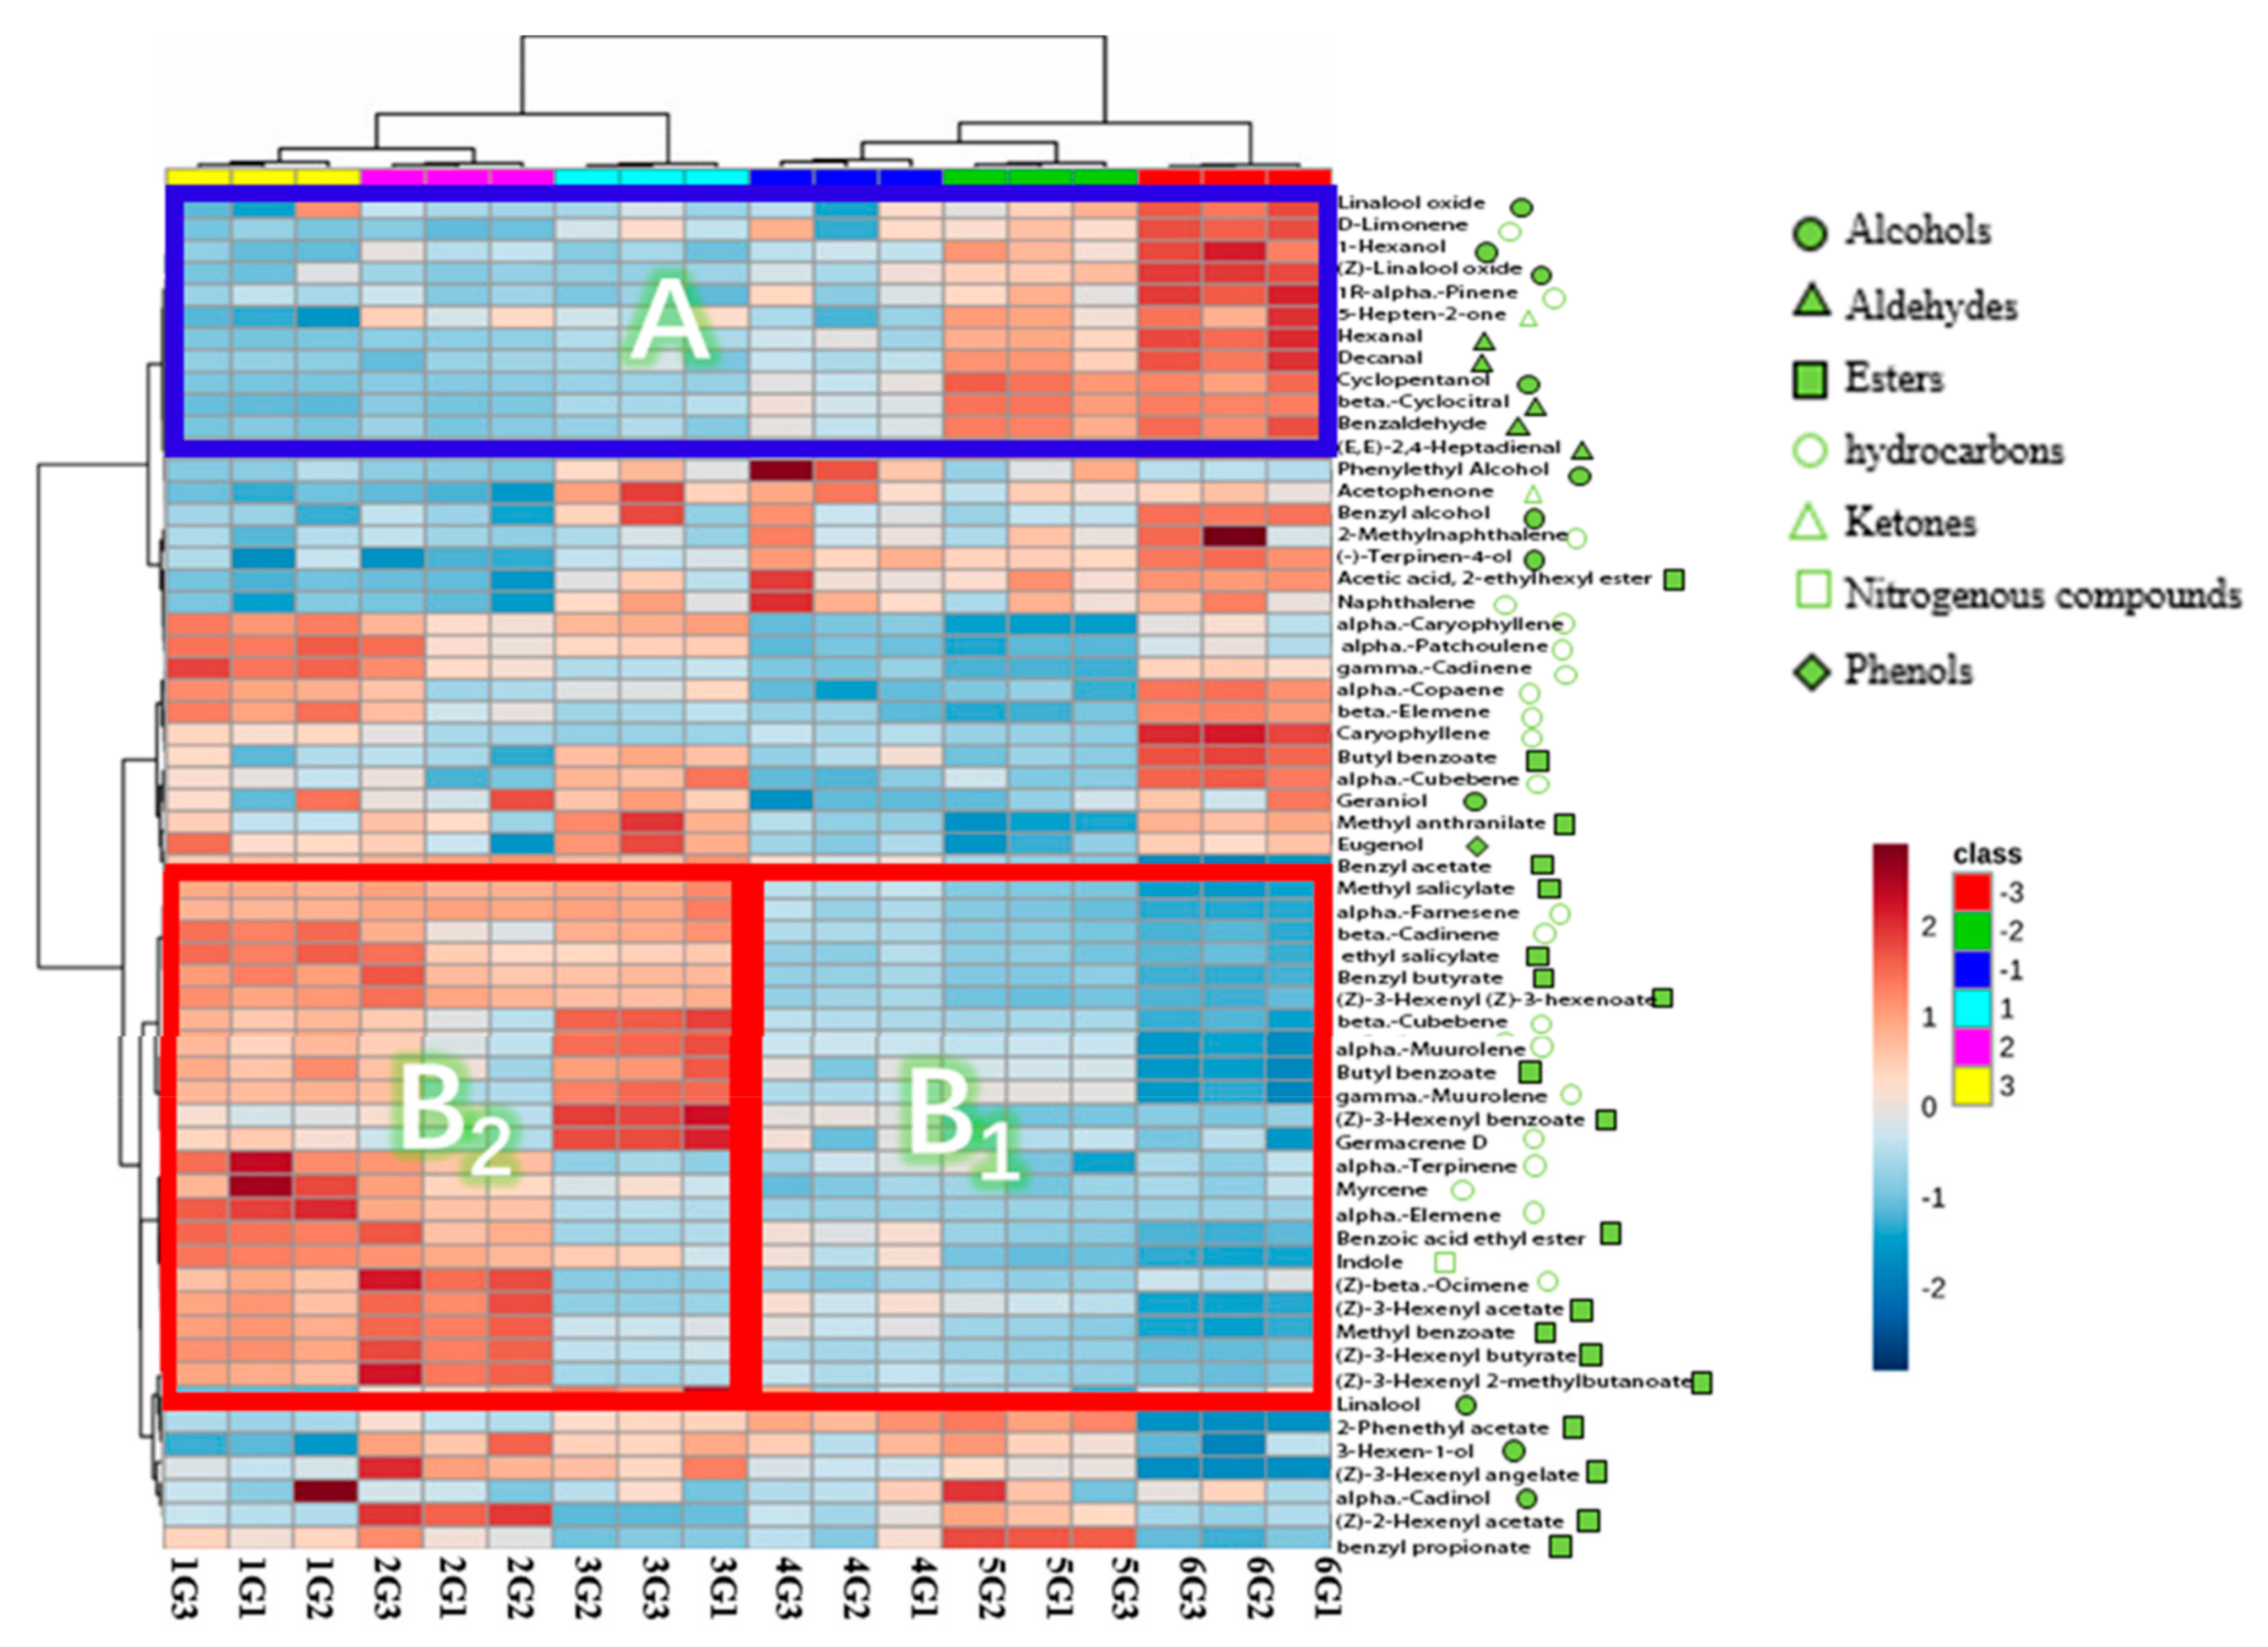
3.2.1. Hierarchical Clustering Analysis (HCA)

To present VOC differences among different grade samples, a heat-map of eighteen samples versus identified compounds was plotted (Figure 1). The red color in the plot represents a higher content than the mean value; the blue color represents a lower content than the corresponding mean value. The HCA also was performed to get a cluster pattern among the six different grades. These six grades were subdivided into two categories, which were a high-grade group (including 1G, 2G, and 3G) and a low-grade group (including 4G, 5G, and 6G). By comparing the color intensity variation across all samples, we found that some compounds changed correlationally according to grade quality reduction (Table S4).
Shown in Figure 1, the compounds marked with the blue frame, named A, indicated an increasing trend which correlated with the decline of grade. There was a total of twelve compounds, including five aldehydes (hexanal, decanal, β-Cyclocitral, benzaldehyde, (E,E)-2,4-Heptadienal), four alcohols (linalool oxide, 1-Hexanol, (Z)-Linalool oxide, cyclopentanol), two hydrocarbons (limonene, α-Pinene), and one ketone (5-Hepten-2-one), with fragrant characteristics such as fruity, floral, woody, green, sweet or more [4,26,27]. It was intriguing to find that most of these substances came from tea dhool [3,28]. Furthermore, according to existing research [16,34,35,42], most of them were negatively correlated to the quality of green tea.
Concerning the compounds in the red frame, B, (Figure 1), distinct rules were existing between the high-grade group (1G, 2G,3G) and the low-grade group (4G,5G,6G). Regarding the low-grade group, indicated as frame B1, positive linear correlations were existing. The amounts of both β-cadinene and (Z)-3-Hexenyl acetate, for example, were far higher in the higher grade. While, for the high-grade group, indicated as frame B2, there was not a simple linear relationship between their contents to the grade. Take β-cadinene as an example, the highest grade was in 1G, followed by 3G and 2G, however, Z-β-ocimene content was the highest in 2G, then in 1G and 3G. The reason may be that, in addition to the requirement of the intensity of flower fragrance, it is also an essential requirement for them to maintain Z-β-ocimene content at a moderate proportion, which could make its aroma coordinated.
Furthermore, as shown in Figure 1, there was a total of twenty-four compounds in frame B, including twelve esters, ten hydrocarbons, one alcohol, and one nitrogenous. It also is intriguing to find that most of them were absorbed from the jasmine flower [3,28,30]. It is remarkable that the main aroma components of jasmine tea (linalool, (Z)-3-Hexenyl benzoate, methyl salicylate, (Z)-3-Hexenyl acetate, α-Farnesene and indole) [3,4,9] were not linearly related to the grade, but were obviously rich in the high-grade group (1G, 2G,3G).

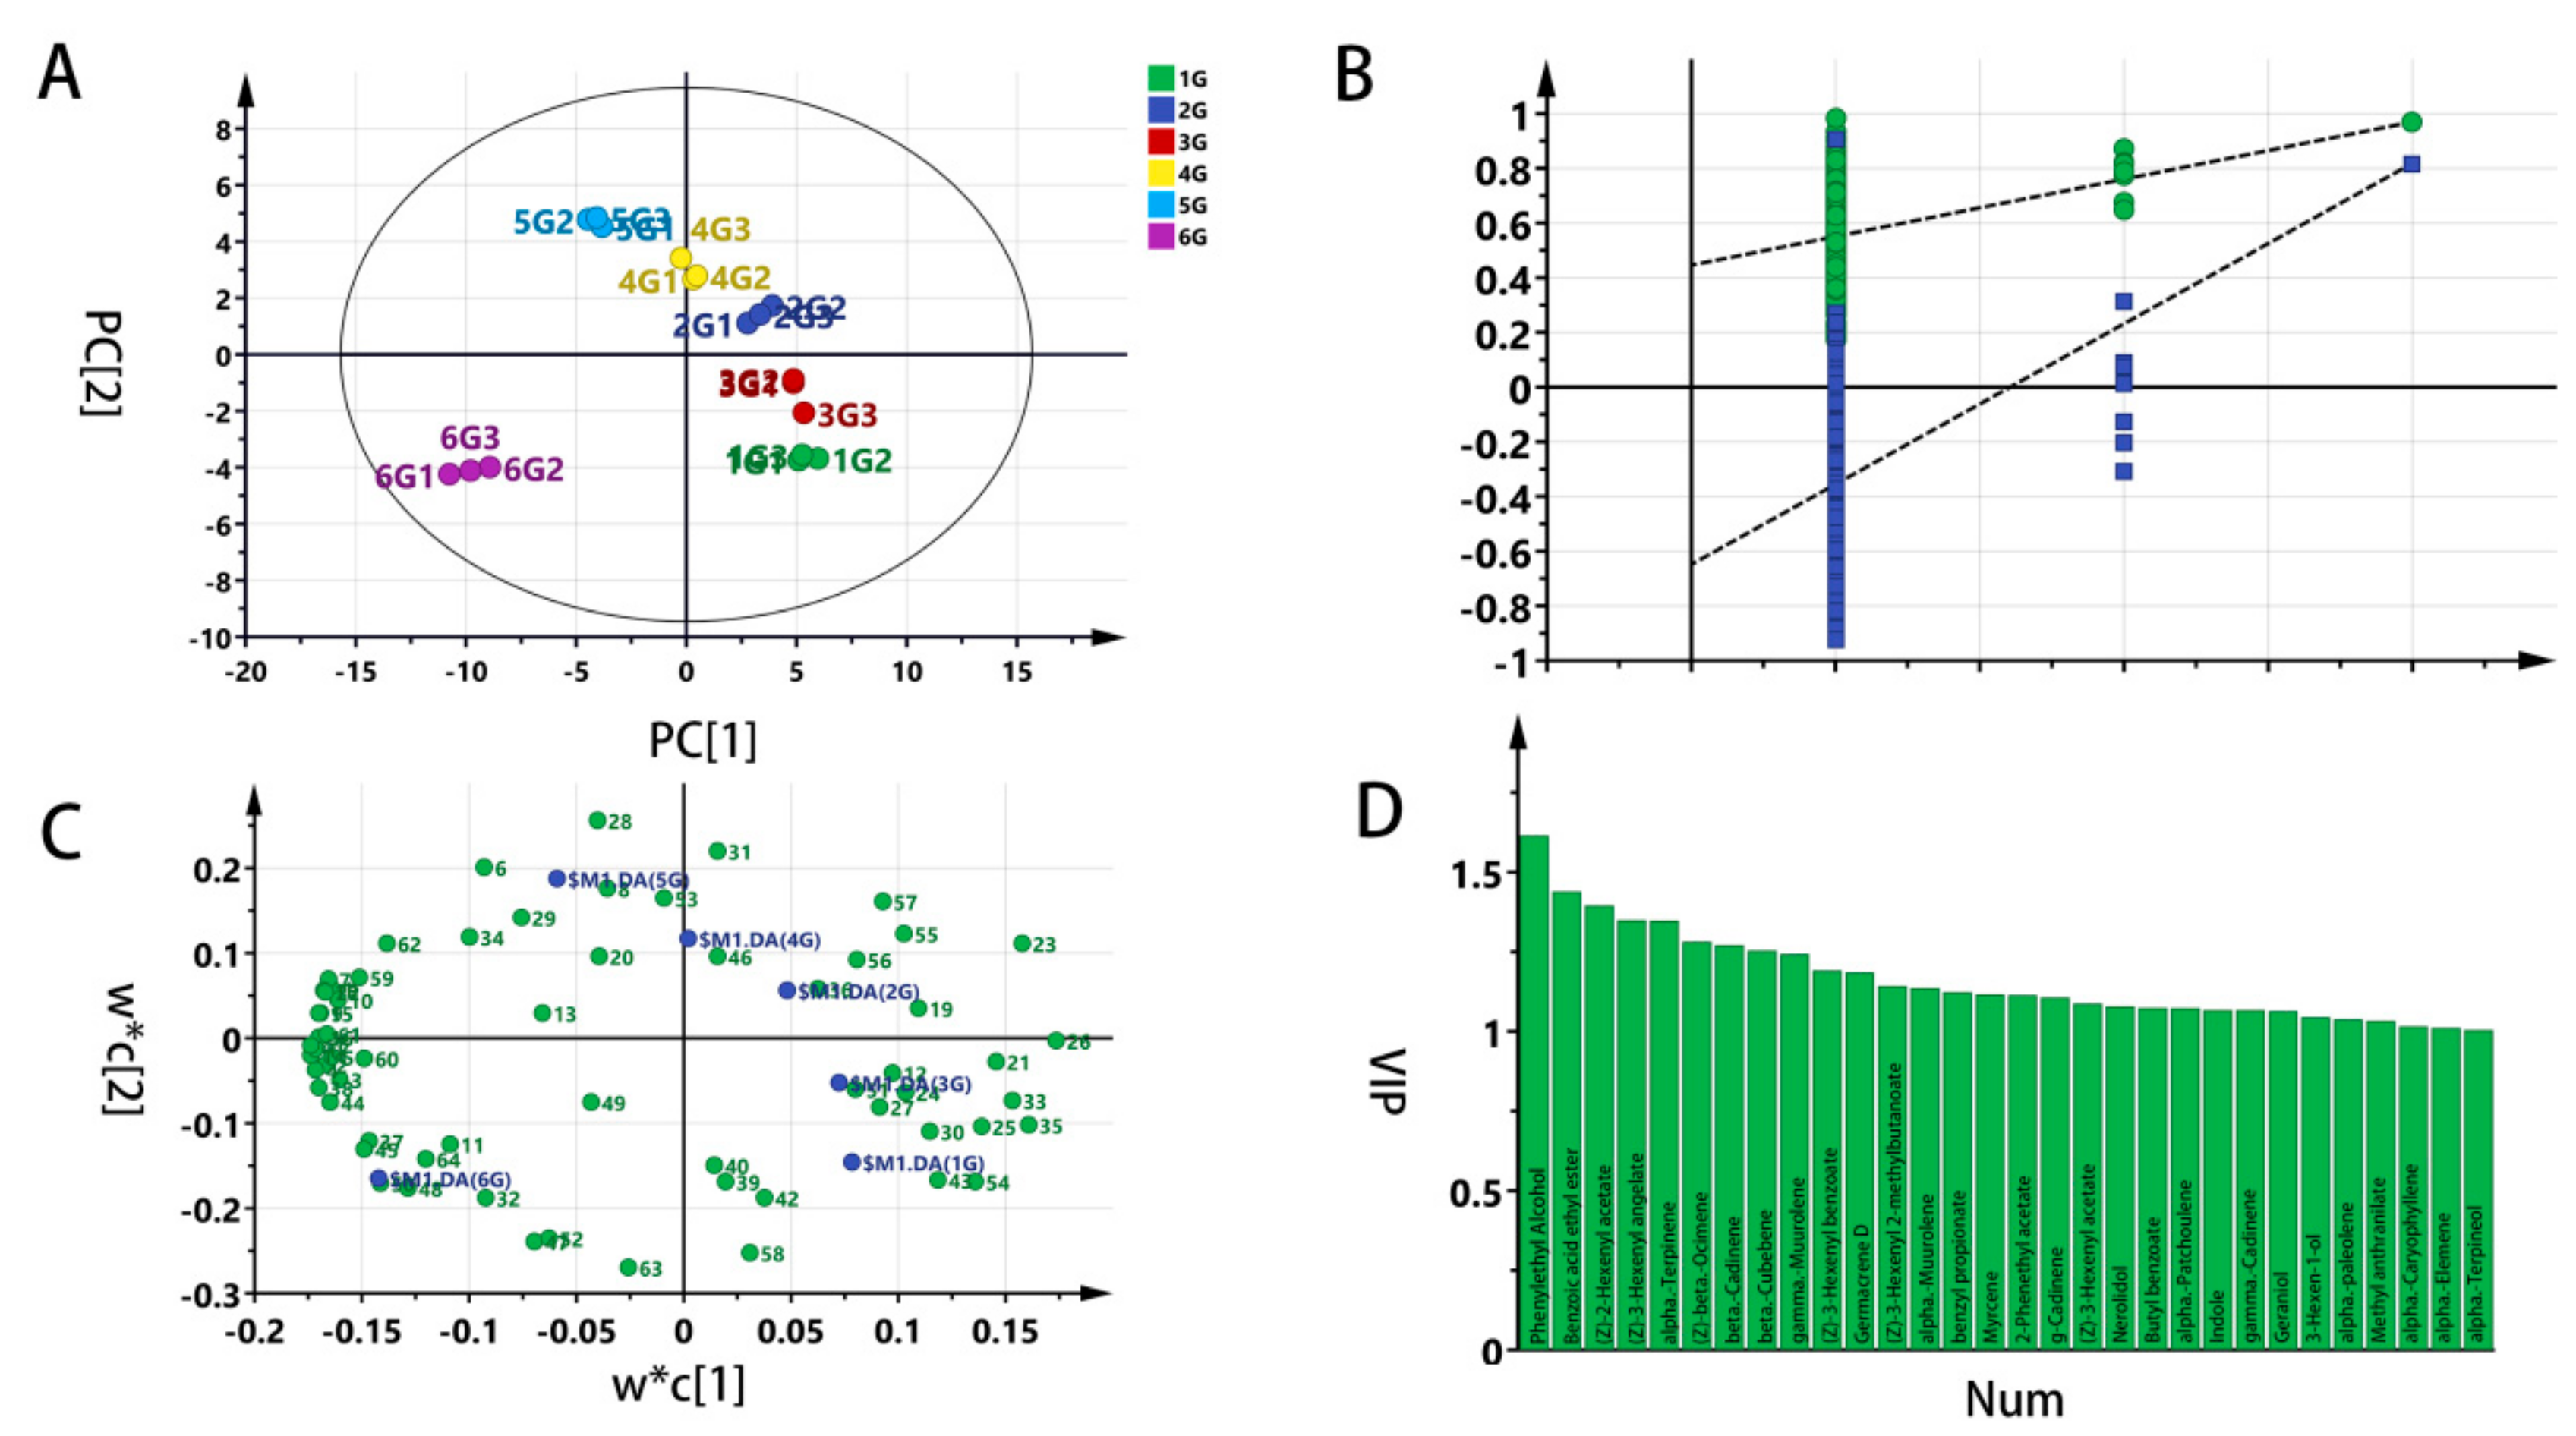
3.2.2. Partial Least Square- Discriminant Analysis (PLS-DA)

A supervised PLS-DA was approached to investigate the differences among standard grade samples. Shown in Figure 2A, the scores of the principal component (PC) 1 (abscissa) and PC2 (ordinate) were new variables summarizing variables. The scores were orthogonal, which were completely independent of each other. The score of PC1 explains the largest variation of the X space, followed, by PC2. Hence, the scatter plot of PC1 versus PC2 was a window displaying how the X observations were situated concerning each other. Significant discrimination, according to the data matrix of the volatile compounds in the six grades, was observed. Two groups of tea samples with a higher grade (1G and 2G) were distributed in the fourth quadrant, three groups of tea samples with a lower grade (3G, 4G, 5G) were distributed in the first quadrant and the second quadrant, while the lowest group of tea samples (6G) were distributed in the third quadrant alone. The high grade explained the variance (R2Y = 0.966) and cross-validated predictive capability (Q2 = 0.979), manifesting the model’s feasibility.
Figure 2B reveals the result of cross-validation. The purpose of verification is to compare the goodness of fit (R2 and Q2) of the original model with that of multiple models based on data, where the order of y-observations is random and the x-matrix is complete. The low intercepts (R2 = 0.437, Q2 = –0.661) is an indication of the validity of the original model.
The PLS-DA loading scatter plot, Figure 2C, displays the relation between the X-variables and the Y-variables. Moreover, X-variables situated in the vicinity of the dummy Y-variables have the highest discriminatory power between the classes. Striking was that the plot in Figure 2C further explains the six grades of jasmine tea samples for differences in specific volatile components. Shown in Figure 2D, a total of thirty compounds were found with the VIP value over 1.0. The entire VIP values are ranked in Table S3.

3.3. Response of Electronic Nose (E-Nose) Sensors to Volatile Organic Compounds (VOC) on Different Grades of Jasmine Tea

The signals of ten sensors in response to VOC are presented in Figure 3. The Figure shows the signal response of S1 and S2 was far stronger than the rest of the sensors (S3–S10). Indicated by analysis of variance (ANOVA), except for S3, there were significant differences existing between the different grade samples. Looking at trends of correlation, it was found that the response signals of S1, S2, S6, and S10 were negatively correlated with the sample grade, while the signals of S4, S5, S7, S8, and S9 were positively correlated with the grade, which suggests that S1, S2, S6, and S10 could respond to a grade-negative VOC, while, S4, S5, S7, S8, and S9 could respond to a grade-positive VOC.

3.4. Multivariate Statistical Analysis of Electronic Nose (E-Nose) Sensor Response Signals

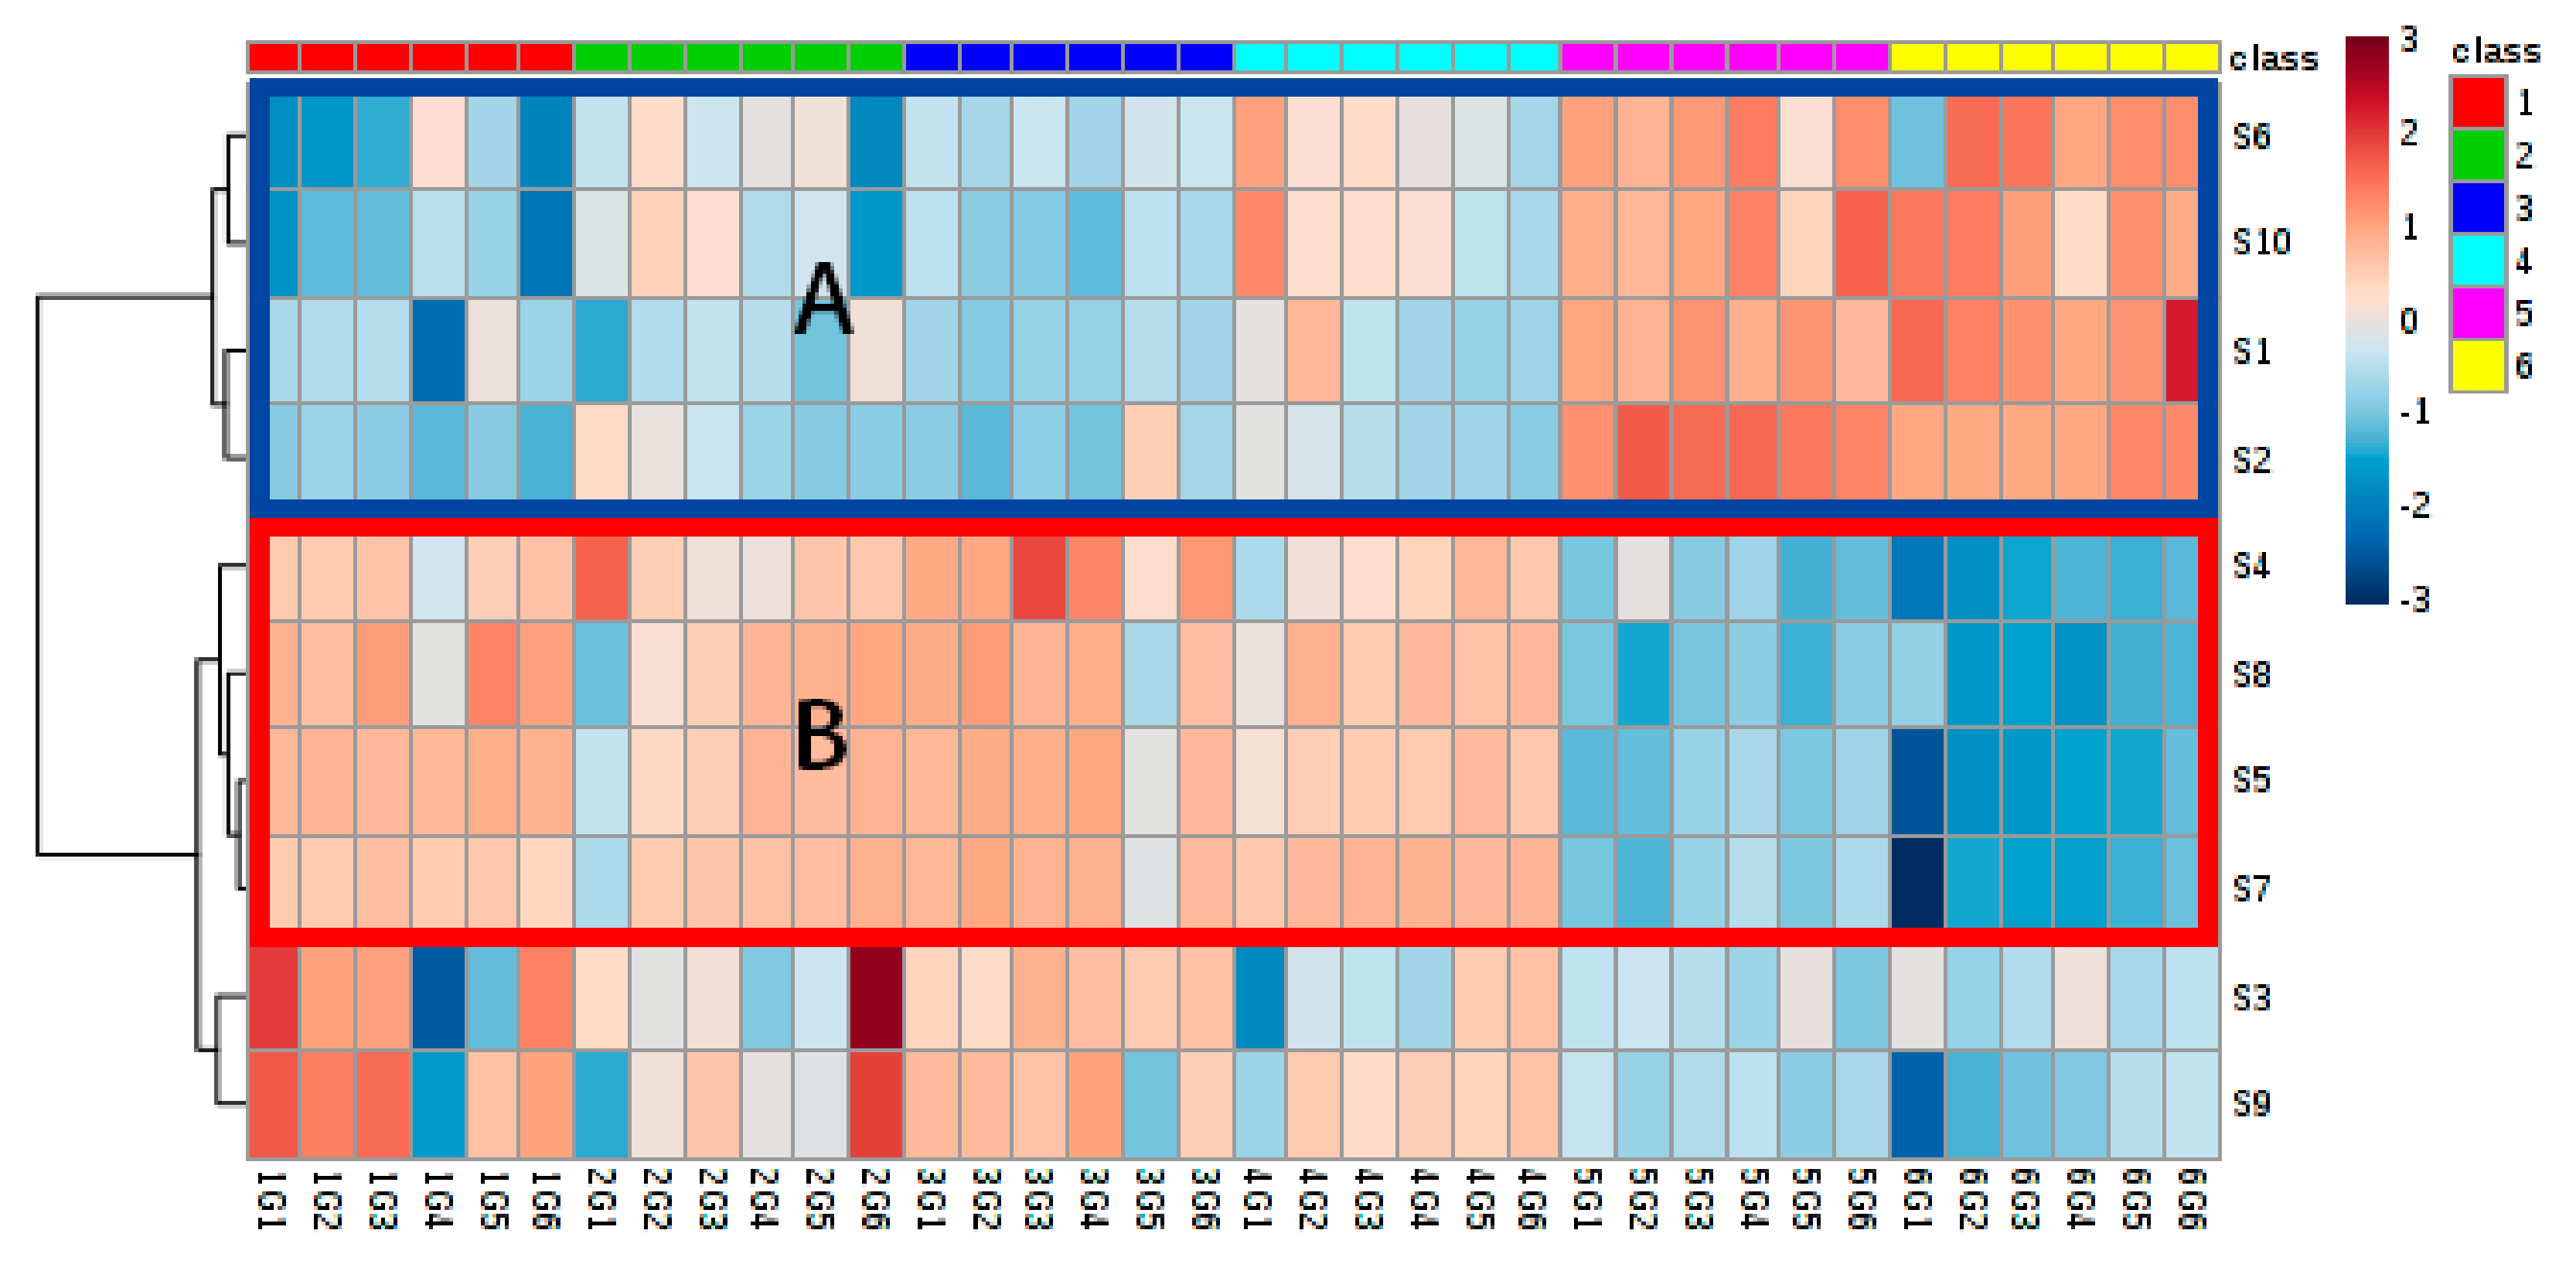
3.4.1. Hierarchical Clustering Analysis

According to different correlation trends between the jasmine tea grades and the response signal intensity, all ten sensors can be subdivided into three categories, which were a negative correlation, positive correlation, and irrelevance.
Shown in the Frame A (Figure 4), for S1 (sensitive to Ammonia and Amines), S2 (Hydrogen sulfide and sulfides), S6 (Methane, ethane and hydrocarbons), and S10 (Alkanes and flammable gases), there was an apparent negative correlation between their signal intensity to the jasmine tea grade. The higher the response value was, in other words, the lower it was in its grade. The types of volatile organic compounds (VOC) they were sensitive to coincided with components negatively related to the jasmine tea quality.
The second type, as indicated in Frame B (Figure 4), includes S4 (Alcohol and Organic Solvents), S5 (Volatile gases in food cooking), S7 (Flammable gases) and S8 (Volatile Organic Compounds) as their signal response intensity was positively correlated with the tea grading, which meant they reflected the content of volatiles positively related to the jasmine tea grade, so we could name them as positive VOC recognition sensors.
The rest of the sensors, S3 (hydrogen) and S9 (Hydroxide, gasoline, and kerosene), were irrelevant sensors for evaluating jasmine tea aroma, as there was no regularity in the signals appearing in response to the grade. This result was reasonable because the corresponding sensitive gas does not exist in jasmine tea at all. Therefore, both S3 and S9 should be ignored to reduce data noise.

3.4.2. Principal Component Analysis (PCA)

After removing signals from both the S3 and S9 sensors, the electronic nose (E-nose) data was subjected to PCA analysis, through which we could obtain an overview of sample similarity. Shown in Figure 5, PC1 and PC2 explain 59.9% and 33.1% of the total variance, respectively. It was intriguing to find that the 1G, 2G, 3G, and 4G samples were not distinguished completely, whereas there was a clear separation of 5G and 6G samples from the other grade samples.
After comparing the difference in sensory evaluation criteria of these grade samples, we found that it was reasonable. Rather than a significant difference in the aroma intensity [6] (Table S1), the main difference for samples in area I (1G, 2G, 3G, and 4G) were certain specific characteristics, such as the freshness and durability of the aroma. Therefore, it indicates that areas I (1G, 2G, 3G, and 4G), II (5G), and III (6G) were mainly reflecting aroma concentration. It also suggests that the E-nose could be good at recognizing aroma concentration but may not good at identifying specific unique aroma characteristics of high-grade jasmine tea. The following two reasons may attribute to this conclusion. First, the strength of volatile components that have a pivotal contribution to freshness and persistence was deficient and could not respond well to these sensors. Second, the formation of freshness and durability were not determined by some specific volatile substances, but by the combination of some elements within a particular range of proportion.

4. Conclusions

A group of authoritative jasmine tea grade samples, which were prepared following Chinese National Standard requirements, were subjected to research. Both Automatic thermal desorption-gas-chromatography-mass spectrometry (ATD-GC-MS) and electronic nose (E-nose) were applied for discrimination and were compared systematically.
Consequently, a total of sixty-three volatile compounds were tentatively identified by ATD-GC-MS. Through both partial least square-discriminant analysis (PLS-DA) and hierarchical cluster analysis (HCA), a satisfactory discriminant result was achieved. Twelve of these compounds, including four alcohols, five aldehydes, two hydrocarbons, and one ketone, were found to be negatively correlated to the jasmine tea grade. It is worth noting that most of the main aroma components of jasmine tea, such as linalool, (Z)-3-Hexenyl benzoate, methyl salicylate, (Z)-3-Hexenyl acetate, α-Farnesene and indole, have no linear relationship between their contents to the tea grade, but are obviously abundant in the high grade.
Regarding the electronic nose, the signal intensities of S1 (sensitive to Ammonia and Amines), S2 (Hydrogen sulfide and sulfides), S6 (Methane, ethane and hydrocarbons), and S10 (Alkanes and flammable gases) were negatively correlated to the tea grades. While, S4 (Alcohol and Organic Solvents), S5 (Volatile gases in food cooking), S7 (Flammable gases) and S8 (Volatile Organic Compounds), were positively correlated to the tea grades. It was interesting to find that the E-nose was better at detecting aroma concentrations rather than recognizing unique aroma characteristics.

Supplementary Materials

The following are available online at https://www.mdpi.com/1420-3049/25/2/380/s1; Figure S1: The processing steps of standard Chinese jasmine tea grade samplestitle, Figure S2: Total ion chromatogram diagram of VOCs with different grades jasmine tea, Table S1: Description of aroma characteristic in each standard jasmine tea sample, Table S2: Gas sensors array and corresponding volatile components, Table S3: VIP score of identified VOCs, Table S4. VOCs of grade jasmine tea.

Author Contributions

N.Y. and F.Z. conceived and designed the experiments. S.W. performed the experiments, data analysis, and wrote the manuscript. F.Z. performed data mining and modified the manuscript. W.W. established ATD-GC-MS analysis methods. P.W. directed the use of the E-nose instrument and provided valuable advice for writing. All authors have read and agreed to the published version of the manuscript

Funding

This work was supported by the Science and technology project of Science and Technology Planning Project of Fuzhou (2019-N-15; 2017-N-30) and Scientific and technological innovation project of Fujian Agriculture and Forestry University (CXZX2017181).

Acknowledgments

Thanks to Qi Zhou, the manager of Fujian Tea Import & Export Company Limited, for providing authoritative jasmine tea grade samples. Thank Yuting Shi in Hengzheng Testing Technology Co., Ltd. for her generous technical support in TD-GC-MS analysis. All authors have read and agreed to the published version of the manuscript.

Conflicts of Interest

The authors declare no competing financial interest.

References

  1. Ayaz, M.; Sadiq, A.; Junaid, M.; Ullah, F.; Subhan, F.; Ahmed, J. Neuroprotective and anti-aging potentials of essential oils from aromatic and medicinal plants. Front. Aging Neurosci. 2017, 9, 1–16. [Google Scholar] [CrossRef] [PubMed] [Green Version]
  2. Xing, L.; Zhang, H.; Qi, R.; Tsao, R.; Mine, Y. Recent Advances in the Understanding of the Health Benefits and Molecular Mechanisms Associated with Green Tea Polyphenols. J. Agric. Food Chem. 2019, 67, 1029–1043. [Google Scholar] [CrossRef] [PubMed]
  3. Chen, M.; Zhu, Y.; Liu, B.; Chen, Z.; Zheng, J.; Guan, M.; Shi, H.; Wang, Y.; Yang, W. Changes in the volatiles, chemical components, and antioxidant activities of Chinese jasmine tea during the scenting processes. Int. J. Food Prop. 2017, 20, 681–693. [Google Scholar] [CrossRef]
  4. Li, H.; Luo, L.; Ma, M.; Zeng, L. Characterization of Volatile Compounds and Sensory Analysis of Jasmine Scented Black Tea Produced by Different Scenting Processes. J. Food Sci. 2018, 83, 2718–2732. [Google Scholar] [CrossRef] [PubMed]
  5. CSBTS (State Bureau of Technical Supervision). GB/T 34779-2017. Technique specification for processing of jasmine tea. 2017. [Google Scholar]
  6. CSBTS (State Bureau of Technical Supervision). GB/T 22292-2017. Jasmine tea. 2017. [Google Scholar]
  7. Yingbin, Z.; Xu, L.I.U.; Chengyin, L.U. Study on Primitive Morpheme in Sensory Terminology and Flavor Wheel Construction of Chinese Tea. J. Tea Sci. 2019, 39, 474–483. [Google Scholar]
  8. Shen, J.X.; Rana, M.M.; Liu, G.F.; Ling, T.J.; Gruber, M.Y.; Wei, S. Differential contribution of jasmine floral volatiles to the aroma of scented green tea. J. Food Qual. 2017, 2017, 1–10. [Google Scholar] [CrossRef] [Green Version]
  9. Lin, J.; Chen, Y.; Zhang, P.; Ren, M.; Xu, H.; Wang, X. A novel quality evaluation index and strategies to identify scenting quality of jasmine tea based on headspace volatiles analysis. Food Sci. Biotechnol. 2013, 22, 331–340. [Google Scholar] [CrossRef]
  10. Liang, Y.; Wu, Y.; Lu, J.; Zhang, L. Application of chemical composition and infusion colour difference analysis to quality estimation of jasmine-scented tea. Int. J. Food Sci. Technol. 2007, 42, 459–468. [Google Scholar] [CrossRef]
  11. Shi, H.; Zhang, M.; Adhikari, B. Advances of electronic nose and its application in fresh foods: A review. Crit. Rev. Food Sci. Nutr. 2018, 58, 2700–2710. [Google Scholar] [CrossRef]
  12. Wilson, A.D. Application of electronic-nose technologies and VOC-biomarkers for the noninvasive early diagnosis of gastrointestinal diseases. Sensors 2018, 18, 2613. [Google Scholar] [CrossRef] [Green Version]
  13. Capelli, L.; Sironi, S.; Del Rosso, R. Electronic noses for environmental monitoring applications. Sensors 2014, 14, 19979–20007. [Google Scholar] [CrossRef] [PubMed]
  14. Yu, H.; Wang, Y.; Wang, J. Identification of tea storage times by linear discrimination analysis and back-propagation neural network techniques based on the eigenvalues of principal components analysis of E-nose sensor signals. Sensors 2009, 9, 8073–8082. [Google Scholar] [CrossRef] [PubMed] [Green Version]
  15. Fujioka, K.; Tomizawa, Y.; Shimizu, N.; Ikeda, K.; Manome, Y. Improving the performance of an electronic nose by wine aroma training to distinguish between drip coffee and canned coffee. Sensors 2015, 15, 1354–1364. [Google Scholar] [CrossRef] [PubMed] [Green Version]
  16. Guo, L.; Lv, H.-P.; Zhu, Y.; Peng, Q.-H.; Zhang, Y.; Shao, C.-Y.; Yu, F.-L.; Lin, Z.; Tan, J.-F.; Dai, W.-D. Separation of aroma components in Xihu Longjing tea using simultaneous distillation extraction with comprehensive two-dimensional gas chromatography-time-of-flight mass spectrometry. Sep. Purif. Technol. 2016, 164, 146–154. [Google Scholar]
  17. Yang, T.; Zhu, Y.; Shao, C.Y.; Zhang, Y.; Shi, J.; Lv, H.P.; Lin, Z. Enantiomeric analysis of linalool in teas using headspace solid-phase microextraction with chiral gas chromatography. Ind. Crops Prod. 2016, 83, 17–23. [Google Scholar] [CrossRef]
  18. Sun, H.; Jiang, H.; Chen, D.; Zhao, H.; Yan, F.; Li, X.; Chen, C.; Xu, Z.; Zhang, C.; Chen, X. Aroma characterization of Hanzhong black tea (Camellia sinensis) using solid phase extraction coupled with gas chromatography–mass spectrometry and olfactometry and sensory analysis. Food Chem. 2018, 274, 130–136. [Google Scholar]
  19. Kellogg, J.J.; Wallace, E.D.; Graf, T.N.H.; Oberlies, N.; B.Cech, N. Conventional and Accelerated-Solvent Extractions of Green Tea (Camellia sinensis) for Metabolomics-based Chemometrics. J. Pharm Biomed. Anal. 2017, 145, 604–610. [Google Scholar] [CrossRef] [Green Version]
  20. Gallego, E.; Folch, J.; Teixidor, P.; Roca, F.J.; Perales, J.F. Outdoor air monitoring: Performance evaluation of a gas sensor to assess episodic nuisance/odorous events using active multi-sorbent bed tube sampling coupled to TD-GC/MS analysis. Sci. Total Environ. 2019, 694, 133752. [Google Scholar] [CrossRef]
  21. Clément, M.; Arzel, S.; Le Bot, B.; Seux, R.; Millet, M. Adsorption/thermal desorption-GC/MS for the analysis of pesticides in the atmosphere. Chemosphere 2000, 40, 49–56. [Google Scholar] [CrossRef]
  22. Gallego, E.; Roca, F.J.; Perales, J.F.; Guardino, X.; Berenguer, M.J. VOCs and PAHs emissions from creosote-treated wood in a field storage area. Sci. Total Environ. 2008, 402, 130–138. [Google Scholar] [CrossRef]
  23. Ochiai, N.; Sasamoto, K.; Tsunokawa, J.; Hoffmann, A.; Okanoya, K.; MacNamara, K. Extension of a dynamic headspace multi-volatile method to milliliter injection volumes with full sample evaporation: Application to green tea. J. Chromatogr. A. 2015, 1421, 103–113. [Google Scholar] [CrossRef] [PubMed]
  24. Zheng, Y.; Wang, P.; Chen, X.; Sun, Y.; Yue, C. Transcriptome and Metabolite Profiling Reveal Novel Insights into Volatile Heterosis in the Tea Plant (Camellia Sinensis). Molecules 2019, 24, 3380. [Google Scholar] [CrossRef] [PubMed] [Green Version]
  25. MEP (Ministry of Environmental Protection). HJ 644-2013. Ambient air-Determination of volatile organic compounds. 2013. [Google Scholar]
  26. Wang, C.; Zhang, C.; Kong, Y.; Peng, X.; Li, C.; Liu, S.; Du, L.; Xiao, D.; Xu, Y. A comparative study of volatile components in Dianhong teas from fresh leaves of four tea cultivars by using chromatography-mass spectrometry, multivariate data analysis, and descriptive sensory analysis. Food Res. Int. 2017, 100, 267–275. [Google Scholar] [CrossRef] [PubMed]
  27. Zhou, H.; Hou, Z.; Wang, D.; Ning, J.; Wei, S. Large scale preparation, stress analysis, and storage of headspace volatile condensates from Jasminum sambac fl owers. Food Chem. 2019, 286, 170–178. [Google Scholar] [CrossRef]
  28. Edris, A.E.; Chizzola, R.; Franz, C. Isolation and characterization of the volatile aroma compounds from the concrete headspace and the absolute of Jasminum sambac (L.) Ait. (Oleaceae) flowers grown in Egypt. Eur. Food Res. Technol. 2008, 226, 621–626. [Google Scholar] [CrossRef]
  29. Jiang, X.; Guo, Y.; Lai, L.; Liao, Z.; Qu, Y.; Diao, X. Application of electronic nose technology in aroma discrimination of special-typed jasmine tea. J. Food Saf. Qual. 2017, 8, 1–6. [Google Scholar]
  30. Yu, Y.; Lyu, S.; Chen, D.; Lin, Y.; Chen, J.; Chen, G.; Ye, N. Volatiles emitted at different flowering stages of Jasminum sambac & expression of genes related to α-farnesene biosynthesis. Molecules 2017, 22, 546. [Google Scholar]
  31. Zhu, Y.; Lv, H.P.; Shao, C.Y.; Kang, S.; Zhang, Y.; Guo, L.; Dai, W.D.; Tan, J.F.; Peng, Q.H.; Lin, Z. Identification of key odorants responsible for chestnut-like aroma quality of green teas. Food Res. Int. 2018, 108, 74–82. [Google Scholar] [CrossRef]
  32. Alasalvar, C.; Topal, B.; Serpen, A.; Bahar, B.; Pelvan, E.; Gökmen, V. Flavor characteristics of seven grades of black tea produced in Turkey. J. Agric. Food Chem. 2012, 60, 6323–6332. [Google Scholar] [CrossRef]
  33. Qi, D.; Miao, A.; Cao, J.; Wang, W.; Chen, W.; Pang, S.; He, X.; Ma, C. Study on the effects of rapid aging technology on the aroma quality of white tea using GC–MS combined with chemometrics: In comparison with natural aged and fresh white tea. Food Chem. 2018, 265, 189–199. [Google Scholar] [CrossRef]
  34. Baba, R.; Amano, Y.; Wada, Y.; Kumazawa, K. Characterization of the Potent Odorants Contributing to the Characteristic Aroma of Matcha by Gas Chromatography-Olfactometry Techniques. J. Agric. Food Chem. 2017, 65, 2984–2989. [Google Scholar] [CrossRef] [PubMed]
  35. Long, L.; Song, S.; Cao, X. Discriminant analysis and similarity evaluation of gas chromatography-mass spectrometry fingerprints of aroma components in green tea grading. Chinese J. Chromatogr. 2019, 37, 325–330. [Google Scholar] [CrossRef] [PubMed]
  36. Joshi, R.; Gulati, A. Fractionation and identification of minor and aroma-active constituents in Kangra orthodox black tea. Food Chem. 2015, 167, 290–298. [Google Scholar] [CrossRef] [PubMed]
  37. Du, L.; Li, J.; Li, W.; Li, Y.; Li, T.; Xiao, D. Characterization of volatile compounds of pu-erh tea using solid-phase microextraction and simultaneous distillation-extraction coupled with gas chromatography-mass spectrometry. Food Res. Int. 2014, 57, 61–70. [Google Scholar] [CrossRef]
  38. Hu, C.J.; Li, D.; Ma, Y.X.; Zhang, W.; Lin, C.; Zheng, X.Q.; Liang, Y.R.; Lu, J.L. Formation mechanism of the oolong tea characteristic aroma during bruising and withering treatment. Food Chem. 2018, 269, 202–211. [Google Scholar] [CrossRef]
  39. Wang, W.; Jin, S.; Guo, Y. Exploration of a Method of Distinguishing Different Nongxiang Tieguanyin Tea Grades Based on Aroma Determined by GC-MS Combined with Chemometrics. Molecules 2019, 24, 1707. [Google Scholar] [CrossRef] [Green Version]
  40. Yang, Y.; Zhang, M.; Yin, H.; Deng, Y.; Jiang, Y.; Yuan, H.; Dong, C.; Li, J.; Hua, J.; Wang, J. Rapid profiling of volatile compounds in green teas using Micro-Chamber/Thermal Extractor combined with thermal desorption coupled to gas chromatography-mass spectrometry followed by multivariate statistical analysis. Lwt 2018, 96, 42–50. [Google Scholar] [CrossRef]
  41. Lv, S.; Wu, Y.; Wei, J.; Lian, M.; Wang, C.; Gao, X.; Meng, Q. Application of gas chromatography-mass spectrometry and chemometrics methods for assessing volatile profiles of Pu-erh tea with different processing methods and ageing years. RSC Adv. 2015, 5, 87806–87817. [Google Scholar] [CrossRef]
  42. Jumtee, K.; Komura, H.; Bamba, T.; Fukusaki, E. Predication of Japanese green tea (Sen-cha) ranking by volatile profiling using gas chromatography mass spectrometry and multivariate analysis. J. Biosci. Bioeng. 2011, 112, 252–255. [Google Scholar] [CrossRef]
Sample Availability: Samples of all compounds are not available from the authors. Because the experiment was done in February 2019, the samples have been deteriorated.
Figure 1. Heatmap of volatile compounds in six grades of jasmine tea. (Note: 1G1, 1G2, and 1G3 represent three repeats of the first-grade jasmine tea; so to the followings grade samples).
Molecules 25 00380 g001
Figure 2. Partial least square-discriminant analysis (PLS-DA) of jasmine tea samples with soft independent modelling by class analogy (SIMCA). (A) PLS-DA scores scatter plot with pareto scaling mode (R2Y = 0.966 and Q2 = 0.979); (B) The result of the cross-validation model with 200 times of calculations using a permutation test (R2 = 0.437, Q2 = –0.661); (C) PLS-DA loading scatter plot (R2X[1] = 0.498 R2X[2] = 0.181); (D) The variable importance for projection (VIP) plot (VIP >1).
Molecules 25 00380 g002
Figure 3. Response values of ten sensors to volatile compounds from different grades of jasmine tea samples. *Note: The bar marked with the same letter (a,b,c), within a sensor, are not significantly different between two grade samples (p > 0.05).
Molecules 25 00380 g003
Figure 4. Heatmap of stable signals of E-nose sensors for six grades of jasmine tea (*Note: S1–S10 represent the ten sensors of the E-nose; 1G1, 1G2, 1G3, 1G4, 1G5, and 1G6 represent the six repeats of grade 1 jasmine tea, as do the following grade samples; The blue frame (A) indicates sensors with a negative correlation to the grade; The red frame (B) indicates sensors with a positive correlation to the grade).
Molecules 25 00380 g004
Figure 5. Principal component analysis (PCA) of jasmine tea samples. (A) PCA scores scatter plot with Pareto scaling mode (R2X [1] = 0.599 and R2X [2] = 0.331); (B) Biplot of ten sensors and standard jasmine tea samples with Pareto scaling mode.
Molecules 25 00380 g005
Table 1. The identification of Volatile Organic Compounds (VOC) in grade jasmine tea.
No.CompoundCAS gRT gRI gMS FragmentsMS g
1Cyclopentanol96-41-35.00478857444183
21-Hexanol111-27-37.89386056434185
3Benzyl alcohol100-51-613.43010367910810795
4(Z)-Linalool oxide5989-33-314.665107259944393
5(E)-Linalool oxide 34,995-77-215.205108859944397
63-Hexen-1-ol928-96-17.432 86867413995
7Linalool78-70-615.775110471935593
8Phenylethyl Alcohol60-12-816.050111791926595
9(-)-Terpinen-4-ol20,126-76-518.2651137711114387
10α-Terpineol98-55-518.6911143599312188
11Geraniol106-24-120.455122869414890
12 Nerolidol7212-44-427.715156441694384
13α-Cadinol481-34-528.5261580951214390
14Hexanal66-25-15.78080644564196
15Benzaldehyde 100-52-710.9159827710610596
16(E,E)-2,4-Heptadienal4313-03-512.6211011811104190
17Decanal112-31-218.980120443415796
18β-Cyclocitral432-25-719.437121813715210993
19(Z)-3-Hexenyl acetate3681-7-1812.425100243678295
20(Z)-2-Hexenyl acetate 56,922-75-912.757100543678287
21Methyl benzoate 93-58-315.40510601057713698
22Acetic acid, 2-ethylhexyl
ester
103-09-317.130114943705784
23Benzyl acetate140-11-417.7501162108919093
24Benzoic acid ethyl ester93-89-017.91511711057712288
25(Z)-3-Hexenyl butyrate16,491-36-418.342118282677180
26Methyl salicylate119-36-818.63511911209215296
27(Z)-3-Hexenyl 2-methylbutanoate53,398-85-919.754122667825780
282-Phenethyl acetate103-45-720.5701249104439193
29benzyl propionate 122-63-420.6751259911085775
30ethyl salicylate118-61-621.16112701209216691
31(Z)-3-Hexenyl angelate84,060-80-023.486128282556791
32Methyl anthranilate134-20-324.34613431199215196
33Benzyl butyrate 103-37-724.49713461089117883
34Butyl benzoate136-60-725.26113591051237782
35(Z)-3-Hexenyl (Z)-3-
hexenoate
61,444-38-025.455138882676992
36(Z)-3-Hexenyl benzoate25,152-85-627.825 1565105677797
37Benzyl Benzoate120-51-429.3021733105917776
38α-Pinene7785-70-810.00594893929185
39Myrcene123-35-311.92195841936986
40α-Terpinene 99-86-512.84610161219313690
41Limonene5989-27-513.261101868936788
42(Z)-β-Ocimene13,877-91-313.845103193917993
43α-Elemene20,307-84-024.09713401219313685
44α-Cubebene17,699-14-824.645135116110511993
45α-Copaene3856-25-525.365137316111910590
46Germacrene D 23,986-74-525.53014771611059189
47γ-Cadinene39,029-41-925.600151416120410590
48β-Elemene515-13-925.626139881936880
49α-Gurjunene489-40-725.960141320416110587
50Caryophyllene87-44-526.1551494931339182
51β-Cubebene13,744-15-526.30613871611059192
52α-Caryophyllene6753-98-626.660157993804188
53γ-Muurolene3002-74-026.885143516110511988
54α-Farnesene502-6-427.205145841936993
55β-Cadinene483-76-127.365146916113411990
56α-Muurolene10,208-80-727.54514791051619489
57α-Patchoulene560-32-727.97614601359310778
58Naphthalene91-20-318.381123112812912797
592-Methylnaphthalene 91-57-622.350134514214111586
605-Hepten-2-one110-93-011.73593843416993
61Acetophenone 98-86-214.4361068105775197
62Indole120-72-922.1071340117908997
63Eugenol97-53-024.71213921641037788
g CAS: Chemical Abstracts Service; RT: Retention time; RI: Retention index; MS: Match score of mass spectra libraries.
Table 2. VOC of grade jasmine tea.
No.MIfCompoundAverage Relative Content (×10 μg/g)
1Ge2Ge3Ge4Ge5Ge6Ge
1MS,RICyclopentanol0.04 ± 0.00b0.25 ± 0.02b0.13 ± 0.03b0.59 ± 0.15ab0.89 ± 0.25a1.02 ± 0.22a
2MS,RI1-Hexanol0.04 ± 0.00b0.06 ± 0.01b0.11 ± 0.02b0.10 ± 0.03b0.09 ± 0.02b0.23 ± 0.08a
3MS,RIBenzyl alcohol5.38 ± 0.73b37.76 ± 19.39a6.69 ± 1.09b12.27 ± 4.05b4.71 ± 1.73b9.14 ± 1.41b
4MS,RI(Z)-Linalool oxide0.22 ± 0.04a0.32 ± 0.01a0.27 ± 0.05a0.36 ± 0.09a0.30 ± 0.11a0.50 ± 0.09a
5MS,S,RI(E)-Linalool oxide 0.71 ± 0.12a1.09 ± 0.05a0.89 ± 0.16a0.84 ± 0.20a0.61 ± 0.23a0.73 ± 0.12a
6MS,RI3-Hexen-1-ol2.82 ± 0.26b5.95 ± 0.72ab6.32 ± 1.43a5.15 ± 1.30ab2.92 ± 0.88b2.23 ± 0.52b
7MS,S,RILinalool15.50 ± 1.04b37.60 ± 1.03a26.65 ± 5.61ab24.19 ± 6.96ab10.76 ± 3.19b13.84 ± 2.73b
8MS,RIPhenylethyl Alcohol0.04 ± 0.02b0.80 ± 0.36a0.02 ± 0.01b0.79 ± 0.28a0.18 ± 0.12ab0.08 ± 0.02b
9MS,RI(-)-Terpinen-4-ol0.01 ± 0.00b0.05 ± 0.02a0.01 ± 0.00b0.03 ± 0.01ab0.02 ± 0.01b0.02 ± 0.00ab
10MS,RIα-Terpineol0.12 ± 0.00ab0.21 ± 0.01a0.11 ± 0.02ab0.21 ± 0.06a0.09 ± 0.03b0.11 ± 0.01ab
11MS,RIGeraniol0.27 ± 0.05ab0.45 ± 0.03a0.41 ± 0.13ab0.19 ± 0.06b0.15 ± 0.06b0.21 ± 0.05ab
12MS,RI Nerolidol0.14 ± 0.00b0.30 ± 0.01a0.12 ± 0.02b0.11 ± 0.03b0.03 ± 0.01c0.04 ± 0.01c
13MS,RIα-Cadinol0.01 ± 0.00a0.04 ± 0.02a0.01 ± 0.00a0.01 ± 0.00a0.00 ± 0.00a0.00 ± 0.00a
14MS,RIHexanal0.05 ± 0.00b0.21 ± 0.03ab0.09 ± 0.02b0.20 ± 0.07ab0.20 ± 0.05ab0.36 ± 0.07a
15MS,RIBenzaldehyde 0.25 ± 0.02b0.59 ± 0.11ab0.36 ± 0.08ab0.58 ± 0.16ab0.56 ± 0.16ab0.74 ± 0.15a
16MS,RI(E,E)-2,4-Heptadienal0.05 ± 0.00b0.09 ± 0.00b0.09 ± 0.02b0.20 ± 0.05b0.40 ± 0.12ab0.60 ± 0.12a
17MS,RIDecanal0.17 ± 0.01b0.34 ± 0.09b0.21 ± 0.07b0.34 ± 0.09b0.43 ± 0.10ab0.70 ± 0.14a
18MS,RIβ-Cyclocitral0.08 ± 0.00b0.20 ± 0.02ab0.13 ± 0.03ab0.24 ± 0.07ab0.23 ± 0.07ab0.26 ± 0.05a
19MS,RI(Z)-3-Hexenyl acetate3.07 ± 0.30a1.47 ± 0.16ab4.93 ± 1.10a2.44 ± 0.63ab1.07 ± 0.30b0.23 ± 0.05b
20MS,RI(Z)-2-Hexenyl acetate 0.03 ± 0.00b0.02 ± 0.00b0.09 ± 0.02a0.04 ± 0.01b0.03 ± 0.01b0.02 ± 0.00b
21MS,RIMethyl benzoate 11.17 ± 0.90ab8.46 ± 0.57b16.96 ± 3.46a8.02 ± 2.14b2.65 ± 0.79bc0.92 ± 0.22c
22MS,RIAcetic acid, 2-ethylhexyl ester0.03 ± 0.00b0.08 ± 0.02a0.03 ± 0.00b0.07 ± 0.02ab0.03 ± 0.01b0.04 ± 0.01ab
23MS,RIBenzyl acetate35.70 ± 2.87a57.80 ± 2.39a52.12 ± 10.66a37.08 ± 10.04a12.84 ± 3.90b4.24 ± 1.45b
24MS,RIBenzoic acid ethyl ester0.02 ± 0.00ab0.03 ± 0.00a0.02 ± 0.00ab0.01 ± 0.00ab0.01 ± 0.00b0.01 ± 0.00b
25MS,RI(Z)-3-Hexenyl butyrate0.41 ± 0.03b0.18 ± 0.05c0.63 ± 0.13a0.15 ± 0.04c0.06 ± 0.02c0.02 ± 0.00c
26MS,S,RIMethyl salicylate10.45 ± 0.72ab15.45 ± 1.13a13.25 ± 2.45a7.02 ± 1.86b2.58 ± 0.82bc1.11 ± 0.23c
27MS,RI(Z)-3-Hexenyl 2-methylbutanoate0.18 ± 0.01b0.13 ± 0.01bc0.30 ± 0.06a0.13 ± 0.03bc0.06 ± 0.02c0.05 ± 0.01c
28MS,RI2-Phenethyl acetate0.29 ± 0.02ab0.60 ± 0.01a0.43 ± 0.07ab0.60 ± 0.16a0.35 ± 0.12ab0.12 ± 0.02b
29MS,RIBenzyl propionate 0.02 ± 0.00ab0.03 ± 0.00ab0.03 ± 0.01a0.03 ± 0.01ab0.02 ± 0.01ab0.01 ± 0.00b
30MS,RIEthyl salicylate0.08 ± 0.00a0.09 ± 0.00a0.08 ± 0.01a0.04 ± 0.01b0.02 ± 0.01b0.02 ± 0.00b
31MS,RI(Z)-3-Hexenyl angelate0.21 ± 0.01b0.41 ± 0.02a0.39 ± 0.07a0.27 ± 0.07ab0.16 ± 0.05b0.08 ± 0.01b
32MS,RIMethyl anthranilate4.84 ± 0.25b15.64 ± 3.15a6.38 ± 0.94b4.76 ± 1.35b1.39 ± 0.55b3.47 ± 1.20b
33MS,RIBenzyl butyrate 0.06 ± 0.01a0.08 ± 0.00a0.08 ± 0.01a0.03 ± 0.01b0.02 ± 0.01b0.01 ± 0.00b
34MS,RIButyl benzoate0.08 ± 0.00b0.13 ± 0.00a0.09 ± 0.02ab0.09 ± 0.02ab0.05 ± 0.02b0.04 ± 0.01b
35MS,RI(Z)-3-Hexenyl (Z)-3-hexenoate0.20 ± 0.01a0.26 ± 0.00a0.25 ± 0.04a0.09 ± 0.02b0.03 ± 0.01b0.02 ± 0.01b
36MS,RI(Z)-3-Hexenyl benzoate7.09 ± 0.19bc23.58 ± 0.95a8.62 ± 1.22b9.25 ± 2.63b2.51 ± 0.87c2.47 ± 0.61c
37MS,RIBenzyl Benzoate0.02 ± 0.00b0.05 ± 0.01a0.02 ± 0.00b0.03 ± 0.01b0.01 ± 0.00b0.03 ± 0.01ab
38MS,RIα-Pinene0.05 ± 0.01a0.07 ± 0.01a0.07 ± 0.01a0.08 ± 0.03a0.06 ± 0.01a0.11 ± 0.02a
39MS,RIMyrcene0.10 ± 0.02a0.07 ± 0.01ab0.09 ± 0.02ab0.05 ± 0.01b0.03 ± 0.01b0.03 ± 0.01b
40MS,RIα-Terpinene 0.01 ± 0.00a0.01 ± 0.00ab0.01 ± 0.00a0.01 ± 0.00ab0.00 ± 0.00b0.00 ± 0.00b
41MS,RILimonene0.11 ± 0.01b0.33 ± 0.10a0.14 ± 0.03b0.17 ± 0.05ab0.11 ± 0.04b0.15 ± 0.03ab
42MS,RI(Z)-β-Ocimene0.14 ± 0.01b0.06 ± 0.01c0.27 ± 0.05a0.06 ± 0.01c0.03 ± 0.01c0.06 ± 0.01c
43MS,RIα-Elemene0.04 ± 0.00a0.01 ± 0.00c0.03 ± 0.01bN.D.fN.D.fN.D.f
44MS,RIα-Cubebene0.12 ± 0.01b0.20 ± 0.01a0.13 ± 0.03ab0.12 ± 0.03ab0.07 ± 0.02b0.12 ± 0.02b
45MS,RIα-Copaene0.32 ± 0.02ab0.40 ± 0.01a0.33 ± 0.06a0.27 ± 0.07ab0.15 ± 0.05b0.26 ± 0.05ab
46MS,RIGermacrene D 0.01 ± 0.00b0.01 ± 0.00a0.01 ± 0.00b0.01 ± 0.00b0.00 ± 0.00b0.00 ± 0.00b
47MS,RIγ-Cadinene0.18 ± 0.01a0.15 ± 0.01ab0.18 ± 0.03a0.11 ± 0.03ab0.05 ± 0.02b0.10 ± 0.02b
48MS,RIβ-Elemene0.10 ± 0.01a0.10 ± 0.00a0.10 ± 0.02a0.08 ± 0.02ab0.04 ± 0.02b0.08 ± 0.01ab
49MS,RIα-Gurjunene0.01 ± 0.00a0.02 ± 0.01a0.01 ± 0.00a0.00 ± 0.00a0.00 ± 0.00a0.01 ± 0.00a
50MS,RICaryophyllene0.13 ± 0.01a0.11 ± 0.00ab0.12 ± 0.02ab0.11 ± 0.03ab0.05 ± 0.02b0.18 ± 0.03a
51MS,RIβ-Cubebene0.31 ± 0.02ab0.41 ± 0.01a0.30 ± 0.05ab0.23 ± 0.06b0.10 ± 0.03b0.10 ± 0.02b
52MS,RIα-Caryophyllene0.37 ± 0.02ab0.51 ± 0.02a0.39 ± 0.07ab0.26 ± 0.07b0.12 ± 0.04b0.21 ± 0.03b
53MS,RIγ-Muurolene0.23 ± 0.02b0.41 ± 0.01a0.24 ± 0.05b0.22 ± 0.06b0.13 ± 0.04bc0.08 ± 0.01c
54MS,RIα-Farnesene6.56 ± 0.42bc12.54 ± 1.29a8.80 ± 1.59b4.10 ± 1.14c1.02 ± 0.14c1.62 ± 0.45c
55MS,RIβ-Cadinene1.22 ± 0.06b2.39 ± 0.02a1.21 ± 0.20b1.02 ± 0.29bc0.51 ± 0.18c0.35 ± 0.04c
56MS,RIα-Muurolene0.16 ± 0.01b0.33 ± 0.00a0.16 ± 0.03b0.15 ± 0.04bc0.08 ± 0.03c0.03 ± 0.00c
57MS,RI α-Patchoulene0.05 ± 0.00a0.06 ± 0.00a0.05 ± 0.01a0.02 ± 0.01b0.01 ± 0.00b0.02 ± 0.00b
58MS,RINaphthalene0.41 ± 0.02b1.41 ± 0.29a0.48 ± 0.07b1.15 ± 0.36ab0.44 ± 0.15b0.51 ± 0.04b
69MS,RI2-Methylnaphthalene 0.06 ± 0.00b0.15 ± 0.05a0.08 ± 0.01ab0.12 ± 0.04ab0.05 ± 0.02b0.07 ± 0.00ab
60MS,RI6-Methyl-5-hepten-2-one0.71 ± 0.05b1.61 ± 0.12ab1.62 ± 0.35a1.12 ± 0.30ab0.93 ± 0.25ab1.38 ± 0.31ab
61MS,RIAcetophenone 0.31 ± 0.01b1.48 ± 0.24a0.33 ± 0.05b1.03 ± 0.33ab0.40 ± 0.14b0.42 ± 0.04b
62MS,RIIndole7.20 ± 0.27ab14.19 ± 3.36ab1.78 ± 0.82b20.55 ± 11.49a1.45 ± 0.07b0.70 ± 0.24b
63MS,RIEugenol0.12 ± 0.00b0.25 ± 0.04a0.11 ± 0.02b0.10 ± 0.03b0.05 ± 0.02b0.06 ± 0.02b
a–d Means ± SD followed by the same letter, within a row, are not significantly different (p > 0.05); e 1G, 2G, 3G, 4G, 5G, and 6G represent the standard sample for the grade of jasmine tea from high rank to low rank; f MI, method of identification; N.D., peak intensity lower than triple signal-to-noise.

