Article

Thickness-Dependent NIR LSPR of Curved Ag/TiS2 Bilayer Film

1
School of Material and Environmental Engineering, Hangzhou Dianzi University, Hangzhou 310012, China
2
Department of Physics, Southeast University, Nanjing 211189, China
3
Key Laboratory of Functional Materials Physics and Chemistry, Ministry of Education, College of Physics, Jilin Normal University, Changchun 130103, China
*
Authors to whom correspondence should be addressed.
Molecules 2020, 25(19), 4551; https://doi.org/10.3390/molecules25194551
Submission received: 2 September 2020 / Revised: 29 September 2020 / Accepted: 30 September 2020 / Published: 5 October 2020
(This article belongs to the Section Materials Chemistry)

Abstract

:
We demonstrated that the localized surface plasmon resonance (LSPR) features of Ag/TiS2 nanostructures were dependent on the sublayer thickness. The Ag/TiS2 bilayer film was obtained by the self-assembly method and magnetron sputtering. The thickness was controlled by changing the sputtering time when the sputtering powers were the same. When the Ag thickness decreased from 50 nm to 5 nm, the LSPR was tuned from the visible region to the Near Infrared (NIR) region. When the TiS2 thickness decreased from 60 nm to 2 nm, the LSPR shifted from the IR to NIR region. Analysis showed the thickness changes of Ag and TiS2 resulted in the changed carrier density, which led to the thickness-dependent shift of the LSPR.

1. Introduction

For nanostructured noble metals, the collective resonances of the free carriers of the sufficient density leads to localized surface plasmon resonances (LSPR) [1,2,3]. LSPR had been reported in noble metals for decades, which is widely used in catalysis, information storages, biosensors and surface-enhanced Raman scattering [4,5,6,7,8]. In recent studies, the LSPR of noble metal nanoparticles was tuned by the size, shape, composition, dielectric environment, and so on [9,10,11,12]. According to the Drude model, [13] when the carrier density of noble metals is around 1022, LSPR was calculated to be in the visible region. In addition to noble metals, LSPR was also found in some doped semiconductors, in which the high-level doping increased carrier density and controlled the position of the LSPR bands. Hsu et al. [14] reported that LSPR for Cu2-xS controlled by the geometric aspect ratio increased the free carrier density. In Jacob’s work [15], ZnO nanocrystals showed an infrared (IR) LSPR via the photoexcitation of electrons. Since then, LSPR is no longer regarded as a unique property of noble metals, but optical signatures of carrier collection. In recent years, metal composites have been synthesized, which produced a lot of new characteristics. In Ag–FeS [16] and Ag/Cu2S [17] nanocomposites, which were based on the interaction between the noble and semiconductors, the electronic environment around the nanostructure changed with different thickness, and the coupling between two particles was dominant, which led to the displacement of LSPR. More and more nanostructures with LSPR properties are widely used in cancer detection, photodetection, photodegradation, and so on [18,19,20,21].
Zhu et al. [22] first observed the existence of near-IR (NIR) LSPR characteristics in semi-metallic TiS2, which proved the possible wide applications of NIR LSPR of semi-metallic TiS2. TiS2 is one of the transition metal dichalcogenides (TMD), which has good applications in energy materials [23,24,25,26,27] and biomolecule detection [28,29]. The energy band structure of TiS2 is similar to that of metals, and TiS2 has a high carrier concentration and mobility. In addition, the carrier density of bulk TiS2 is about 1021 [22]. Unlike noble metals, the carrier density of TiS2 could be realized by controlling the thickness of semi-metallic TiS2, which can appreciably tune LSPR dynamically. In our previous works [30], we prepared the curved TiS2–Ag nanostructure on a PS array, which could regulate the position of LSPR from the visible region to the NIR region as the carrier density decreased. Therefore, it was possible to widen the LSPR wavelength range of TiS2 with changed carrier density on polystyrene bead arrays. LSPR is sensitive to the thickness and morphology, so the curved Ag/TiS2 bilayer films with the different structures and compositions have various properties.
Here, we prepared curved Ag/TiS2 nanostructures on a two-dimensional polystyrene (PS) bead array by magnetron sputtering technology, in which LSPR could be regulated from the visible region or IR region to the NIR region by changing the Ag/TiS2 thickness. The PS arrays worked as curved substrates, inducing various Ag/TiS2 thicknesses, which made the LSPR bands of the Ag/TiS2 nanostructures localized in the NIR wavebands. This tunable LSPR characteristic provides curved Ag/TiS2 nanostructures with more applications in different fields, for example, biological and communication windows.

2. Experimental Section

2.1. Materials

The mono-disperse polystyrene (PS) colloid with size 200 nm and the density 1.05 g/cm3 was purchased from the Duke Scientific Corporation. NH4OH (25%) and H2O2 (30%) were purchased from Sigma-Aldrich Co. Ltd. (Beijing, China) and the Sino-Pharm Chemical Reagent Co. Ltd. (Shanghai, China). 4-Aminothiophenol (4-ATP) was purchased from Sigma-Aldrich Co. Ltd. The purity of Ag and TiS2 was 99.99%, and were purchased from Beijing Jing Mai Mstar Technology Co. Ltd., Beijing, China. The resistivity of the deionized water was 18.0 MΩ cm and the silicon wafers with the (100) crystal orientation were purchased from the Hefei Kejing Materials Technology Co. Ltd., Hefei, China.

2.2. Preparation of Polystyrene (PS) Arrays

The single-layer PS sphere arrays were prepared by the self-assembly method. The suitable size of silicon wafers was boiled in a mixed solution of H2O, NH4OH. and H2O2 (6:1:2) for 5–10 min. Then, the silicon wafers were ultrasonically washed three times with deionized water and absolute ethanol. Finally, the silicon wafers were stored in deionized water. The volume ratio 1:1 of PS solution to ethanol was dropped on a large silicon wafer using a pipetting tip. The large silicon wafers were slanted into water. Driven by the water, the PS spheres on the silicon wafer formed single layer colloidal sphere arrays on the water surface. Clean silicon wafers were used to pick up the single layer film on the water surface. The silicon wafers with PS arrays were dried under natural conditions to form a 2D ordered array on the silicon substrates.

2.3. Preparation of SERS Active Substrates

Figure 1 shows the schematic diagram of the Ag/TiS2 nanostructure on PS arrays and Si wafers. The preparation process of Ag/TiS2 films was carried out in a magnetron deposition system. First, the two-dimensional ordered arrays with a diameter of 200 nm were fabricated by the self-assembly technique. Then, the Ag films were sputtered on the PS arrays. Finally, the TiS2 film was sputtered on the Ag film that formed Ag/TiS2 curved nanostructures. The preparation method and conditions of the Ag/TiS2 flat planar nanostructures were the same as the curved nanostructure. Thus, the single Ag (5, 10, 20, 30, 50 nm) nanostructures and the single TiS2 (2, 5, 10, 20, 30, 60 nm) nanostructures on PS arrays were prepared as were Ag 10 nm/TiS2 (2, 5, 10, 20, 30, 60 nm) nanostructures and the Ag 5 nm/TiS2 (2, 5, 10, 20, 30, 60 nm) nanostructures of curved and flat planar films.

2.4. Characterization of Substrates

The Ag/TiS2 bilayer film was performed by the magnetron system (JGP-560C, Shenkeyi, Shenyang, China) with vacuum 2 × 10⁻⁴ Pa. The working pressure was 0.6 Pa. The TiS2 film thickness was 2, 5, 10, 20, 30, and 60 nm, and the growth rate was 2 nm/min. The Ag film sputter power was 21.6 W and the growth rate was 10 nm/min. The performance characterization methods used in the experiment mainly included scanning electron microscope (SEM, JEOL 7800F, Tokyo, Japan) with accelerating voltage of 200 kv. Raman spectra were measured on a Renishaw Raman confocal microscopy spectrometer (model 2000, Renishaw, London, UK), and the excitation wavelength was 633 nm. Transmission electron microscope (TEM, JEM-2100HR, JEOL LTD., Tokyo, Japan) and UV–Vis–NIR spectra with a Shimadzu UV-3600 plus spectrophotometer (Shimadzu, Kyoto, Japan) and Hall Effect were also carried out.

3. Results and Discussion

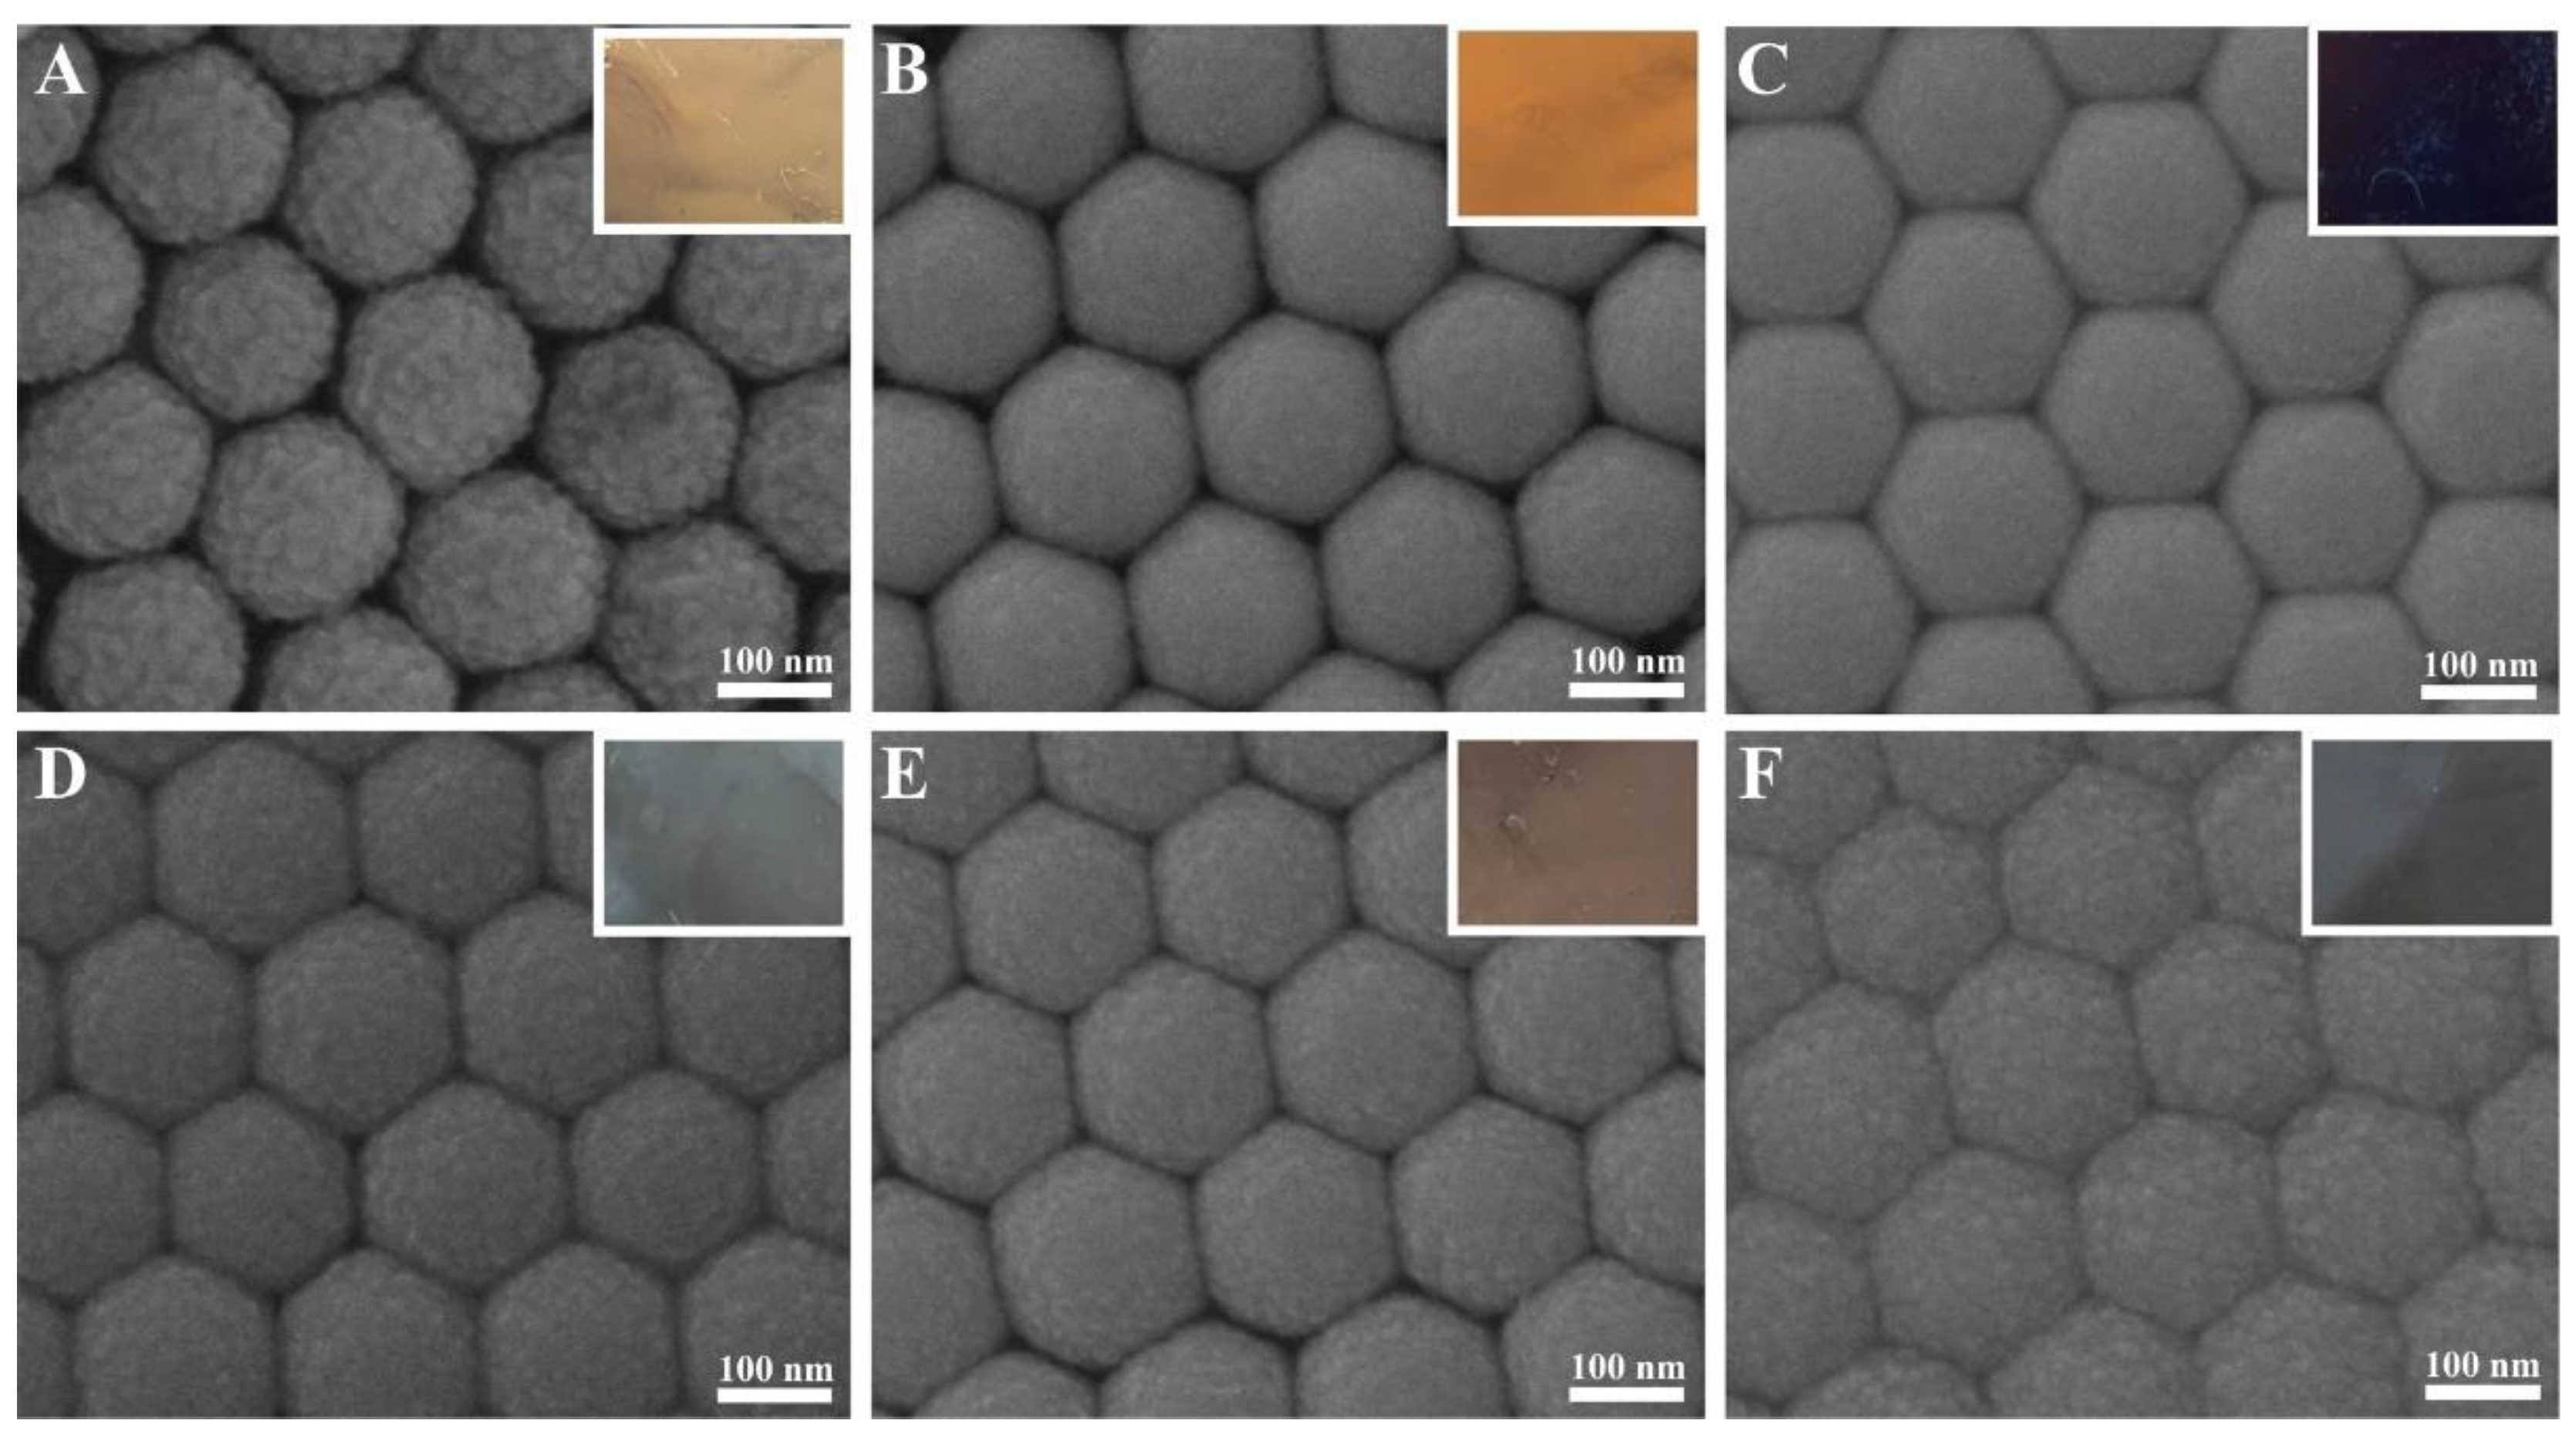
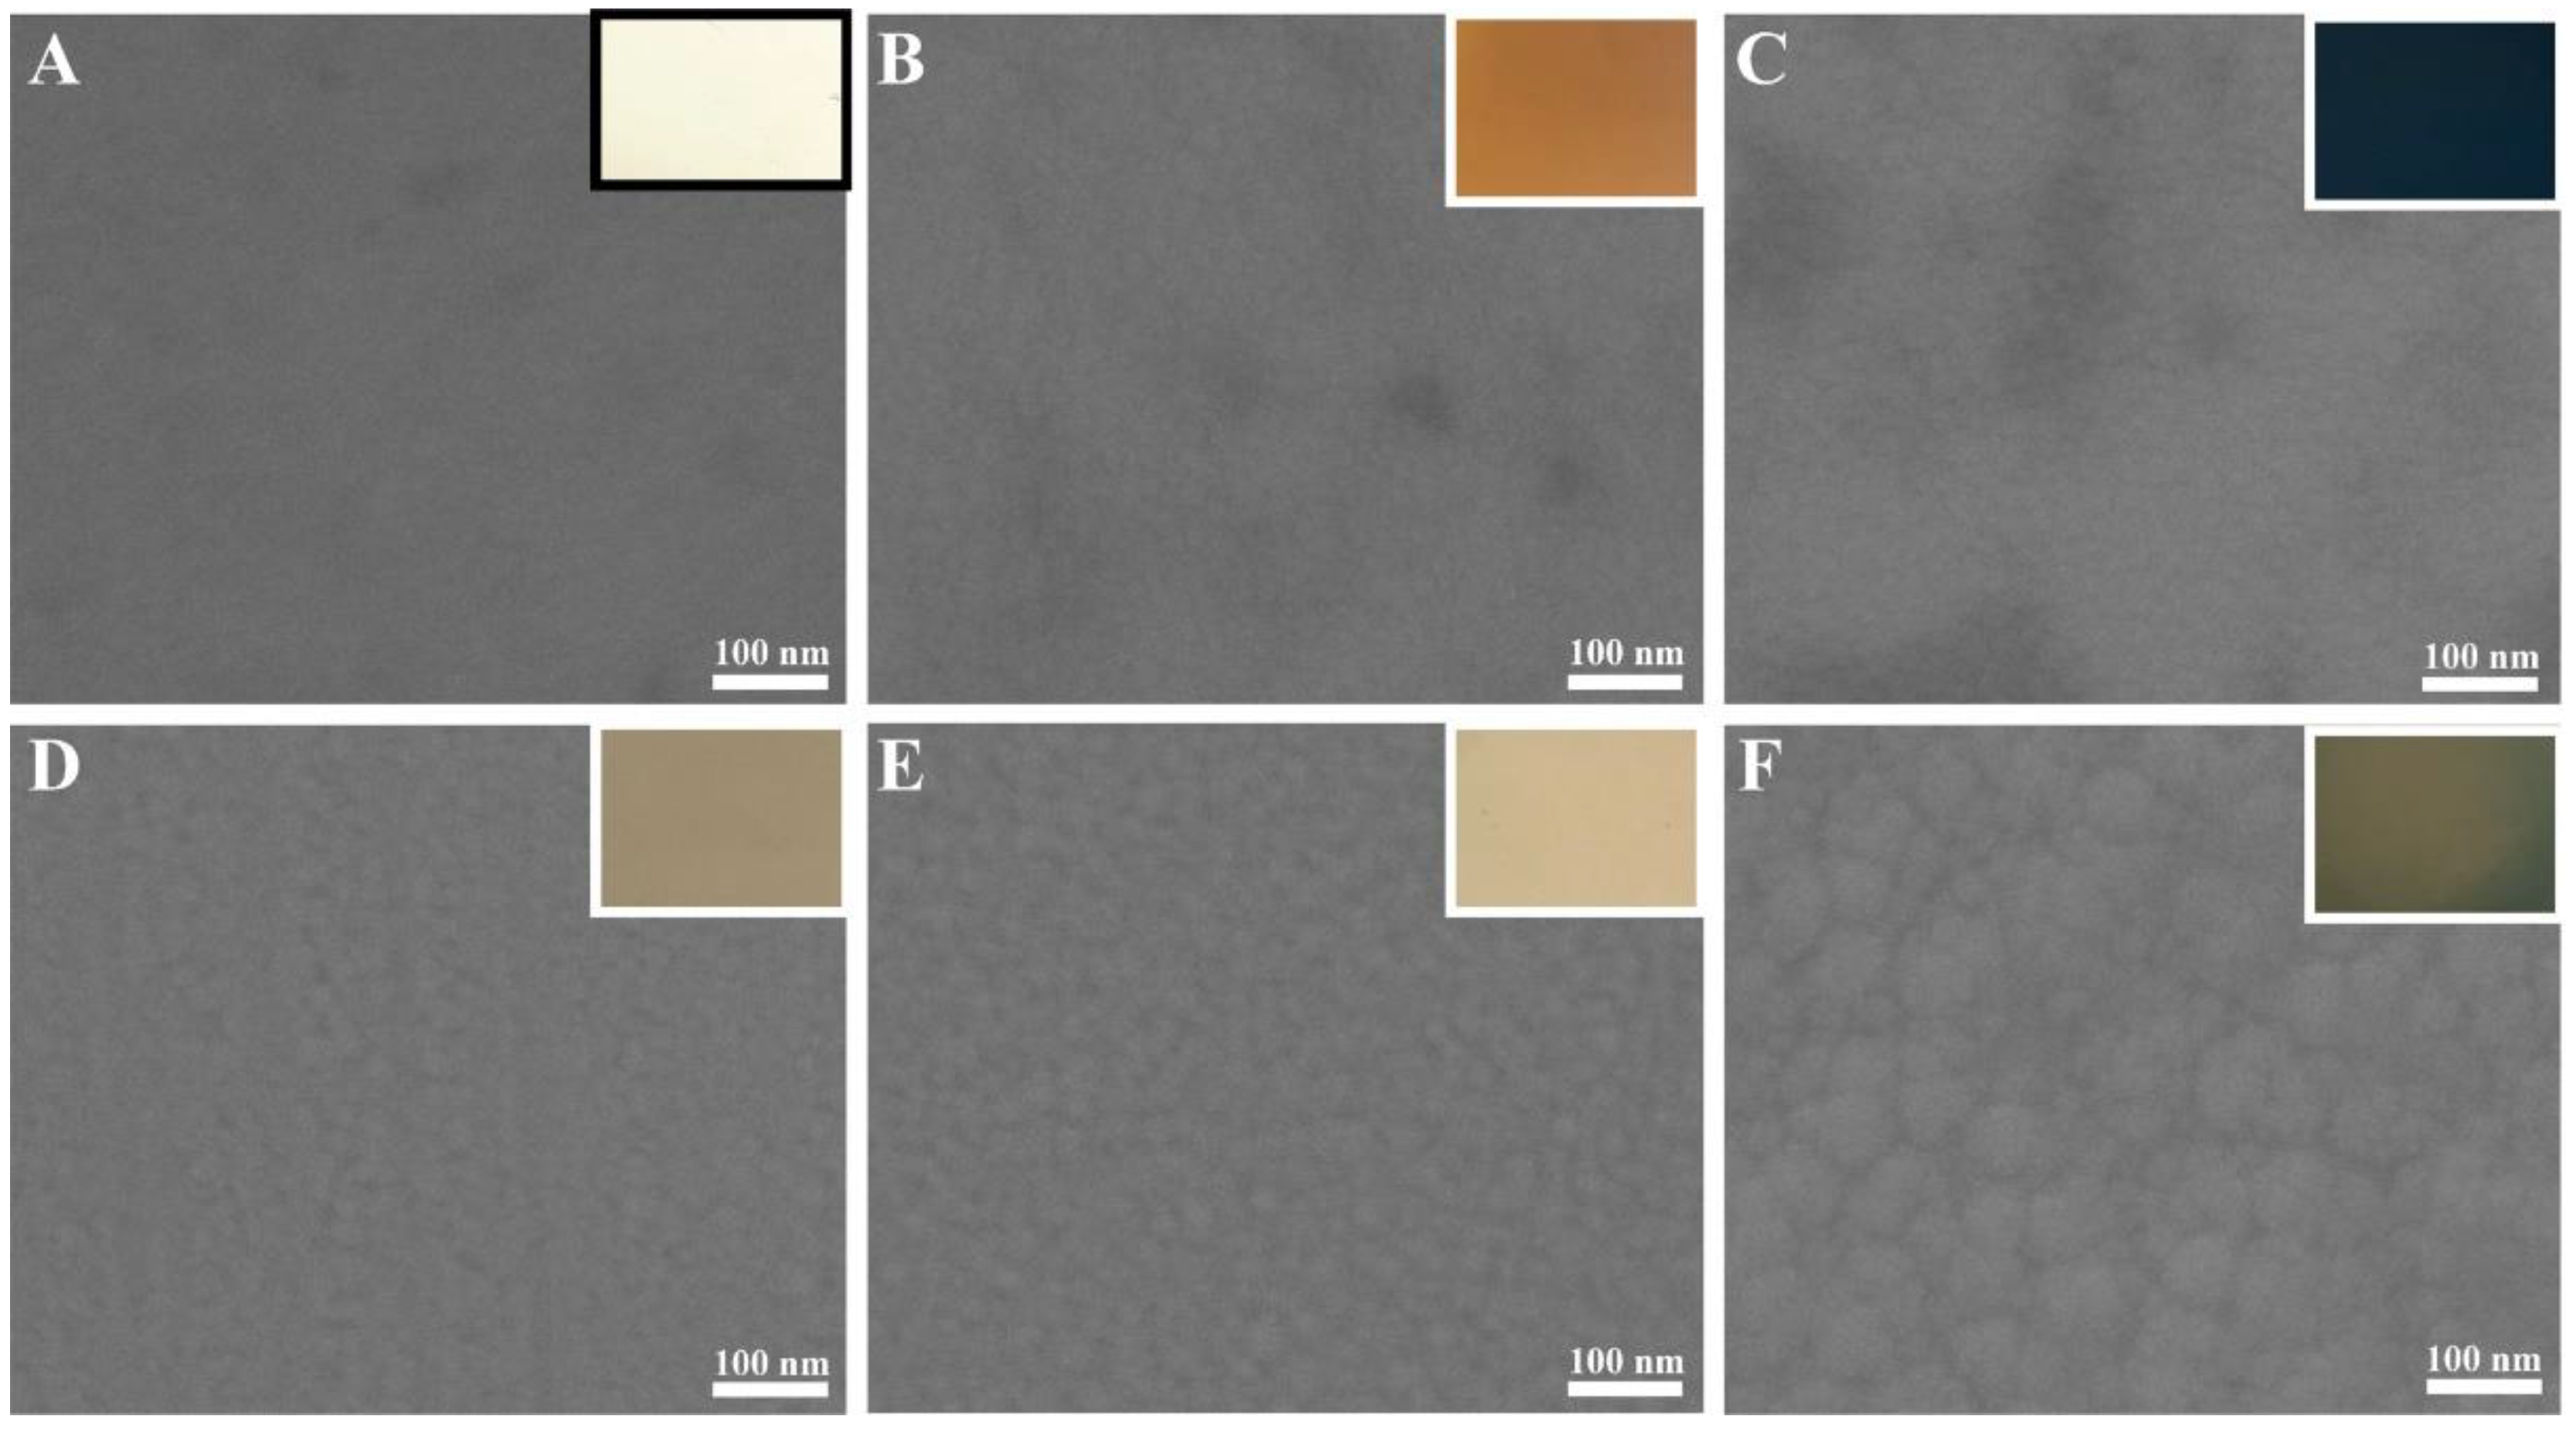
The morphological characteristics of Ag 10 nm/TiS2 (t = 2, 5, 10, 20, 30, 60 nm) nanostructures are shown in Figure 2 and Figure 3. After sputtering 2 nm TiS2 on 10 nm Ag film surfaces, the curved films tended to form round particles because the TiS2 layer did not show good compatibility with Ag in Figure 2A. When the thickness of TiS2 was 5 nm, the nanocap surfaces of the Ag 10 nm/TiS2 5 nm nanostructures became smooth. While the TiS2 thickness increased, the effects of incompatibility between Ag and TiS2 film morphology were reduced. When the TiS2 thickness increased from 20 nm to 60 nm, the surface roughness of the nanocaps gradually increased due to the growth of the TiS2 nanoparticles. The nanostructures’ lateral size became larger, and the gaps became smaller. The adjacent nanocaps were closely arranged and extruded to form hexagonal structures. The corresponding optical photos in the insets showed different reflected colors, which were ascribed to the different thickness and surface morphologies of Ag/TiS2 film. Furthermore, the uniform diffraction color indicated that the high-ordered PS colloid sphere arrays and uniform film had formed. Figure 3 shows the SEM of the flat film of the Ag 10 nm/TiS2 (t = 2, 5, 10, 20, 30, 60 nm) nanostructures. As the TiS2 thickness increased, the surface roughness of the nanocaps showed similar changes to the Ag 10 nm/TiS2 nanostructures on the PS arrays. The uniform color of the insets showed that the films on the plane were uniform.
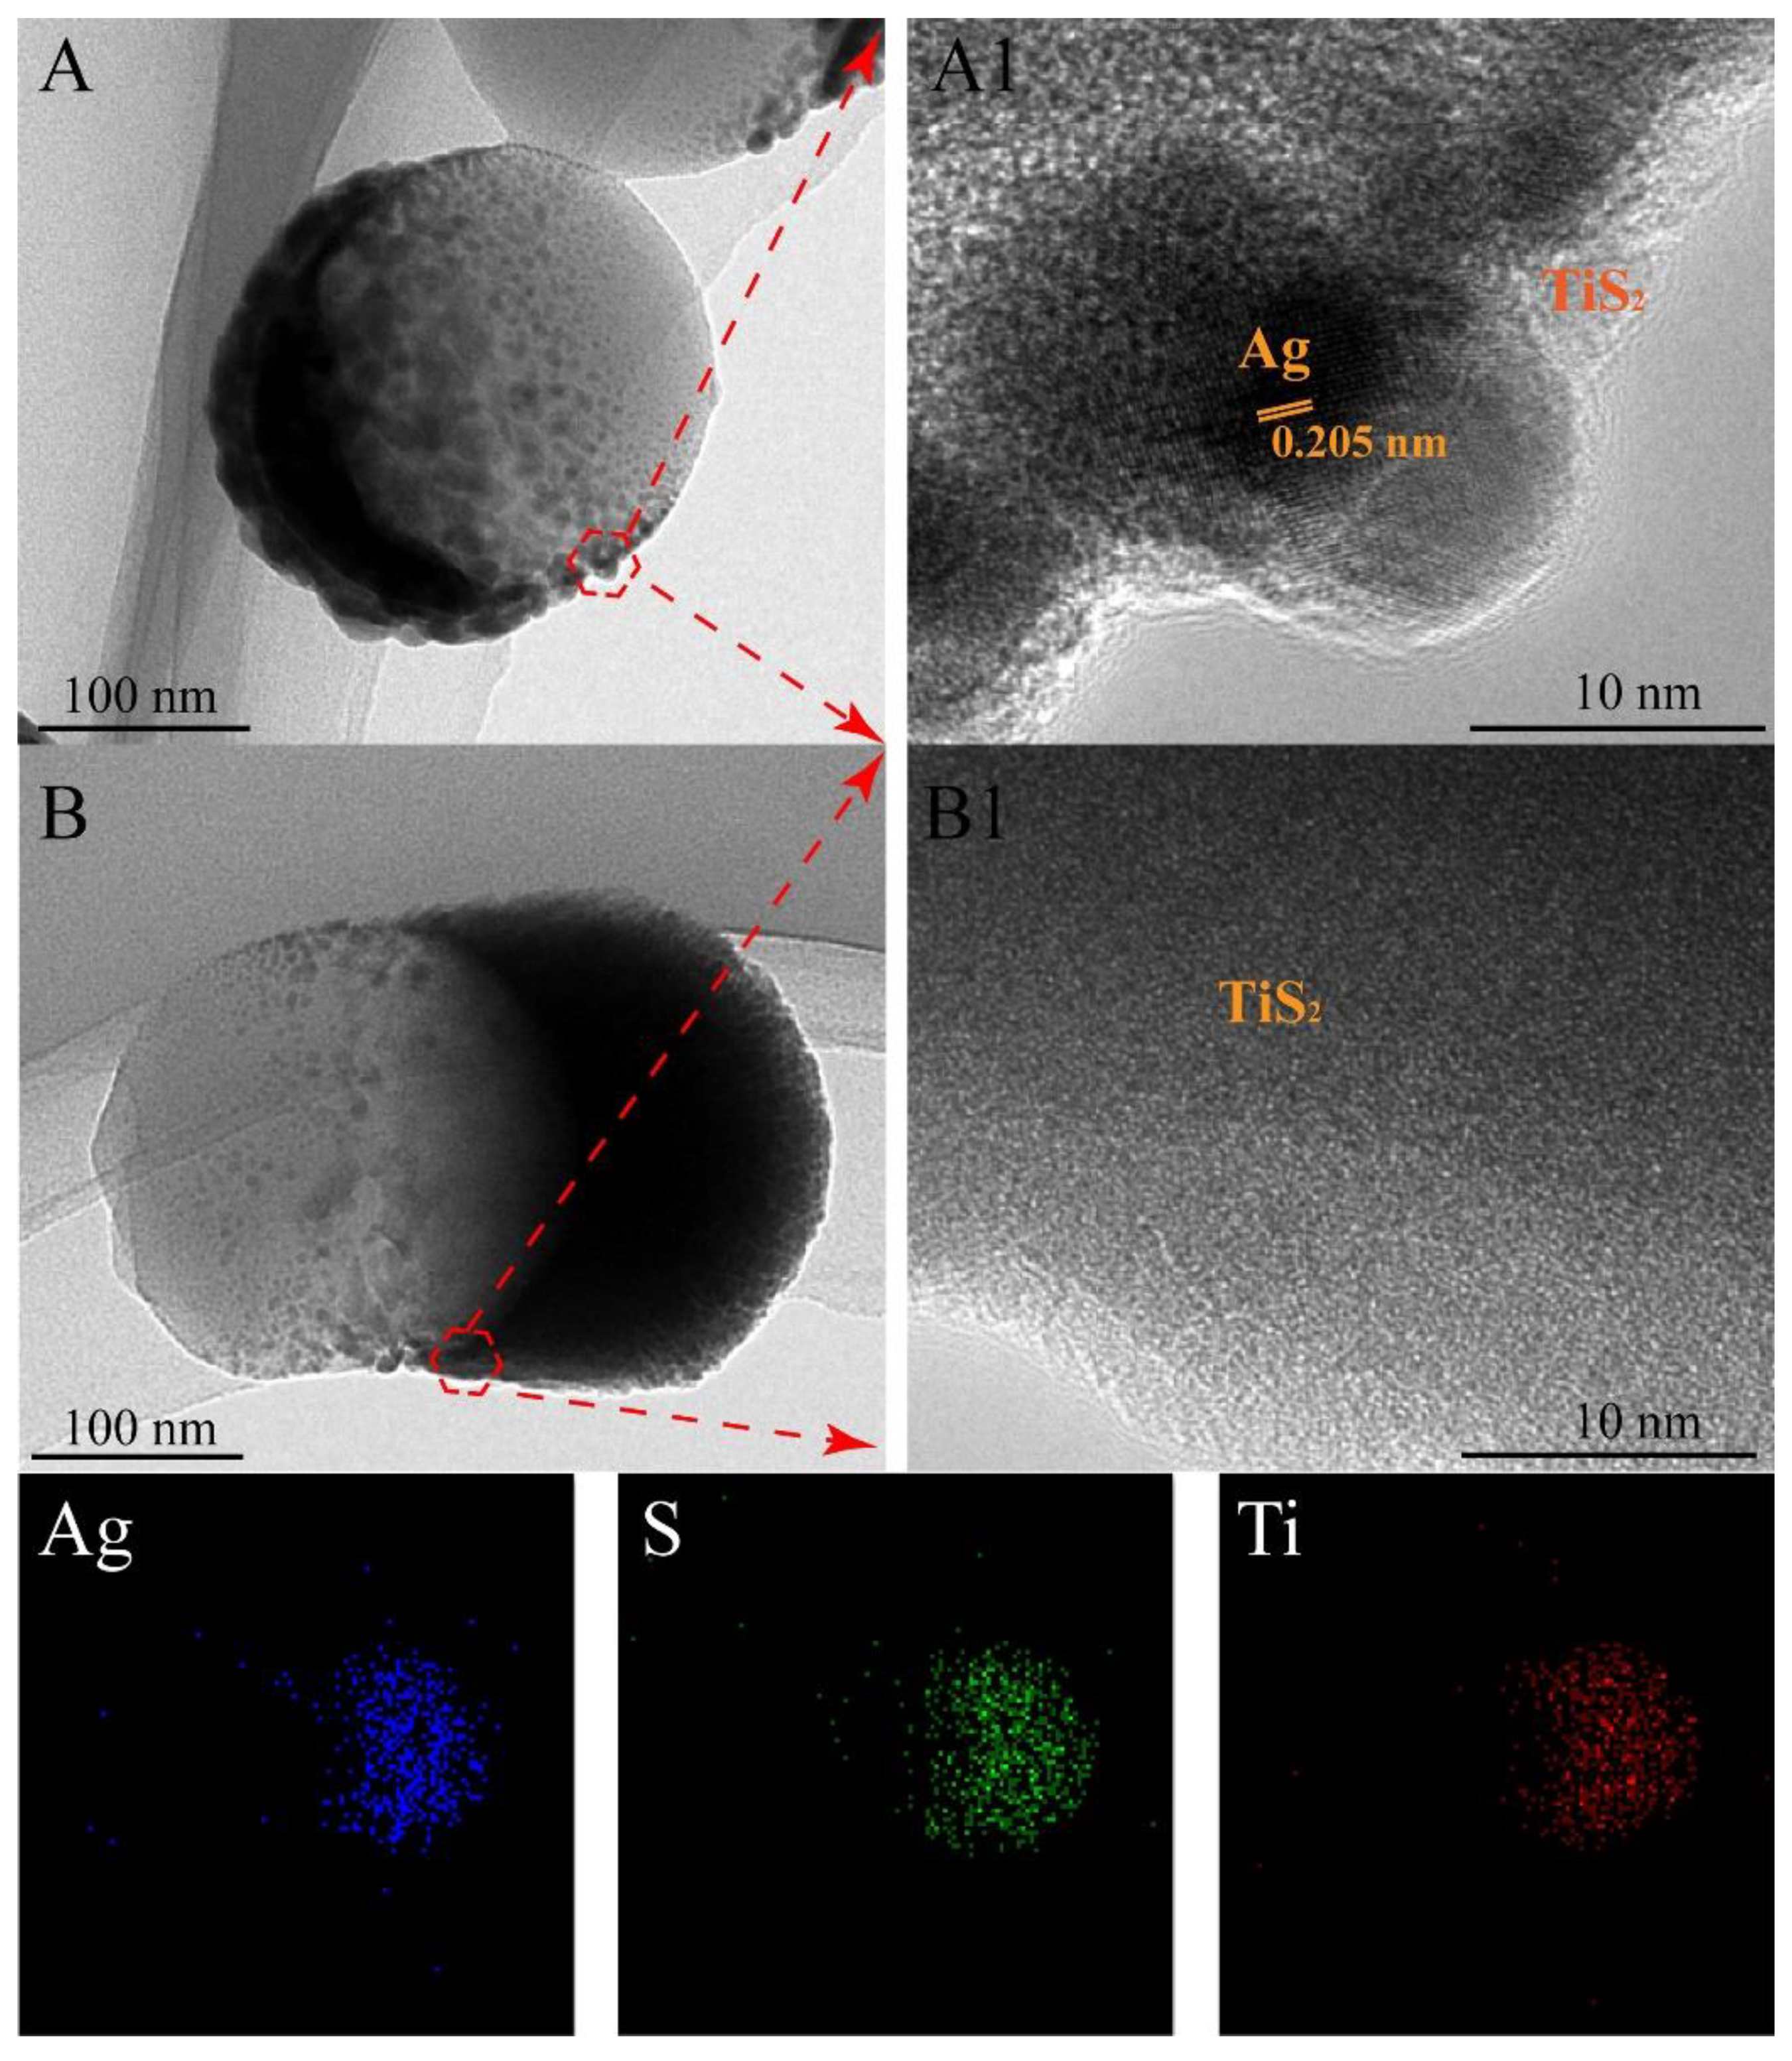
Figure 4 shows the TEM, HRTEM, and EDS mapping images of the Ag 10 nm/TiS2 (t = 2 nm, 30 nm) nanostructures. In Figure 4A,B, the TEM images showed that Ag/TiS2 composite films covered the PS spheres like the “nanocap”. The sizes of the thickest part were about 12 nm and 40 nm, corresponding to the sums of the Ag thickness and TiS2 thickness, respectively. In comparison with Ag 10 nm/TiS2 2 nm (Figure 4A), Ag 10 nm/TiS2 30 nm (Figure 4B) showed obvious anisotropic growth due to the shadow effect of the neighboring PS beads. The HRTEM images of Ag 10 nm/TiS2 (2 nm, 30 nm) correspond to the red marked area in Figure 4A,B. In Figure 4A1, the transparent materials at the edge of Ag were amorphous TiS2, and the lattice space of Ag was 0.205 nm, in agreement with the (100) plane. Ag was not observed in the HRTEM images (Figure 4B1), which could be attributed to the complete coverage by TiS2 with a thickness three times that of the Ag thickness. EDS elemental analysis showed the Ag, S, and Ti elements, which were mainly distributed in the nanocaps. Ag elements were mainly distributed between the bottom of the nanocaps and the top of the PS. S and Ti elements were distributed across all nanocaps, which confirmed the Ag film under the TiS2 film and the uniform distribution of TiS2 on the Ag nanocaps.
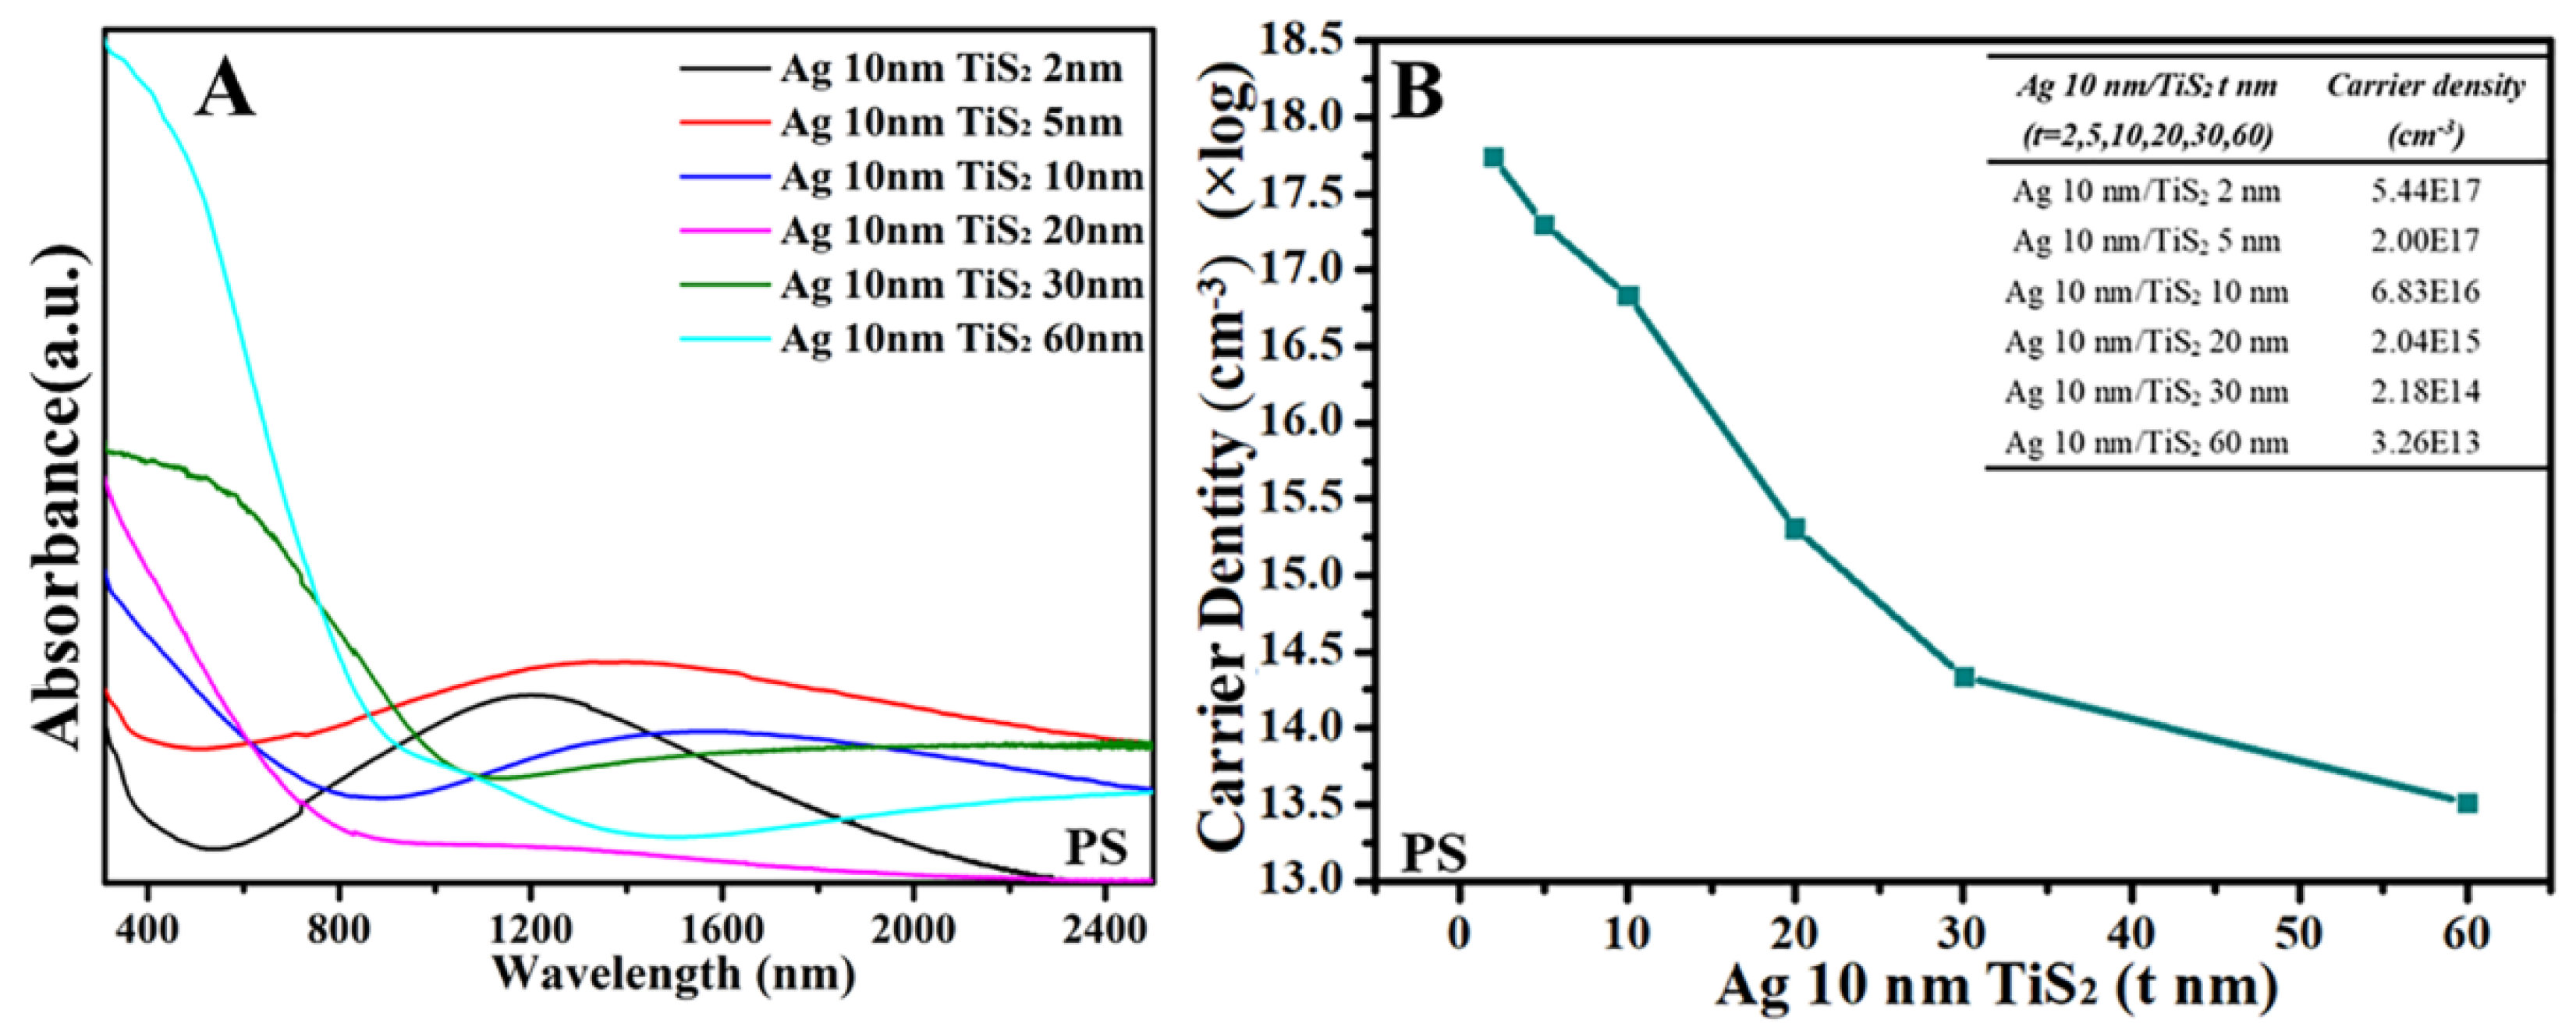
Figure 5 shows the UV–Vis–NIR spectra for Ag 10 nm/TiS2 (t nm) nanostructures on PS. All the Ag 10 nm/TiS2 (t nm) nanostructures had absorbance from the UV to NIR region, which indicated that the carrier was collective oscillation in the substrates under the irradiation of UV–Vis–NIR light. When the TiS2 thickness increased, the carrier density always decreased, which led to the red-shift of absorbance bands from the visible to NIR region, even the IR region, as shown in Figure 5. Figure S1 is the UV–Vis–NIR spectra of single TiS2. The LSPR peaks of TiS2 red-shifted and widened as the TiS2 thickness increased, and the carrier density also decreased. The LSPR peaks of TiS2 red-shifted and widened as the TiS2 thickness increased, and the carrier density also decreased from 1016 to 1013 in Figure S1B. The sensitivity of Hall effect detection for free electrons and high carrier concentration was low, so the carrier concentrations were far less than the normal value of 1020~1021 cm−3. On the other hand, the very thin TiS2 films sputtered on the PS arrays led to the destroyed continuity and electrical conductivity of TiS2. According to previous reports, the decrease in carrier concentration would cause the red-shift of the LSPR, which resulted in the red-shifted maximum LSPR wavelength ( λ m a x ) with the carrier concentration decreased [22]. While the carrier density of Ag 10 nm/TiS2 (t nm) nanostructures decreased, the λ m a x was red shifted. For Ag 10 nm/TiS2 (t nm) nanostructures, the optical absorbance bands were mainly composed of absorbance bands of TiS2 and synergistic effects of TiS2 and Ag so that the Ag 10 nm/TiS2 (t nm) nanostructures showed the widened absorbance bands (Figure 5A).
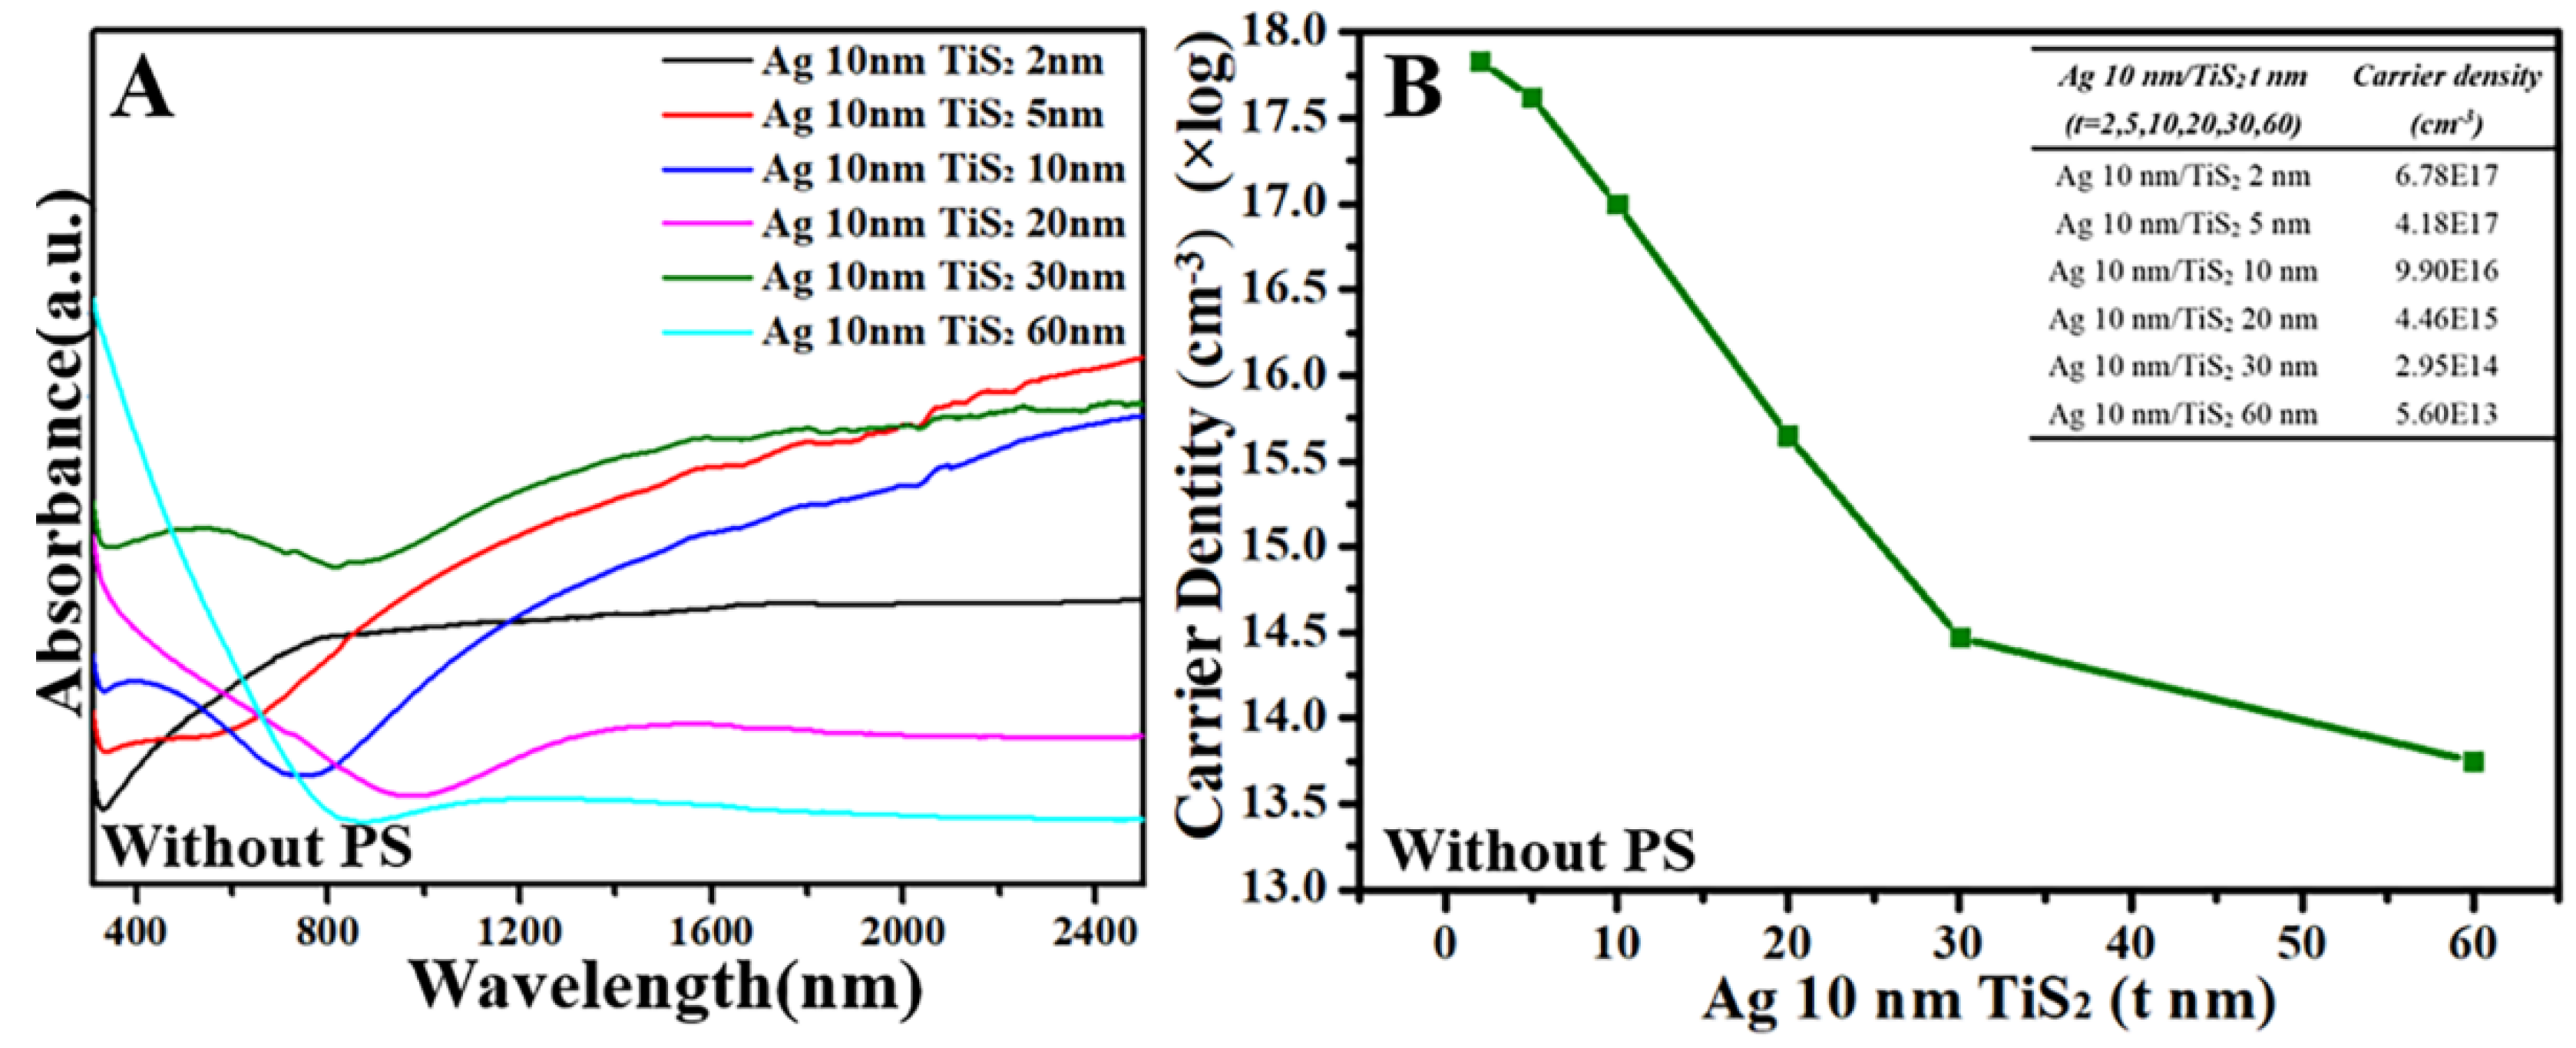
Figure 6 is the UV–Vis–NIR spectra and Hall effect measurement of flat planar Ag 10 nm/TiS2 (t nm) nanostructures. When the thickness of TiS2 increased, the absorption bands showed a red-shift from the NIR to IR region as the carrier density decreased. The maximum absorption bands in the IR region could not be observed, which were beyond the detectable wavelength range of our instrumentation. However, the carrier density of the Ag 10 nm/TiS2 nanostructures without PS arrays (Figure 6) was slightly more than that on the PS arrays (Figure 5) because of the good continuity and electrical conductivity of plane films.
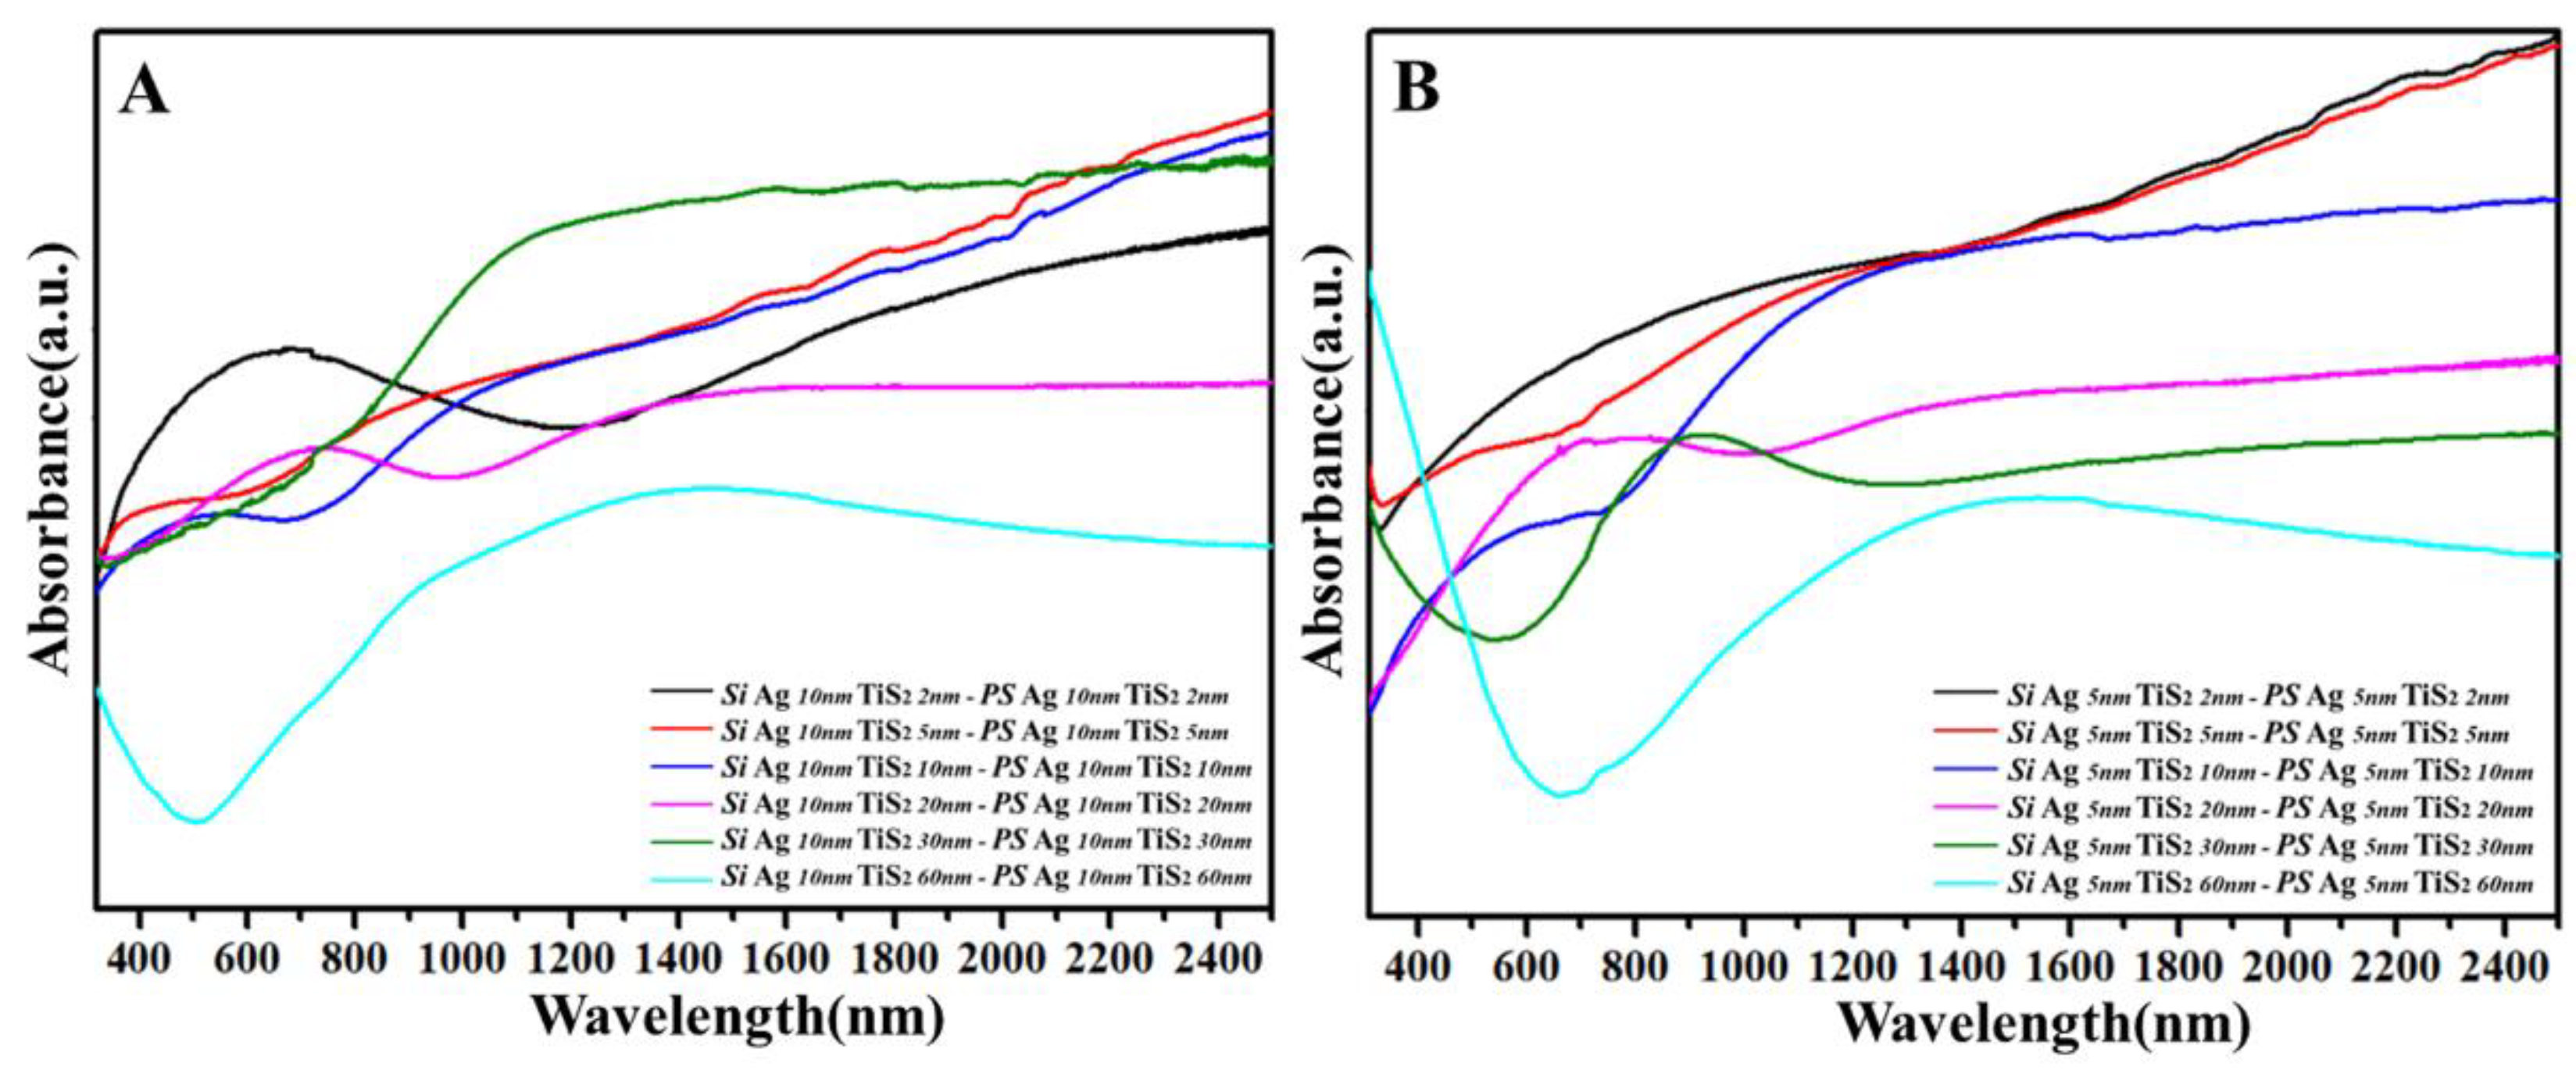
In order to prove the effect of curved films, the absorption bands of flat Ag 10 nm/TiS2 (t nm) nanostructures and curved Ag 10 nm/TiS2 (t nm) nanostructures were compared. For curved Ag 10 nm/TiS2 (t nm) nanostructures, the absorption bands were situated around 1200 nm to 2400 nm. However, the absorption bands of flat Ag 10 nm/TiS2 (t nm) nanostructures were beyond the detectable wavelength range of instrumentation, so the optical absorption was localized at the IR region. Figure 7A shows the different UV–Vis–NIR spectra for Ag 10 nm/TiS2 nanostructures with and without PS arrays. With the increased TiS2 thickness, the absorbance peaks first red-shifted from the visible region to the NIR region, and then still in the NIR region. When the TiS2 thickness was 2, 5, and 10 nm, the curvature of every nanocap decreased, which led to the absorbance peaks red-shifting from the visible region to the NIR region. While the thickness was 20, 30, and 60 nm, the surface of the PS arrays gradually flattened, the absorbance peaks did not shift, and were located in the NIR region. When the Ag 10 nm/TiS2 nanostructures on the PS arrays were excited by light, the absorption bands of the PS arrays in the NIR region could couple with the Ag 10 nm/TiS2 nanostructures, which made the LSPR of the patterned structures in the NIR region, even if the carrier concentration of the Ag 10 nm/TiS2 nanostructures was as low as 1014. The curved shapes are important for LSPR in the NIR region. Due to the influence of the size and shape, the LSPR of the curved structures was adjustable. This was also an important reason as to why the array structures were superior to the flat structures. In order to validate the relationship between thickness and LSPR, the LSPR and carrier density of the Ag 5 nm/TiS2 (t nm) nanostructures are shown in Figures S2 and S3. The changed rule of LSPR and carrier density in these systems was also found, even if Ag 5 nm was chosen for the Ag/TiS2 nanostructures (Figure 7B, Figures S2 and S3). Therefore, the changes in the UV–Vis–NIR spectra primarily derived from the intrinsic factors of the Ag/TiS2 (t nm) systems such as carrier density, dielectric environment, and shape.
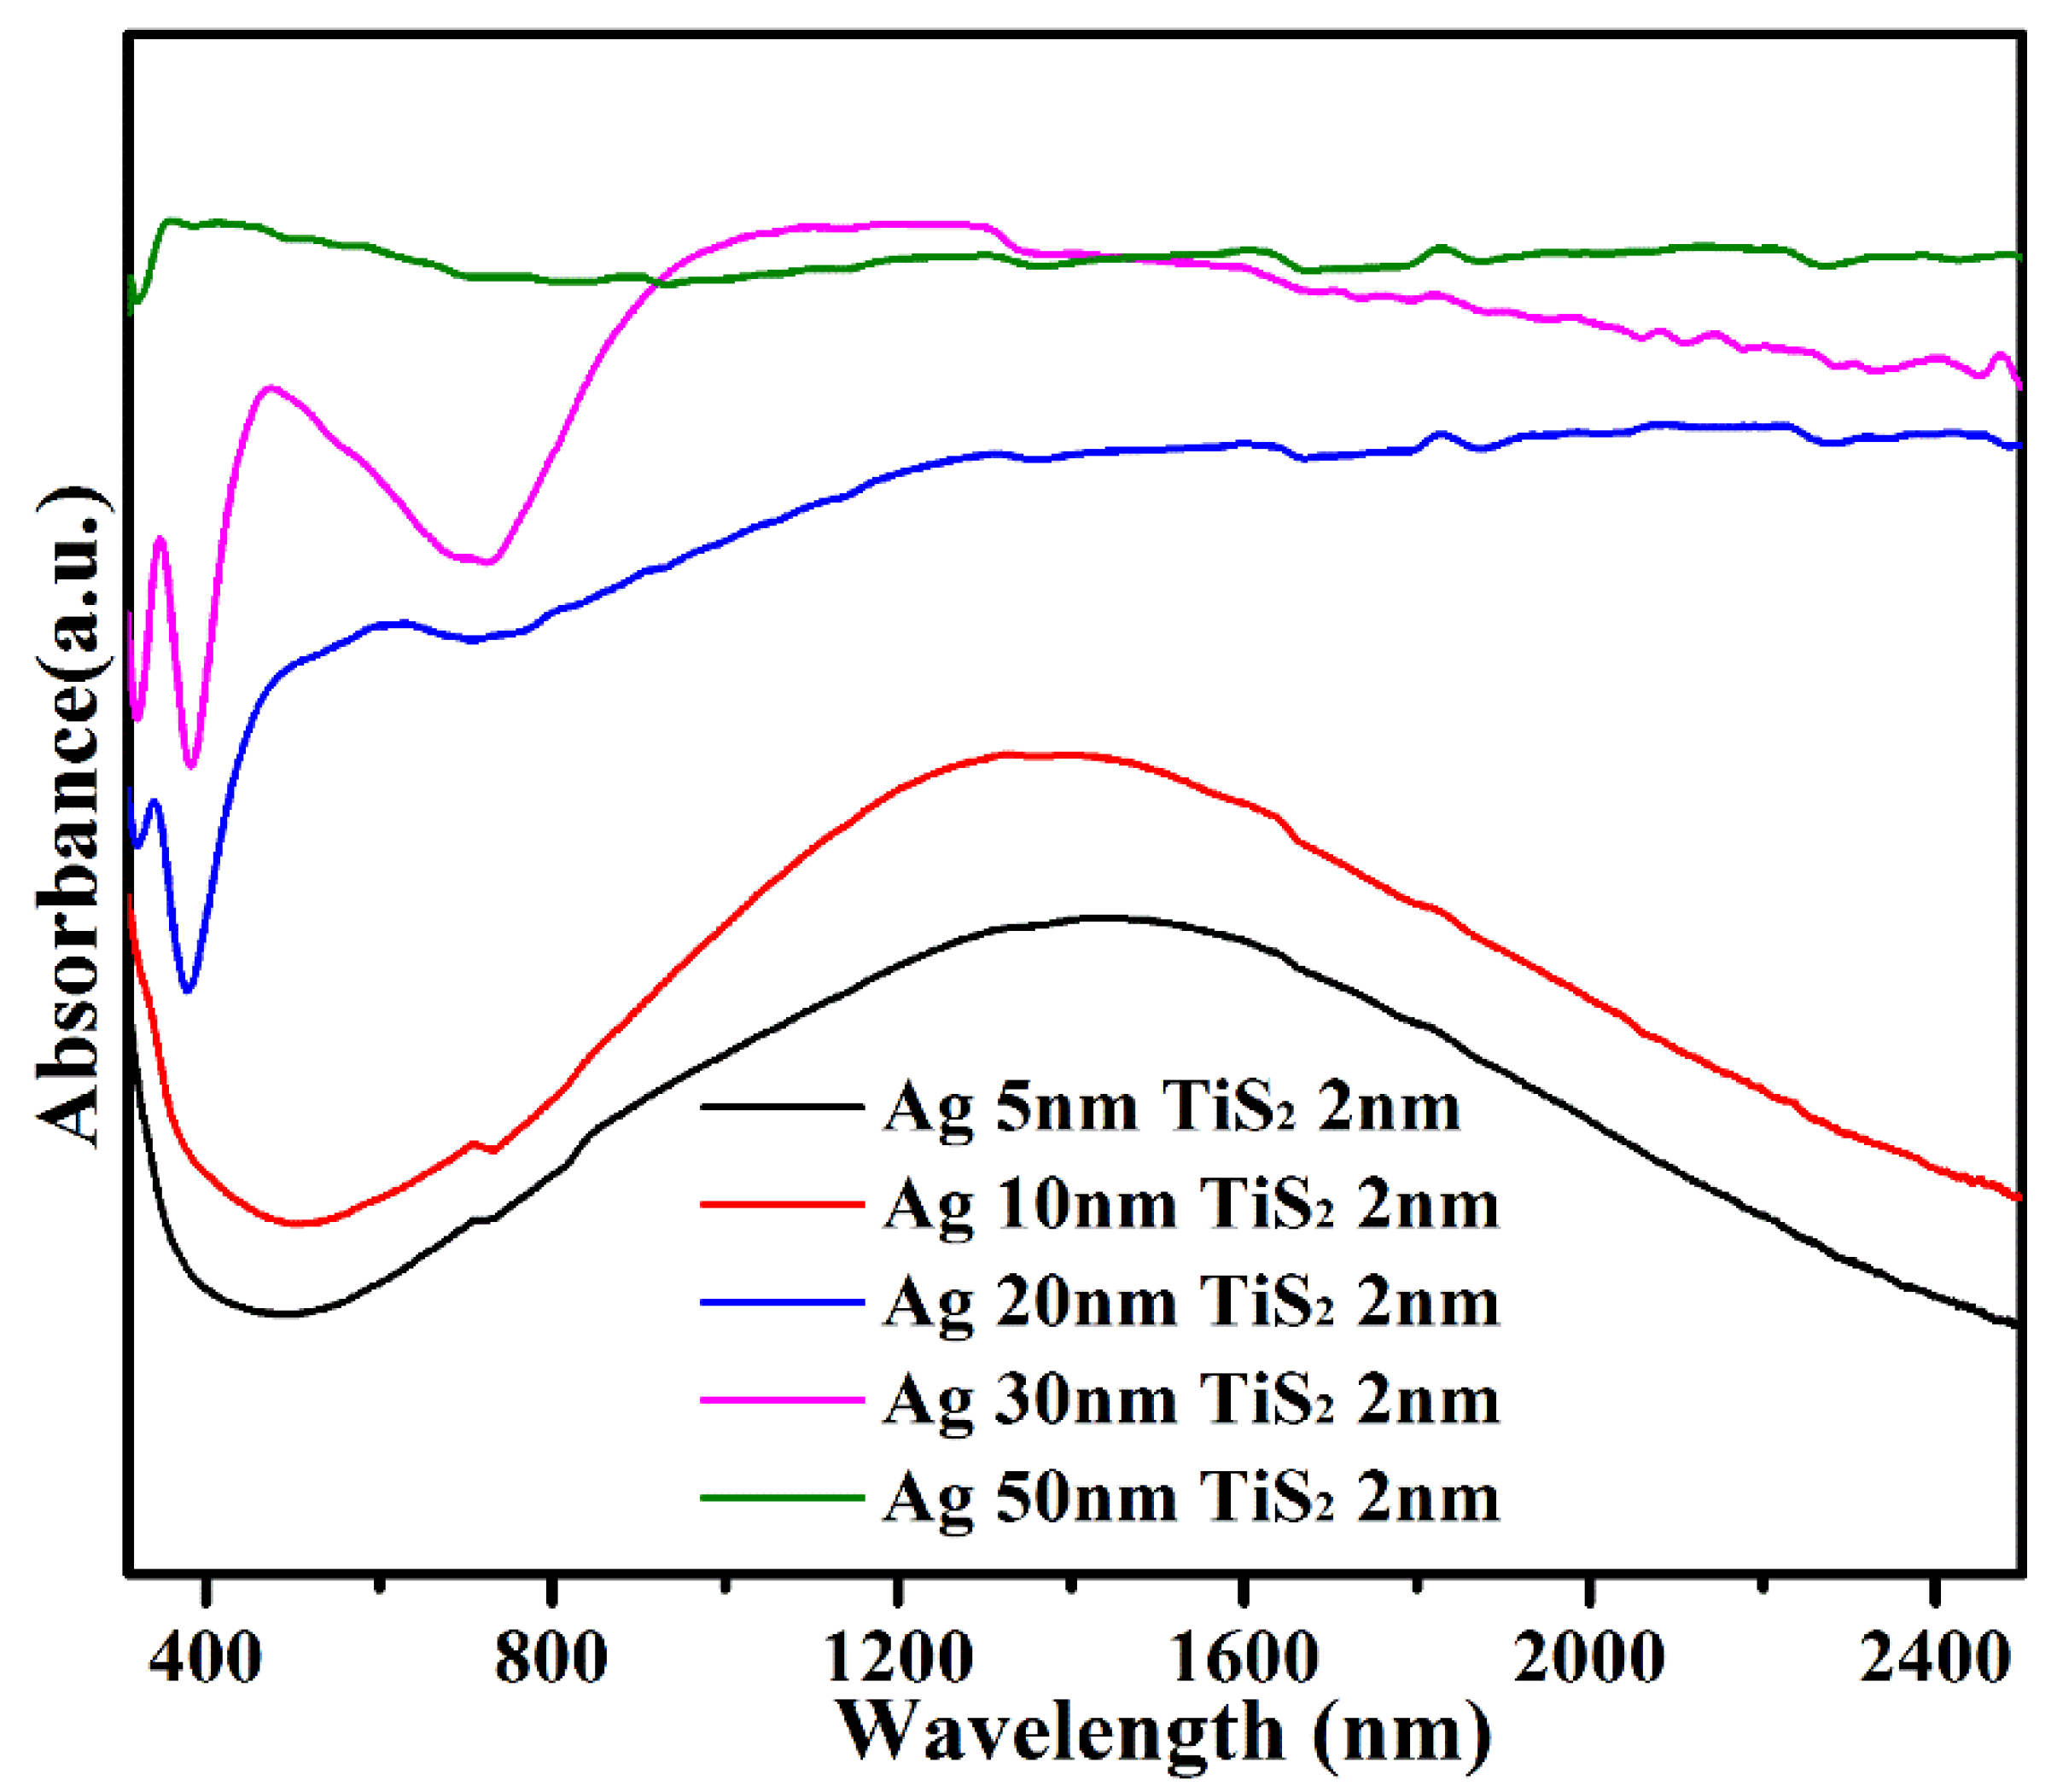
The UV–Vis–NIR spectra for the single Ag films are shown in Figure S4. The peak at 320 nm was the intrinsic peak of Ag, and peaks around 400–2400 nm corresponded to the plasmon resonance [31]. As Ag thickness increased, the plasmon resonance peaks of Ag around 400–2400 nm showed a blue-shift and became narrow due to the dielectric constant effect of surrounding medium. Compared with the single Ag (Figure S4), the LSPR bands of Ag (t nm)/TiS2 2 nm nanostructures were significantly red shifted and relatively broad as the thickness of Ag decreased (Figure 8). For Ag and TiS2 composite films, the plasma resonance oscillations were coupled. Beyond that, the electromagnetic coupling enhanced the polarizability of the electron cloud and reduced the resonance energy of plasmon, which led to the red-shift and widened LSPR.
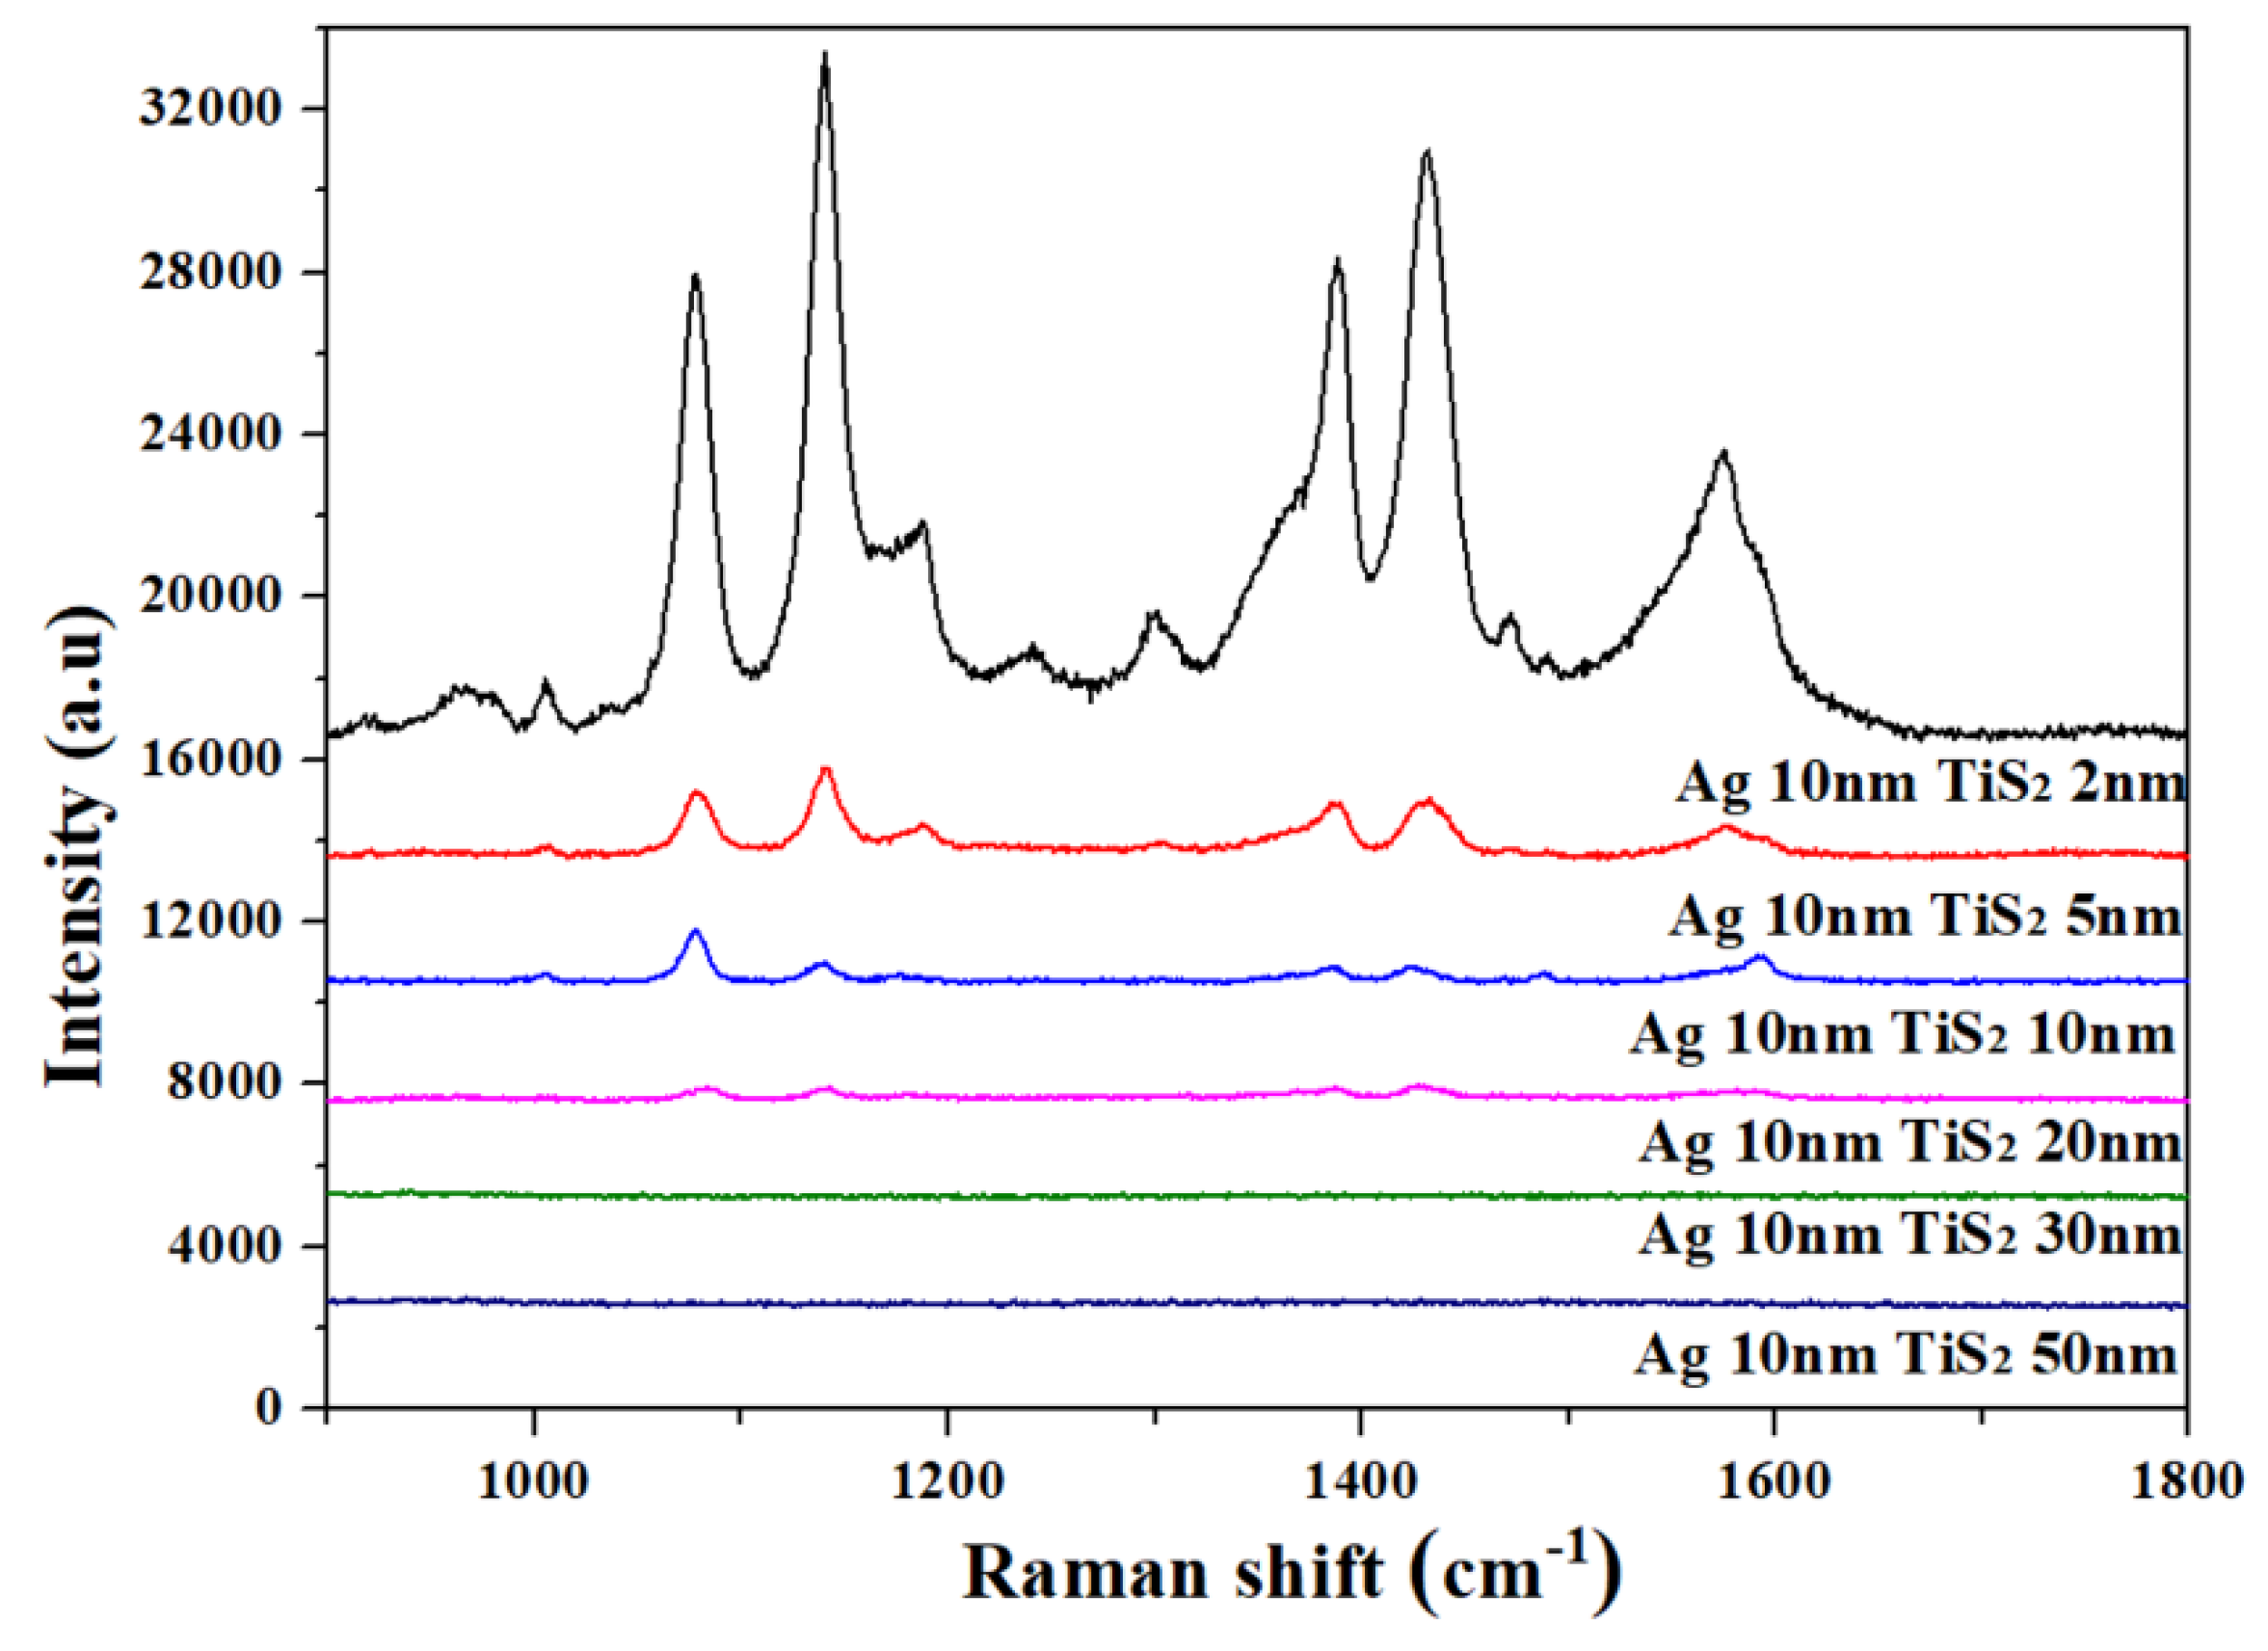
The Raman spectra of the curved Ag 10 nm/TiS2 (t nm) nanostructures were measured in Figure 9. The excitation wavelength was 633 nm and the concentration of the 4-ATP probe molecule was 10−3 mol/L. In Figure 9, the Ag 10 nm/TiS2 (2, 5, 10 nm) nanostructures all showed characteristic peaks of PATP, in which the curved film could enhance the signals of PATP. The SERS signals of the Ag 10 nm/TiS2 (t nm) nanostructures were the strongest when the thickness of TiS2 was 2 nm. This was due to the SERS that majored from the LSPR of Ag and the “hot spots” of the adjacent nanocaps [32,33]. The Ag layer was below the TiS2 layer, and the TiS2 layer had a shielding effect on the LSPR of Ag, so the strength of Ag LSPR decreased exponentially with the thickness of the TiS2 layer [34]. As the TiS2 thickness increased, the contribution of Ag LSPR to the enhancement of the electromagnetic field decreased, and the SERS signal intensity gradually decreased.

4. Conclusions

The Ag/TiS2 nanostructures could achieve bidirectional regulation from visible region or IR region to NIR region. When the thickness of Ag decreased, the LSPR shifted from visible region to the NIR region for the curved Ag (t nm)/TiS2 2 nm nanostructures. With the decreased thickness of TiS2, the LSPR of the curved Ag/TiS2 (t nm) nanostructures moved from the IR to the NIR region. For the Ag/TiS2 film on the PS arrays, the curved structures were adjusted for LSPR in the NIR region, even if carrier density was as low as 1014 for the curved Ag/TiS2 nanostructures. The Raman signals came from the LSPR of Ag in the “hot spots” of the adjacent nanocaps.

Supplementary Materials

The following are available online.

Author Contributions

Y.W. and Y.Z. conceived and designed the experiments; F.Z. performed the experiments and document retrieval; Y.W. and F.Z. analyzed the data; Y.W. wrote the paper; F.Z. and Y.W. contributed significantly to analysis and manuscript preparation; Y.Z. helped perform the analysis with constructive theoretical discussions. All authors have read and agreed to the published version of the manuscript.

Funding

This work was supported by the National Natural Science Foundation of China (grant numbers 61575080 and 61675090) and by the Fundamental Research Funds for the Provincial Universities of Zhejiang.

Conflicts of Interest

The authors declare no conflict of interest.

References

  1. Agrawal, A.; Cho, S.H.; Zandi, O.; Ghosh, S.; Johns, R.W.; Milliron, D.J. Localized Surface Plasmon Resonance in Semiconductor Nanocrystals. Chem. Rev. 2018, 118, 3121–3207. [Google Scholar] [CrossRef] [PubMed]
  2. Lesyuk, R.; Klein, E.; Yaremchuk, I.; Klinke, C. Copper Sulfide Nanosheets with Shape-Tunable Plasmonic Properties in the Nir Region. Nanoscale 2018, 10, 20640–20651. [Google Scholar] [CrossRef] [PubMed] [Green Version]
  3. Litvin, A.P.; Cherevkov, S.A.; Dubavik, A.; Babaev, A.A.; Parfenov, P.S.; Gamboa, A.L.S.; Fedorov, A.V.; Baranov, A.V. Thin Layer of Semiconductor Plasmonic Nanocrystals for the Enhancement of Nir Fluorophores. JPCC 2018, 122, 20469–20475. [Google Scholar] [CrossRef]
  4. Larsson, E.M.; Langhammer, C.; Zoric, I.; Kasemo, B. Nanoplasmonic Probes of Catalytic Reactions. Science 2009, 326, 1091–1094. [Google Scholar] [CrossRef] [PubMed]
  5. Liu, N.; Tang, M.L.; Hentschel, M.; Giessen, H.; Alivisatos, A.P. Nanoantenna-Enhanced Gas Sensing in a Single Tailored Nanofocus. Nat. Mater. 2011, 10, 631–636. [Google Scholar] [CrossRef] [PubMed]
  6. Schlucker, S. Surface-Enhanced Raman Spectroscopy: Concepts and Chemical Applications. Angew. Chem. Int. Ed. 2014, 53, 4756–4795. [Google Scholar] [CrossRef]
  7. Mejía-Salazar, J.R.; Oliveira, O.N. Plasmonic Biosensing. Chem. Rev. 2018, 118, 10617–10625. [Google Scholar] [CrossRef]
  8. Baia, L.; Baia, M.; Popp, J.; Astilean, S. Gold Films Deposited over Regular Arrays of Polystyrene Nanospheres as Highly Effective SERS Substrates from Visible to NIR. J. Phys. Chem. B 2006, 110, 23982–23986. [Google Scholar] [CrossRef]
  9. Li, X.; Zhang, Y.; Shen, Z.X.; Fan, H.J. Highly Ordered Arrays of Particle-in-Bowl Plasmonic Nanostructures for Surface-Enhanced Raman Scattering. Small 2012, 8, 2548–2554. [Google Scholar] [CrossRef]
  10. Uzayisenga, V.; Lin, X.D.; Li, L.M.; Anema, J.R.; Yang, Z.L.; Huang, Y.F.; Lin, H.X.; Li, S.B.; Li, J.F.; Tian, Z.Q. Synthesis, Characterization, and 3d-Fdtd Simulation of Ag@SiO2 Nanoparticles for Shell-Isolated Nanoparticle-Enhanced Raman Spectroscopy. Langmuir 2012, 28, 9140–9146. [Google Scholar] [CrossRef]
  11. Yang, S.; Xu, F.; Ostendorp, S.; Wilde, G.; Zhao, H.; Lei, Y. Template-Confined Dewetting Process to Surface Nanopatterns: Fabrication, Structural Tunability, and Structure-Related Properties. Adv. Funct. Mater. 2011, 21, 2446–2455. [Google Scholar] [CrossRef]
  12. Zhao, X.; Wen, J.; Zhang, M.; Wang, D.; Wang, Y.; Chen, L.; Zhang, Y.; Yang, J.; Du, Y. Design of Hybrid Nanostructural Arrays to Manipulate Sers-Active Substrates by Nanosphere Lithography. ACS Appl. Mater. Interfaces 2017, 9, 7710–7716. [Google Scholar] [CrossRef] [PubMed]
  13. Luther, J.M.; Jain, P.K.; Ewers, T.; Alivisatos, A.P. Localized Surface Plasmon Resonances Arising from Free Carriers in Doped Quantum Dots. Nat. Mater. 2011, 10, 361–366. [Google Scholar] [CrossRef] [PubMed]
  14. Hsu, S.W.; On, K.; Tao, A.R. Localized Surface Plasmon Resonances of Anisotropic Semiconductor Nanocrystals. J. Am. Chem. Soc. 2011, 133, 19072–19075. [Google Scholar] [CrossRef] [PubMed]
  15. Faucheaux, J.A.; Jain, P.K. Plasmons in Photocharged ZnO Nanocrystals Revealing the Nature of Charge Dynamics. J. Phys. Chem. Lett. 2013, 4, 3024–3030. [Google Scholar] [CrossRef]
  16. Ma, N.; Zhang, X.Y.; Fan, W.Y.; Han, B.B.; Jin, S.; Park, Y.; Chen, L.; Zhang, Y.J.; Liu, Y.; Yang, J.H.; et al. Controllable Preparation of SERS-Active Ag-FeS Substrates by a Cosputtering Technique. Molecules 2019, 24, 551. [Google Scholar] [CrossRef] [Green Version]
  17. Zhang, X.Y.; Han, D.L.; Pang, Z.Y.; Sun, Y.S.; Wang, Y.X.; Zhang, Y.J.; Yang, J.H.; Chen, L. Charge Transfer in an Ordered Ag/Cu2S/4-MBA System Based on Surface-Enhanced Raman Scattering. J. Phys. Chem. C 2018, 122, 5599–5605. [Google Scholar] [CrossRef]
  18. Wang, D.S.; Fan, S.K. Microfluidic Surface Plasmon Resonance Sensors: From Principles to Point-of-Care Applications. Sensors 2016, 16, 1175. [Google Scholar] [CrossRef] [Green Version]
  19. Anker, J.N.; Hall, W.P.; Lyandres, O.; Shah, N.C.; Zhao, J.; van Duyne, R.P. Biosensing with Plasmonic Nanosensors. Nat. Mater. 2008, 7, 442–453. [Google Scholar] [CrossRef]
  20. Kim, E.; Baaske, M.D.; Schuldes, I.; Wilsch, P.S.; Vollmer, F. Label-Free Optical Detection of Single Enzyme-Reactant Reactions and Associated Conformational Changes. Sci. Adv. 2017, 3, 1603044. [Google Scholar] [CrossRef] [Green Version]
  21. Jin, J.; Zhu, S.J.; Song, Y.B.; Zhao, Z.; Zhang, H.Y.; Guo, Y.; Li, J.B.; Song, W.; Yang, B.; Zhao, B. Precisely Controllable Core−Shell Ag@Carbon Dots Nanoparticles: Application to in Situ Super-Sensitive Monitoring of Catalytic Reactions. ACS Appl. Mater. Interfaces 2016, 8, 27956. [Google Scholar] [CrossRef] [PubMed]
  22. Zhu, Z.; Zou, Y.; Hu, W.; Li, Y.; Gu, Y.; Cao, B.; Guo, N.; Wang, L.; Song, J.; Zhang, S.; et al. Near-Infrared Plasmonic 2D Semimetals for Applications in Communication and Biology. Adv. Funct. Mater. 2016, 26, 1793–1802. [Google Scholar] [CrossRef]
  23. Zeng, Z.; Tan, C.; Huang, X.; Bao, S.; Zhang, H. Growth of noble metal nanoparticles on single-layer TiS2 and TaS2 nanosheets for hydrogen evolution reaction. Energy Environ. Sci. 2014, 7, 797–803. [Google Scholar] [CrossRef]
  24. Ma, L.; Wei, S.; Zhuang, H.L.; Hendrickson, K.E.; Hennig, R.G.; Archer, L.A. Hybrid Cathode Architectures for Lithium Batteries Based on TiS2 and Sulfur. J. Mater. Chem. A 2015, 3, 19857–19866. [Google Scholar] [CrossRef]
  25. Muller, G.A.; Cook, J.B.; Kim, H.S.; Tolbert, S.H.; Dunn, B. High Performance Pseudocapacitor Based on 2d Layered Metal Chalcogenide Nanocrystals. Nano Lett. 2015, 15, 1911–1917. [Google Scholar] [CrossRef]
  26. Wan, C.; Gu, X.; Dang, F.; Itoh, T.; Wang, Y.; Sasaki, H.; Kondo, M.; Koga, K.; Yabuki, K.; Snyder, G.J.; et al. Flexible n-type thermoelectric materials by organic intercalation of layered transition metal dichalcogenide TiS2. Nat. Mater. 2015, 14, 622–627. [Google Scholar] [CrossRef]
  27. Lin, C.; Zhu, X.; Feng, J.; Wu, C.; Hu, S.; Peng, J.; Guo, Y.; Peng, L.; Zhao, J.; Huang, J.; et al. Hydrogen-incorporated TiS2 ultrathin nanosheets with ultrahigh conductivity for stamp-transferrable electrodes. J. Am. Chem. Soc. 2013, 135, 5144–5151. [Google Scholar] [CrossRef]
  28. Li, X.; Ding, X.; Li, Y.; Wang, L.; Fan, J. A TiS2 Nanosheet Enhanced Fluorescence Polarization Biosensor for Ultra-Sensitive Detection of Biomolecules. Nanoscale 2016, 8, 9852–9860. [Google Scholar] [CrossRef]
  29. Qian, X.; Shen, S.; Liu, T.; Cheng, L.; Liu, Z. Two-Dimensional TiS2 Nanosheets for in Vivo Photoacoustic Imaging and Photothermal Cancer Therapy. Nanoscale 2015, 7, 6380–6387. [Google Scholar] [CrossRef]
  30. Zhang, F.; Zhang, Y.J.; Wang, Y.X.; Zhao, X.Y. Composition-dependent LSPR shifts for co-sputtered TiS2-Ag. Opt. Commun. 2020, 473, 125935. [Google Scholar] [CrossRef]
  31. Wang, Y.; Liu, J.; Ozaki, Y.; Xu, Z.; Zhao, B. Effect of TiO2 on Altering Direction of Interfacial Charge Transfer in a TiO2-Ag-Mpy-Fepc System by Sers. Angew. Chem. Int. Ed. Engl. 2019, 58, 8172–8176. [Google Scholar] [CrossRef] [PubMed]
  32. Sun, H.H.; Gao, R.X.; Zhu, A.N.; Hua, Z.; Chen, L.; Wang, Y.X.; Zhang, Y.J. Surface-enhanced Raman scattering from metal and transition metal nano-caped arrays. Superlattices Microstruct. 2018, 115, 59–66. [Google Scholar] [CrossRef]
  33. Zhao, X.Y.; Wen, J.H.; Zhu, A.N.; Cheng, M.Y.; Zhu, Q.; Zhang, X.L.; Wang, Y.X.; Zhang, Y.J. Manipulation and Applications of Hotspots in Nanostructured Surfaces and Thin Films. Nanomaterials 2020, 10, 1667. [Google Scholar] [CrossRef] [PubMed]
  34. Kneipp, K.; Moskovits, M.; Kneipp, H. Surface Enhanced Raman Scattering Physics and Applications; Topics in Applied Physics; Springer: Berlin/Heidelberg, Germany, 2006; Volume 103. [Google Scholar]
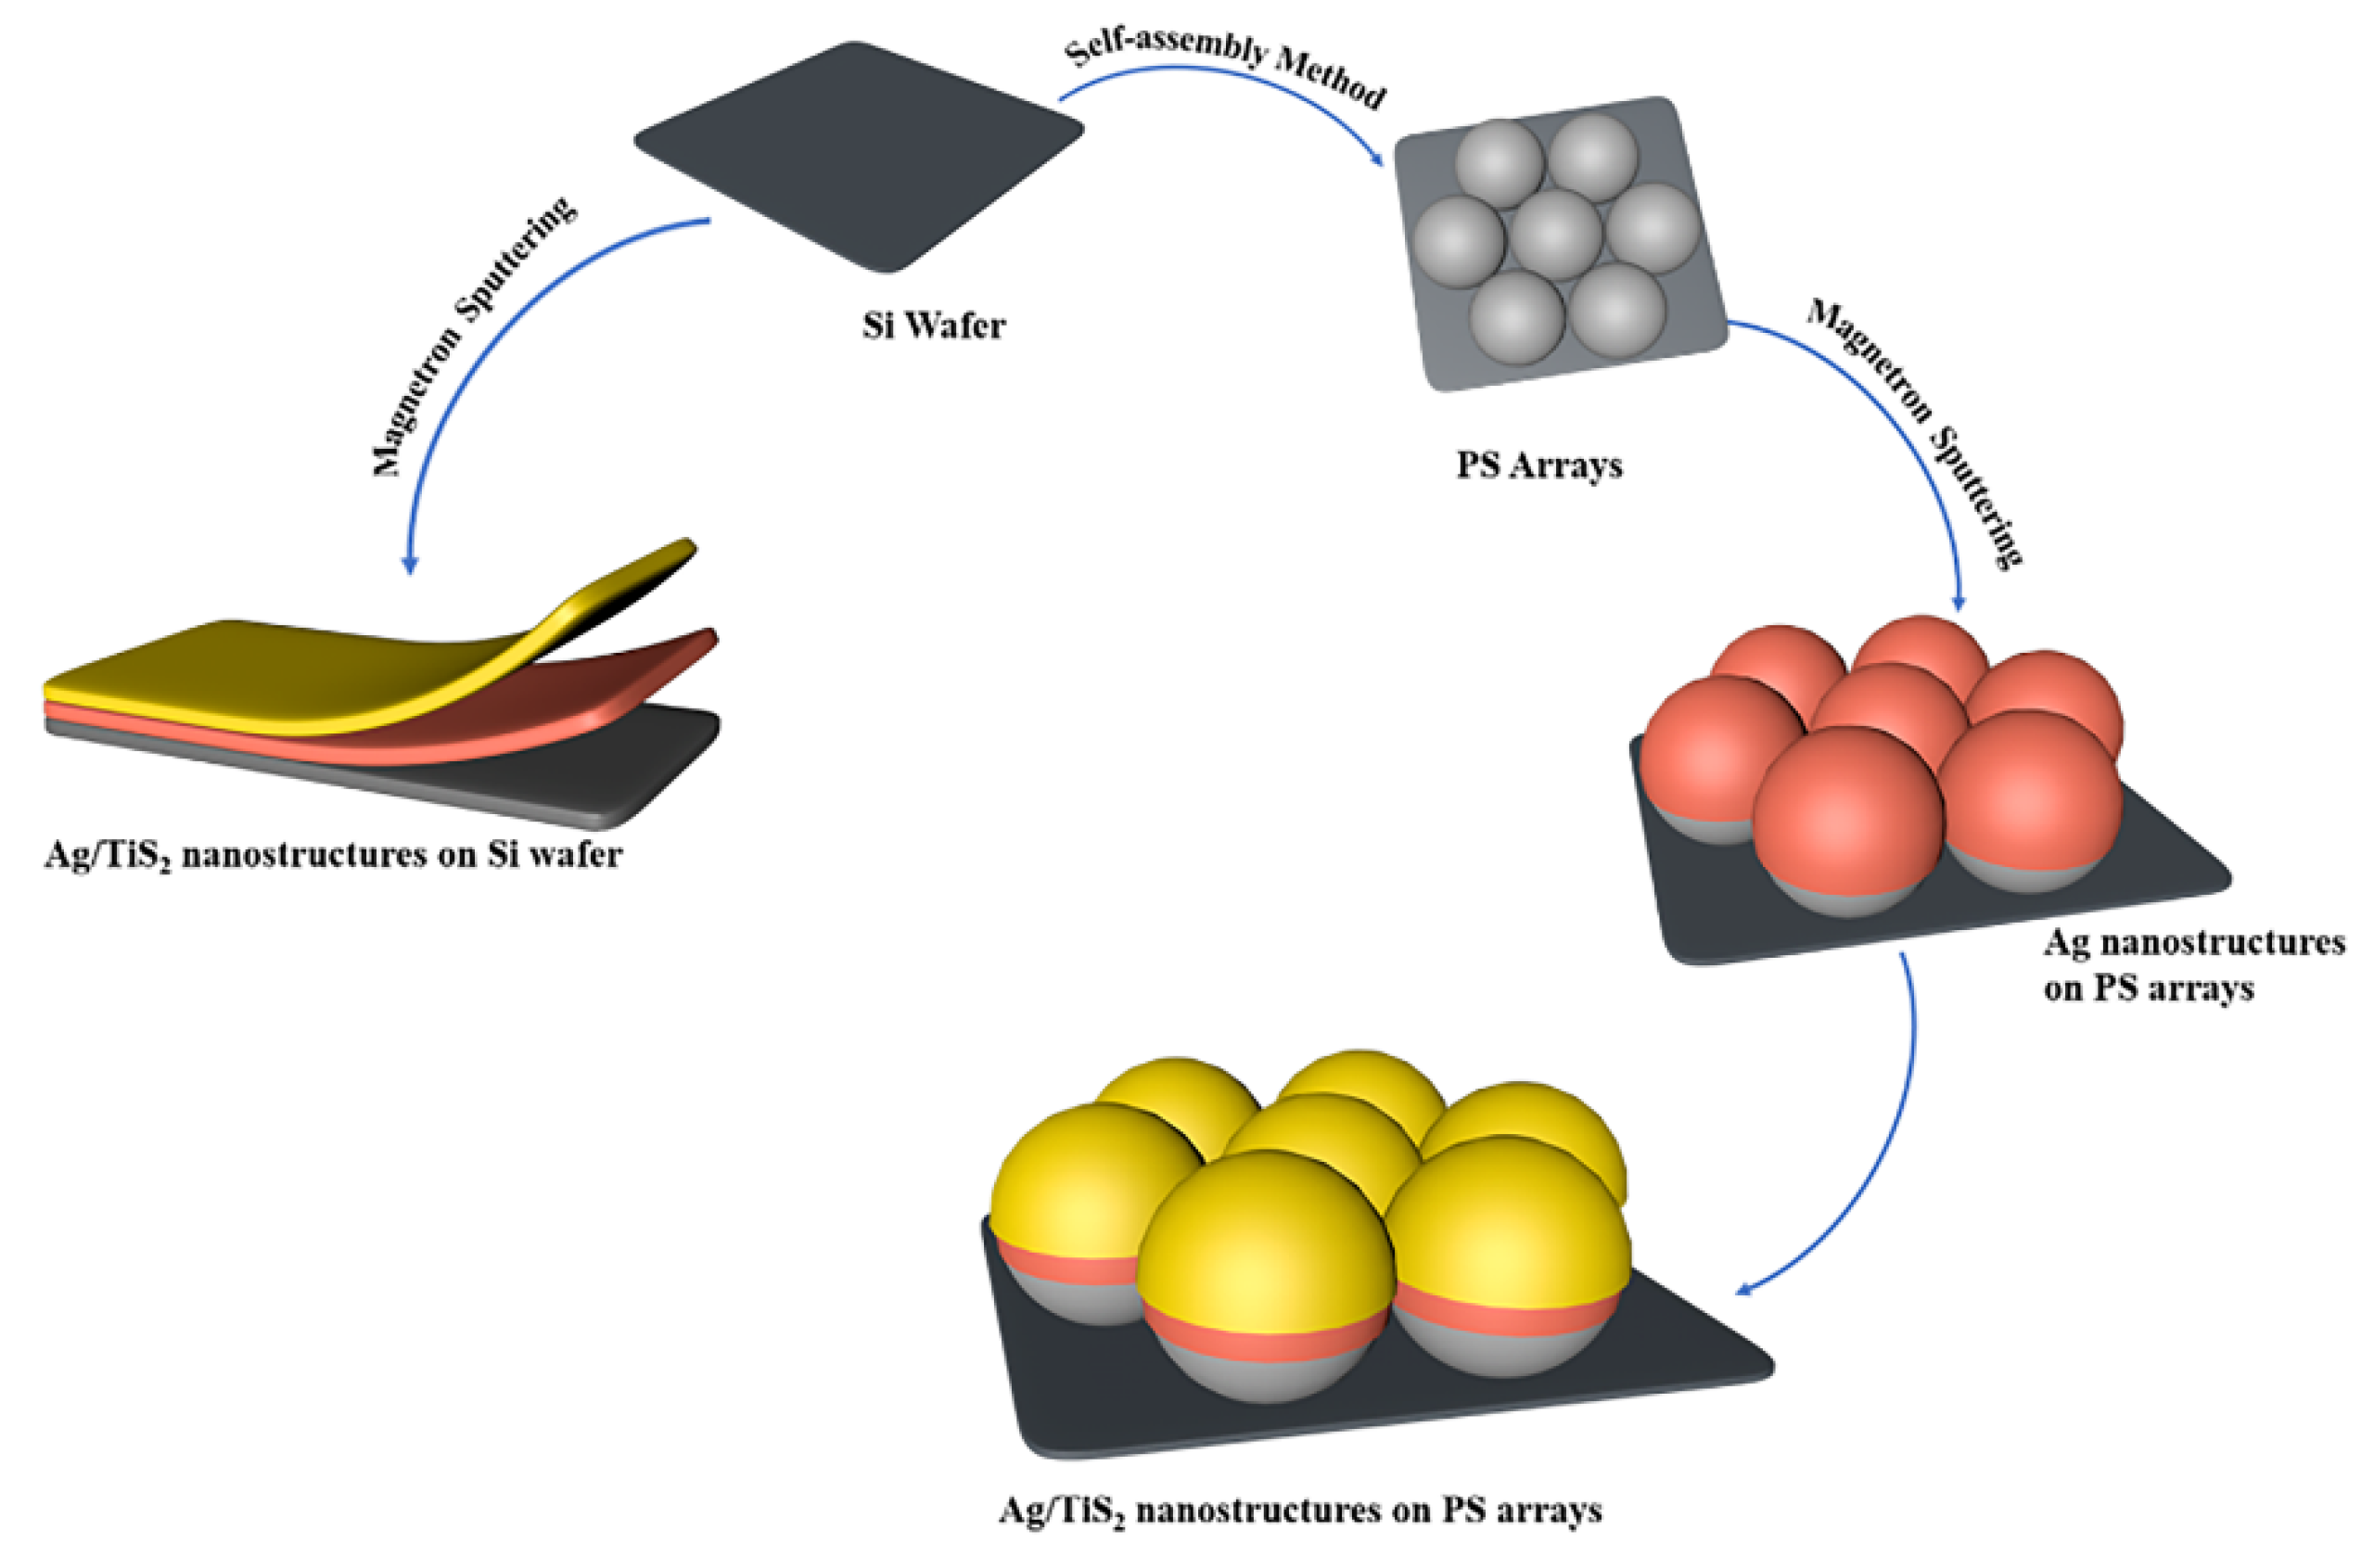
Figure 1. The preparation schematic diagram of the Ag/TiS2 nanostructure on Si wafers and PS arrays.
Molecules 25 04551 g001
Figure 2. Scanning electron microscope (SEM) images of the Ag 10 nm/TiS2 (t nm) nanostructures on PS. (A) 2, (B) 5, (C) 10, (D) 20, (E) 30, and (F) 60 nm. The insets are the corresponding optical photos.
Molecules 25 04551 g002
Figure 3. SEM images of Ag 10 nm/TiS2 (t nm) nanostructures on Si wafers. (A) 2, (B) 5, (C) 10, (D) 20, (E) 30, and (F) 60 nm. The insets are the optical photos.
Molecules 25 04551 g003
Figure 4. TEM and HRTEM images of (A,A1) Ag 10 nm/TiS2 (2 nm) nanostructures and (B,B1) Ag 10 nm/TiS2 (30 nm) nanostructures. The EDS elemental mapping is shown in (B).
Molecules 25 04551 g004
Figure 5. (A) UV–Vis–NIR spectra and (B) Hall effect for the Ag 10 nm/TiS2 (t = 2, 5, 10, 20, 30, 60 nm) nanostructures on PS, and the table inset is the original data.
Molecules 25 04551 g005
Figure 6. (A) UV–Vis–NIR spectra and (B) Hall effect for the Ag 10 nm/TiS2 (t nm) nanostructures without PS, and the table inset is the raw data.
Molecules 25 04551 g006
Figure 7. The different spectra of UV–Vis–NIR spectra for (A) Ag 10 nm/TiS2 (t nm) nanostructures and (B) Ag 5 nm/TiS2 (t nm) nanostructures.
Molecules 25 04551 g007
Figure 8. UV–Vis–NIR spectra for the Ag (t = 5, 10, 20, 30, 50 nm)/TiS2 (2 nm) nanostructures.
Molecules 25 04551 g008
Figure 9. SERS spectra of Ag 10 nm/TiS2 (t = 2, 5, 10, 20, 30, 60 nm) nanostructures on PS.
Molecules 25 04551 g009