
Contribution of the Multiplicity Fluctuation in the Temperature Dependence of Phonon Spectra of Rare-Earth Cobaltites

 , ,
, ,  ,
, 
Abstract
1. Introduction
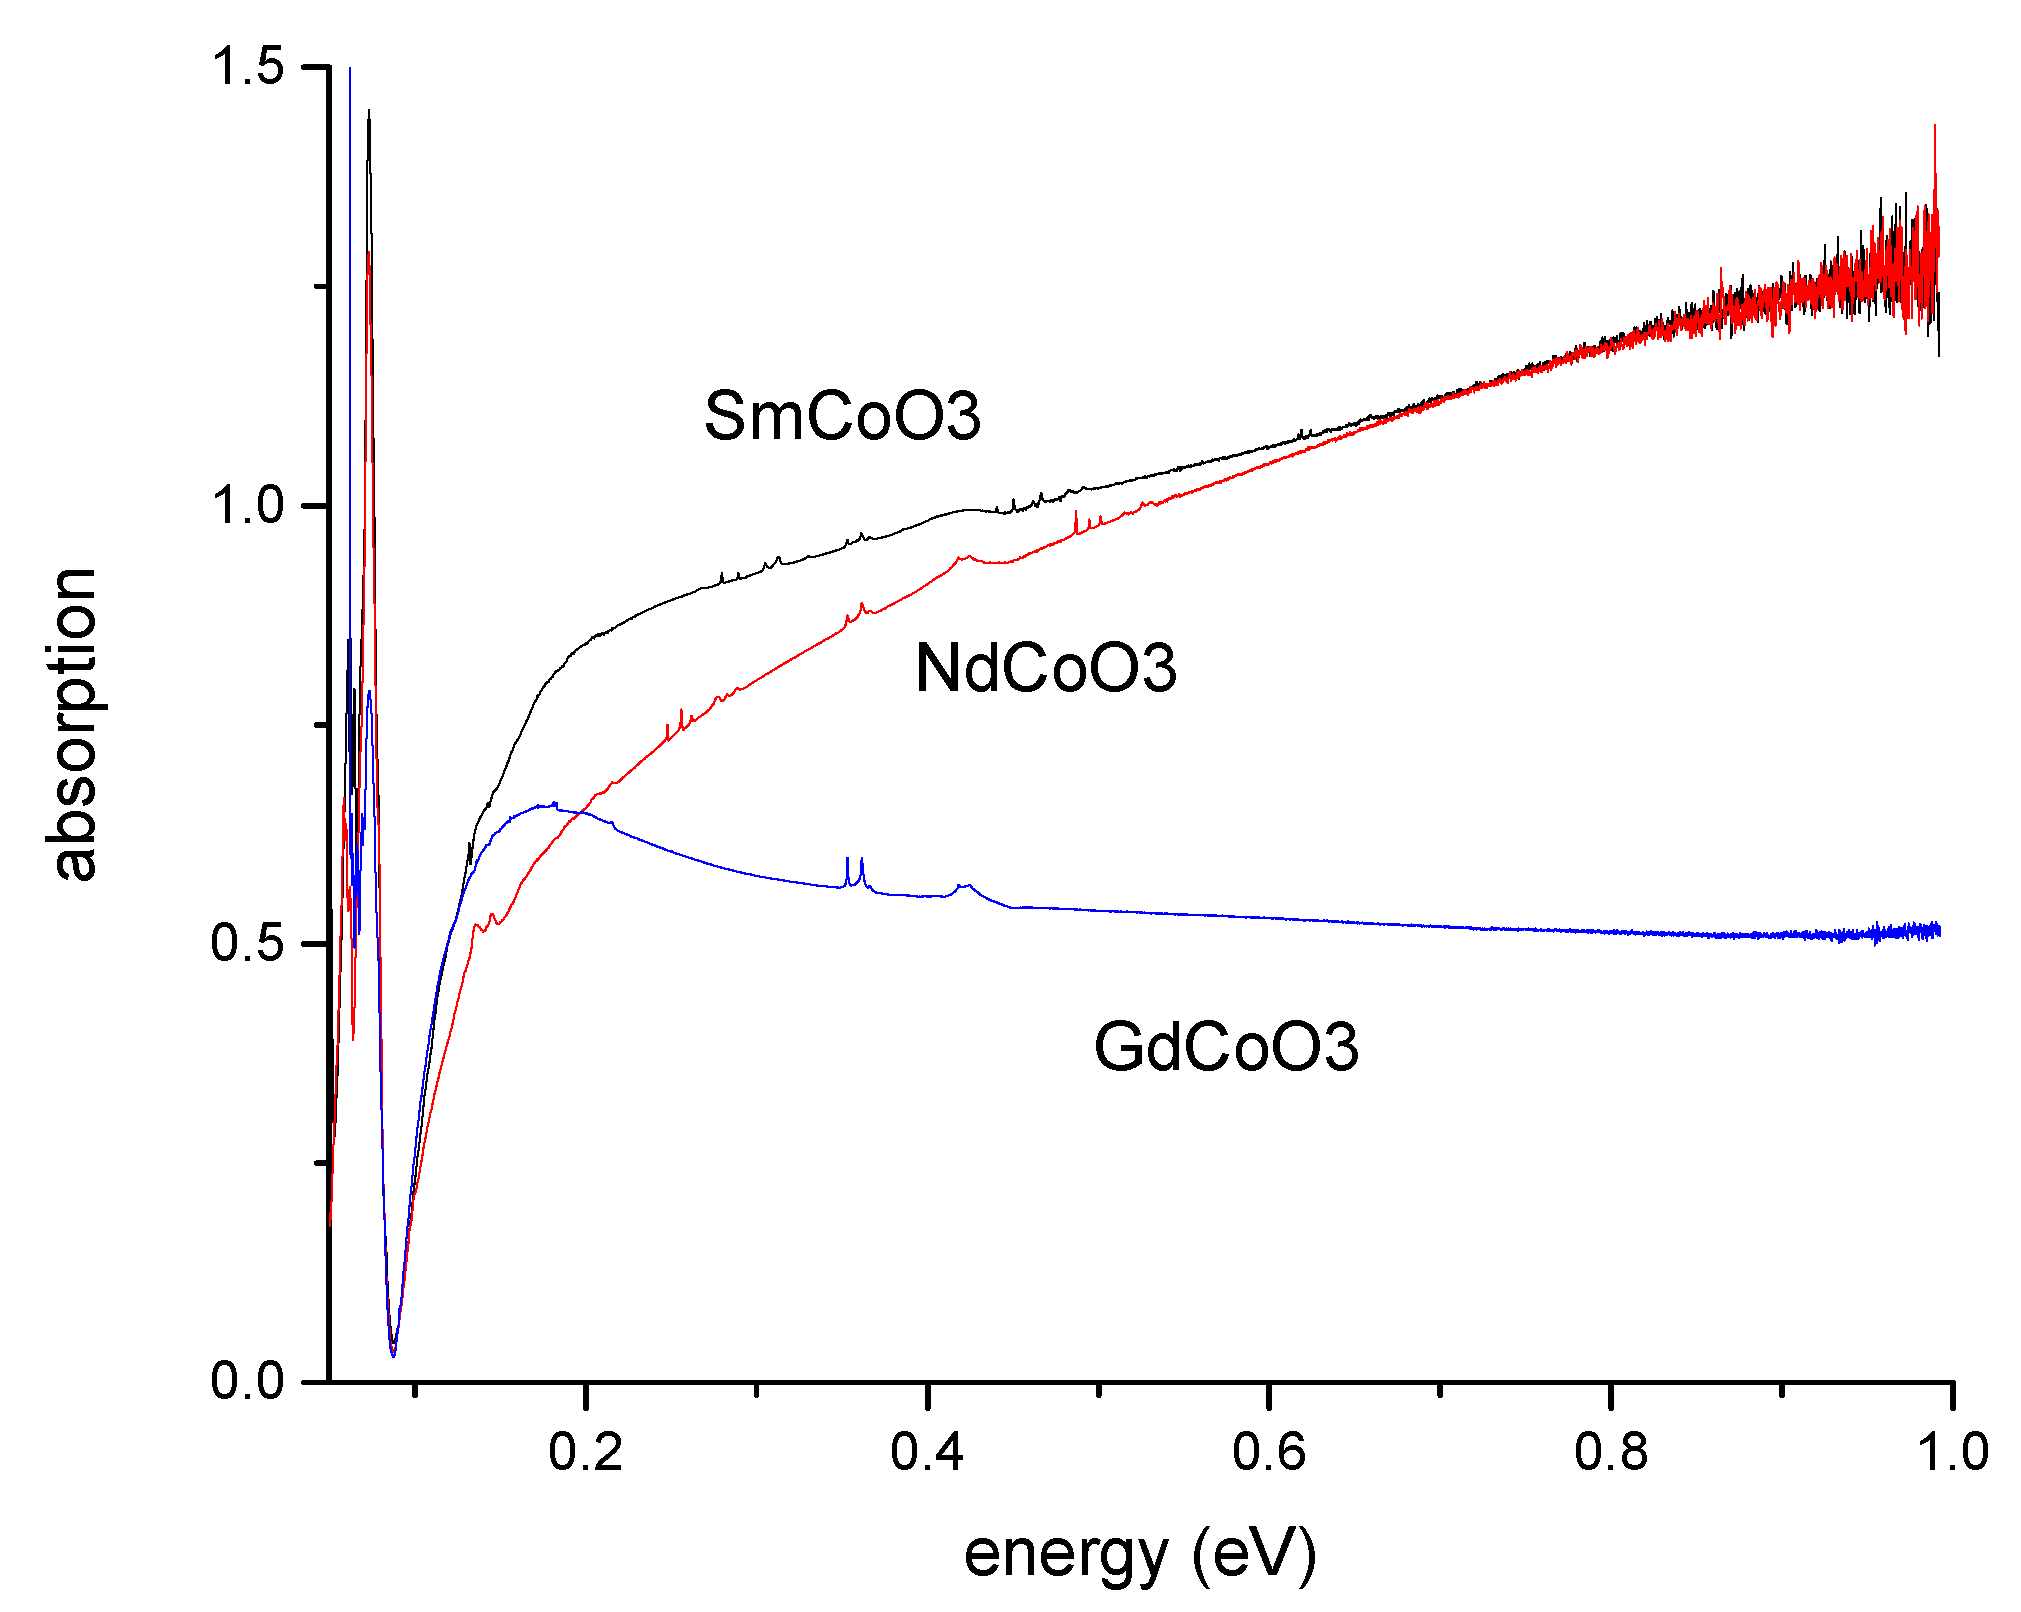
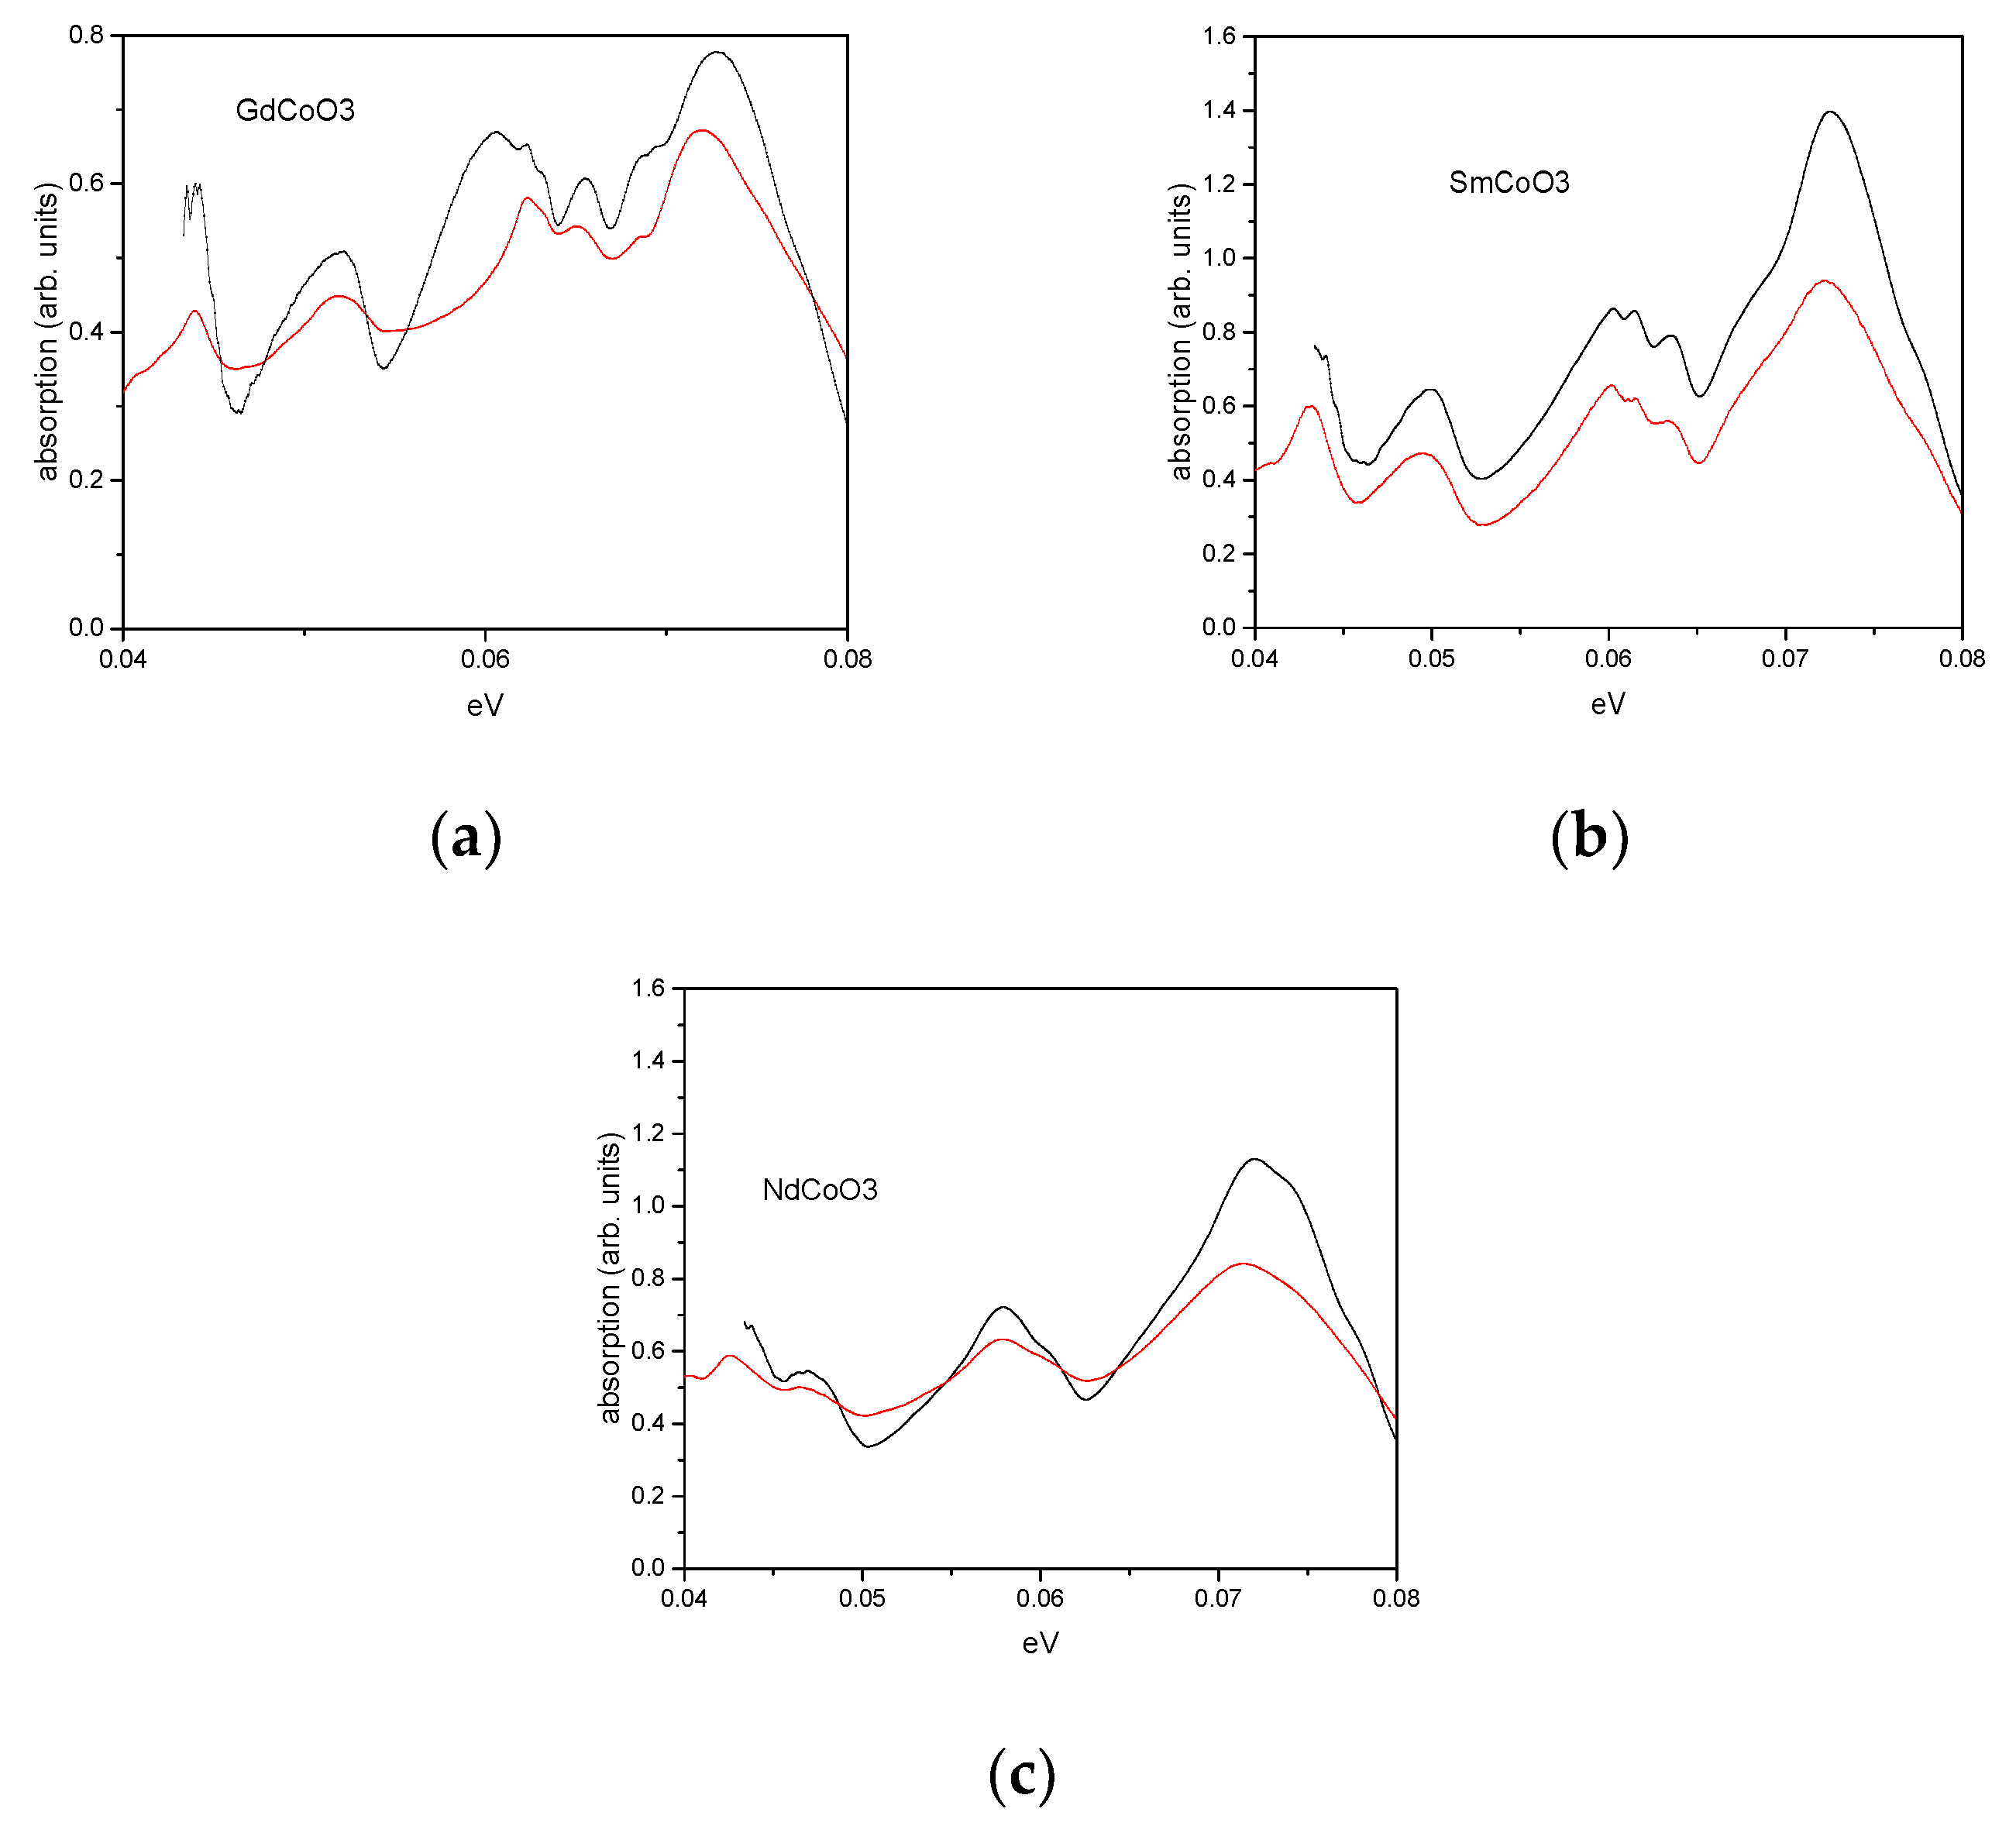
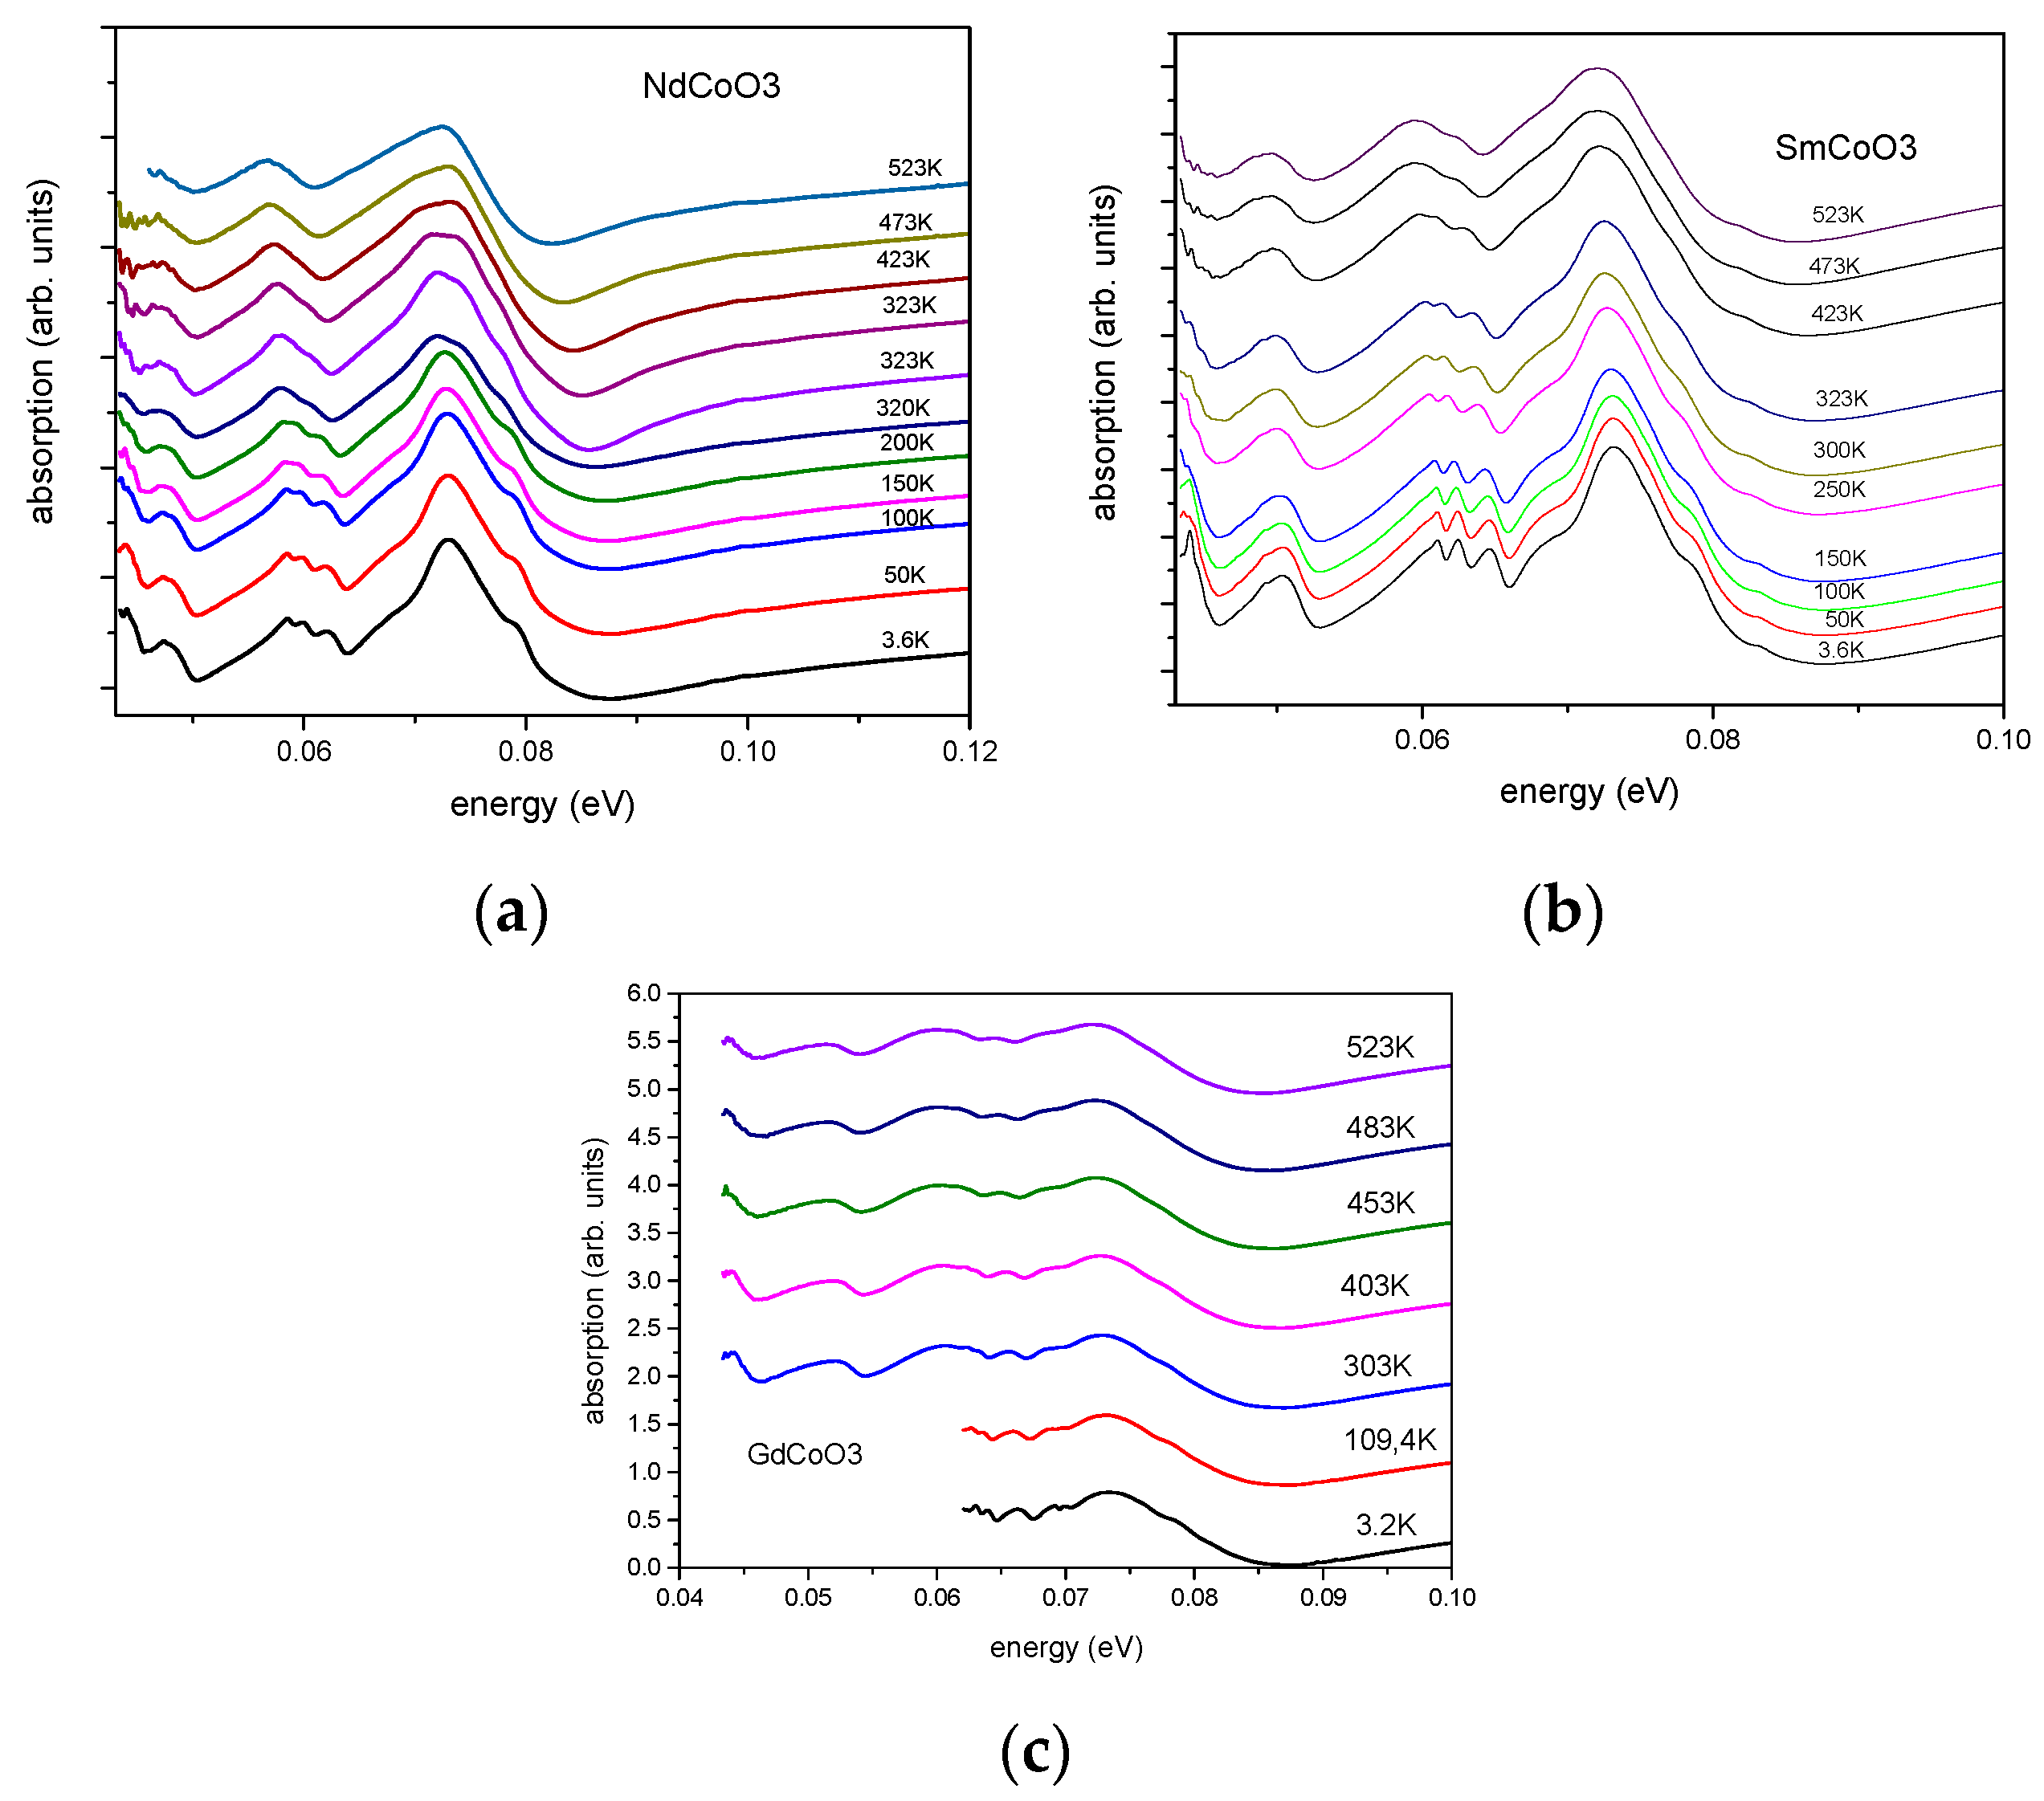
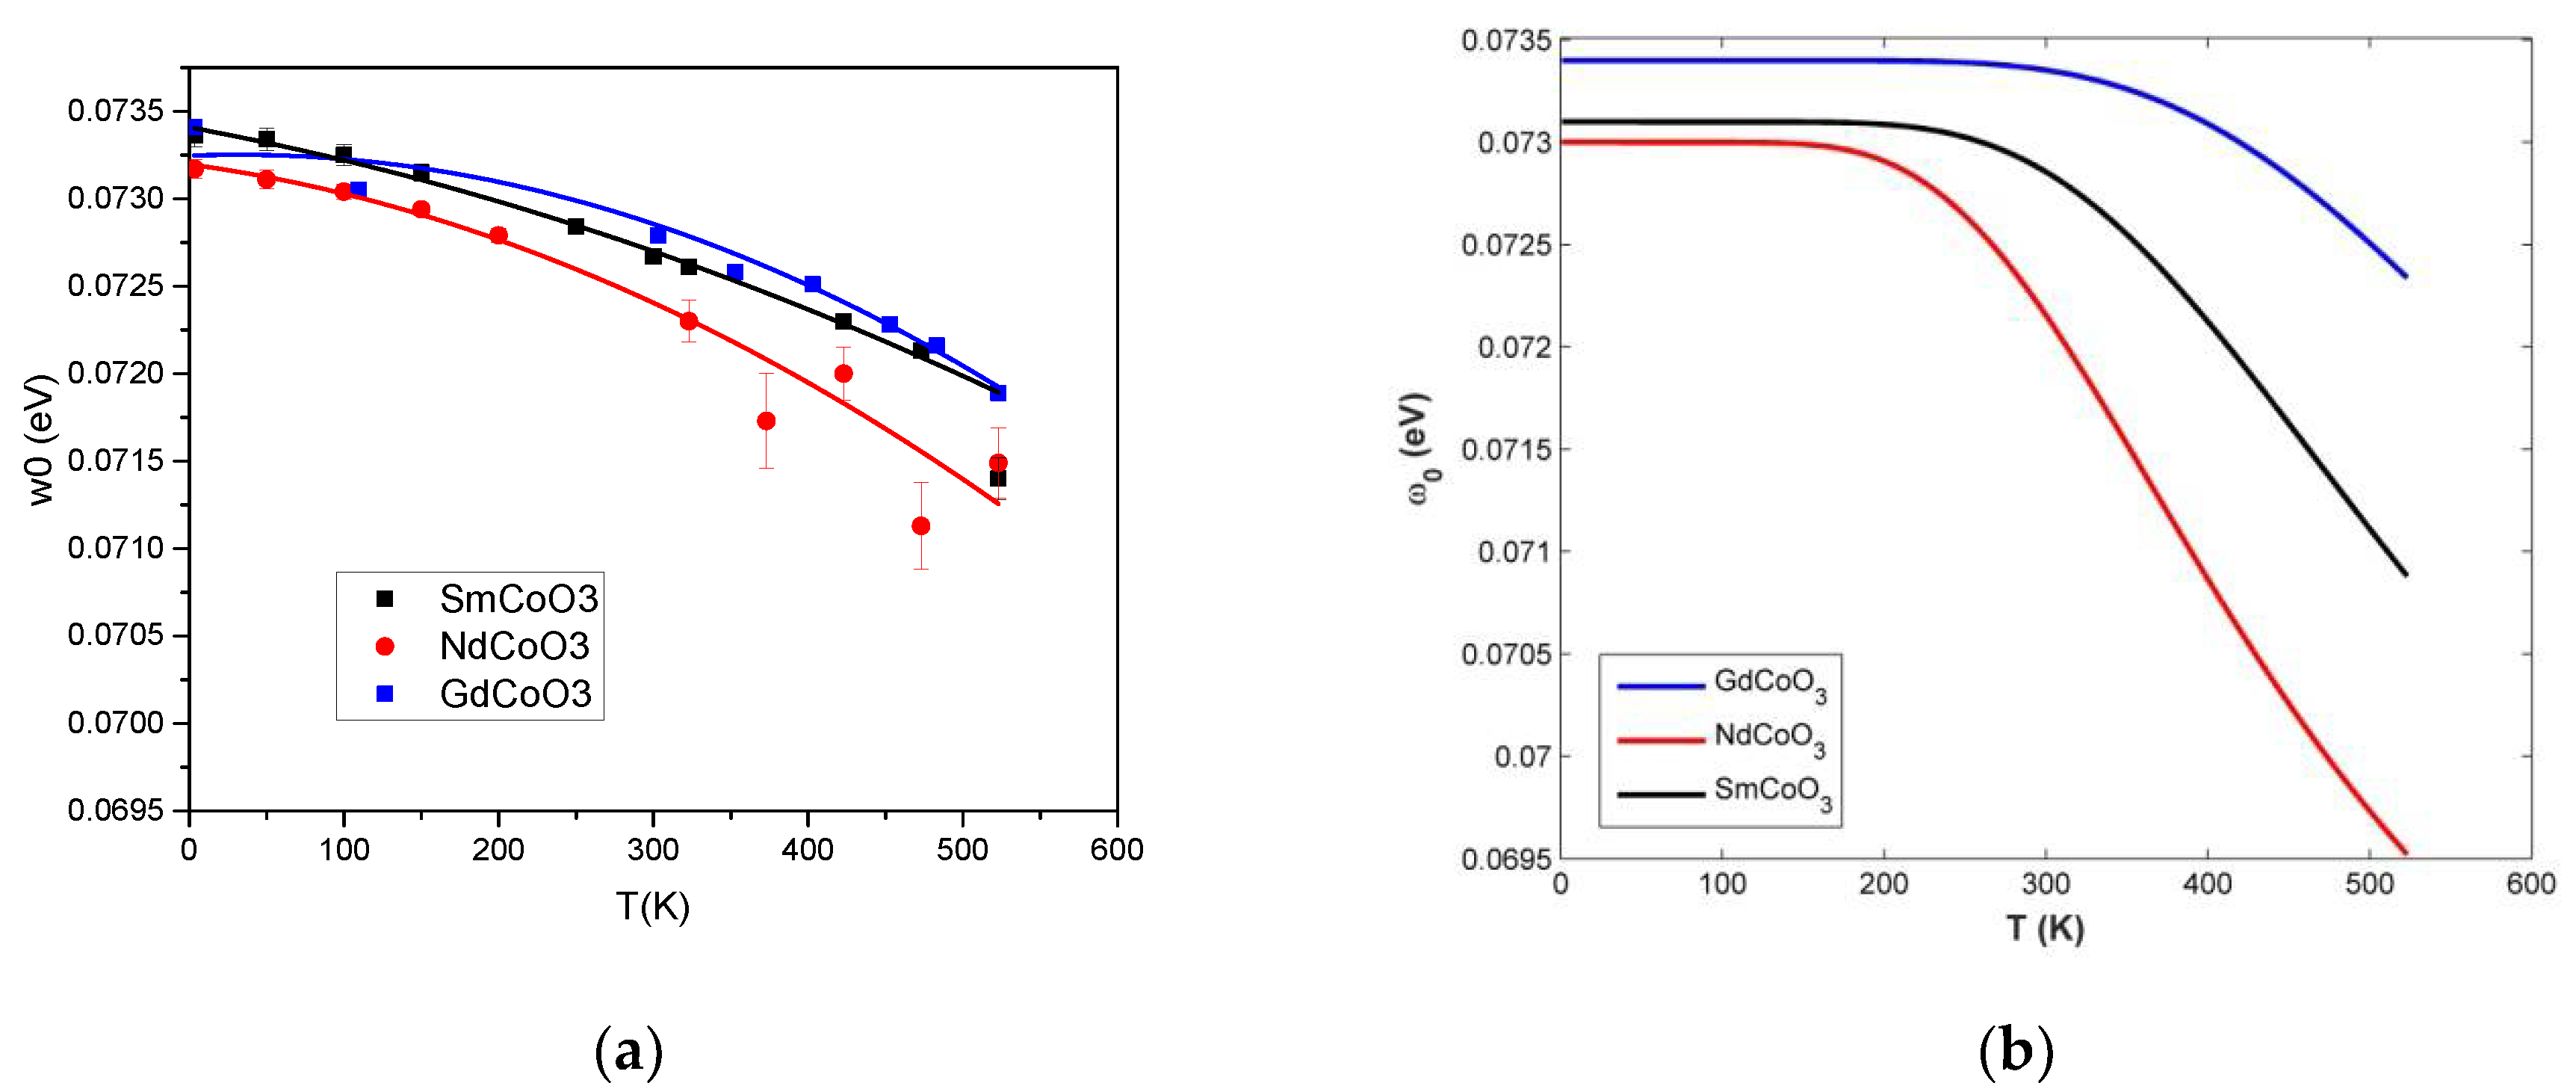
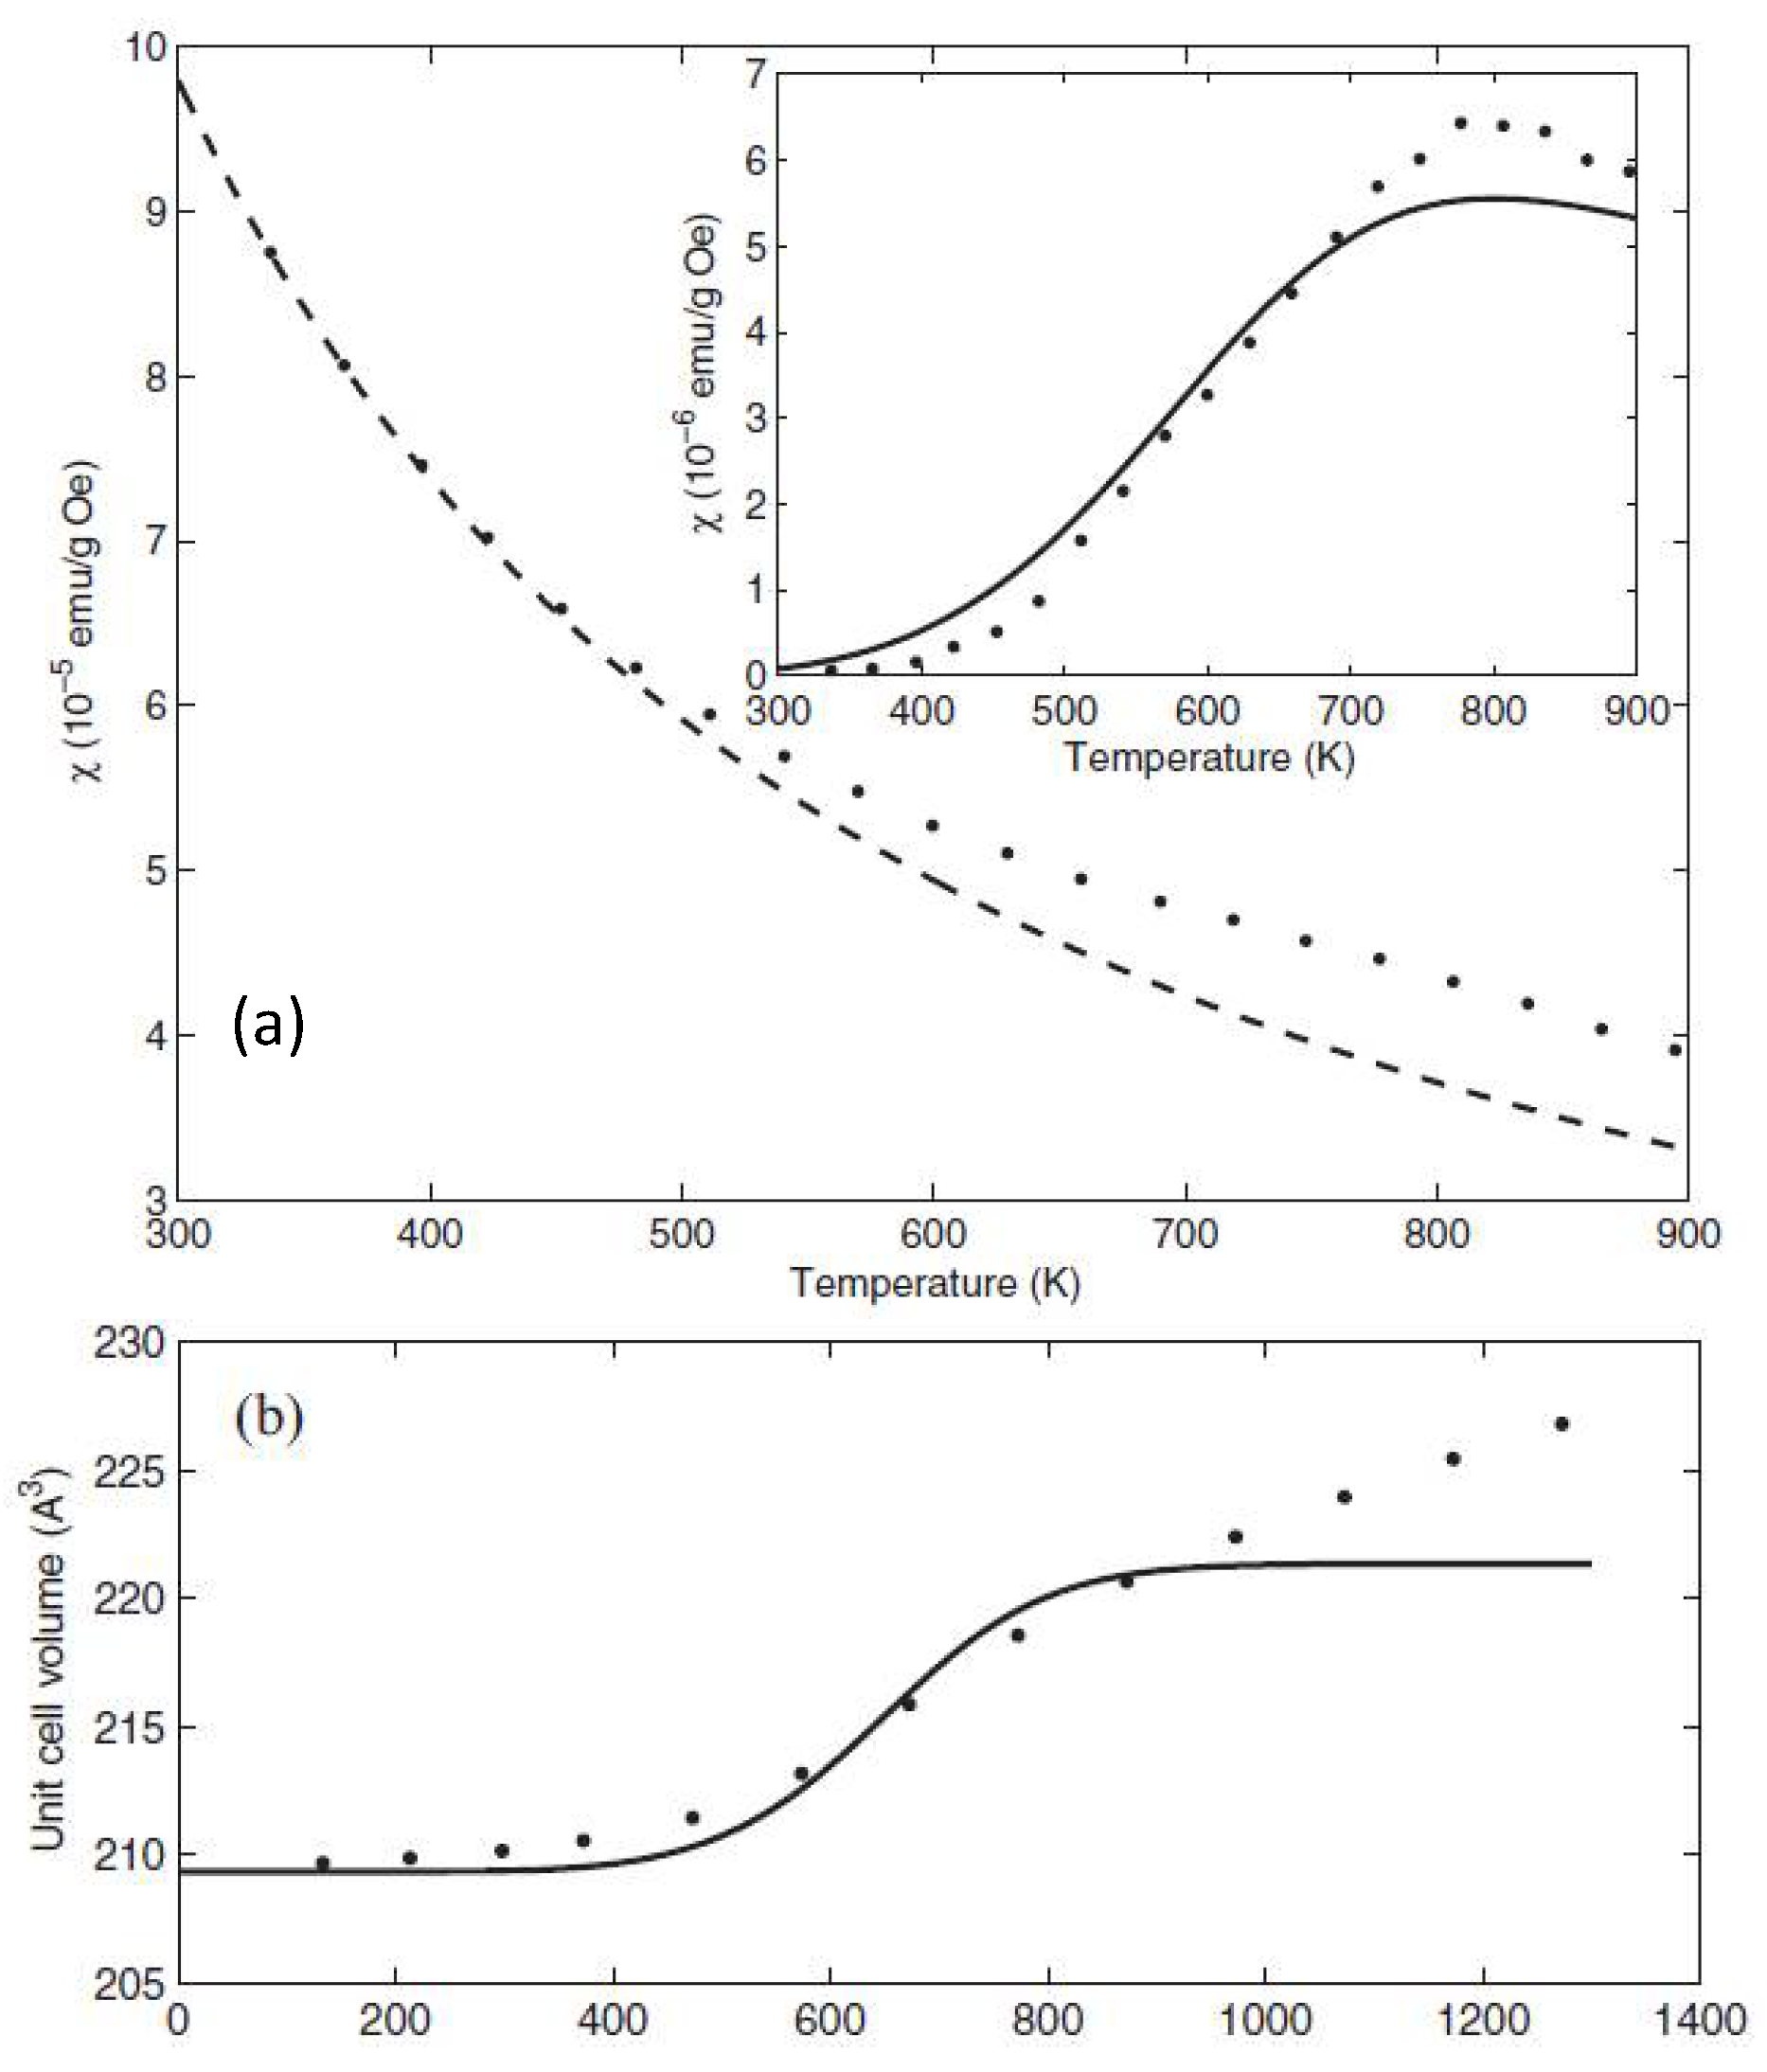
2. Results
3. Discussion
3.1. Ab Initio Calculation of Optical Phonons in GdCoO3
3.2. Effect of Electron–Phonon Interactionon Temperature Dependence of the Phonon Energy
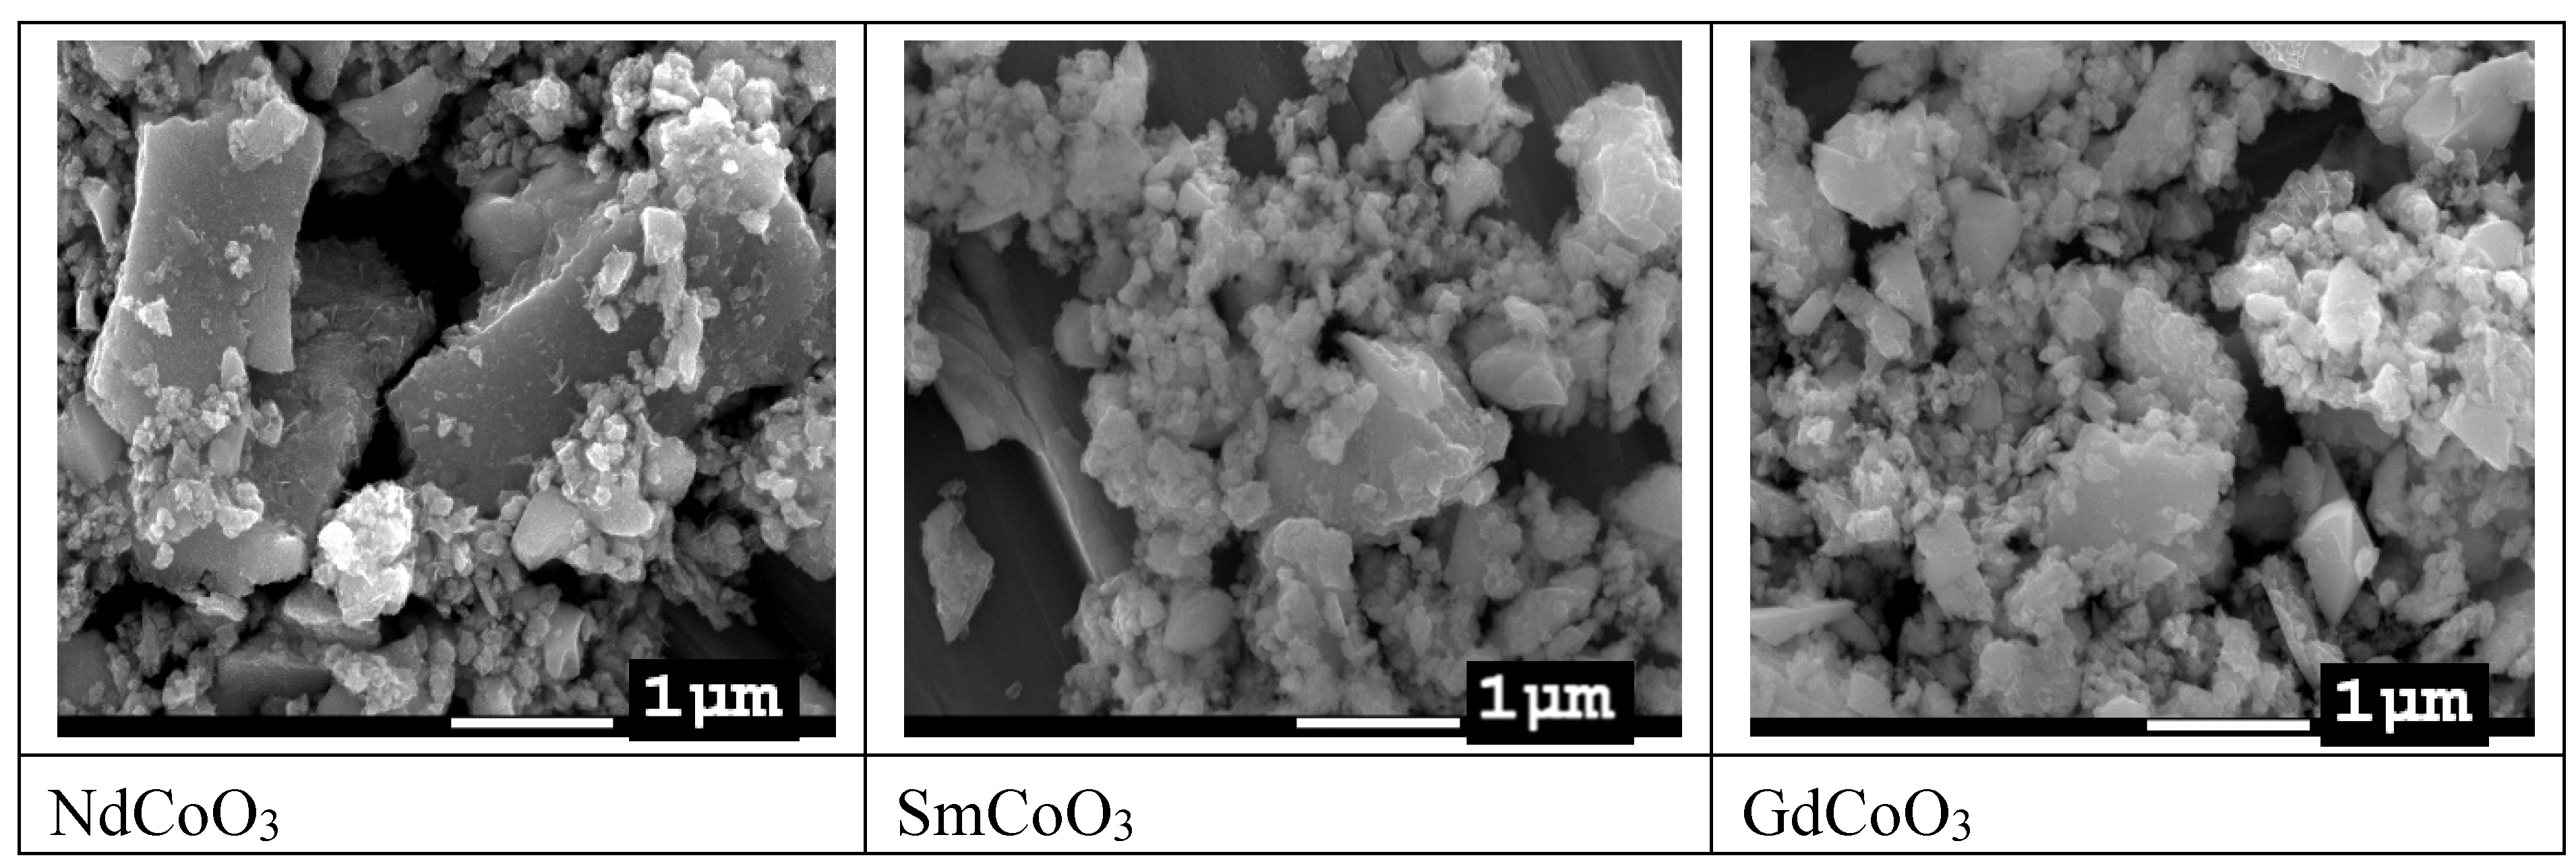
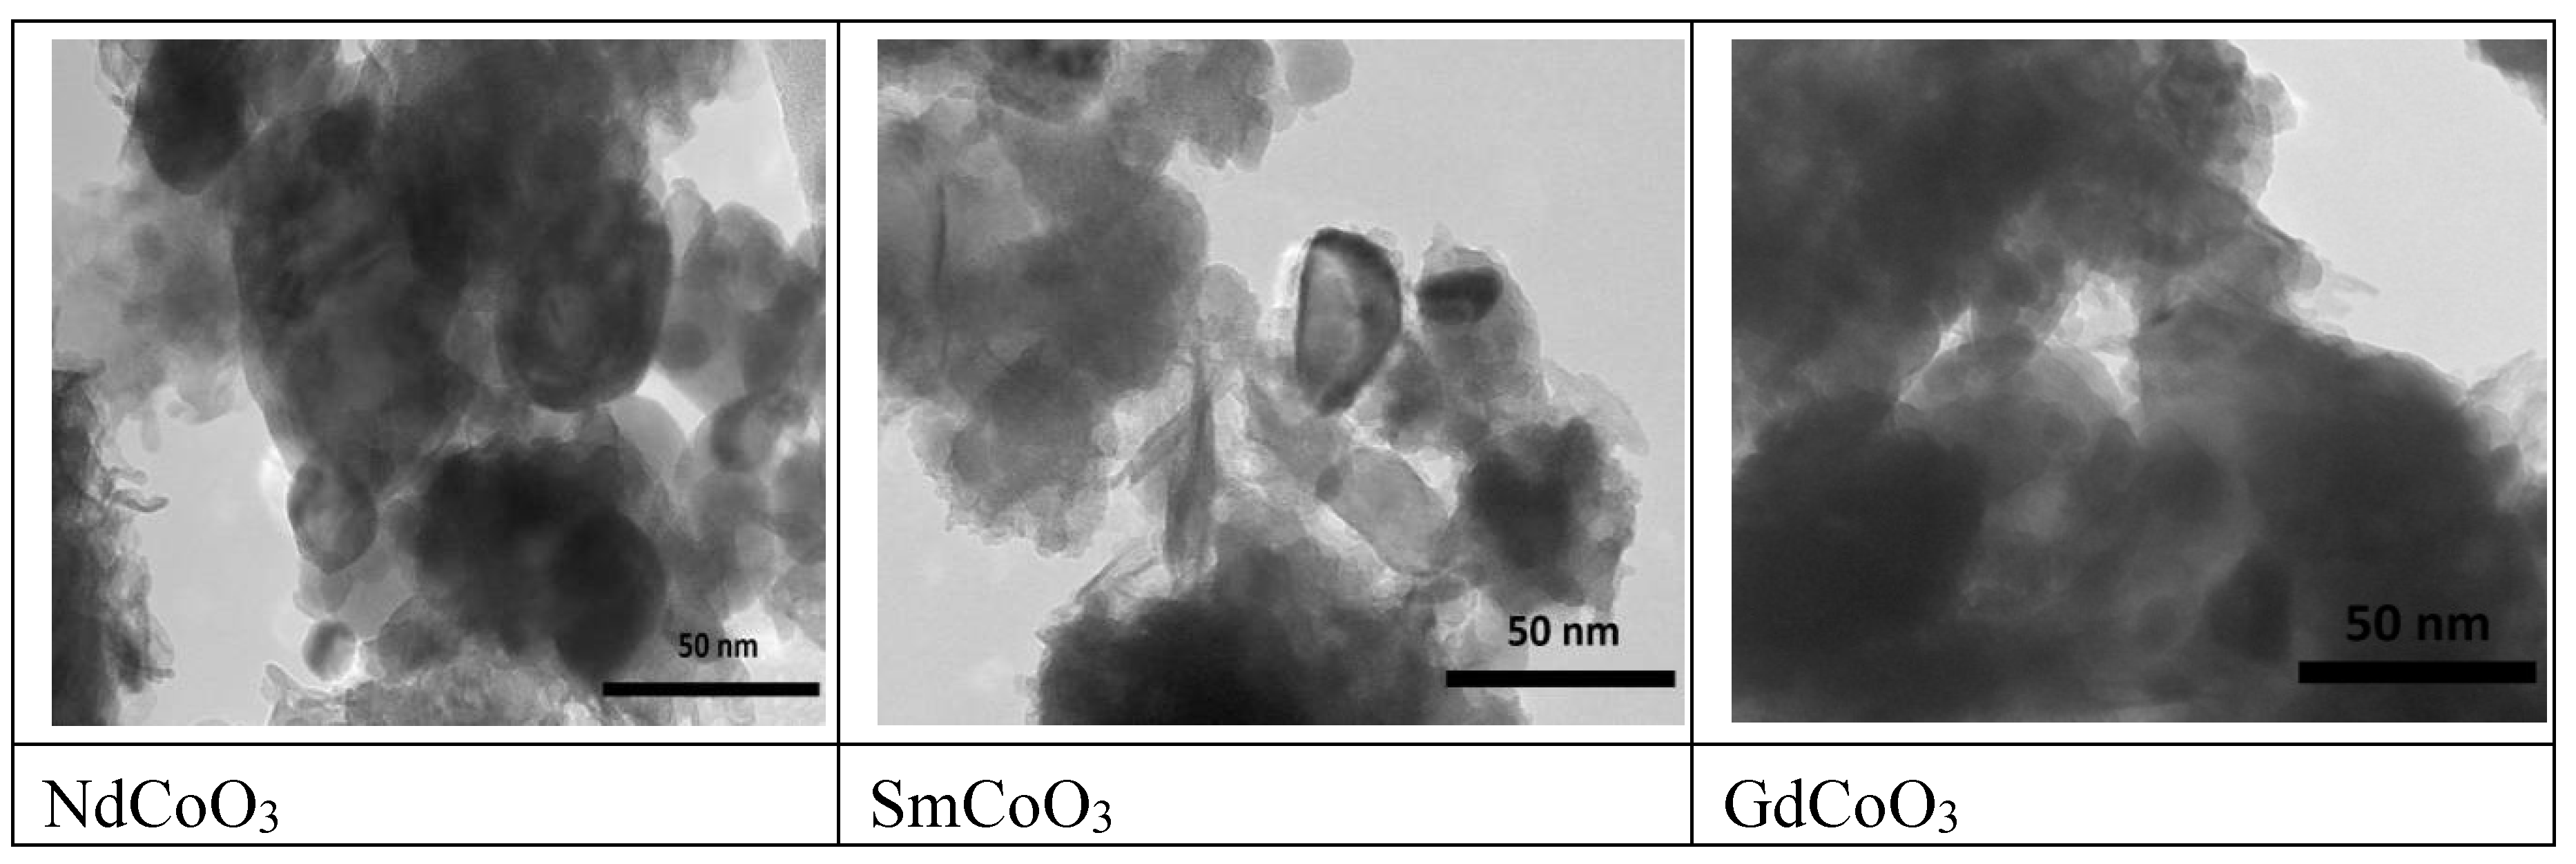
4. Samples and Experimental Methods
5. Conclusions
Author Contributions
Funding
Conflicts of Interest
References
- Lyubutin, I.S.; Gavriliuk, A.G. Research on phase transformations in 3d-metal oxides at high and ultrahigh pressure: State of the art. Phys. Usp. 2009, 52, 989–1017. [Google Scholar] [CrossRef]
- Gütlich, P.; Goodwin, H.A. Spin Crossover in Transition Metal Compounds I–III; Springer: Berlin/Heidelberg, Germany, 2004. [Google Scholar]
- Halcrow, M.A. Spin-Crossover Materials: Properties and Applications; John Wiley & Sons, Ltd.: Oxford, UK, 2013. [Google Scholar]
- Aromi, G.; Real, J.A. Special Issue “Spin Crossover Research”. Magnetochemistry 2016, 2, 28. [Google Scholar] [CrossRef]
- Kitazawa, T. Special Issue “Synthesis and applications of New Spin Crossover Compounds”. Crystals 2019, 9, 382. [Google Scholar] [CrossRef]
- Raccah, P.M.; Goodenough, J.B. First-order localized-electron ⇆ Collective-electron transition in LaCoO3. Phys. Rev. 1967, 155, 932–943. [Google Scholar] [CrossRef]
- Bhide, V.G.; Rajoria, D.S. Mössbauer studies of the high-spin-low-spin equilibria and the localized collective electron transition in LaCoO3. Phys. Rev. B 1972, 6, 1021–1032. [Google Scholar] [CrossRef]
- Knížek, K.; Jirak, Z.; Hejtmanek, J.; Veverka, M.; Marysko, M.; Maris, G.; Palstra, T.T.M. Structural anomalies associated with the electronic and spin transitions in LnCoO3. Eur. Phys. J. B Condens. Matter Complex Syst. 2005, 47, 213–220. [Google Scholar] [CrossRef]
- Alonso, J.A.; Martinez-Lope, M.J.; de la Calle, C.; Pomjakushin, V. Preparation and structural study from neutron diffraction data of RCoO3 (R = Pr, Tb, Dy, Ho, Er, Tm, Yb, Lu) perovskites. J. Mater. Chem. 2006, 16, 1555–1560. [Google Scholar] [CrossRef]
- Berggold, K.; Kriener, M.; Becker, P.; Benomar, M.; Reuther, M.; Zobel, C.; Lorenz, T. Anomalous expansion and phonon damping due to the Co spin-state transition in RCoO3 (R = La, Pr, Nd, and Eu). Phys. Rev. B 2008, 78, 134402. [Google Scholar] [CrossRef]
- Ovchinnikov, S.G.; Orlov, Y.S.; Dudnikov, V.A. Temperature and Field Dependent Electronic Structure and Magnetic Properties of LaCoO3 and GdCoO3. J. Magn. Magn. Mater. 2012, 324, 3584–3587. [Google Scholar] [CrossRef]
- Orlov, Y.S.; Solovyov, L.A.; Dudnikov, V.A.; Fedorov, A.S.; Kuzubov, A.A.; Kazak, N.V.; Voronov, V.N.; Vereshchagin, S.N.; Shishkina, N.N.; Perov, N.S.; et al. Structural properties and high-temperature spin and electronic transitions in GdCoO3: Experiment and theory. Phys. Rev. B 2013, 88, 235105. [Google Scholar] [CrossRef]
- Dudnikov, V.A.; Orlov, Y.S.; Kazak, N.V.; Platunov, M.S.; Ovchinnikov, S.G. Anomalies of the electronic structure and physical properties of rare-earth cobaltites near spin crossover. JETP Lett. 2016, 104, 588. [Google Scholar] [CrossRef]
- Dudnikov, V.A.; Orlov, Y.S.; Solovyov, L.A.; Vereshchagin, S.N.; Gavrilkin, S.Y.; Tsvetkov, A.Y.; Velikanov, D.A.; Gorev, M.V.; Novikov, S.V.; Ovchinnikov, S.G. Effect of Multiplicity Fluctuation in Cobalt Ions on Crystal Structure, Magnetic and Electrical Properties of NdCoO3 and SmCoO3. Molecules 2020, 25, 1301. [Google Scholar] [CrossRef] [PubMed]
- Kim, Y.Y.; Lee, D.H.; Kwon, T.Y.; Park, S.H. Infrared Spectra and Seebeck Coefficient of LnCoO3 with the Perovskite Structure. J. Sol. State Chem. 1994, 112, 376. [Google Scholar] [CrossRef]
- Hohenberg, P.; Kohn, W. Density functional theory (DFT). Phys. Rev. 1964, 136, B864. [Google Scholar] [CrossRef]
- Kresse, G.; Hafner, J. Ab initio molecular dynamics for liquid metals. Phys. Rev. B 1993, 47, 558. [Google Scholar] [CrossRef]
- Kresse, G.; Furthmüller, J. Efficient iterative schemes for ab initio total-energy calculations using a plane-wave basis set. Phys. Rev. B 1996, 54, 11169. [Google Scholar] [CrossRef]
- Perdew, J.P.; Burke, K.; Ernzerhof, M. Generalized gradient approximation made simple. Phys. Rev. Letters 1996, 77, 3865. [Google Scholar] [CrossRef]
- Blöchl, P.E. Projector augmented-wave method. Phys. Rev. B 1994, 50, 17953. [Google Scholar] [CrossRef]
- Monkhorst, H.J.; Pack, J.D. Special points for Brillouin-zone integrations. Phys. Rev. B 1976, 13, 5188. [Google Scholar] [CrossRef]
- Togo, A.; Tanaka, I. First principles phonon calculations in materials science. Scr. Mater. 2015, 108, 1–5. [Google Scholar] [CrossRef]
- Nakamoto, K. Infrared and Raman Spectra of Inorganic and Coordination Compounds, Part A: Theory and Applications in Inorganic Chemistry, 6th ed.; John Wiley & Sons: Hoboken, NJ, USA, 2009. [Google Scholar]
- Bussmann-Holder, A. Ferroelectricity and superconductivity: Two competing phenomena. Ferroelectrics 1993, 144, 173. [Google Scholar] [CrossRef]
- Lipari, N.O.; Duke, C.B.; Pietronero, L. Electron–vibration interactions in benzene and deuterobenzene. J. Chem. Phys. 1976, 65, 1165. [Google Scholar] [CrossRef]
- Painelli, A.; Girlando, A. Electron–molecular vibration (e–mv) coupling in charge-transfer compounds and its consequences on the optical spectra: A theoretical framework. J. Chem. Phys. 1986, 84, 5655. [Google Scholar] [CrossRef]
- Ovchinnikov, S.G.; Val’kov, V.V. Hubbard Operators in the Theory of Strongly Correlated Electrons; Imperial College Press: London, UK, 2004. [Google Scholar]
- Orlov, Y.S.; Nikolaev, S.V.; Ovchinnikov, S.G.; Nesterov, A.I. Ultrafast quantum dynamics of relaxation in magnetic system with spin crossover under the sudden excitation. JETP Lett. 2020, 112, 268–274. [Google Scholar]
- D’Avino, G.; Painelli, A.; Boukheddaden, K. Vibronic model for spin crossover complexes. Phys. Rev. B 2011, 84, 104119. [Google Scholar] [CrossRef]
- Shim, S.-H.; Duffy, T.S. Raman spectroscopy of Fe2O3 to 62 GPa. Am. Mineral. 2002, 87, 318–326. [Google Scholar] [CrossRef]
- Mattuck, R.D. A Guide to Feynman Diagrams in the Many-Body Problem, 2nd ed.; McGraw-Hill: New York, NY, USA, 1976. [Google Scholar]
- Migoni, R.; Bilz, H.; Bauerle, D. Origin of Raman Scattering and Ferroelectricity in Oxidic Perovskites. Phys. Rev. Lett. 1976, 37, 1155. [Google Scholar] [CrossRef]
- Bilz, H.; Bedenek, G.; Bussmann-Holder, A. Theory of ferroelectricity: The polarizability model. Phys. Rev. B 1987, 35, 4840. [Google Scholar] [CrossRef]
- Bussmann-Holder, A.; Simon, A.; Buttner, H. Possibility of a common origin to ferroelectricity and superconductivity in oxides. Phys. Rev. B 1989, 39, 207. [Google Scholar] [CrossRef]
Sample Availability: Samples of the compounds are not available from the authors. |


| Mode | B2u | B3g | B2g |
|---|---|---|---|
| Energy, theor., meV | 67.3 | 68.4 | 70.4 |
| Energy, exper., meV | 66.3 | 68.8 | 73.3 |
© 2020 by the authors. Licensee MDPI, Basel, Switzerland. This article is an open access article distributed under the terms and conditions of the Creative Commons Attribution (CC BY) license (http://creativecommons.org/licenses/by/4.0/).
Share and Cite
Orlov, Y.S.; Sokolov, A.E.; Dudnikov, V.A.; Shulga, K.V.; Volochaev, M.N.; Zharkov, S.M.; Shestakov, N.P.; Vysotin, M.A.; Ovchinnikov, S.G. Contribution of the Multiplicity Fluctuation in the Temperature Dependence of Phonon Spectra of Rare-Earth Cobaltites. Molecules 2020, 25, 4316. https://doi.org/10.3390/molecules25184316
Orlov YS, Sokolov AE, Dudnikov VA, Shulga KV, Volochaev MN, Zharkov SM, Shestakov NP, Vysotin MA, Ovchinnikov SG. Contribution of the Multiplicity Fluctuation in the Temperature Dependence of Phonon Spectra of Rare-Earth Cobaltites. Molecules. 2020; 25(18):4316. https://doi.org/10.3390/molecules25184316
Chicago/Turabian StyleOrlov, Yuri S., Alexey E. Sokolov, Vyacheslav A. Dudnikov, Karina V. Shulga, Mikhail N. Volochaev, Sergey M. Zharkov, Nikolay P. Shestakov, Maxim A. Vysotin, and Sergei G. Ovchinnikov. 2020. "Contribution of the Multiplicity Fluctuation in the Temperature Dependence of Phonon Spectra of Rare-Earth Cobaltites" Molecules 25, no. 18: 4316. https://doi.org/10.3390/molecules25184316
APA StyleOrlov, Y. S., Sokolov, A. E., Dudnikov, V. A., Shulga, K. V., Volochaev, M. N., Zharkov, S. M., Shestakov, N. P., Vysotin, M. A., & Ovchinnikov, S. G. (2020). Contribution of the Multiplicity Fluctuation in the Temperature Dependence of Phonon Spectra of Rare-Earth Cobaltites. Molecules, 25(18), 4316. https://doi.org/10.3390/molecules25184316