
GuttaFlow® Bioseal Cytotoxicity Assessment: In Vitro Study


 , , ,
, , ,  ,
,  ,
,  and
and
Abstract
1. Introduction
2. Results
2.1. Metabolic Activity
2.2. Cell Viability and Types of Cell Death
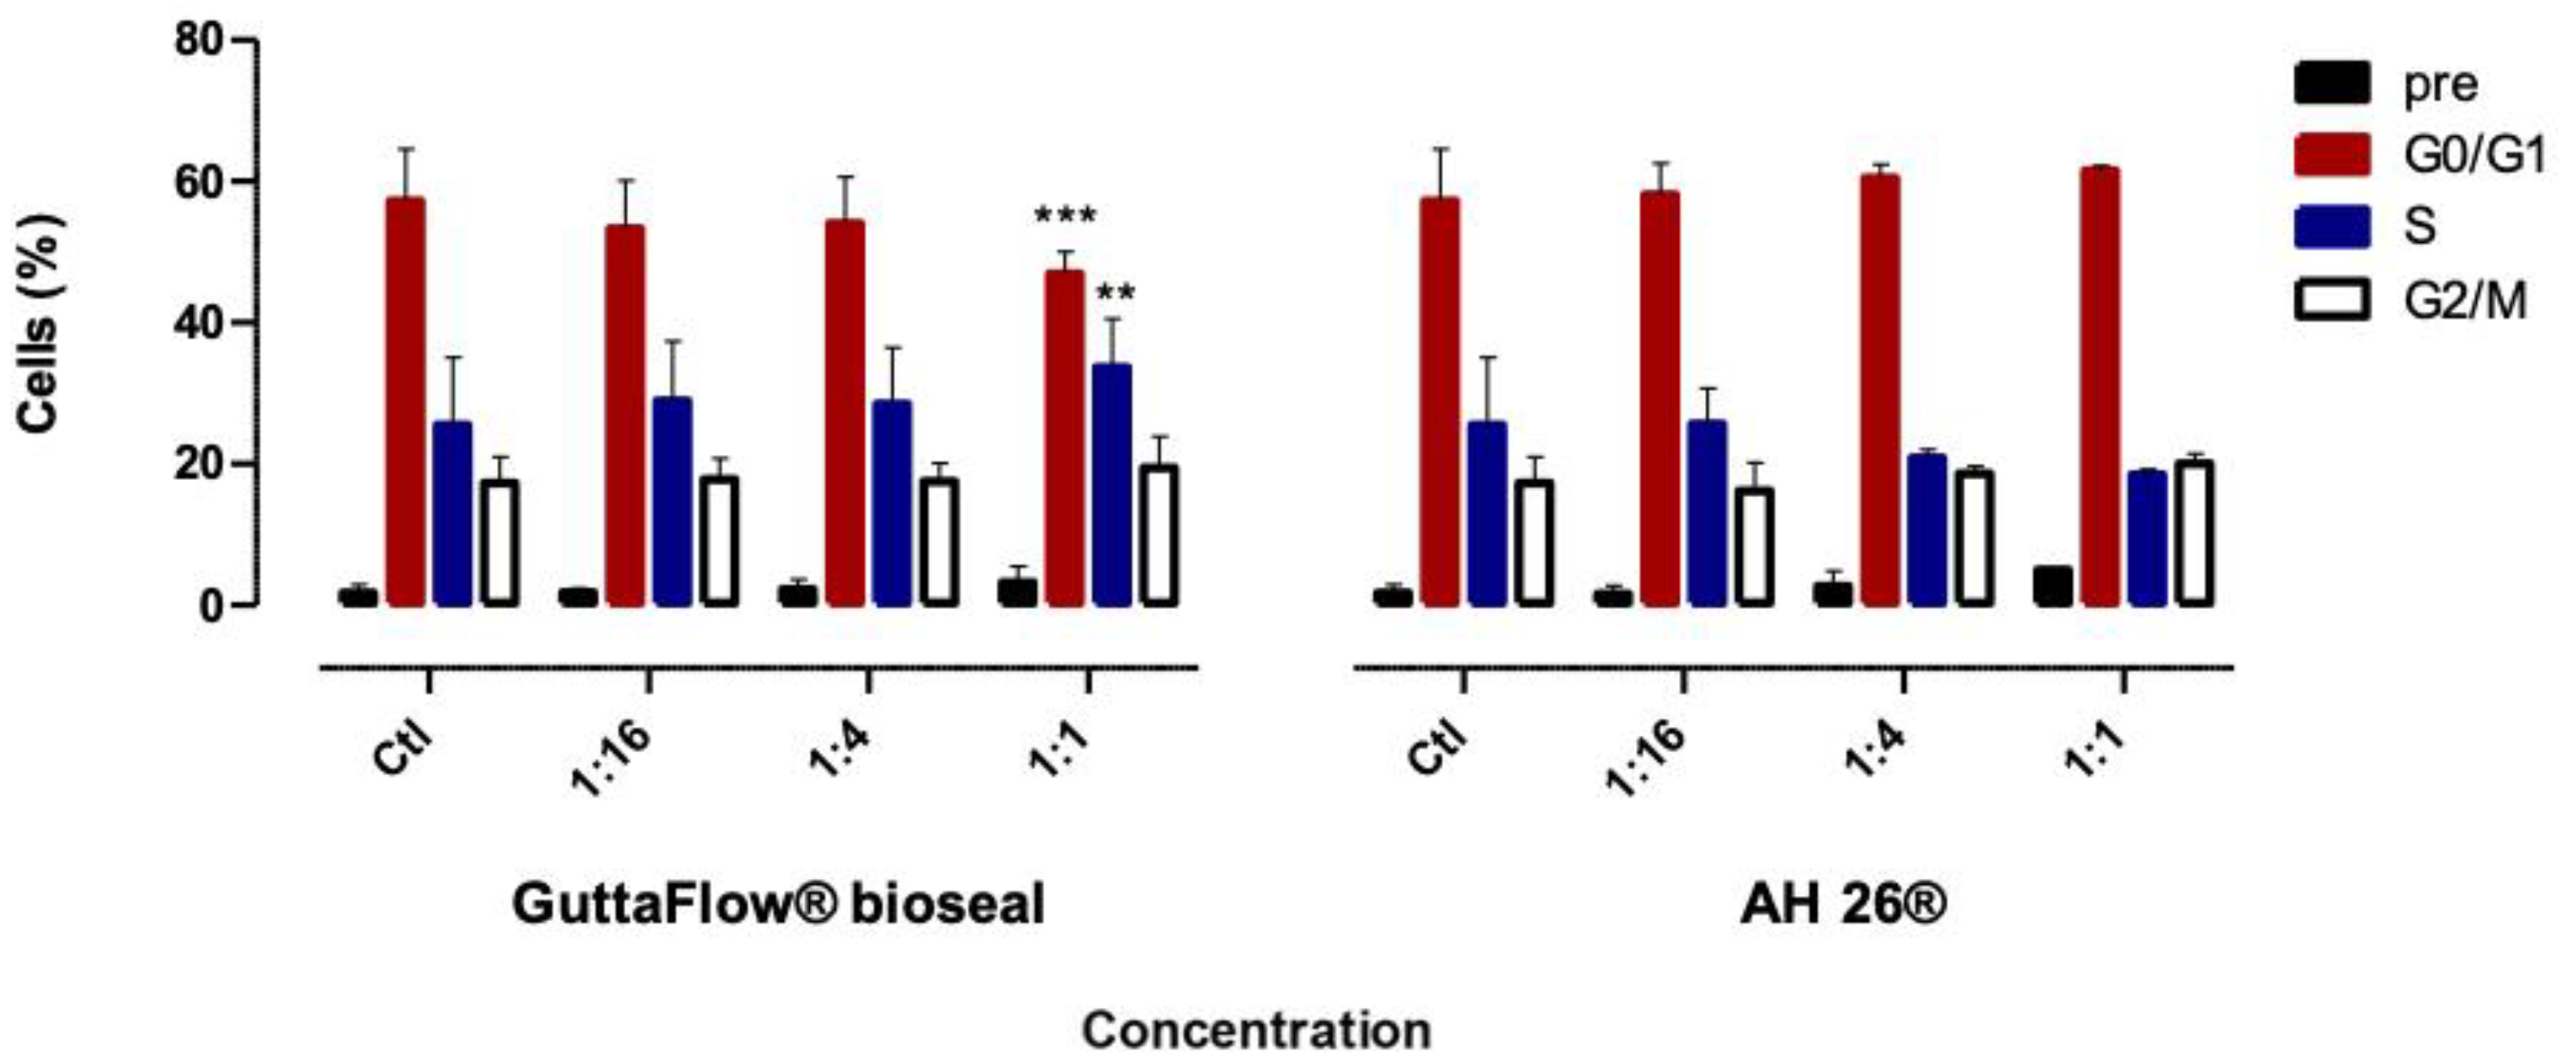
2.3. Cell Cycle
2.4. Oxidative Stress
2.5. Alizarin Red S
3. Discussion
4. Materials and Methods
4.1. Cell Culture
4.2. Pellets and Extracts Preparation
4.3. MTT Assay
4.4. SRB Assay
4.5. Types of Cell Death
4.6. Cell Cycle
4.7. Oxidative Stress
4.8. Mineralized Nodules Quantification
4.9. Statistical Analyzes
5. Conclusions
Author Contributions
Funding
Conflicts of Interest
References
- Collado-González, M.; García-Bernal, D.; Oñate-Sánchez, R.E.; Ortolani-Seltenerich, P.S.; Lozano, A.; Forner, L.; Llena, C.; Rodríguez-Lozano, F.J. Biocompatibility of three new calcium silicate-based endodontic sealers on human periodontal ligament stem cells. Int. Endod. J. 2017, 50, 875–884. [Google Scholar] [CrossRef]
- Samyuktha, V.; Ravikumar, P.; Nagesh, B.; Ranganathan, K.; Jayaprakash, T.; Sayesh, V. Cytotoxicity evaluation of root repair materials in human-cultured periodontal ligament fibroblasts. J. Conserv. Dent. 2014, 17, 467. [Google Scholar] [CrossRef] [PubMed]
- Saygili, G.; Saygili, S.; Tuglu, I.; Davut Capar, I. In Vitro Cytotoxicity of GuttaFlow Bioseal, GuttaFlow 2, AH-Plus and MTA Fillapex. Iran. Endod. J. 2017, 12, 354–359. [Google Scholar] [PubMed]
- Bueno, C.R.E.; Valentim, D.; Marques, V.A.S.; Gomes-Filho, J.E.; Cintra, L.T.A.; Jacinto, R.C.; Dezan-Junior, E. Biocompatibility and biomineralization assessment of bioceramic-, epoxy-, and calcium hydroxide-based sealers. Braz. Oral Res. 2016, 30. [Google Scholar] [CrossRef] [PubMed]
- Zhou, H.; Du, T.; Shen, Y.; Wang, Z.; Zheng, Y.; Haapasalo, M. In Vitro Cytotoxicity of Calcium Silicate–containing Endodontic Sealers. J. Endod. 2015, 41, 56–61. [Google Scholar] [CrossRef]
- Collado-González, M.; Tomás-Catalá, C.J.; Oñate-Sánchez, R.E.; Moraleda, J.M.; Rodríguez-Lozano, F.J. Cytotoxicity of GuttaFlow Bioseal, GuttaFlow2, MTA Fillapex, and AH Plus on Human Periodontal Ligament Stem Cells. J. Endod. 2017, 43, 816–822. [Google Scholar] [CrossRef]
- Guven, E.P.; Yalvac, M.E.; Kayahan, M.B.; Sunay, H.; SahIn, F.; Bayirli, G. Human tooth germ stem cell response to calcium-silicate based endodontic cements. J. Appl. Oral Sci. 2013, 21, 351–357. [Google Scholar] [CrossRef]
- Willershausen, I.; Wolf, T.; Kasaj, A.; Weyer, V.; Willershausen, B.; Marroquin, B.B. Influence of a bioceramic root end material and mineral trioxide aggregates on fibroblasts and osteoblasts. Arch. Oral Biol. 2013, 58, 1232–1237. [Google Scholar] [CrossRef]
- Karapınar-Kazandağ, M.; Bayrak, Ö.F.; Yalvaç, M.E.; Ersev, H.; Tanalp, J.; Şahin, F.; Bayırlı, G. Cytotoxicity of 5 endodontic sealers on L929 cell line and human dental pulp cells. Int. Endod. J. 2011, 44, 626–634. [Google Scholar] [CrossRef]
- Mukhtar-Fayyad, D. Cytocompatibility of new bioceramic-based materials on human fibroblast cells (MRC-5). Oral Surg. Oral Med. Oral Pathol. Oral Radiol. Endodontol. 2011, 112, e137–e142. [Google Scholar] [CrossRef]
- Surya Raghavendra, S.; Jadhav, G.R.; Gathani, K.M.; Kotadia, P. Bioceramics in Endodontics—A review. J. Istanbul Univ. Fac. Dent. 2017, 51, S128. [Google Scholar] [CrossRef] [PubMed]
- Ma, J.; Shen, Y.; Stojicic, S.; Haapasalo, M. Biocompatibility of Two Novel Root Repair Materials. J. Endod. 2011, 37, 793–798. [Google Scholar] [CrossRef] [PubMed]
- Jitaru, S.; Hodisan, I.; Timis, L.; Lucian, A.; Bud, M. The use of bioceramics in Endodontics—literature review. Med. Pharm. Rep. 2016, 89, 470–473. [Google Scholar] [CrossRef] [PubMed]
- Biological Evaluation of Medical Devices—Part 5: Tests for In Vitro Cytotoxicity. Available online: https://www.iso.org/standard/36406.html (accessed on 7 July 2019).
- Gandolfi, M.G.; Iezzi, G.; Piattelli, A.; Prati, C.; Scarano, A. Osteoinductive potential and bone-bonding ability of ProRoot MTA, MTA Plus and Biodentine in rabbit intramedullary model: Microchemical characterization and histological analysis. Dent. Mater. 2017, 33, e221–e238. [Google Scholar] [CrossRef]
- Geurtsen, W. Biocompatibility of Root Canal Filling Materials. Aust. Endod. J. 2001, 27, 12–21. [Google Scholar] [CrossRef] [PubMed]
- De-Deus, G.; Canabarro, A.; Alves, G.; Linhares, A.; Senne, M.I.; Granjeiro, J.M. Optimal Cytocompatibility of a Bioceramic Nanoparticulate Cement in Primary Human Mesenchymal Cells. J. Endod. 2009, 35, 1387–1390. [Google Scholar] [CrossRef] [PubMed]
- Rogero, S.O.; Lugão, A.B.; Ikeda, T.I.; Cruz, Á.S. Teste in vitro de citotoxicidade: Estudo comparativo entre duas metodologias. Mater. Res. 2003, 6, 317–320. [Google Scholar] [CrossRef]
- Damas, B.A.; Wheater, M.A.; Bringas, J.S.; Hoen, M.M. Cytotoxicity Comparison of Mineral Trioxide Aggregates and EndoSequence Bioceramic Root Repair Materials. J. Endod. 2011, 37, 372–375. [Google Scholar] [CrossRef]
- Paranjpe, A.; Zhang, H.; Johnson, J.D. Effects of mineral trioxide aggregate on human dental pulp cells after pulp-capping procedures. J. Endod. 2010, 36, 1042–1047. [Google Scholar] [CrossRef]
- Fonseca, D.A.; Paula, A.B.; Marto, C.M.; Coelho, A.; Paulo, S.; Martinho, J.P.; Carrilho, E.; Ferreira, M.M. Biocompatibility of Root Canal Sealers: A Systematic Review of In Vitro and In Vivo Studies. Materials 2019, 12, 4113. [Google Scholar] [CrossRef]
- Tyagi, S.; Tyagi, P.; Mishra, P. Evolution of root canal sealers: An insight story. Eur. J. Gen. Dent. 2013, 2, 199. [Google Scholar] [CrossRef]
- Huang, Y.; Celikten, B.; de Faria Vasconcelos, K.; Ferreira Pinheiro Nicolielo, L.; Lippiatt, N.; Buyuksungur, A.; Jacobs, R.; Orhan, K. Micro-CT and nano-CT analysis of filling quality of three different endodontic sealers. Dentomaxillofac. Radiol. 2017, 46, 20170223. [Google Scholar] [CrossRef] [PubMed]
- AlAnezi, A.Z.; Jiang, J.; Safavi, K.E.; Spangberg, L.S.W.; Zhu, Q. Cytotoxicity evaluation of endosequence root repair material. Oral Surg. Oral Med. Oral Pathol. Oral Radiol. Endodontol. 2010, 109, e122–e125. [Google Scholar] [CrossRef] [PubMed]
- Geurtsen, W.; Leinenbach, F.; Krage, T.; Leyhausen, G. Cytotoxicity of four root canal sealers in permanent 3T3 cells and primary human periodontal ligament fibroblast cultures. Oral Surg. Oral Med. Oral Pathol. Oral Radiol. Endodontol. 1998, 85, 592–597. [Google Scholar] [CrossRef]
- Huang, F.M.; Tai, K.W.; Chou, M.Y.; Chang, Y.C. Cytotoxicity of resin-, zinc oxide-eugenol-, and calcium hydroxide-based root canal sealers on human periodontal ligament cells and permanent V79 cells. Int. Endod. J. 2002, 35, 153–158. [Google Scholar] [CrossRef]
- Ashraf, H.; Najafi, F.; Heidari, S.; Yadegary, Z.; Zadsirjan, S. Cytotoxicity of Two Experimental Epoxy Resin-Based Sealers. Iran. Endod. J. 2018, 13, 257–262. [Google Scholar]
- Hunag, T.H.; Lii, C.K.; Kao, C.T. Root canal sealers cause cytotoxicity and oxidative damage in hepatocytes. J. Biomed. Mater. Res. 2001, 54, 390–395. [Google Scholar] [CrossRef]
- Donadio, M.; Jiang, J.; He, J.; Wang, Y.H.; Safavi, K.E.; Zhu, Q. Cytotoxicity evaluation of Activ GP and Resilon sealers in vitro. Oral Surg. Oral Med. Oral Pathol. Oral Radiol. Endodontol. 2009, 107, e74–e78. [Google Scholar] [CrossRef]
- Ersev, H.; Schmalz, G.; Bayirli, G.; Schweikl, H. Cytotoxic and mutagenic potencies of various root canal filling materials in eukaryotic and prokaryotic cells in vitro. J. Endod. 1999, 25, 359–363. [Google Scholar] [CrossRef]
- Vichai, V.; Kirtikara, K. Sulforhodamine B colorimetric assay for cytotoxicity screening. Nat. Protoc. 2006, 1, 1112–1116. [Google Scholar] [CrossRef]
- Plumb, J.A. Cell Sensitivity Assays: Clonogenic Assay. In Cancer Cell Culture: Methods and Protocols; Series: Methods in Molecular Medicine (88); Langdon, S.P., Ed.; Humana Press: Totowa, NJ, USA, 2003; pp. 159–164. [Google Scholar]
- Koulaouzidou, E.A.; Papazisis, K.; Beltes, P.; Geromicholos, G.D.; Kortsarls, A.H. Cytotoxicity of three resin-based root canal sealers: An in vitro evaluation. Dent. Traumatol. 2007, 14, 182–185. [Google Scholar] [CrossRef] [PubMed]
- Eid, A.A.; Gosier, J.L.; Primus, C.M.; Hammond, B.D.; Susin, L.F.; Pashley, D.H.; Tay, F.R. In Vitro Biocompatibility and Oxidative Stress Profiles of Different Hydraulic Calcium Silicate Cements. J. Endod. 2014, 40, 255–260. [Google Scholar] [CrossRef] [PubMed]
- Valko, M.; Leibfritz, D.; Moncol, J.; Cronin, M.T.D.; Mazur, M.; Telser, J. Free radicals and antioxidants in normal physiological functions and human disease. Int. J. Biochem. Cell Biol. 2007, 39, 44–84. [Google Scholar] [CrossRef] [PubMed]
- Paula, A.; Laranjo, M.; Marto, C.M.; Abrantes, A.M.; Casalta-Lopes, J.; Gonçalves, A.C.; Sarmento-Ribeiro, A.B.; Ferreira, M.M.; Botelho, M.F.; Carrilho, E. BiodentineTM Boosts, WhiteProRoot®MTA Increases and Life® Suppresses Odontoblast Activity. Materials 2019, 12, 1184. [Google Scholar] [CrossRef] [PubMed]
- Silva, E.J.N.L.; Rosa, T.P.; Herrera, D.R.; Jacinto, R.C.; Gomes, B.P.F.A.; Zaia, A.A. Evaluation of Cytotoxicity and Physicochemical Properties of Calcium Silicate-based Endodontic Sealer MTA Fillapex. J. Endod. 2013, 39, 274–277. [Google Scholar] [CrossRef]
- Mestieri, L.B.; Gomes-Cornélio, A.L.; Rodrigues, E.M.; Salles, L.P.; Bosso-Martelo, R.; Guerreiro-Tanomaru, J.M.; Tanomaru-Filho, M. Biocompatibility and bioactivity of calcium silicate-based endodontic sealers in human dental pulp cells. J. Appl. Oral Sci. 2015, 23, 467–471. [Google Scholar] [CrossRef]
- Ranjkesh, B.; Isidor, F.; Kraft, D.C.E.; Løvschall, H. In vitro cytotoxic evaluation of novel fast-setting calcium silicate cement compositions and dental materials using colorimetric methyl-thiazolyl-tetrazolium assay. J. Oral Sci. 2018, 60, 82–88. [Google Scholar] [CrossRef]
Sample Availability: Samples of the compounds are available from the authors. |


| Materials | Composition | Setting Time | Lot | Manufacturer |
|---|---|---|---|---|
| GuttaFlow® Bioseal | Gutta-percha power, polydimethylsiloxane, platinum catalytic agent, zirconium dioxide, bioactive ceramic glass | 9–15 h | H71011; I33299; I46491; I14741 | Coltené, Langenau, Germany |
| AH26® | Bismuth oxide, methanamine, silver, titanium dioxide, epoxy resin | 25–30 min | 1703000255; 1701000094 | Dentsply, Konstanz, Germany |
© 2020 by the authors. Licensee MDPI, Basel, Switzerland. This article is an open access article distributed under the terms and conditions of the Creative Commons Attribution (CC BY) license (http://creativecommons.org/licenses/by/4.0/).
Share and Cite
Ferreira, I.; Laranjo, M.; Marto, C.M.; Casalta-Lopes, J.; Serambeque, B.; Gonçalves, A.C.; Sarmento-Ribeiro, A.B.; Carrilho, E.; Botelho, M.F.; Baptista Paula, A.; et al. GuttaFlow® Bioseal Cytotoxicity Assessment: In Vitro Study. Molecules 2020, 25, 4297. https://doi.org/10.3390/molecules25184297
Ferreira I, Laranjo M, Marto CM, Casalta-Lopes J, Serambeque B, Gonçalves AC, Sarmento-Ribeiro AB, Carrilho E, Botelho MF, Baptista Paula A, et al. GuttaFlow® Bioseal Cytotoxicity Assessment: In Vitro Study. Molecules. 2020; 25(18):4297. https://doi.org/10.3390/molecules25184297
Chicago/Turabian StyleFerreira, Inês, Mafalda Laranjo, Carlos Miguel Marto, João Casalta-Lopes, Beatriz Serambeque, Ana Cristina Gonçalves, Ana Bela Sarmento-Ribeiro, Eunice Carrilho, Maria Filomena Botelho, Anabela Baptista Paula, and et al. 2020. "GuttaFlow® Bioseal Cytotoxicity Assessment: In Vitro Study" Molecules 25, no. 18: 4297. https://doi.org/10.3390/molecules25184297
APA StyleFerreira, I., Laranjo, M., Marto, C. M., Casalta-Lopes, J., Serambeque, B., Gonçalves, A. C., Sarmento-Ribeiro, A. B., Carrilho, E., Botelho, M. F., Baptista Paula, A., & Marques Ferreira, M. (2020). GuttaFlow® Bioseal Cytotoxicity Assessment: In Vitro Study. Molecules, 25(18), 4297. https://doi.org/10.3390/molecules25184297