
Verifying the Geographical Origin and Authenticity of Greek Olive Oils by Means of Optical Spectroscopy and Multivariate Analysis

 , , , and
Abstract
1. Introduction
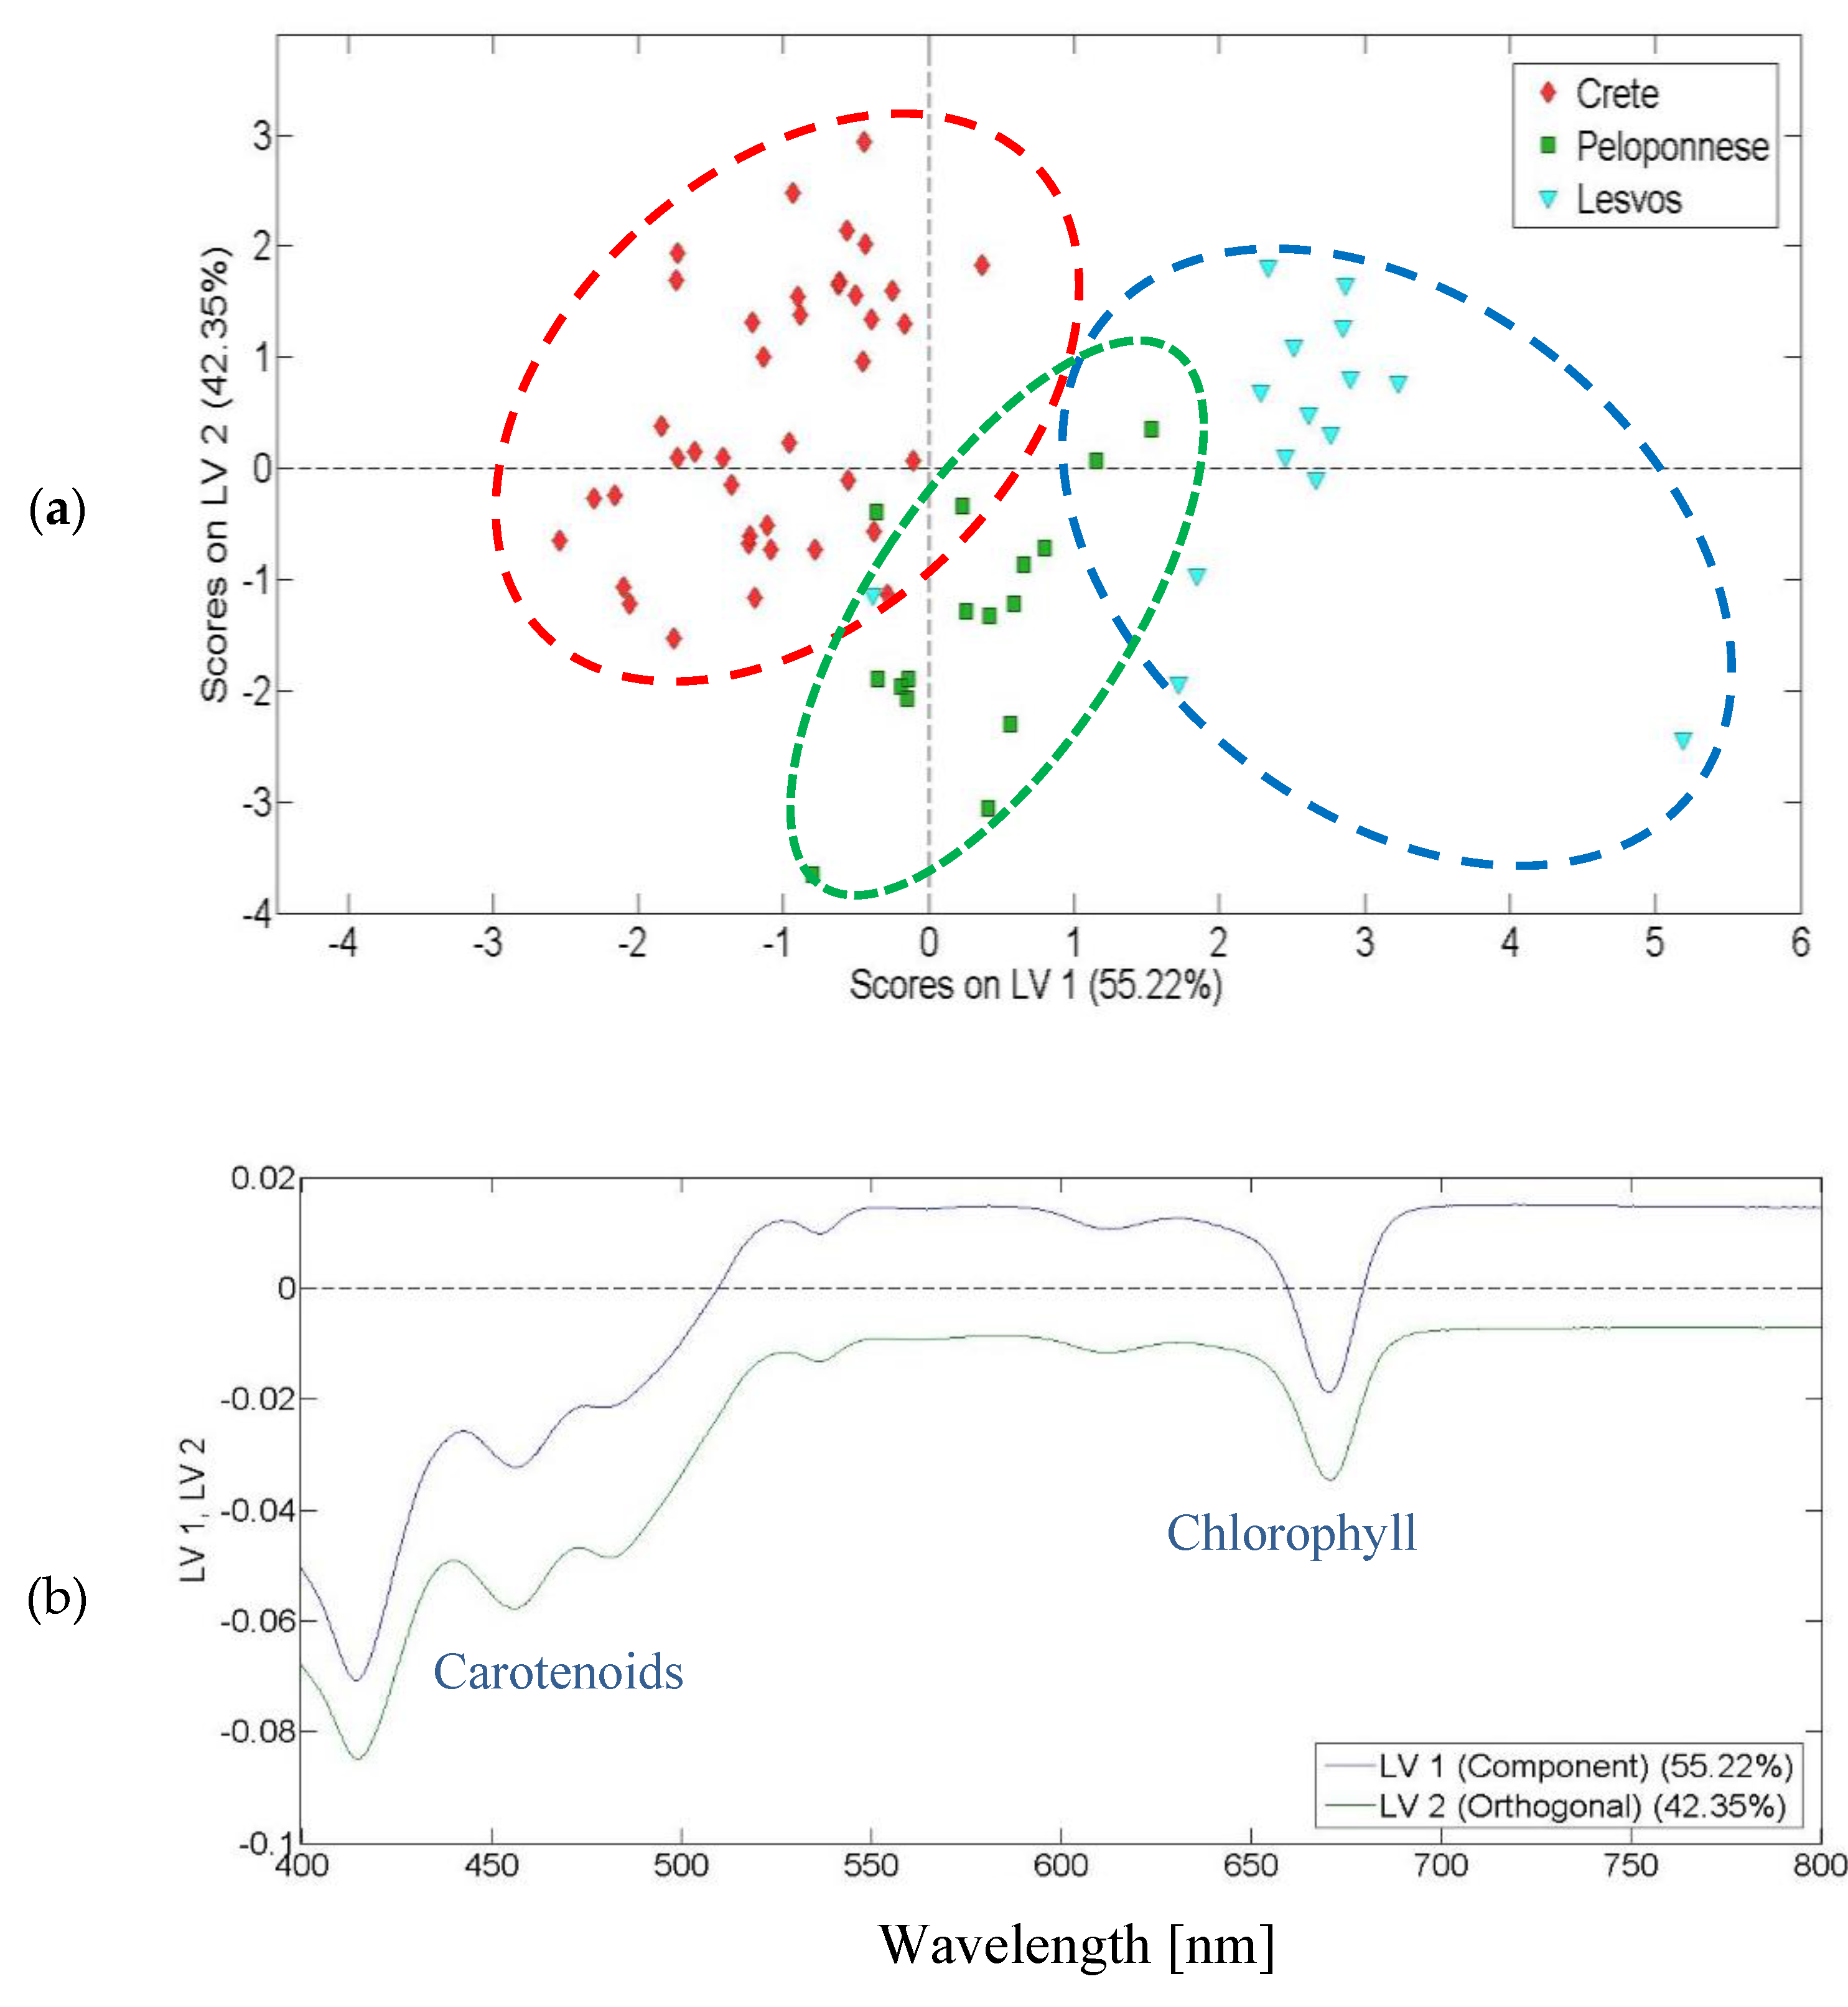
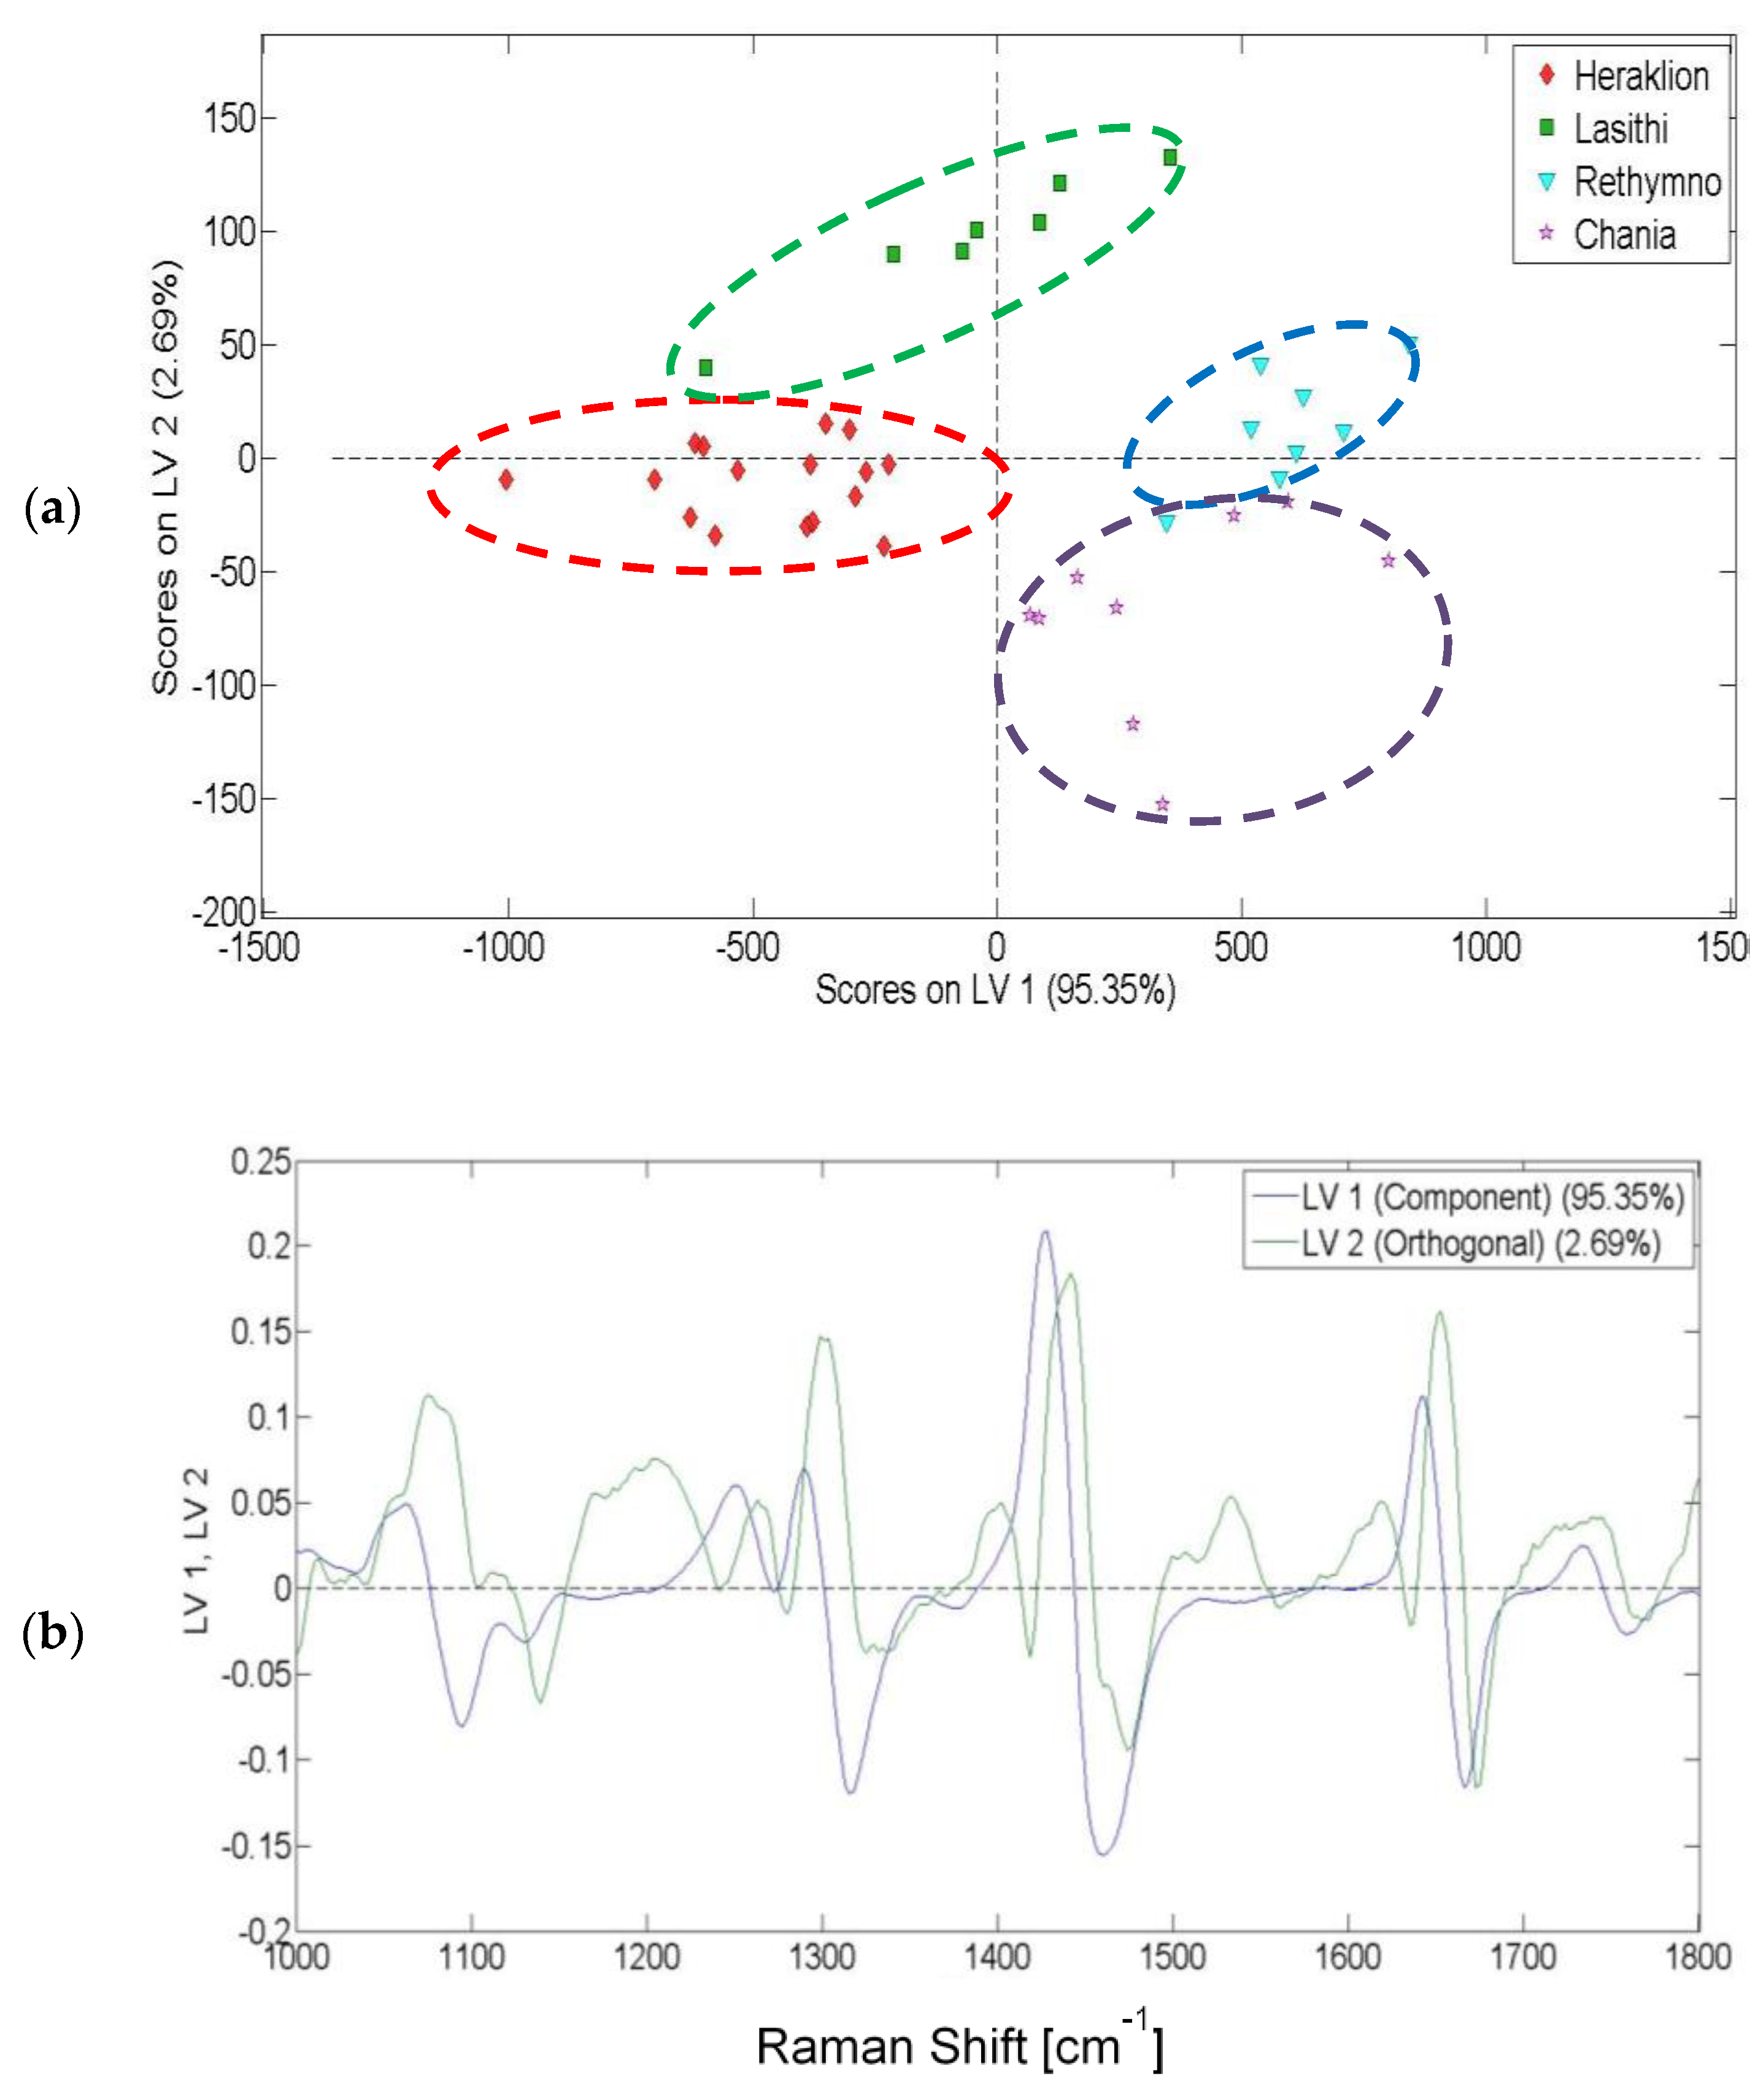
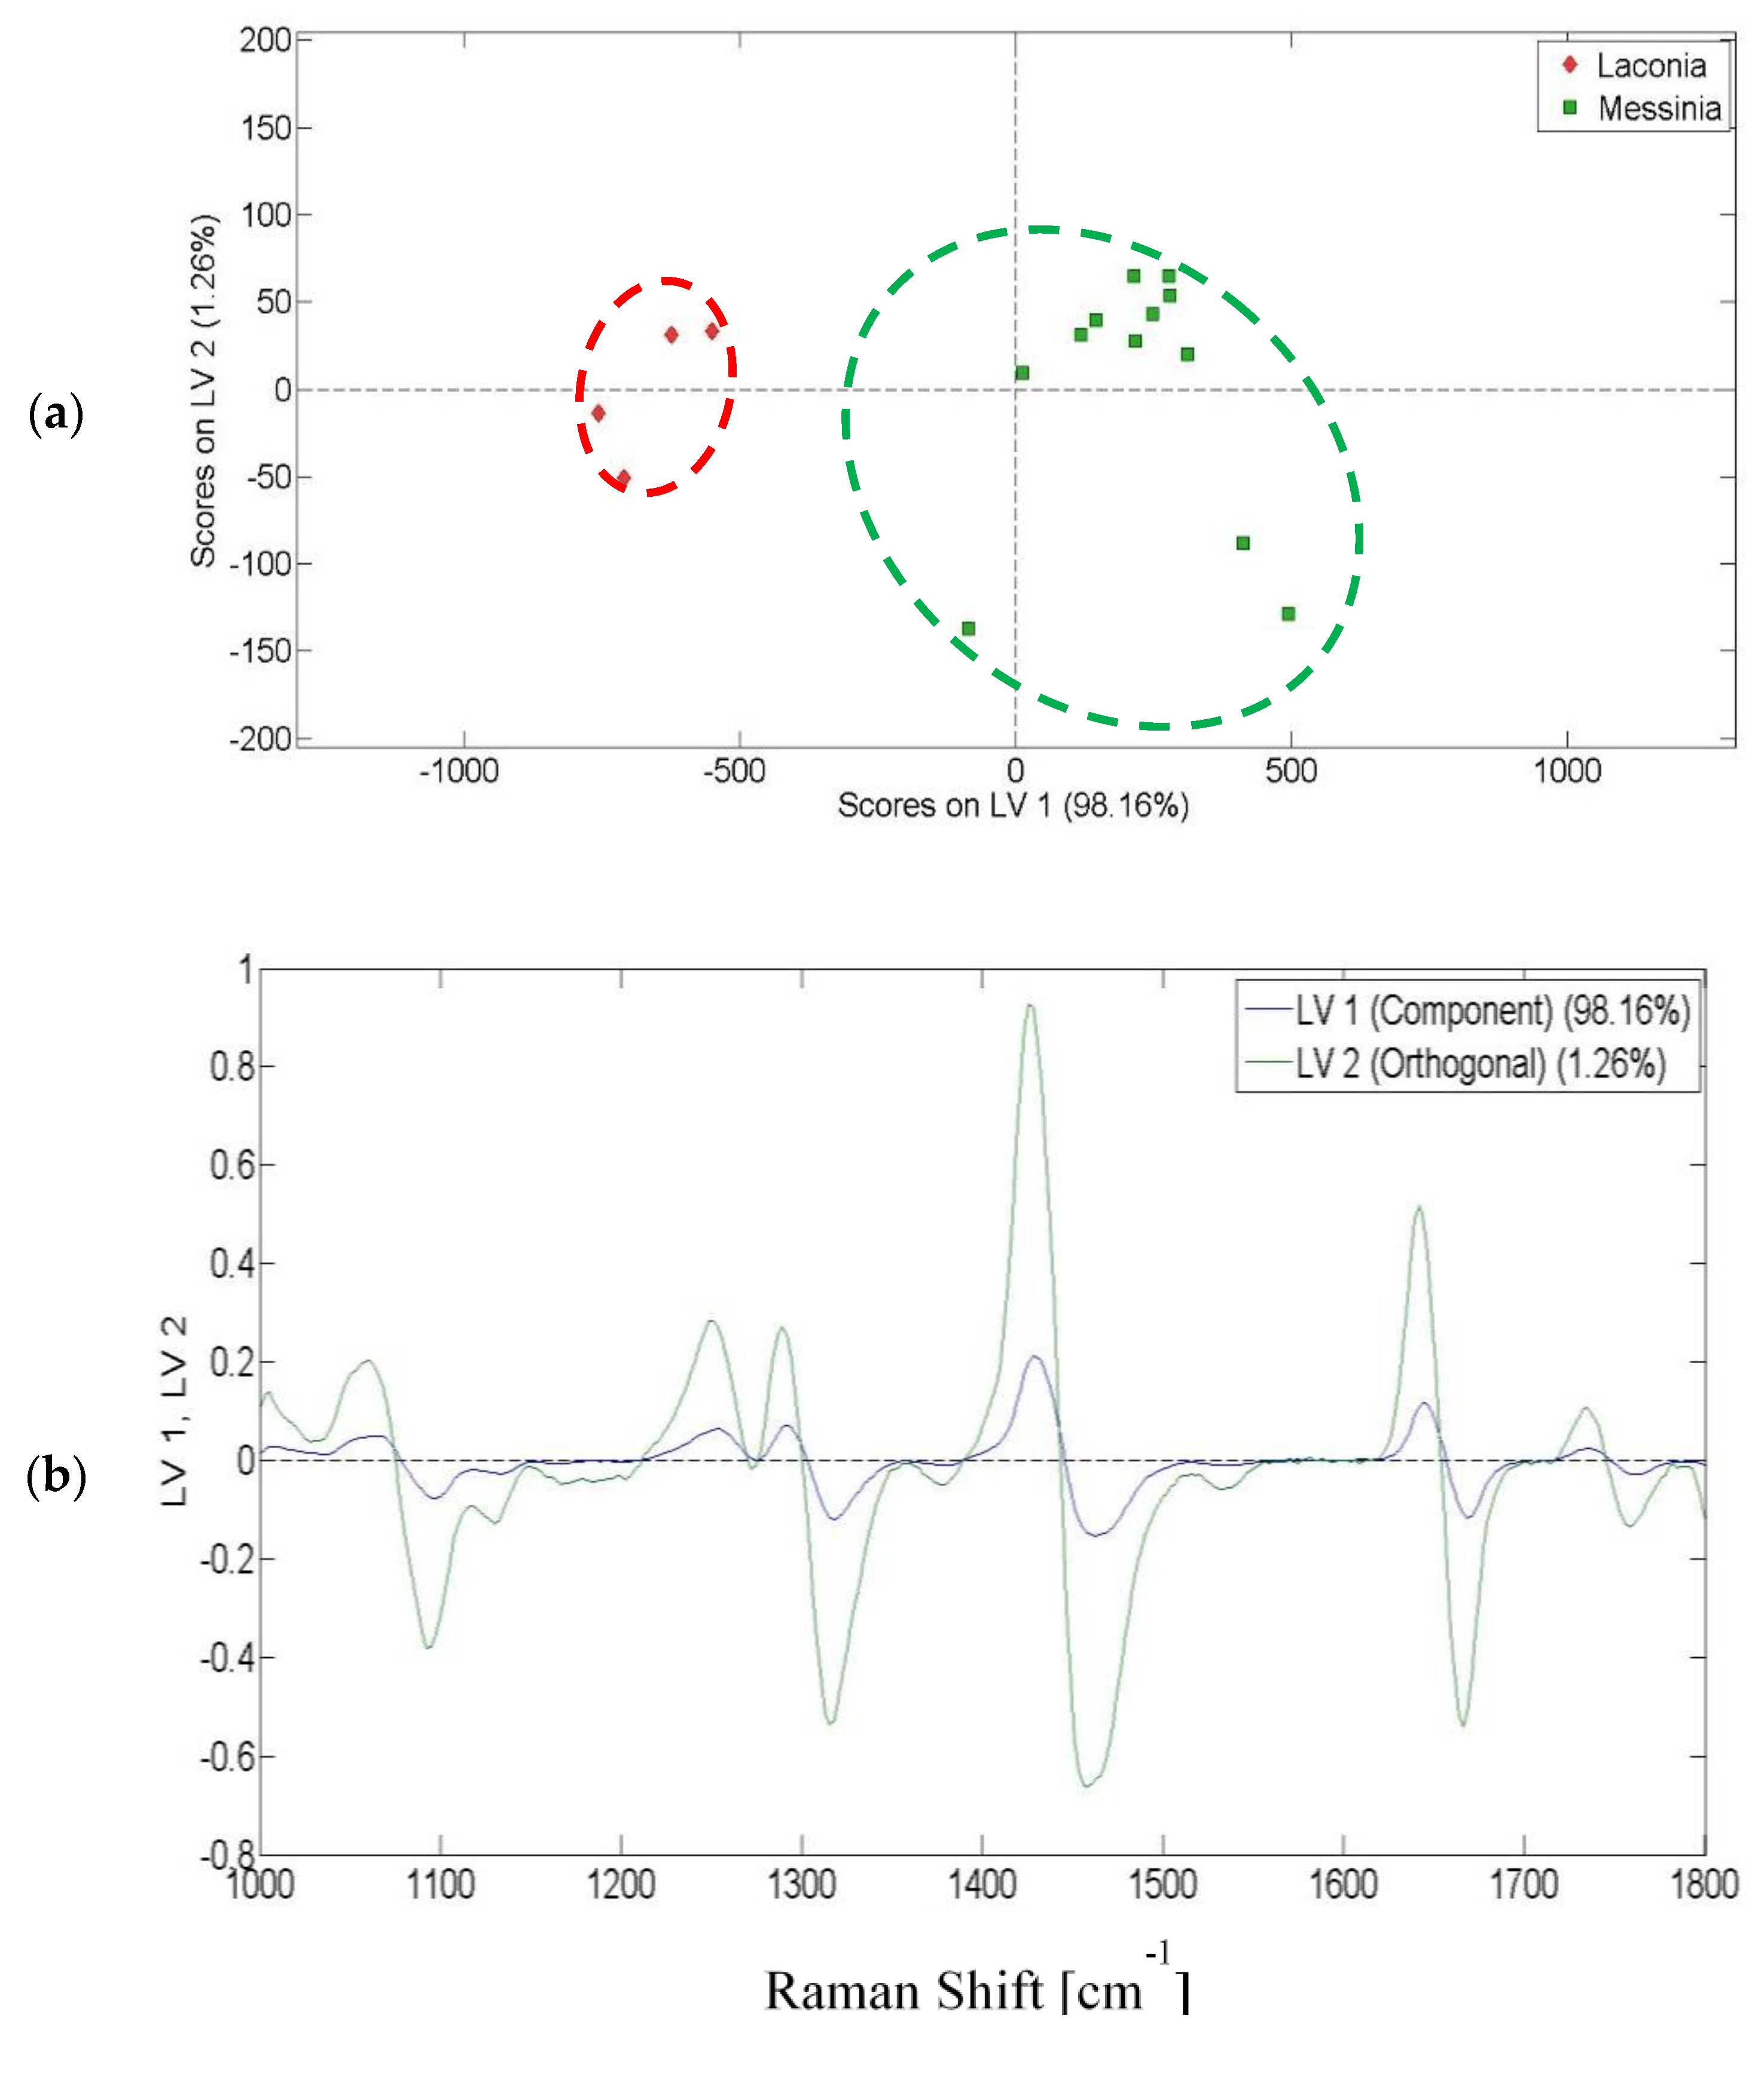
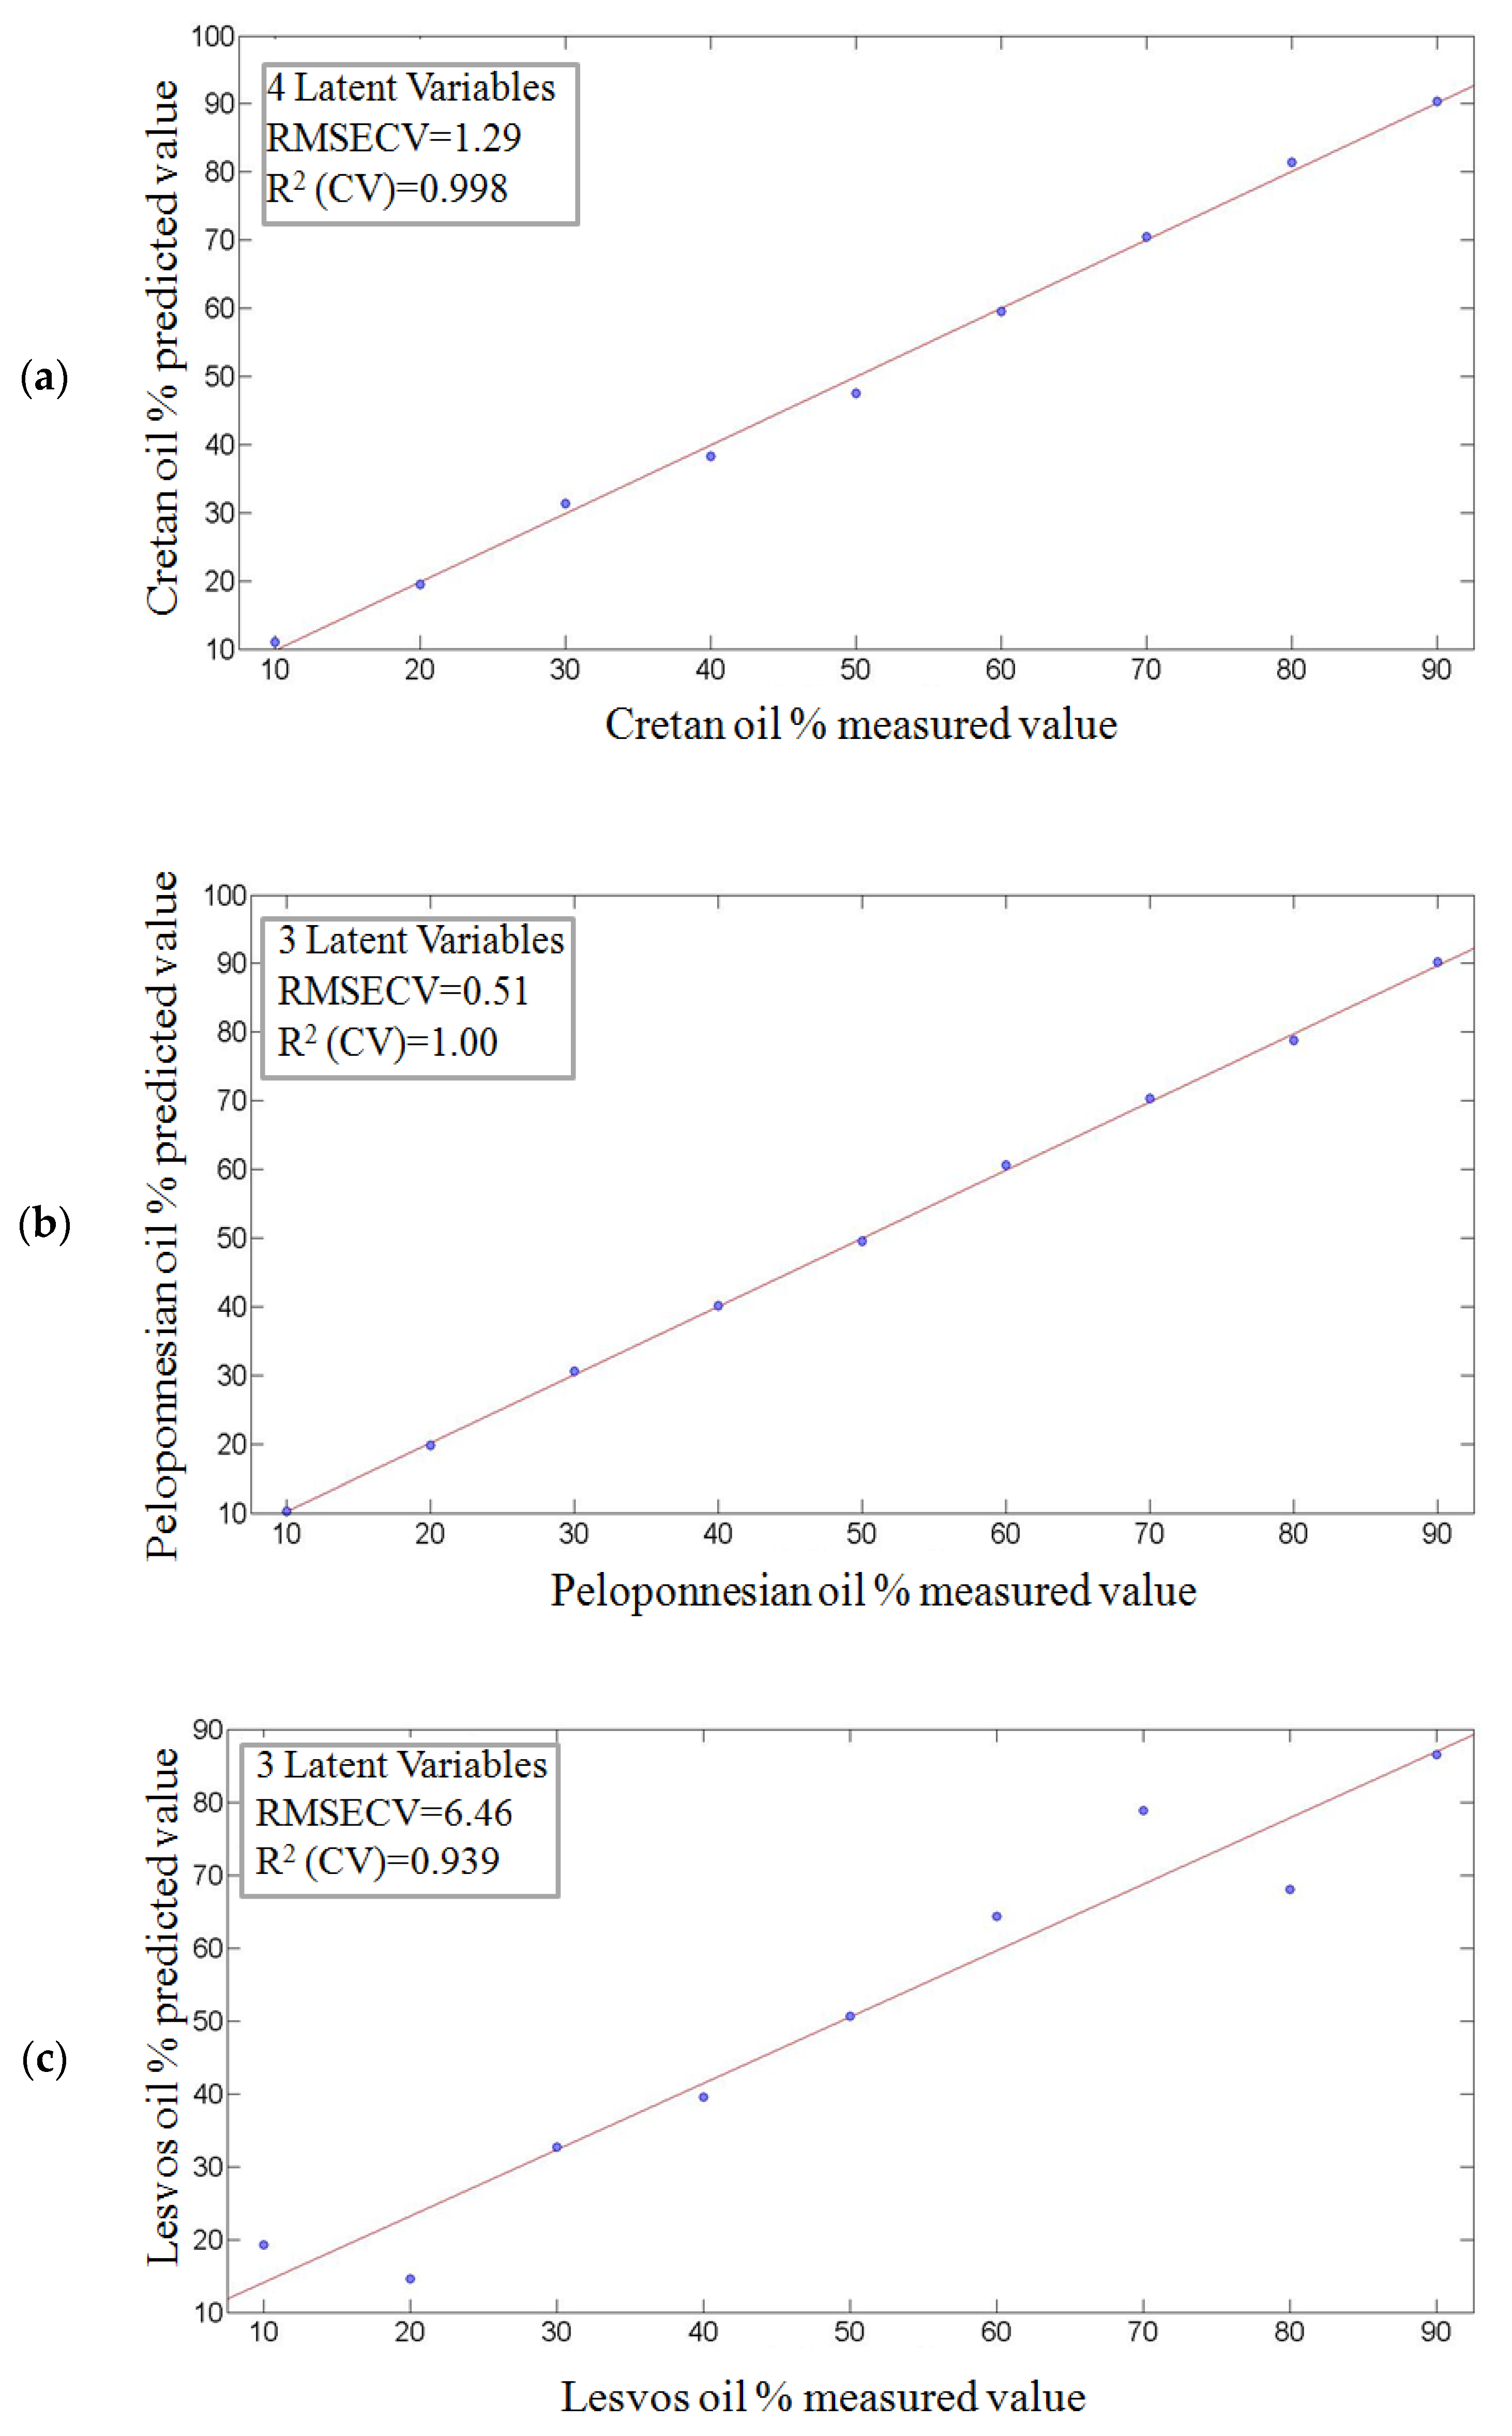
2. Results and Discussion
3. Materials and Methods
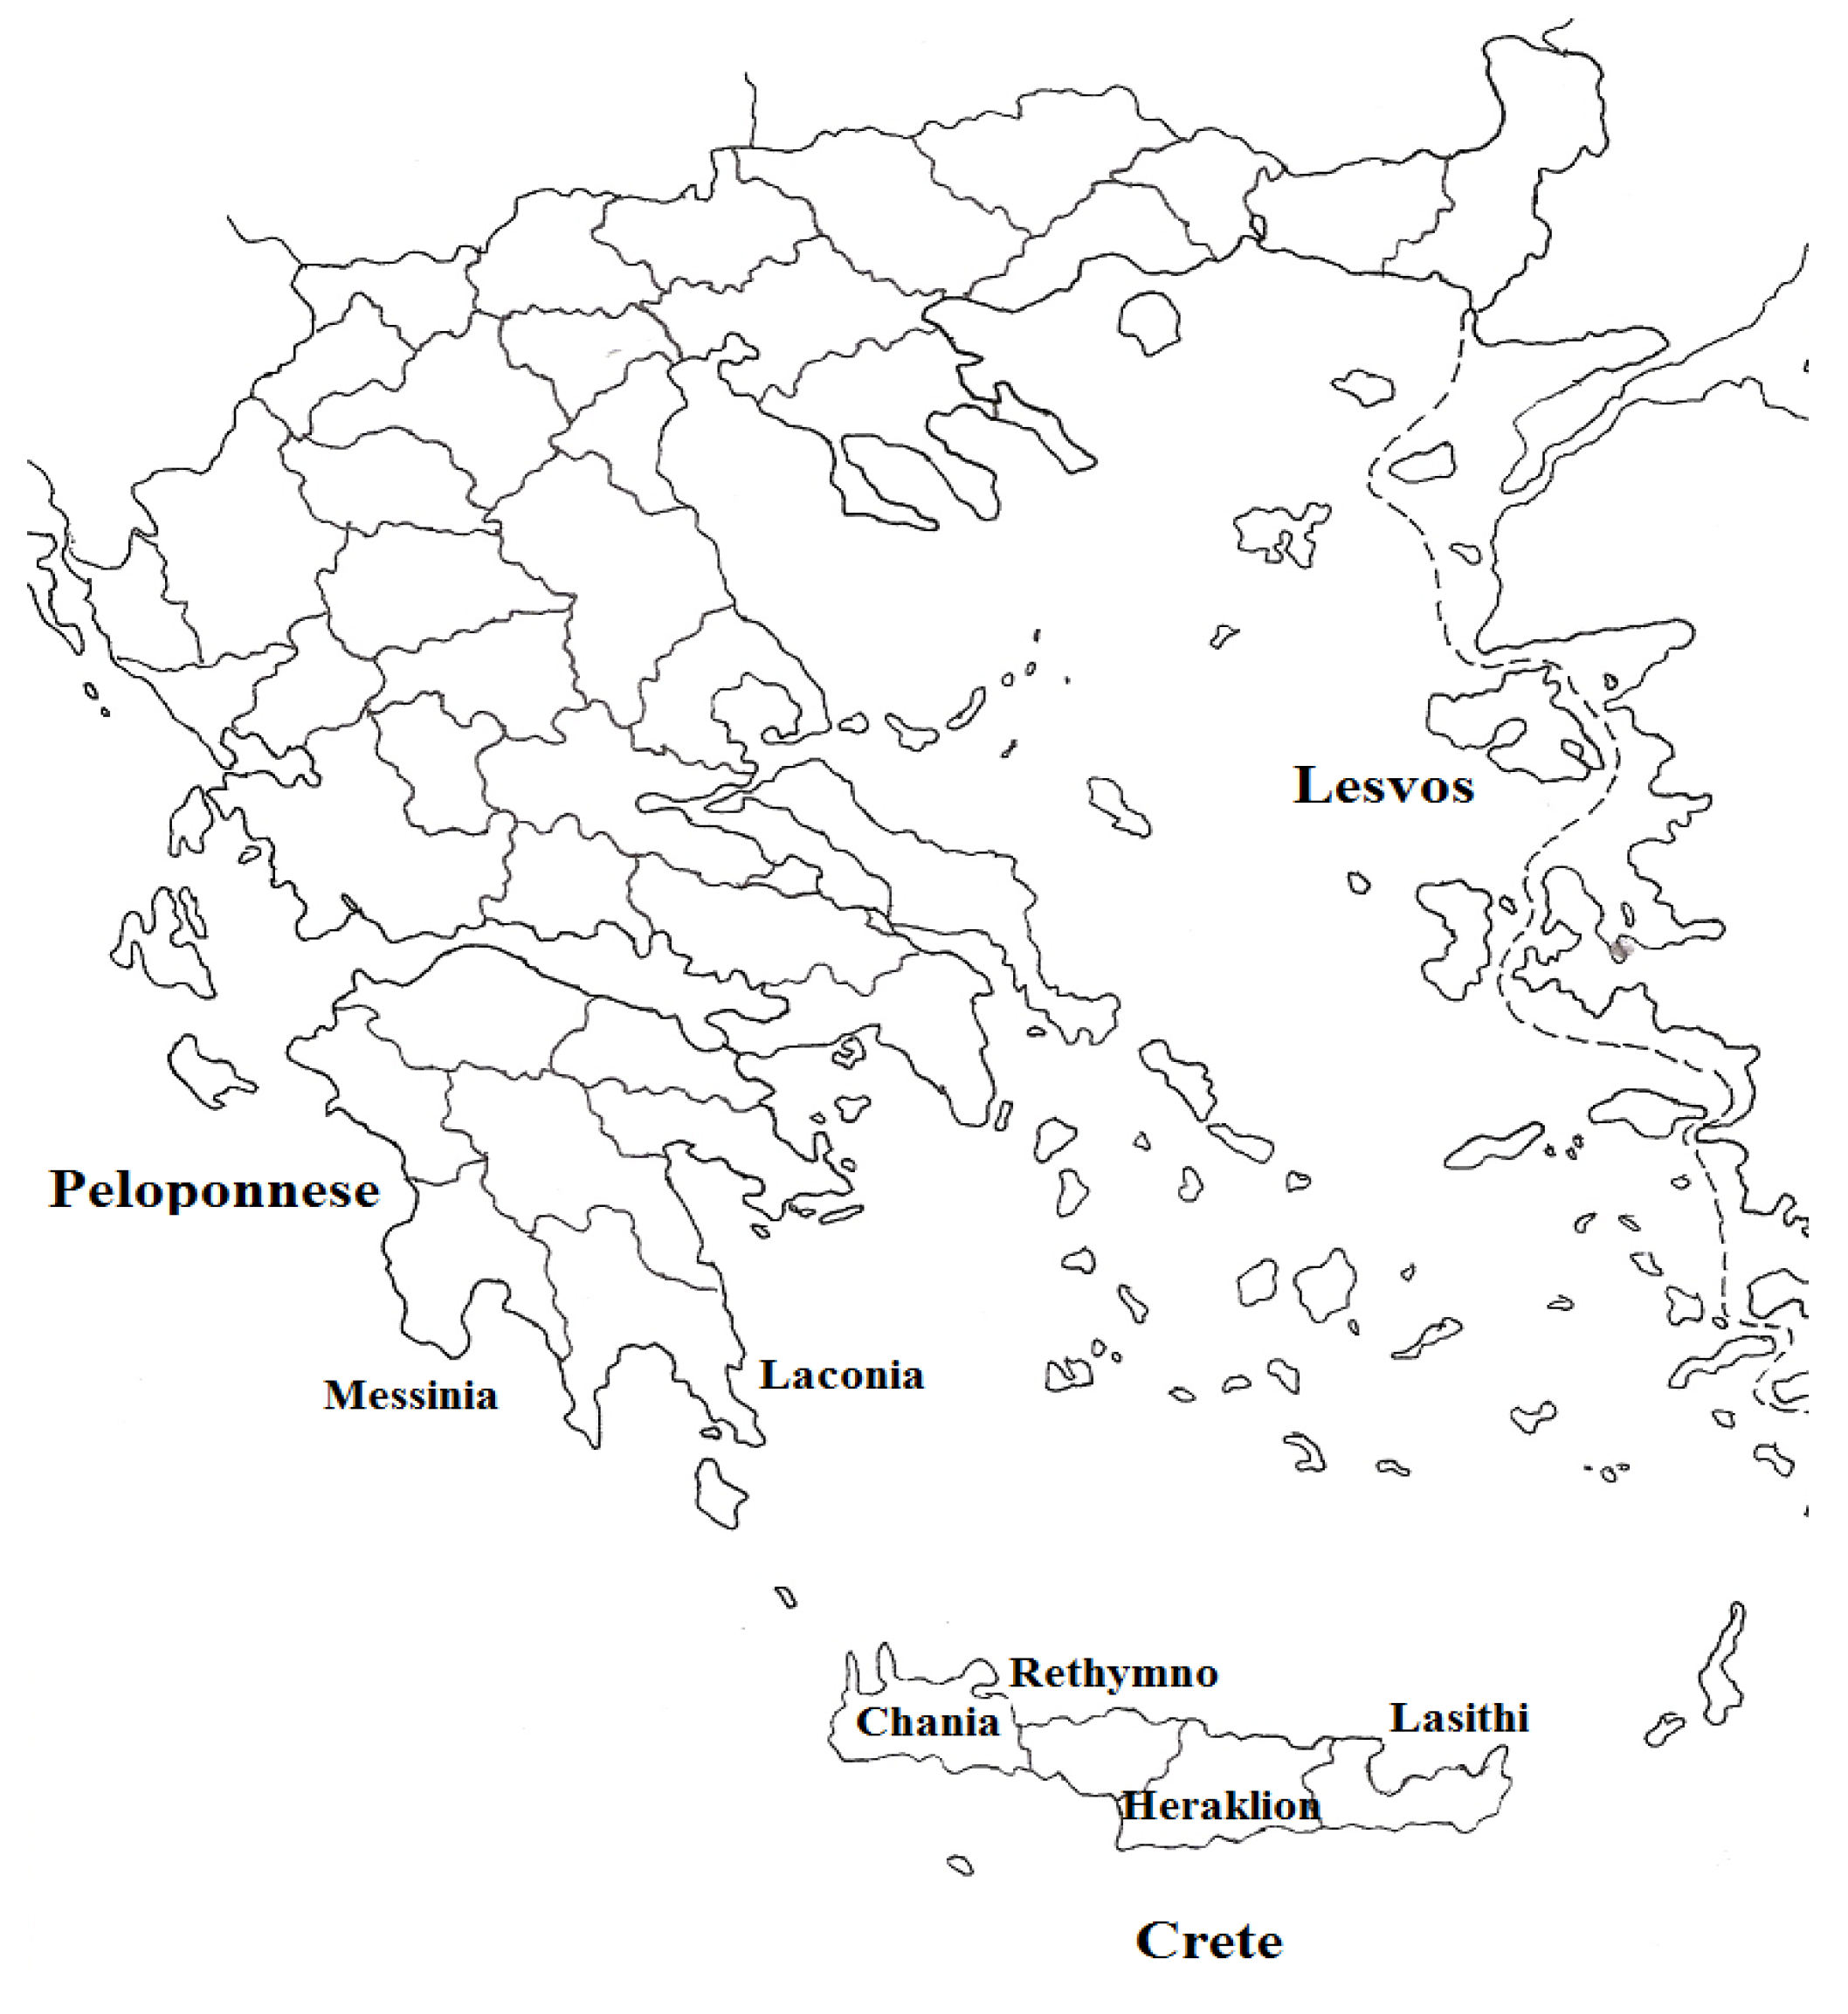
3.1. Samples
3.2. Equipment and Software
3.3. Data Analysis
4. Conclusions
Author Contributions
Funding
Acknowledgments
Conflicts of Interest
References
- Perona, J.S.; Cabello-Moruno, R.; Ruiz-Gutierrez, V. The role of virgin olive oil components in the modulation of endothelial function. J. Nutr. Biochem. 2006, 17, 429–445. [Google Scholar] [CrossRef] [PubMed]
- Covas, M.I.; Nyyssönen, K.; Poulsen, H.E.; Kaikkonen, J.; Zunft, H.F.; Kiesewetter, H.; Gaddi, A.; De la Torre, R.; Mursu, J.; Bäumler, H.; et al. The effect of polyphenols in olive oil on heart disease risk factors: A randomized trial. Ann. Intern. Med. 2006, 145, 333–341. [Google Scholar] [CrossRef] [PubMed]
- Council Regulation (EC) no. 510/2006 of 20 March 2006 on the protection of geographical indications and designations of origin for agricultural products and foodstuffs. Off. J. L 2006, 93, 12–25.
- Dias, C.; Mendes, L. Protected Designation of Origin (PDO), Protected Geographical Indication (PGI) and Traditional Speciality Guaranteed (TSG): A bibiliometric analysis. Food Res. Int. 2018, 103, 492–508. [Google Scholar] [CrossRef]
- Luykx, D.M.A.M.; Van Ruth, S.M. An overview of analytical methods for determining the geographical origin of food products. Food Chem. 2008, 107, 897–911. [Google Scholar] [CrossRef]
- Longobardi, F.; Ventrella, A.; Napoli, C.; Humpfer, E.; Schόtz, B.; Schafer, H.; Kontominas, M.G.; Sacco, A. Classification of olive oils according to geographical origin by using 1H NMR fingerprinting combined with multivariate analysis. Food Chem. 2012, 130, 177–183. [Google Scholar] [CrossRef]
- Mannina, L.; Patumi, M.; Proietti, N.; Bassi, D.; Segre, A.L. Geographical characterization of Italian extra virgin olive oils using high-field 1H NMR spectroscopy. J. Agric. Food Chem. 2001, 49, 2687–2696. [Google Scholar] [CrossRef] [PubMed]
- Camin, F.; Larcher, R.; Perini, M.; Bontempo, L.; Bertoldi, D.; Gagliamo, G.; Nicolini, G.; Versinia, G. Characterization of authentic Italian extra-virgin olive oils by stable isotope ratios of C, O and H and mineral composition. Food Chem. 2010, 118, 901–909. [Google Scholar] [CrossRef]
- Angerosa, F.; Bréas, O.; Contento, S.; Guillou, C.; Reniero, F.; Sada, E. Application of stable isotope ratio analysis to the characterization of the geographical origin of olive oils. J. Agric. Food Chem. 1999, 47, 1013–1017. [Google Scholar] [CrossRef]
- Lopez-Feria, S.; Cárdenas, S.; García-Mesa, A.G.; Valcárcel, M. Classification of extra virgin olive oils according to the protected designation of origin, olive variety and geographical origin. Talanta 2008, 75, 937–943. [Google Scholar] [CrossRef]
- Araghipour, N.; Colineau, J.; Koot, A.; Akkermans, W.; MorenoRojas, J.M.; Beauchamp, J.; Wisthaler, A.; Märk, T.D.; Downey, G.; Guillou, C.; et al. Geographical origin classification of olive oils by PTR-MS. Food Chem. 2008, 108, 374–383. [Google Scholar] [CrossRef]
- Mikrou, T.; Pantelidou, E.; Parasyri, N.; Papaioannou, A.; Kapsokefalou, M.; Gardeli, C.; Mallouchos, A. Varietal and geographical discrimination of greek monovarietal extra virgin olive oils based on squalene, tocopherol, and fatty acid composition. Molecules 2020, 25, 3818. [Google Scholar] [CrossRef]
- Downey, G.; McIntyre, P.; Davies, A.N. Geographic classification of extra virgin olive oils from the eastern mediterranean by chemometric analysis of visible and near-infrared spectroscopic data. Appl. Spectrosc. 2003, 57, 158–163. [Google Scholar] [CrossRef] [PubMed]
- Lin, P.; Yongming Chen, Y.; He, Y. Identification of geographical origin of olive oil using visible and near-infrared spectroscopy technique combined with chemometrics. Food Bioproc. Technol. 2012, 5, 235–242. [Google Scholar] [CrossRef]
- Tapp, H.S.; Defernez, M.; Kemsley, E.K. FTIR spectroscopy and multivariate analysis can distinguish the geographic origin of extra virgin olive oils. J. Agric. Food Chem. 2003, 51, 6110–6115. [Google Scholar] [CrossRef]
- Gurdeniz, G.; Ozen, B.; Tokatli, F. Classification of Turkish olive oils with respect to cultivar, geographic origin and harvest year, using fatty acid profile and mid-IR spectroscopy. Eur. Food Res. Technol. 2008, 227, 1275–1281. [Google Scholar] [CrossRef]
- Aparicio, R.; Harwood, J. Chromatographic Methodologies: Compounds for Olive Oil Color Issues. In Handbook of Olive Oil: Analysis and Properties, 2nd ed.; Springer Science & Business Media: New York, NY, USA, 2013; pp. 230–232. [Google Scholar]
- Philippidis, A.; Poulakis, E.; Papadaki, A.; Velegrakis, M. Comparative study using Raman and visible spectroscopy of Cretan extra virgin olive oil adulteration with sunflower oil. Anal. Lett. 2017, 50, 1182–1195. [Google Scholar] [CrossRef]
- Baeten, V.; Hourant, P.; Morales, M.T.; Aparicio, R.D. Oil and fat classification by FT-Raman spectroscopy. J. Agric. Food Chem. 1998, 46, 2638–2646. [Google Scholar] [CrossRef]
- Aparicio, R.; Baeten, V. Edible oils and fats authentication by fourier transform raman spectrometry, biotechnol. Agron. Soc. Environ. 2000, 4, 196–203. Available online: https://popups.uliege.be:443/1780-4507/index.php?id=15058 (accessed on 8 September 2000).
- Ozaki, Y.; Cho, R.; Ikegaya, K.; Muraishi, S.; Kawauchi, K. Potential of near-infrared fourier transform raman spectroscopy in food analysis. Appl. Spectrosc. 1992, 46, 1503–1507. [Google Scholar] [CrossRef]
- Karabagias, I.; Michos, C.; Badeka, A.; Kontakos, S.; Stratis, I.; Kontominas, M.G. Classification of Western Greek virgin olive oils according to geographical origin based on chromatographic, spectroscopic, conventional and chemometric analyses. Food Res. Int. 2013, 54, 1950–1958. [Google Scholar] [CrossRef]
- Mateos, R.; Garcia-Mesa, J.A. Rapid and quantitative extraction method for the determination of chlorophylls and carotenoids in olive oil by high performance liquid chromatography. Anal. Bioanal. Chem. 2006, 385, 1247–1254. [Google Scholar] [CrossRef]
- Diraman, H.; Saygi, H.; Hisil, Y. Relationship between geographical origin and fatty acid composition of turkish virgin olive oils for two harvest years. J. Am. Oil Chem. Soc. 2010, 87, 781–789. [Google Scholar] [CrossRef]
- Kosma, I.; Badeka, A.; Vatavali, K.; Kontakos, S. Differentiation of Greek extra virgin olive oils according to cultivar based on volatile compound analysis and fatty acid composition. Eur. J. Lipid Sci. Technol. 2016, 118, 849–861. [Google Scholar] [CrossRef]
- Hellenic National Meteorogical Service. Available online: http://www.hnms.gr/emy/en/climatology/climatology_city?fbclid=IwAR3FbdBAuJRabvMy0rrGn-Eve3AOndPN_DXDDN3CCAgrL-pXi0oXjmVtmr8 (accessed on 18 May 2020).
- Inglese, P.; Famiani, F.; Galvano, F.; Servili, M. Agronomical and environmental factors affecting EVOO composition and quality. In Factors Affecting Extra-Virgin Olive Oil Composition; John Wiley & Sons, Inc.: Hoboken, NJ, USA, 2011; pp. 102–106. [Google Scholar]
- Ripa, V.; De Rose, F.; Caravita, M.A.; Parise, M.R.; Perri, E.; Rosati, A.; Pandolfi, S.; Paoletti, A.; Pannelli, G.; Padula, G.; et al. Qualitative evaluation of olive oils from new olive selections and effects of genotype and environment on oil quality. Adv. Hort. Sci. 2008, 22, 95–103. Available online: http://www.jstor.org/stable/42882623 (accessed on 24 February 2017).
- Stefanoudaki, E.; Kotsifaki, F.; Koutsaftakis, A. Classification of virgin olive oils of the two major cretan cultivars based on their fatty acid composition. J. Am. Oil. Chem. Soc. 1999, 76, 623–626. [Google Scholar] [CrossRef]
Sample Availability: Samples of the compounds are not are available from the authors. |


| Spectral Region/Method | % Successful Classification |
|---|---|
| UV 220–280 nm | 84.51 |
| UV 260–410 nm | 80.28 |
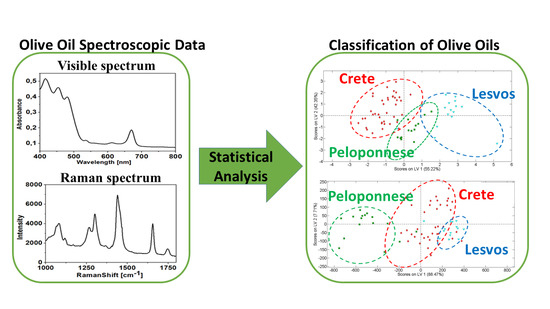
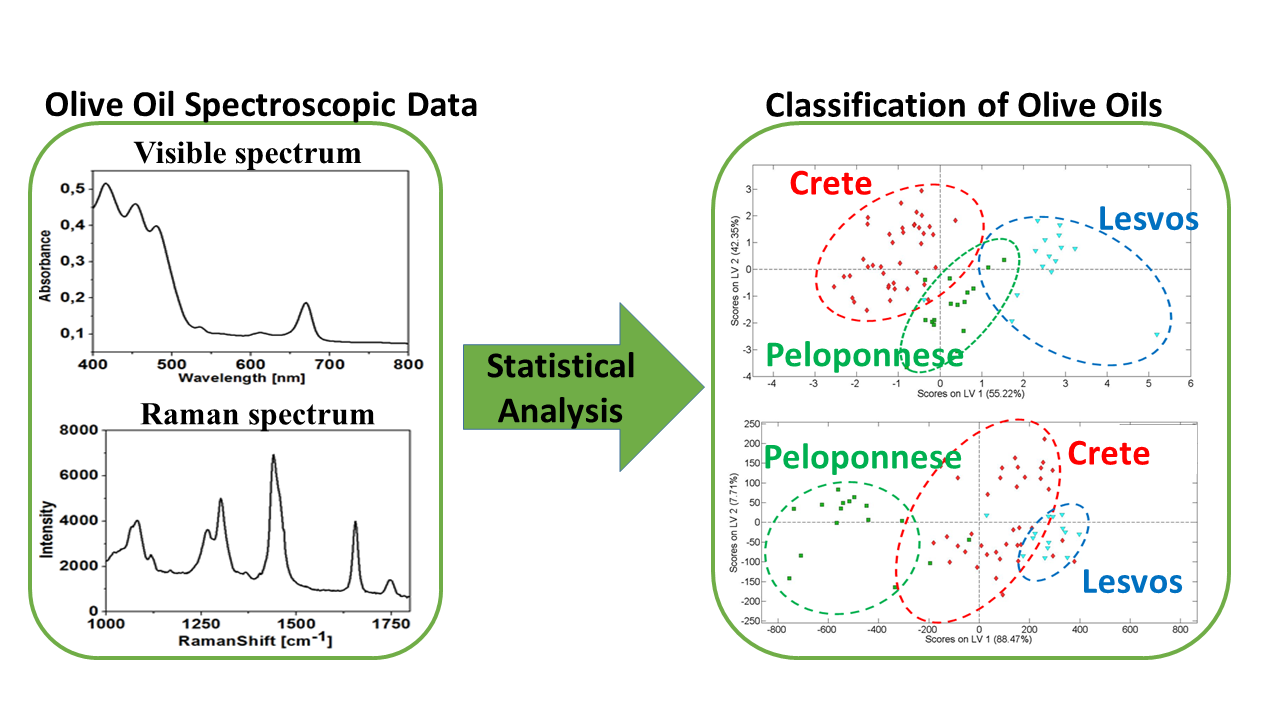
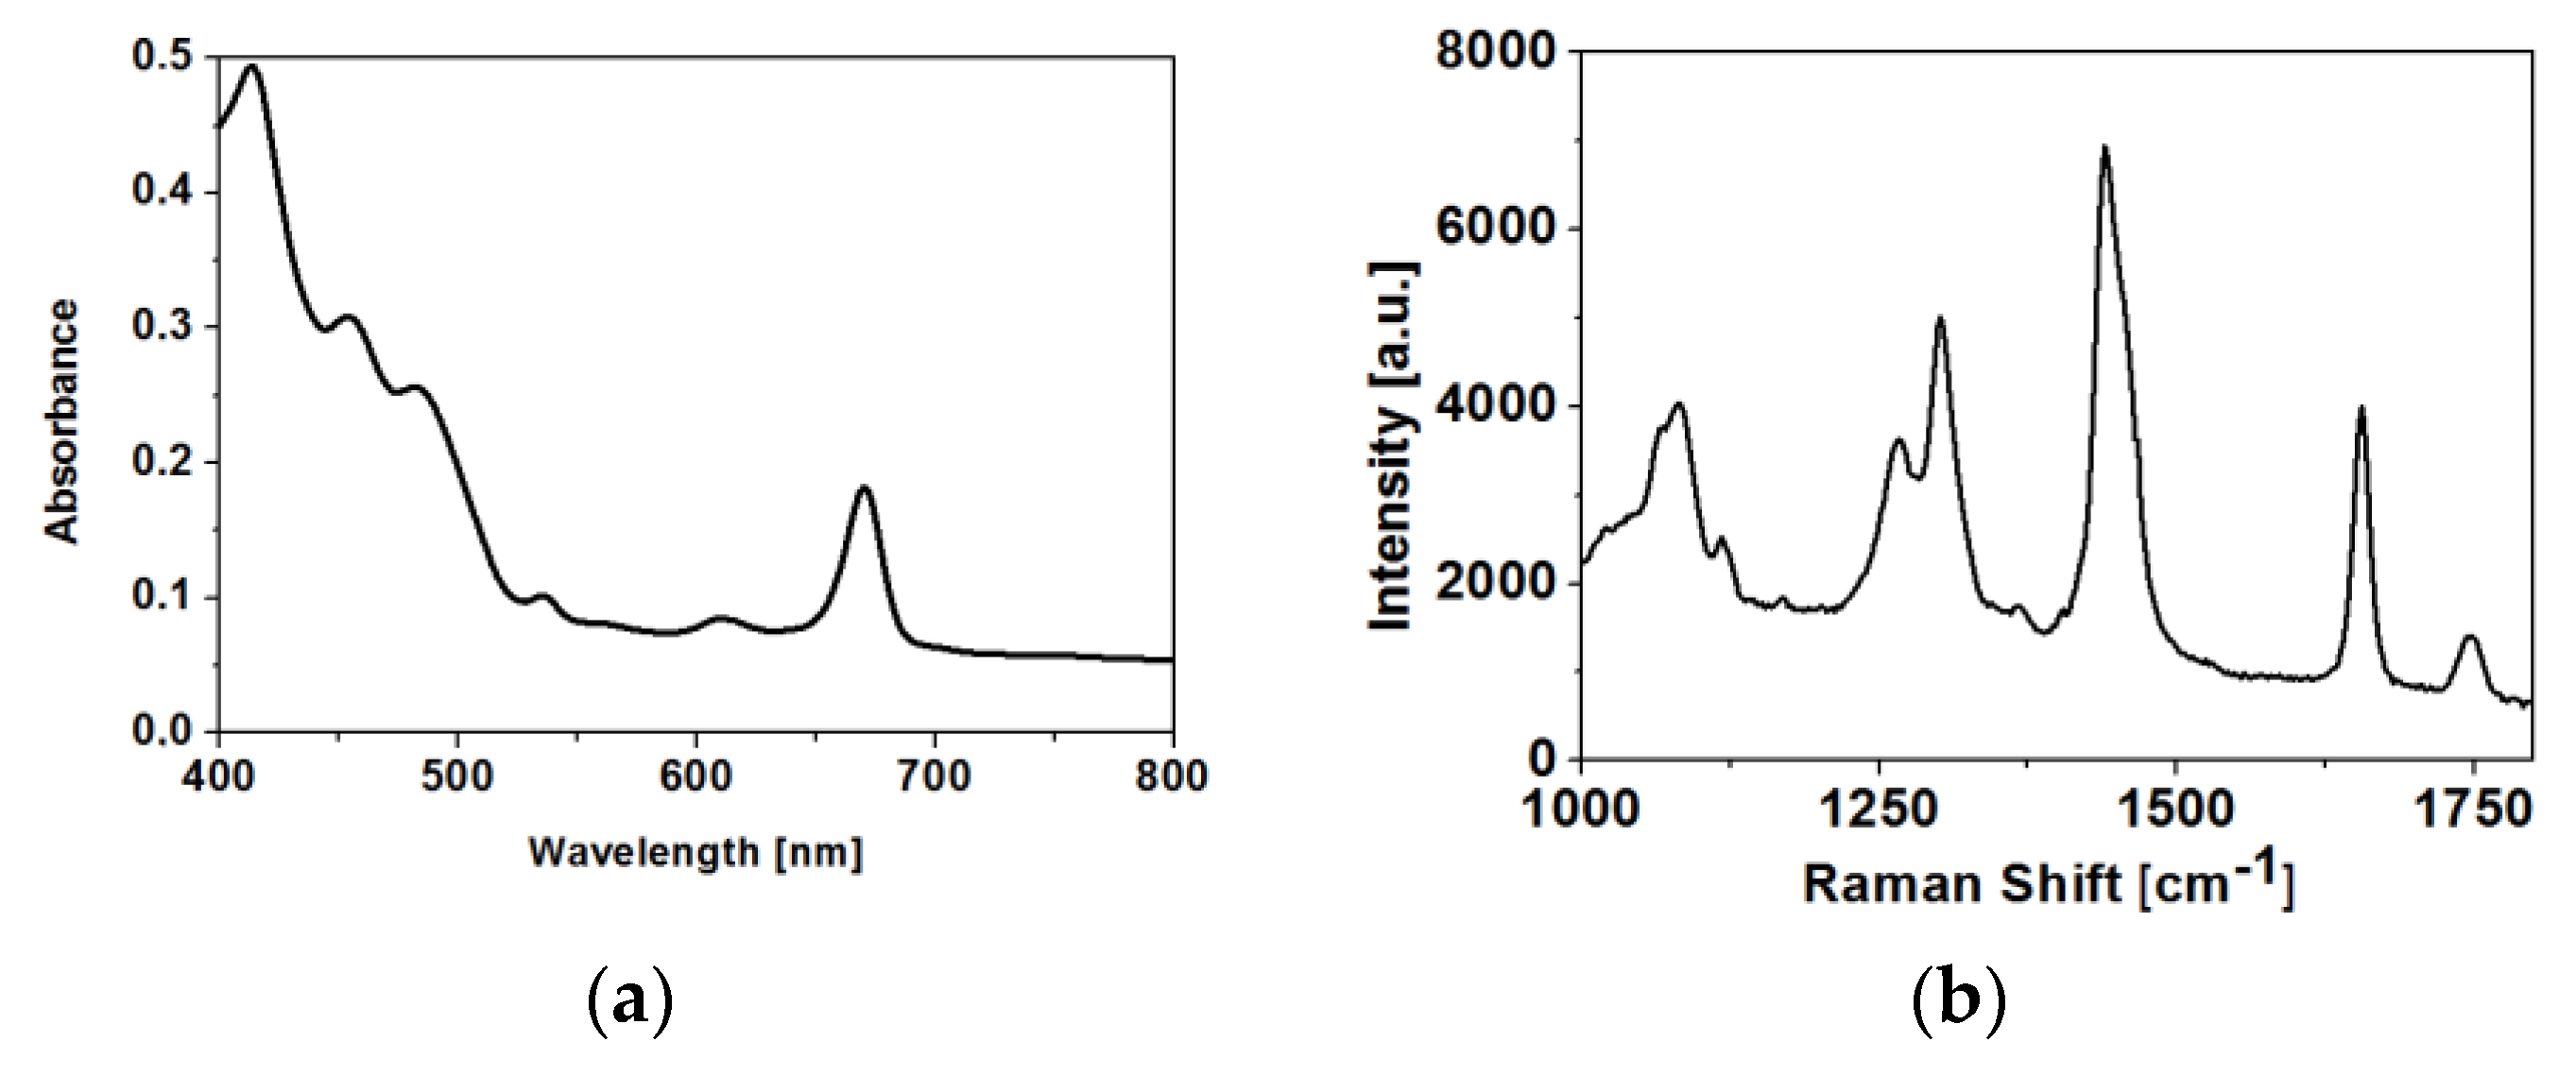
| Vis 400–800 nm | 97.18 |
| NIR 800–1600 nm | 87.18 |
| NIR 1800–2200 nm | 77.46 |
| Fluorescence | 81.69 |
| Raman | 94.37 |
| # Samples | Predicted as Crete | Predicted as Peloponnese | Predicted as Lesvos | Model Accuracy | |
|---|---|---|---|---|---|
| Crete | 40 | 40 | 0 | 0 | 100% |
| Peloponnese | 16 | 0 | 15 | 1 | 93.75% |
| Lesvos | 15 | 0 | 1 | 14 | 93.33% |
| # Samples | Predicted as Crete | Predicted as Peloponnese | Predicted as Lesvos | Model Accuracy | |
|---|---|---|---|---|---|
| Crete | 40 | 39 | 1 | 0 | 97.50% |
| Peloponnese | 16 | 2 | 14 | 0 | 87.50% |
| Lesvos | 15 | 0 | 0 | 15 | 100% |
| Crete-Peloponnese | Peloponnese-Lesvos | Crete-Lesvos | |
|---|---|---|---|
| UV 220–280 nm | R2 = 0.777 RMSECV = 13.28 | R2 = 0.675 RMSECV = 17.93 | R2 = 0.965 RMSECV = 6.21 |
| UV 260–410 nm | R2 = 0.931 RMSECV = 7.10 | R2 = 0.755 RMSECV = 13.96 | R2 = 0.968 RMSECV = 5.45 |
| Vis 400–700 nm | R2 = 0.998 RMSECV = 1.29 | R2 ≈ 1.000 RMSECV = 0.51 | R2 = 0.939 RMSECV = 6.46 |
| NIR 800–1600 nm | R2 = 0.467 RMSECV = 19.49 | R2 = 0.687 RMSECV = 14.52 | R2 = 0.605 RMSECV = 17.55 |
| Fluorescence | R2 = 0.993 RMSECV = 2.32 | R2 = 0.982 RMSECV = 3.52 | R2 = 0.980 RMSECV = 3.72 |
| Raman | R2 = 0.732 RMSECV = 14.26 | R2 = 0.723 RMSECV = 14.93 | R2 = 0.428 RMSECV = 22.21 |
© 2020 by the authors. Licensee MDPI, Basel, Switzerland. This article is an open access article distributed under the terms and conditions of the Creative Commons Attribution (CC BY) license (http://creativecommons.org/licenses/by/4.0/).
Share and Cite
Kontzedaki, R.; Orfanakis, E.; Sofra-Karanti, G.; Stamataki, K.; Philippidis, A.; Zoumi, A.; Velegrakis, M. Verifying the Geographical Origin and Authenticity of Greek Olive Oils by Means of Optical Spectroscopy and Multivariate Analysis. Molecules 2020, 25, 4180. https://doi.org/10.3390/molecules25184180
Kontzedaki R, Orfanakis E, Sofra-Karanti G, Stamataki K, Philippidis A, Zoumi A, Velegrakis M. Verifying the Geographical Origin and Authenticity of Greek Olive Oils by Means of Optical Spectroscopy and Multivariate Analysis. Molecules. 2020; 25(18):4180. https://doi.org/10.3390/molecules25184180
Chicago/Turabian StyleKontzedaki, Renate, Emmanouil Orfanakis, Georgia Sofra-Karanti, Katerina Stamataki, Aggelos Philippidis, Aikaterini Zoumi, and Michalis Velegrakis. 2020. "Verifying the Geographical Origin and Authenticity of Greek Olive Oils by Means of Optical Spectroscopy and Multivariate Analysis" Molecules 25, no. 18: 4180. https://doi.org/10.3390/molecules25184180
APA StyleKontzedaki, R., Orfanakis, E., Sofra-Karanti, G., Stamataki, K., Philippidis, A., Zoumi, A., & Velegrakis, M. (2020). Verifying the Geographical Origin and Authenticity of Greek Olive Oils by Means of Optical Spectroscopy and Multivariate Analysis. Molecules, 25(18), 4180. https://doi.org/10.3390/molecules25184180