Article

Biological Activities and ADMET-Related Properties of Novel Set of Cinnamanilides †

1
Regional Centre of Advanced Technologies and Materials, Faculty of Science, Palacky University, Slechtitelu 27, 78371 Olomouc, Czech Republic
2
Department of Chemistry, University of Silesia, Szkolna 9, 40007 Katowice, Poland
3
Department of Analytical Chemistry, Faculty of Natural Sciences, Comenius University, Ilkovicova 6, 84215 Bratislava, Slovakia
4
Central Mining Institute, Pl. Gwarkow 1, 40166 Katowice, Poland
5
Global Change Research Institute CAS, Belidla 986/4a, 60300 Brno, Czech Republic
6
Faculty of Pharmacy, Comenius University, Odbojarov 10, 83232 Bratislava, Slovakia
*
Authors to whom correspondence should be addressed.
Preliminary results presented at the 23rd International Electronic Conference on Synthetic Organic Chemistry, 15 November–15 December 2019; Available online: https://ecsoc-23.sciforum.net/.
Molecules 2020, 25(18), 4121; https://doi.org/10.3390/molecules25184121
Submission received: 24 August 2020 / Revised: 3 September 2020 / Accepted: 8 September 2020 / Published: 9 September 2020
(This article belongs to the Special Issue ECSOC-23)

Abstract

:
A series of nineteen novel ring-substituted N-arylcinnamanilides was synthesized and characterized. All investigated compounds were tested against Staphylococcus aureus as the reference strain, two clinical isolates of methicillin-resistant S. aureus (MRSA), and Mycobacterium tuberculosis. (2E)-N-[3-Fluoro-4-(trifluoromethyl)phenyl]-3-phenylprop-2-enamide showed even better activity (minimum inhibitory concentration (MIC) 25.9 and 12.9 µM) against MRSA isolates than the commonly used ampicillin (MIC 45.8 µM). The screening of the cell viability was performed using THP1-Blue™ NF-κB cells and, except for (2E)-N-(4-bromo-3-chlorophenyl)-3-phenylprop-2-enamide (IC50 6.5 µM), none of the discussed compounds showed any significant cytotoxic effect up to 20 μM. Moreover, all compounds were tested for their anti-inflammatory potential; several compounds attenuated the lipopolysaccharide-induced NF-κB activation and were more potent than the parental cinnamic acid. The lipophilicity values were specified experimentally as well. In addition, in silico approximation of the lipophilicity values was performed employing a set of free/commercial clogP estimators, corrected afterwards by the corresponding pKa calculated at physiological pH and subsequently cross-compared with the experimental parameters. The similarity-driven property space evaluation of structural analogs was carried out using the principal component analysis, Tanimoto metrics, and Kohonen mapping.

1. Introduction

Inflammatory diseases of visceral organs, joints, bones, etc. can be based on an infectious or autoimmune basis, but the body always aims to eradicate noxious agents and restore tissue homeostasis [1]. A bacterial infection is often connected with severe inflammatory diseases such as bronchial asthma [2], gingivitis, periodontitis [3], systemic lupus erythematosus [4], and even with cancer [5]. Because the bacterial infection can trigger inflammation, which can cause subsequent damage of surrounding tissue [6], it seems advantageous to follow a multi-target approach in drug design and try to prepare molecules with dual antimicrobial and anti-inflammatory activity. Multi-target drug discovery represents an innovative approach of medicinal chemistry to overcome a crisis in drug design, reflected in the small number of newly approved drugs. This approach is based on the concepts of privileged scaffolds, polypharmacology, and multifactorial diseases [7,8,9,10,11,12]. Thus, multi-target drugs can be designed for the simultaneous treatment of, for example, autoimmune, inflammatory, and invasive diseases. From pharmacoeconomic and patients’ comfort point of view, it seems favorable to treat both a cause and a consequence (bacterial infection and inflammation) simultaneously with one active substance.
Cinnamic acids are one of such privileged multi-target structures that occur naturally in all plants [13,14,15]. Cinnamic acids as well as hydroxy- and phenyl-substituted derivatives of cinnamic acids have been widely investigated due to their significant and varied biological effects including anti-inflammatory, antioxidant, hepatoprotective, antidiabetic, antidepressant/anxiolytic, antifungal, antibacterial, antiviral, and anticancer effects [16,17,18,19,20,21,22,23,24]. Derivatives of cinnamic acids are also used as agricultural fungicides [25]. Ring-substituted N-arylcinnamanilides were recently synthesized and tested for their antibacterial, antimycobacterial, anti-inflammatory potential and antifungal activity as well as for their activity related to the inhibition of photosynthetic electron transport (PET) in spinach (Spinacia oleracea L.) chloroplasts [26,27,28]. Since the N-phenylcinnamamide skeleton can be considered as a privileged scaffold providing multi-target agents, new di-, tri-, and tetra-halogenated N-arylcinnamanilides were prepared.
The biopharmaceutical profile of a compound is increasingly relevant for characterizing both the pharmacokinetic (ADMET) and pharmacodynamic aspects of drug–receptor/enzyme interactions [29,30]. The ADMET-friendly design of molecular in vivo permeability and cell bioaccumulation belongs to the field of the quantitative structure-property relationships (QSPR), where the physicochemical properties of a compound are the mathematical function of the chemical composition/constitution [31,32]. In this context, lipophilicity and its quantitative descriptor (logP) that often correlates well with the bioactivity of compounds indicate the differential partitioning of a neutral compound between two immiscible solvents (n–octanol/water) under equilibrium conditions [33,34]. The existing experimental lipophilicity dataset is negligible (3 × 10⁴) when compared to the enormous number of compounds under design; therefore, the reliable measure/estimation of lipophilicity is a valid requirement at the early stages of drug design [35]. Hence, an attractive alternative for lipophilicity estimation is in silico predictive protocols due to the additive-constitutive nature of the logP descriptor [36]. Regrettably, the comparative evaluation of implemented computational algorithms (linear or non-linear) revealed that the practical development of magic bullet (a global model for a diverse set of structural types) is dubious—the quality of lipophilicity estimation varies noticeably depending on the chemical type under consideration [37]. In order to eliminate a consequential uncertainty (over-/under-estimation) of clogP value, a possible vast range of in silico predictors should be engaged and compared with the available experimental data. As a matter of fact, early lipophilicity profiling (theoretical and/or empirical) might facilitate better decision-making in the hit→lead→seed→drug route and eradicate bad actors (false positive hits) at early stages of drug design/development according to the “fail fast, fail cheap” concept [38]. Due to the inaccuracy of clogP prediction, the potential exclusion of prospective drug molecules (false negative hits) at the preliminary step of drug discovery might happen using the Ro5 rule [39].
Depending on the target location and the track of administration, chemicals are exposed to pH variations in the physiological environment (pH = 2–12). In the case of non-ionizable compounds, only neutral species exist; however, the majority of commercial pharmaceuticals contain an ionizable moiety—approximately 75% are basic, and 20% are acidic [40]. In fact, even partial ionization of a molecule results in the depletion of calculated/measured lipophilicity; therefore, the distribution coefficient logDpH (the pH dependent version of logP) should be taken into consideration [41]. In fact, logDpH potentially accumulates errors due to the logP and dissociation constant (pKa) estimations according to the following formulas: logD pH   =   logP log [ 1 + 10 ( pH pK a ) ] for acids and logD pH   =   logP log [ 1 + 10 ( pK a pH ) ] for bases [42]. On the other hand, in many systems, ionic species enter the non-aqueous phase, and therefore a more rigorous approach would be appropriate, but this is beyond the scope of this paper.
In the presented study, a set of cinnamic acid anilide derivatives was synthesized, investigated for biological activity, and characterized by a series of experimental lipophilicity values generated using reversed-phase high-performance liquid (RP-HPLC) and reversed-phase thin-layer chromatography (RP-TLC). The similarity-related property space evaluation for the congeneric series of structurally-based analogs was carried out using the principal component analysis (PCA). Moreover, the in silico approximation of the lipophilic values for the ensemble of anilides 120 was performed employing a set of free/commercial clogP estimators, corrected afterwards by the corresponding pKa calculated at physiological pH and subsequently cross-compared with the experimental parameter. The mean values of the selected molecular descriptors that average over the chosen calculation methods were subsequently correlated with the logD7.4 parameter, namely consensus clogP. Finally, the similarity-driven investigation using Tanimoto metrics and Kohonen mapping was conducted revealing some structural dissimilarities within the analyzed series of compounds.

2. Results and Discussion

2.1. Synthesis and Biological Screening

All compounds were synthesized from cinnamic acid in a microwave reactor: The carboxyl group was converted with phosphorus trichloride to acyl chloride, which then reacted with the appropriately substituted aniline to give the desired product (Scheme 1). The structures and biological activities are reported in Table 1, and empirically evaluated lipophilicity using RP-HPLC and RP-TLC are listed in Table 2.

2.1.1. In Vitro Antimicrobial Evaluation

The investigated compounds were tested on their antistaphylococcal activity against three clinical isolates of methicillin-resistant Staphylococcus aureus (MRSA) and S. aureus ATCC 29213 as the reference and quality control strain. Moreover, all compounds were tested against Mycobacterium tuberculosis ATCC 25177/H37Ra (see Table 1). As a matter of fact, all compounds showed very limited antimicrobial activity with the exception of compound 10 (R = 3-F-4-CF3) that revealed a significant effect against both S. aureus and MRSA isolates. It confirmed our previous findings, where compounds with CF3 moiety showed high antistaphylococcal and antitubercular activity [26,27]. Consequently, it was expected that other compounds with the CF3 motif, such as 13 (R = 2-Br-5-CF3) and 19 (R = 2,6-Br-4-CF3) or compound 6 (R = 3,4,5-Cl), derived from 3,5-Cl (highly effective against M. tuberculosis) should have similar activity [26]. Unfortunately, only molecule 10 turned out to be active. Because the minimum inhibitory concentrations (MICs) of compound 10 are the same against both S. aureus and MRSA isolates (25.9 and 12.9 μM), it can be speculated concerning the specific activity against Staphylococcus sp. In addition, all compounds were verified against the reference strain Enterococcus faecalis ATCC 29212 and three vanA-carrying vancomycin-resistant E. faecalis (VRE) isolates; however no activity was recorded.
It is should be emphasized that besides MIC values, minimum bactericidal concentrations (MBCs) were also determined for compound 10. All MBC values were equal to the MIC values, indicating that compound 10 showed not only bacteriostatic but bactericidal activity. In fact, a tested compound is classified as bactericidal if the ratio of its MBC/MIC values is ≤4 [43].
Finally, 3-(4,5-dimethylthiazol-2-yl)-2,5-diphenyltetrazolium bromide (MTT) assay of effective antistaphylococcal compound 10 was conducted as well. The MTT test is employed to assess cell growth by measuring respiration. The MTT measured viability of bacterial cells less than 70% [44] after the exposure to the MIC values of tested compound is considered as a positive result of this assay, because this low level of cell viability indicates the inhibition of cell growth by the inhibition of respiration [45]. It can be concluded that compound 10 showed a significant decrease in viability to 13.4 ± 0.1%, which is far below the limit of 70% viability of S. aureus ATCC 29213 at the tested concentration equal to MIC (i.e., 25.9 µM (8 µg/mL).

2.1.2. In Vitro Cell Viability and Anti-Inflammatory Potential

In vitro cell viability of all the compounds was estimated using the human THP1-Blue™ NF-κB cell line. Almost all tested compounds showed insignificant cytotoxic effect (IC50 > 20 µM) (Table 1) with exception of molecule 11 (R = 3-Cl-4-Br, IC50 = 6.5 ± 1.0 µM). It seems that the disubstitution of C(3,4)’ by highly lipophilic and electron-withdrawing moieties (combination of chlorine and bromine) is critical for the toxic effect of the analyzed series of compounds.
With respect to the used THP1-Blue™ NF-κB cells, the anti-inflammatory potential of compounds was evaluated in order to modulate the activity of the pro-inflammatory transcription nuclear factor (NF)-κB (see Figure 1). After lipopolysaccharide (LPS) stimulation, compounds 14 (R = 2-CF3-4-F), 18 (R = 3-CF3-4-NO2), and 20 (R = 2,6-Br-3-Cl-4-F) showed the highest attenuation of the activity of this transcription factor within the studied set of compounds; however, the decrease was approximately 9%, which was lower compared to the previously verified cinnamides [28]. On the other hand, the half concentration of tested compounds was used in the study. As a matter of fact, compounds 2 (R = 2,4,6-F), 4 (R = 2,4-Cl), 5 (R = 2,4,5-Cl), and 10 (R = 3-F-4-CF3) significantly increased the activity of NF-κB by 10–15%, respectively. It seems that the position and type of substituents on phenyl ring is important for tuning pro-/anti-inflammatory potential of cinnamic acid anilides, which confirms similar observations in our previous study, where the substitution of ortho and meta positions of the anilide ring by rather lipophilic and bulky moieties was preferred for the anti-inflammatory potential [28].
Surprisingly, the insignificant anti-inflammatory potential of compound 13 (R = 2-Br-5-CF3) is disappointing, because its chlorinated analogue showed promising activity [28]. It can be hypothesized that the investigated N-arylcinnamanilides may have a different mode of action, which may be the nuclear translocation of NF-κB inhibition, or affecting its binding to DNA, or acting by epigenetic regulation, while combinations of these effects are not excluded.

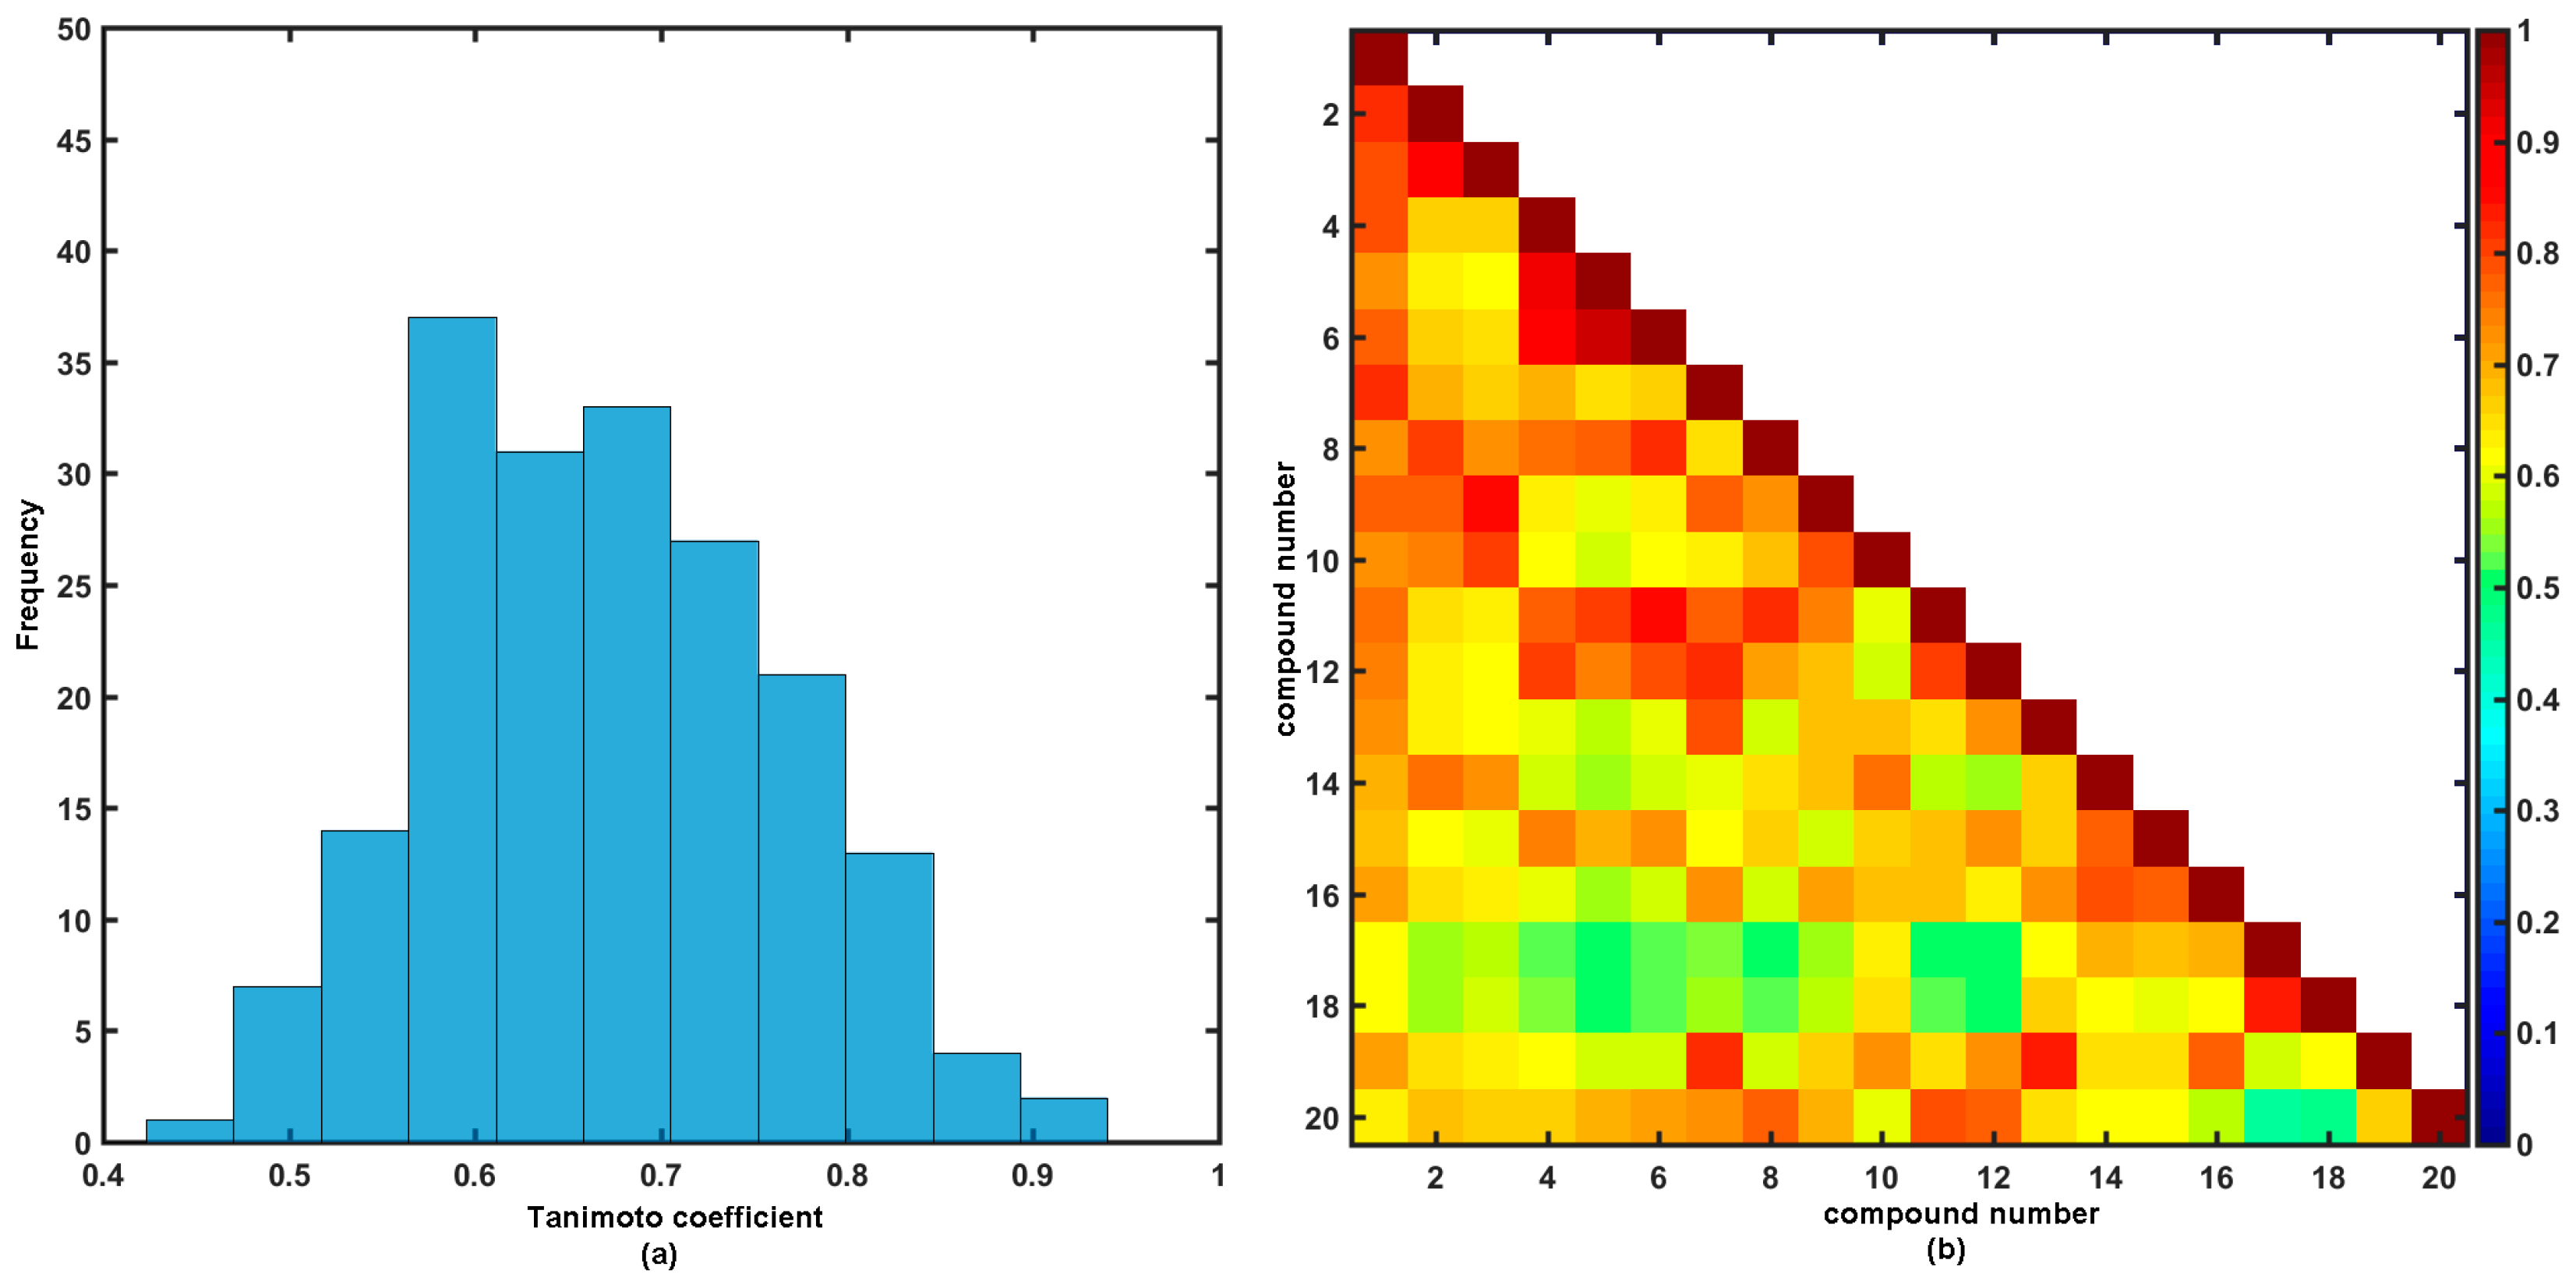
2.2. Similarity-Driven Property Evaluation

The similarity-guided assessment of the property profile for the group of structurally alike compounds was conducted for the congeneric set of cinnamic acid anilide analogues. The a priori calculation of molecular descriptors, regarded as the result of mathematical transformation of chemical information encoded within a symbolic representation of a molecule is crucial for the compound’s bioavailability and hence critical for the prospective drug candidate properties. The gold standard of ADMET–tailored property approximation is the generation of statistically robust models, where a property is a function of the chemical structure, that are capable of making accurate quantitative predictions, including those of molecular binding affinity, metabolic/pharmacokinetic/ pharmacodynamics fate, or environmental ecotoxicology. The molecular descriptors are essentially estimated based on the molecular structure as intuitive roadmaps even before the synthesis of the molecule has been rationalized. In fact, the majority of topological descriptors is highly intercorrelated; therefore, it is necessary to employ the linear (e.g., PCA) or non-linear (e.g., neural network) techniques to reduce the data dimensionality and illustrate the object similarity in the orthogonal basis using the pair-wise descriptor-based structural resemblance/relatedness measure of the intermolecular resemblance between two objects (e.g., Euclidean metric) [46]. Initially, the principal component analysis (PCA) was performed on the pool of 2567 descriptors calculated using Dragon 6.0 program, where constant and nearly constant variables (standard deviation <10−4) were a priori eradicated. Subsequently, the multidimensional matrix was generated (X20×2567) with rows and columns representing variables (descriptors) and objects (molecules), respectively. The PCA procedure was employed on the centered and standardized dataset. The compression efficacy of the PCA method is strictly related to the number of uncorrelated variables; therefore, the high percentage of total variance explained by the first three principal components (PC1 + PC2 + PC3 = 77.98%) implies, that descriptors are highly inter-correlated. In fact, first two PCs described 71.44% of the total variance; hence, the chosen properties were projected on the plane specified by the PC1 versus PC2-predicted scores as illustrated in Figure 2a.
Basically, two subfamilies can be formed along the positive and negative values of PC1 for the analyzed 120 anilides that share a common chemotype based on styrene-containing motif, peptide-like linker, and phenyl R-substituted ring. The first group (PC1 > 0) contains di/tri/tetra-halogenated analogues (objects 29, 11, 12, 20), while the second one (PC1 < 0) is composed of mono-trifluoromethyl-based molecules (objects 10, 1319). Interestingly, compounds 19 and 20 are located distinctly along the second principal component (PC2 < −30). Not surprisingly, unsubstituted (only hydrogenated) molecule 1 is separated from the remaining ones. The similarity-driven analysis of the empirical lipophilicity at the physiological pH = 7.4 is illustrated on the PC1 vs. PC2 plane. In fact, the most lipophilic molecules 57 and 11 are grouped together as shown in Figure 2b.
On the whole, the vast number of the investigated anilides abide the Lipinski’s Rule of Five (Ro5), where the ADMET-friendly properties are confined by the liminal values imposed on the specific molecular descriptors (MW ≤ 500, HBD ≤ 5, HBA ≤ 10, clogP ≤ 5). Interestingly, the Ro5 violation observed for molecules depicted in Figure 3a is strictly related with the calculated lipophilicity values (clogP > 5). Despite the drug-like property space is still a questionable concept, because a good drug-like score does not make a molecule a drug and vice versa, the Ro5 rule might be handy in differentiating a prospective drug from a non-drug molecule [47]. Moreover, almost all tested compounds showed very low cytotoxic effect (IC50 > 20 µM) as presented in Figure 3b and Table 1. Compound 11 (IC50 = 6.5 µM) is the visible exception, which is also annotated with Ro5 violation. As mentioned above, it seems that the C(3,4)’ disubstitution by chlorine and bromine is critical for the viability of cells unlike the disubstitution of C(2,4)’ positions. Since the lipophilicity is regarded as a meaningful property in the context of pharmacokinetic and pharmacodynamic drug-receptor interactions, the lipophilic profiles of the analyzed anilide analogues were thoroughly investigated.
From the drug hunter perspective, the justifiable precariousness of the validity of lipophilicity estimation can arise, using a variety of theoretical approaches, because some methods for the theoretical calculation of lipophilicity might be more or less suitable for specific/heterogeneous series of compounds. In other words, the non-trivial question arises how to single out the best-suited method or combination of methods for clogP estimation of new compounds. It is known that a jack of all trades is a master of none; therefore, it seems advisable not to rely solely on one clogP estimator, but rather a combination of methods should be engaged with subsequent comparison of the results with the experimental data. Hence, a consensus procedure for clogP prediction was previously proposed based on a consensus methodology that was adopted from the structure-based studies, where many docking programs and scoring functions can be employed [48,49,50]. Thus, in silico approximation of the lipophilic values for the ensemble of anilides 120 was performed employing a set of free/commercial clogP estimators such as clogPS, Molinspirations, OSIRIS, HyperChem 7.0, Sybyl-X, MarvinSketch 15, ACD/ChemSketch 2015, Dragon 6.0, Kowwin, XlogP3, ChemDraw, and ACD/Percepta (Table S1 in Supplementary Materials). Moreover, the deduced clogP values were corrected afterwards by the corresponding pKa calculated at specific pH using ACD/Percepta/pKa Classic module (Table S2 in Supplementary Materials). The obtained clogDpH does not differ significantly from clogP specified by distinct in silico principles, because the investigated molecules do not contain an ionizable moiety. Furthermore, the clogD7.4 findings were inter-correlated with each other and cross-compared with the empirical logD7.4 values as illustrated by the triangular matrix of linear correlations parameters in Figure 4.
In fact, relatively good correlation (r > 0.65) between experimental logD7.4 and model-predicted clogD7.4 values was recorded for clogPS, ChemSketch, Sybyl, XlogP3, and Kowwin estimators. On the other hand, rather poor correlation (r ≤ 0.4) was revealed for data provided by HyperChem and Dragon predictors (see Figure 4). The noticeable variations in logD estimation at given pH probably resulted from different computational algorithms (atom/fragment- or descriptor-based) implemented in the software and/or training data engaged at the training stage. Obviously, prediction of the individual lipophilic contribution of each group/atom (sometimes augmented by the structural correction factors) is as good as the modeling data used at the training stage of model generation [51]. In other words, the poorer performance of some predictors focuses on issues arising from the lipophilicity estimation for the in house collection of molecules with structural features uncovered by chemical classes of compounds in the training subset—a wide range of chemical space is still not covered [52]. Luckily, usually a few empirically measured values are sufficient to produce reliable lipophilicity estimation for structurally related series of molecules. Hence, the integrated clogD7.4 matrix (X20×14) and empirical logD7.4 were subjected to the backward elimination PLS-based procedure (IVE) indicating Sybyl-X, XlogP3, Kowwin, ACD/Percepta, and HyperChem as valid contributors to the final QSPR model ( q c v 2   =   0.72 ,   q t e s t 2   =   0.9 ,   A o p t   =   7 ). The mean and median values of the selected estimators that averaged over the chosen clogD7.4 values were subsequently correlated with the experimental parameter with correlation coefficient 0.65, because not only the best inter-correlated clogD7.4 values were specified in the consensus clogP approach.
The similarity tenet in the chemical space (CS) is the core of many SAR-driven procedures, where structurally alike molecules are expected to display similar physicochemical and/or pharmacological properties [53]. Conceptually, a numerical measure of molecular diversity between two objects can be quantitatively expressed by a bit-string representation (sometimes augmented with the scaling coefficients) in the function of (un-)common features. Unarguably, it is still a powerful concept despite some obvious oversimplification of the similarity quantification (e.g., some similarity scores exhibit size-dependent behavior) [54]. The pairwise relatedness between descriptor-guided structures can be numerically evaluated by a variety of relative distance metrics (e.g., Hamming or Euclidean measures) or absolute comparison using Tanimoto coefficient calculated for molecular fingerprints (e.g., OpenBabel) [55]. The distribution of Tanimoto coefficients for the ensemble of investigated anilides 120 is illustrated in Figure 5a, where the highest frequency was recorded in the pretty wide range of 0.55 < T < 0.75. The detailed inspection of the symmetric Tanimoto coefficient matrix (T20×20) in Figure 5b reveals the structural dissimilarities of nitro-substituted isomers (compounds 17 and 18) as compared with the remaining ones that confirms our previous PCA (PC1 < −60) findings (see Figure 2a). Interestingly, mono-bromo/chloro- substituted isomers (molecules 11 and 12) indicate the structural similarity to di-/tri-bromo/chloro- substituted positional isomers (compounds 49) as was also shown in Figure 2a (PC1 > 20). Unfortunately, the similarity investigation did not provide valuable hints that could explain the noticeable variations in the toxic effect exerted by molecule 11 (see Figure 3b) and the remaining ones.

Comparative Molecular Shape Analysis

The molecular shape analysis of the cinnamic acid anilides was performed, because the molecular electrostatics and lipophilicity are two important properties used in the rational drug design. Firstly, the 11-ordered atom trial alignment of the most active molecule 10 (active analogue approach, AAA) was applied to cover the entire bonding topology in the maximal common structure (MCS) in the FIT method as illustrated in Figure 6.
Secondly, the molecular electrostatic potentials (MESP) on the Connolly surface were specified to provide information on the charge distribution of the substituted anilides. The interrelation between electrostatic and lipophilicity potentials on molecular surfaces was reported previously [56]. The electron-rich positions seem to appear at low, possibly negative, electrostatic potential energy values (see Figure 7). In other words, low MESP values indicate molecular areas susceptible to electrophilic attack (nucleophilic positions), while greater electrostatic values correspond to electrophilic positions. Noticeably, the negative MESP values (dark blue areas) in the close proximity of the substituted anilide ring seem to contribute to the MIC activity of molecule 10. Obviously, the introduction and composition of electronegative or electropositive substituents have an impact on the lipophilicity values as well.
The spatial MESP distribution does not provide a practical tool for molecular comparison; therefore, simpler, comparative 2D Kohonen maps of the entire molecular surface were generated [57]. Self-organizing Kohonen neural mapping (SOM) is a nonlinear projection procedure that reduces the input data dimensionality (e.g., converts 3D objects to 2D), while preserving the topological relationships between the input and output data [58]. Moreover, a trained network can be engaged to project the specified molecular property (expressed as a vector) by generating a 2D color-coded clustering pattern called a feature map. The SOM algorithm was employed to generate an electrostatic potential map in the form of a two-dimensional topographic pattern produced from input signals (points) that were sampled randomly at the molecular surface as illustrated in Figure 8. The substitution of the anilide ring by a rather bulky motif (e.g.,-CF3) was preferred for the anti-inflammatory potential and lipophilic compound property; therefore, a mono-trifluoro- methyl-based molecule with highly electronegative substituent (e.g.,-F) was chosen as a template (the most active molecule 10) to proceed the remaining (counter-template) molecules. The structural inconsistences (dissimilarities) within the analyzed set of compounds are indicated by the number of inactive (empty/white) neurons in the map (see Figure 8). Unfortunately, there are no clear and visible variations in the surface charge distribution within 40 × 40 maps between substituted analogues, with exception of molecules 17 and 18. Not surprisingly, the lowest number of non-active neurons of the comparative maps (less than 200 out of 1600) is prescribed to the similarly substituted (position 3 and 4 of the anilide ring) molecules 9, 11, and 18.

3. Materials and Methods

3.1. Chemistry

3.1.1. General Information

All reagents were purchased from Merck (Sigma-Aldrich, St. Louis, MO, USA) or Alfa (Alfa-Aesar, Ward Hill, MA, USA). Reactions were performed using a CEM Discover SP microwave reactor (CEM, Matthews, NC, USA). Melting points were determined on an apparatus Stuart SMP10 (Stone, UK) and are uncorrected. Infrared (IR) spectra were recorded on an ATR Zn/Se for a Nicolet™ iS 5 FT-IR spectrometer (Thermo Fisher Scientific, West Palm Beach, FL, USA). The spectra were obtained by the accumulation of 64 scans with 4 cm−1 resolution in the region of 4000–400 cm−1. All 1H- and 13C-NMR spectra were recorded on a JEOL JNM-ECA 600II NMR spectrometer (600 MHz for 1H and 150 MHz for 13C, Jeol, Tokyo, Japan) in dimethyl sulfoxide-d6 (DMSO-d6); 1H and 13C chemical shifts (δ) are reported in ppm. High-resolution mass spectra were measured using a high-performance liquid chromatograph Dionex UltiMate® 3000 (Thermo Scientific, West Palm Beach, FL, USA) coupled with an LTQ Orbitrap XLTM Hybrid Ion Trap-Orbitrap Fourier Transform Mass Spectrometer (Thermo Scientific) equipped with a HESI II (heated electrospray ionization) source in the negative mode.

3.1.2. Synthesis

Cinnamic acid (3.37 mM) was suspended at room temperature in dry chlorobenzene (20 mL) inside a microwave tube, where phosphorus trichloride (1.7 mM) and the corresponding aniline derivative (3.37 mM) were added dropwise. Following this step, a magnetic stirrer was added to the tube and the reaction mixture was transferred to the microwave reactor (max. 500 W) at 130 °C for 30 min, where the synthesis at elevated pressure was performed. After the mixture was cooled to 60 °C, the solvent was evaporated in vacuum. A solid residue was washed with 2M HCl, and a crude product was recrystallized, using 96% ethanol first, and then 50% ethanol [26,28].
(2E)-N-Phenyl-3-phenylprop-2-enamide (1) was described previously by Pospisilova et al. [26].
(2E)-3-Phenyl-N-(2,4,6-trifluorophenyl)prop-2-enamide (2), Yield 72%; Mp 134–136 °C; IR (cm−1): 3244, 3078, 3024, 1659, 1631, 1612, 1525, 1443, 1336, 1239, 1177, 1124, 1045, 999, 972, 861, 843, 764, 751, 705, 666, 612, 572, 533, 513, 481; 1H-NMR (DMSO-d6), δ: 9.91 (s, 1H), 7.65–7.64 (m, 2H), 7.61 (d, J = 15.8 Hz, 1H), 7.47–7.41 (m, 3H), 7.32 (t, J = 8.2 Hz, 2H), 6.85 (d, J = 15.8 Hz, 1H); 13C-NMR (DMSO-d6), δ: 163.95, 159.93 (d, J = 245.7 Hz), 157.88 (ddd, J = 250.0 Hz, 15.9 Hz, 8.7 Hz), 141.19, 134.44, 130.02, 129.03, 127.87, 120.35, 111.48 (td, J = 17.3 Hz, J = 5.8 Hz), 100.95 (m) (Figure S1); HR-MS: C15H9ONF3 [M − H] calculated 276.0642 m/z, found 276.0634 m/z (Figure S2).
(2E)-3-Phenyl-N-(3,4,5-trifluorophenyl)prop-2-enamide (3), Yield 74%; Mp 169–171 °C; IR (cm−1): 3303, 1661, 1617, 1545, 1530, 1451, 1426, 1338, 1238, 1208, 1195, 1044, 1013, 976, 858, 848, 805, 770, 761, 717, 642, 628, 561, 509, 481; 1H-NMR (DMSO-d6), δ: 10.58 (s, 1H), 7.64–7.67 (m, 5H), 7.46–7.41 (m, 3H), 6.74 (d, J = 15.8 Hz, 1H); 13C-NMR (DMSO-d6), δ: 164.02, 150.09 (ddd, J = 244.2 Hz, J = 10.1 Hz, J = 5.8 Hz), 141.33, 135.56 (td, J = 11.6 Hz, J = 4.3 Hz), 134.70 (dt, J = 244.2 Hz, J = 15.9 Hz), 134.38, 130.10, 129.05, 127.89, 121.25, 103.45 (m) (Figure S3); HR-MS: C15H9ONF3 [M − H] calculated 276.0642 m/z, found 276.0633 m/z (Figure S4).
(2E)-N-(2,4-Dichlorophenyl)-3-phenylprop-2-enamide (4), Yield: 62%; Mp 159–161 °C; IR (cm−1): 3264, 3071, 3027, 1654, 1620, 1578, 1524, 1471, 1448, 1380, 1335, 1283, 1238, 1202, 1182, 1144, 1099, 1072, 1053, 1029, 1005, 999, 969, 858, 826, 787, 757, 725, 710, 697, 658, 632, 560, 559, 513, 488, 445; 1H-NMR (DMSO-d6), δ: 9.78 (s, 1H), 7.98 (d, J = 8.9 Hz, 1 H), 7.69 (d, J = 2.1 Hz, 1H), 7.65–7.64 (m, 2H), 7.62, (d, J = 15.8 Hz, 1H), 7.47–7.41 (m, 4H), 7.11 (d, J = 15.8 Hz, 1H); 13C-NMR (DMSO-d6), δ: 164.02, 141.17, 134.62, 134.21, 129.99, 129.09, 129.05, 128.95, 127.88, 127.59, 126.57, 126.43, 121.54 (Figure S5); HR-MS: C15H10ONCl2 [M − H] calculated 290.01450 m/z, found 290.0140 m/z (Figure S6).
(2E)-3-Phenyl-N-(2,4,5-trichlorophenyl)prop-2-enamide (5), Yield: 52%; Mp 170–172 °C; IR (cm−1): 3265, 3107, 3061, 3011, 1656, 1629, 1600, 1568, 1511, 1456, 1446, 1364, 1281, 1248, 1202, 1181, 1129, 1074, 1031, 962, 942, 880, 855, 798, 756, 729, 706, 688, 675, 631, 579, 564, 499, 465, 448; 1H-NMR (DMSO-d6), δ: 9.85 (s, 1H), 8.33 (s, 1H), 7.94 (s, 1H), 7.66–7.65 (m, 2H), 7.64 (d, J = 15.8 Hz, 1H), 7.48–7.42 (m, 3H), 7.16 (d, J = 15.8 Hz, 1H).; 13C-NMR (DMSO-d6), δ: 164.23, 141.68, 135.18, 134.52, 130.55, 130.12, 129.84, 129.05, 127.95, 126.89, 125.31, 124.45, 121.29 (Figure S7); HR-MS: C15H9ONCl3 [M − H] calculated 323.9755 m/z, found 323.9751 m/z (Figure S8).
(2E)-3-Phenyl-N-(3,4,5-trichlorophenyl)prop-2-enamide (6), Yield: 75%; Mp 237–239 °C; IR (cm−1): 3157, 3080, 1655, 1613, 1583, 1513, 1433, 1378, 1337, 1281, 1245, 1196, 1188, 1148, 1011, 998, 967, 944, 880, 860, 815, 762, 711, 685, 617, 602, 575, 536, 483; 1H-NMR (DMSO-d6), δ: 10.62 (s, 1H), 7.95 (s, 2H), 7.65–7.62 (m, 3H), 7.47–7.42 (m, 3H), 6.74 (d, J = 15.8 Hz, 1H); 13C-NMR (DMSO-d6), δ: 164.16, 141.63, 139.28, 134.31, 132.91, 130.20, 129.08, 127.96, 123.40, 121.14, 119.19 (Figure S9); HR-MS: C15H9ONCl3 [M − H] calculated 323.9755 m/z, found 323.9752 m/z (Figure S10).
(2E)-N-(2,4-Dibromophenyl)-3-phenylprop-2-enamide (7), Yield: 49%; Mp 180–182 °C; IR (cm−1): 3263, 2980, 2888, 1653, 1620, 1575, 1521, 1464, 1446, 1376, 1336, 1280, 1240, 1203, 1184, 1080, 1040, 1007, 967, 859, 825, 766, 755, 711, 688, 643, 619, 566, 546, 501, 472, 440; 1H-NMR (DMSO-d6), δ: 9.68 (s, 1H), 7.94 (d, J = 2.1 Hz, 1H), 7.78 (d, J = 8.9 Hz, 1H), 7.65–7.60 (m, 4H), 7.47–7.41 (m, 3H), 7.06 (d, J = 15.8 Hz, 1H); 13C-NMR (DMSO-d6), δ: 163.93, 141.13, 135.88, 134.61, 134.55, 130.98, 129.99, 129.05, 127.88, 127.73, 121.50, 117.97, 117.66 (Figure S11); HR-MS: C15H10ONBr2 [M − H] calculated 377.9134 m/z, found 377.9106 m/z (Figure S12).
(2E)-N-(5-Chloro-2-fluorophenyl)-3-phenylprop-2-enamide (8), Yield: 59%; Mp 118–120 °C; IR (cm−1): 3244, 3188, 3119, 3042, 1663, 1622, 1612, 1541, 1481, 1415, 1343, 1268, 1253, 1202, 1182, 1112, 996, 915, 871, 808, 761, 737, 679, 646, 574, 566, 502, 485, 454; 1H-NMR (DMSO-d6), δ: 10.13 (s, 1H), 8.31 (dd, J = 6.9 Hz, J = 2.7 Hz, 1H), 7.64–7.61 (m, 3H), 7.47–7.41 (m, 3H), 7.35 (dd, J = 11.0 Hz, J = 8.9 Hz, 1H), 7.22–7.19 (m, 1H), 7.11 (d, J = 15.8 Hz, 1H); 13C-NMR (DMSO-d6), δ: 164.22, 151.55 (d, J = 245.6 Hz), 141.31, 134.58, 130.04, 129.06, 128.02 (d, J = 2.9 Hz), 127.89 (d, J = 13.0 Hz), 127.87, 124.14 (d, J = 7.2 Hz), 122.23, 121.48, 116.98 (d, J = 21.7 Hz) (Figure S13); HR-MS: C15H10ONClF [M − H] calculated 274.0440 m/z, found 274.0435 m/z (Figure S14).
(2E)-N-(4-Bromo-3-fluorophenyl)-3-phenylprop-2-enamide (9), Yield: 69%; Mp 146–148 °C; IR (cm−1): 3405, 1673, 1625, 1598, 1514, 1473, 1450, 1414, 1333, 1302, 1240, 1204, 1190, 1155, 1135, 1045, 988, 976, 944, 868, 857, 812, 780, 763, 738, 707, 683, 642, 572, 564, 544, 518, 518; 1H-NMR (DMSO-d6), δ: 10.55 (s, 1H), 7.89 (dd, J = 8.9 Hz, J = 4.0 Hz, 1H), 7.67–7.61 (m, 4H), 7.47–7.41 (m, 3 H), 7.36 (dd, J = 8.9 Hz, J = 2.1 Hz, 1H), 6.79 (d, J = 15.8 Hz, 1H); 13C-NMR (DMSO-d6), δ: 163.95, 158.08 (d, J = 242.8 Hz), 141.13, 140.43 (d, J = 10.1 Hz), 134.48, 133.41, 130.06, 129.08, 127.88, 121.54, 116.59 (d, J = 2.9 Hz), 107.19 (d, J = 26.0 Hz), 100.83 (d, J = 21.7 Hz) (Figure S15); HR-MS: C15H10ONBrF [M − H] calculated 317.9935 m/z, found 317.9929 m/z (Figure S16).
(2E)-N-[3-Fluoro-4-(trifluoromethyl)phenyl]-3-phenylprop-2-enamide (10), Yield 69%; Mp 139–141 °C; IR (cm−1): 8336, 1671, 1624, 1560, 1521, 1506, 1452, 1424, 1413, 1338, 1319, 1205, 1192, 1162, 1117, 1049, 996, 970, 666, 827, 767, 763, 738, 710, 633, 603, 565, 536, 507, 484; 1H-NMR (DMSO-d6), δ: 10.78 (s, 1H), 7.95 (dd, J = 13.7 Hz, 1H), 7.75 (t, J = 8.6 Hz, 1H), 7.67 (d, J = 15.8 Hz, 1H), 7.68–7.65 (m, 2H), 7.54 (d, J = 8.2 Hz, 1H), 7.48–7.42 (m, 3H), 6.82 (d, J = 15.8 Hz, 1H); 13C-NMR (DMSO-d6), δ: 164.33, 159.20 (dq, J = 248.5 Hz, J = 2.9 Hz), 144.96 (d, J = 11.6 Hz), 141.74, 134.36, 130.20, 129.08, 127.95, 127.87 (m), 122.82 (q, J = 271.7 Hz), 121.25, 114.75, 110.57 (qd, J = 31.8 Hz, J = 11.6 Hz), 106.65 (d, J = 26.1 Hz) (Figure S17); HR-MS: C16H10ONF4 [M − H] calculated 308.0704 m/z, found 308.0695 m/z (Figure S18).
(2E)-N-(4-Bromo-3-chlorophenyl)-3-phenylprop-2-enamide (11), Yield: 61%; Mp 170–172 °C; IR (cm−1): 3282, 3097, 2980, 2888, 1663, 1627, 1579, 1521, 1470, 1449, 1376, 1338, 1288, 1253, 1229, 1180, 1113, 1071, 968, 882, 861, 808, 761, 711, 679, 676, 577, 561, 496, 482; 1H-NMR (DMSO-d6), δ: 10.51 (s, 1H), 8.11 (d, J = 2.1 Hz, 1H), 7.72 (d, J = 8.2 Hz, 1H), 7.65–7.61 (m, 3H), 7.50 (dd, J = 8.6 Hz, J = 2.4 Hz, 1H), 7.47–7.41 (m, 3H), 6.78 (d, J = 15.8 Hz, 1H); 13C-NMR (DMSO-d6), δ: 163.94, 141.13, 139.92, 134.47, 133.95, 133.09, 130.07, 129.08, 127.88, 121.53, 120.31, 119.45, 114.48 (Figure S19); HR-MS: C15H10ONBrCl [M − H] calculated 333.9640 m/z, found 333.9635 m/z (Figure S20).
(2E)-N-(2-Bromo-4-chlorophenyl)-3-phenylprop-2-enamide (12), Yield: 68%; Mp 173–175 °C; IR (cm−1): 3258, 2980, 2888, 1653, 1621, 1572, 1524, 1465, 1447, 1380, 1336, 1279, 1263, 1238, 1201, 1180, 1093, 1039, 1006, 999, 969, 858, 824, 775, 757, 714, 700, 653, 632, 568, 551, 512; 1H-NMR (DMSO-d6), δ: 9.69 (s, 1H), 7.84–7.82 (m, 2H), 7.65–7.64 (m, 2H), 7.62 (d, J = 15.8 Hz, 1H), 7.49 (dd, J = 8.6 Hz, J = 2.4 Hz, 1H), 7.47–7.41 (m, 3H), 7.07 (d, J = 15.8 Hz, 1H); 13C-NMR (DMSO-d6), δ: 163.94, 141.08, 135.50, 134.60, 131.87, 129.96, 129.72, 129.02, 128.05, 127.85, 127.38, 121.49, 117.69 (Figure S21); HR-MS: C15H10ONBrCl [M − H] calculated 333.9640 m/z, found 333.9635 m/z (Figure S22).
(2E)-N-[2-Bromo-5-(trifluoromethyl)phenyl]-3-phenylprop-2-enamide (13), Yield 59%; Mp 134–135 °C; IR (cm−1): 3270, 1658, 1631, 1606, 1529, 1467, 1423, 1329, 1262, 1170, 1112, 1078, 1035, 963, 928, 894, 856, 816, 759, 709, 685, 643, 615, 560, 491, 454; 1H-NMR (DMSO-d6), δ: 9.84 (s, 1H), 8.26 (d, J = 1.4 Hz, 1H), 7.94 (d, J = 8.2 Hz, 1H), 7.67–7.65 (m, 2H), 7.65 (d, J = 15.8 Hz, 1H), 7.49–7.42 (m, 4H), 7.14 (d, J = 15.8 Hz, 1H); 13C-NMR (DMSO-d6), δ: 164.25, 141.54, 137.26, 134.54, 134.06, 130.08, 129.06, 128.59 (q, J = 31.8 Hz), 127.94, 123.71 (q, J = 273.1 Hz), 122.77 (q, J = 4.3 Hz), 122.07 (q, J = 2.9 Hz), 121.35, 120.81 (Figure S23); HR-MS: C16H10ONBrF3 [M − H] calculated 367.9903 m/z, found 367.9893 m/z (Figure S24).
(2E)-N-[4-Fluoro-2-(trifluoromethyl)phenyl]-3-phenylprop-2-enamide (14), Yield 76%; Mp 145–147 °C; IR (cm−1): 3257, 3086, 1653, 1622, 1521, 1492, 1429, 1332, 1316, 1271, 146, 1174, 1127, 1119, 1049, 974, 914, 883, 865, 845, 823, 761, 745, 727, 709, 691, 664, 652, 569, 539, 499, 481; 1H-NMR (DMSO-d6), δ: 9.79 (s, 1H), 7.67 (dd, J = 8.9 Hz, J = 2.7 Hz, 1H), 7.65–7.63 (m, 2H), 7.61–7.58 (m, 2H), 7.59 (d, J = 15.8 Hz, 1H), 7.46–7.40 (m, 3 H), 6.97 (d, J = 15.8 Hz, 1H); 13C-NMR (DMSO-d6), δ: 164.79, 159.51 (d, J = 245.7 Hz), 140.86, 134.55, 132.54 (d, J = 8.7 Hz), 131.76 (d, J = 2.9 Hz), 129.92, 129.02, 127.81, 126.40 (qd, J = 31.8 Hz, J = 10.1 Hz), 122.67 (qd, J = 274.6 Hz, J = 2.9 Hz), 121.18, 120.00 (d, J = 21.7 Hz), 113.72 (dq, J = 26.0 Hz, J = 5.8 Hz) (Figure S25); HR-MS: C16H10ONF4 [M − H] calculated 308.0704 m/z, found 308.0696 m/z (Figure S26).
(2E)-N-[4-Chloro-2-(trifluoromethyl)phenyl]-3-phenylprop-2-enamide (15), Yield 71%; Mp 165–167 °C; IR (cm−1): 3268, 3083, 3030, 1655, 1624, 1584, 1522, 1483, 1449, 1410, 1337, 1306, 1277, 1268, 1243, 1171, 1122, 1109, 1052, 967, 890, 872, 857, 833, 810, 761, 711, 696, 684, 562, 539, 509; 1H-NMR (DMSO-d6), δ: 9.80 (s, 1H), 7.84 (d, J = 2.1 Hz, 1H), 7.79 (dd, J = 8.6 Hz, J = 2.4 Hz, 1H), 7.69 (d, J = 8.9 Hz, 1H), 7.65–7.64 (m, 2H), 7.60(d, J = 15.8 Hz, 1H), 7.47–7.41 (m, 3H), 7.00 (d, J = 15.8 Hz, 1H); 13C-NMR (DMSO-d6). δ: 164.65, 141.13, 134.52, 134.38, 132.96, 131.51, 130.67, 129.98, 129.03, 127.86, 126.26 (q, J = 5.8 Hz), 125.72 (q, J = 30.3 Hz), 122.7 (q, J = 273.1 Hz), 121.12 (Figure S27); HR-MS: C16H10ONClF3 [M − H] calculated 324.0409 m/z, found 324.0399 m/z (Figure S28).
(2E)-N-[4-Bromo-2-(trifluoromethyl)phenyl]-3-phenylprop-2-enamide (16), Yield 64%; Mp 176–178 °C; IR (cm−1): 3289, 3083, 3030, 1657, 1624, 1525, 1481, 1404, 1338, 1305, 1278, 1265, 1247, 1172, 1160, 1124, 1052, 967, 889, 866, 831, 760, 747, 710, 682, 631, 560, 529, 501, 463; 1H-NMR (DMSO-d6), δ: 9.78 (s, 1H), 7.94 (m, 1H), 7.92 (dd, J = 8.2 Hz, J = 2.1 Hz, 1H), 7.65–7.62 (m, 3H), 7.60 (d, J = 15.8 Hz, 1H), 7.46–7.41 (m, 3H), 7.00 (d, J = 15.8 Hz, 1H); 13C-NMR (DMSO-d6), δ: 164.59, 141.16, 135.94, 134.81 (q, J = 2.9 Hz), 134.52, 131.64, 129.99, 129.03, 129.02 (q, J = 5.8 Hz), 127.86, 125.87 (q, J = 30.3 Hz), 122.60 (q, J = 273.1 Hz), 121.12, 118.62 (Figure S29); HR-MS: C16H10ONBrF3 [M − H] calculated 367.9903 m/z, found 367.9894 m/z (Figure S30).
(2E)-N-[4-Nitro-2-(trifluoromethyl)phenyl]-3-phenylprop-2-enamide (17), Yield 61%; Mp 164–166 °C; IR (cm−1): 3314, 3086, 1662, 1620, 1594, 1544, 1505, 1449, 1424, 1338, 1319, 1277, 1172, 1112, 1052, 1000, 973, 921, 901, 854, 840, 790, 760, 744, 709, 686, 604, 592, 560; 1H-NMR (DMSO-d6), δ: 9.95 (s, 1H), 8.54 (dd, J = 8.9 Hz, J = 2.7 Hz, 1H), 8.47 (d, J = 2.7 Hz, 1H), 8.17 (d, J = 8.9 Hz, 1H), 7.68 (d, J = 15.8 Hz, 1H), 7.68–7.67 (m, 2H), 7.48–7.43 (m, 3H), 7.17 (d, J = 15.8 Hz, 1H); 13C-NMR (DMSO-d6), δ: 164.64, 143.84, 142.29, 141.30, 134.41, 130.25, 129.06, 128.84, 128.04, 127.96, 122.50 (q, J = 30.3 Hz), 122.48 (q, J = 273.10 Hz), 122.27 (q, J = 4.3 Hz), 120.91 (Figure S31); HR-MS: C16H10O3N2F3 [M − H] calculated 335.0649 m/z, found 335.0637 m/z (Figure S32).
(2E)-N-[4-Nitro-3-(trifluoromethyl)phenyl]-3-phenylprop-2-enamide (18), Yield 60%; Mp 181–183 °C; IR (cm−1): 3314, 3086, 1662, 1620, 1594, 1544, 1505, 1424, 1338, 1319, 1277, 1247, 1172, 1112, 1052, 983, 921, 901, 854, 840, 790, 760, 750, 709, 686, 645, 604, 593, 560, 505; 1H-NMR (DMSO-d6), δ: 11.03 (s, 1H), 8.38 (d, J = 2.1 Hz, 1H), 8.23 (d, J = 8.9 Hz, 1H), 8.13 (dd, J = 8.9 Hz, J = 2.1 Hz, 1H), 7.70 (d, J = 15.8 Hz, 1H),7.67–7.66 (m, 2H), 7.48–7.43 (m, 3H), 6.81 (d, J = 15.8 Hz, 1H); 13C-NMR (DMSO-d6), δ: 164.54, 143.95, 142.27, 141.30, 134.23, 130.35, 129.10, 128.04, 127.84, 123.02 (q, J = 33.2 Hz), 122.07 (q, J = 273.1 Hz), 120.94, 117.32 (q, J = 5.8 Hz) (Figure S33); HR-MS: C16H10O3N2F3 [M − H] calculated 335.0649 m/z, found 335.0635 m/z (Figure S34).
(2E)-N-[2,6-Dibromo-4-(trifluoromethyl)phenyl]-3-phenylprop-2-enamide (19), Yield 78%; Mp 227–229 °C; IR (cm−1): 3086, 2970, 2855, 1655, 1613, 1520, 1450, 1395, 1340, 1303, 1197, 1167, 1132, 1096, 1072, 1010, 984, 881, 862, 768, 743, 715, 692, 666, 566, 497; 1H-NMR (DMSO-d6), δ: 10.36 (s, 1H), 8.19 (s, 2H), 7.67–7.66 (m, 2H), 7.64 (d, J = 15.8 Hz, 1H), 7.47–7.42 (3H), 6.90(d, J = 15.8 Hz, 1H); 13C-NMR (DMSO-d6), δ: 163.42, 141.14, 140.13, 134.38, 130.08, 129.99 (q, J = 33.2 Hz), 129.16 (q, J = 4.3 Hz), 129.07, 127.88, 124.96, 122.29 (q, J = 273.1 Hz), 120.45 (Figure S35); HR-MS: C16H9ONBr2F3 [M − H] calculated 445.9008 m/z, found 445.9002 m/z (Figure S36).
(2E)-N-(2,6-Dibromo-3-chloro-4-fluorophenyl)-3-phenylprop-2-enamide (20), Yield: 74%; Mp 234–235 °C; IR (cm−1):3197, 3001, 1656, 1664, 1611, 1571, 1523, 1442, 1357, 1339, 1296, 1285, 1206, 1179, 1113, 988, 979, 854, 784, 763, 753, 723, 696, 684, 640, 581, 562, 530, 486, 442; 1H-NMR (DMSO-d6), δ: 10.26 (s, 1H), 8.07 (d, J = 8.9 Hz, 1H), 7.67–7.65 (m, 2H), 7.62 (d, J = 15.8 Hz, 1H), 7.47–7.42 (m, 3H), 6.87 (d, J = 15.8 Hz, 1H); 13C-NMR (DMSO-d6), δ: 163.64, 156.15 (d, J = 252.9 Hz), 141.25, 134.40, 134.28 (d, J = 2.9 Hz), 130.04, 129.07, 127.85, 126.30, 122.82 (d, J = 10.1 Hz), 121.30 (d, J = 20.2 Hz), 120.52, 119.79 (d, J = 24.6 Hz) (Figure S37); HR-MS: C15H8ONBr2FCl [M − H] calculated 429.8651 m/z, found 429.8648 m/z (Figure S38).

3.2. Biological Testing

3.2.1. In Vitro Antibacterial Evaluation

The synthesized compounds were evaluated for their in vitro antibacterial activity against representatives of multidrug-resistant bacteria, clinical isolates of methicillin-resistant Staphylococcus aureus (MRSA) 63718, and SA 630 that were obtained from the National Institute of Public Health (Prague, Czech Republic). S. aureus ATCC 29213 was used as the reference and quality control strain. Ampicillin (Sigma, St. Louis, MO, USA) was employed as the standard. All compounds and controls were prepared in triplicate. The screening was performed as described previously [26]. The results are summarized in Table 1. Antibacterial activity was assessed by determining MIC and MBC values. The broth microdilution method was applied. MIC values were determined in a microtiter plate. Aliquots from this plate were subcultivated on the Petri dish with Mueller-Hinton broth for the determination of MBC [43].

3.2.2. In Vitro Antimycobacterial Evaluation

The assessment of the in vitro antimycobacterial activity of the compounds was performed against Mycobacterium tuberculosis H37Ra/ATCC 25177 by means of the methodology described recently (e.g., [26]). Isoniazid (Sigma) was used as the standard. All compounds and controls were prepared in triplicate. The results are summarized in Table 1.

3.2.3. MTT Assay

A compound was diluted in Mueller-Hinton broth to achieve the desired final concentrations of 0.5 and 1 µg/mL, respectively. S. aureus ATCC 29213 bacterial suspension in sterile distilled water at 0.5 McFarland was diluted 1:3. Inocula were added to each well by a multi-inoculator. Diluted bacteria in broth free from inhibiting compounds were used as the growth control. The procedure was performed three times. Plates were incubated at 37 °C for 24 h. After the incubation period, 10% well volume of MTT (3-(4,5-dimethylthiazol-2-yl)-2,5-diphenyltetrazolium bromide) reagent (Sigma) was mixed into each well and incubated at 37 °C for 1 h. Then 100 µL of 17% sodium dodecyl sulphate in 40% dimethylformamide was added to each well. The plates were read at 570 nm. The absorbance readings from the cells grown in the presence of the tested compounds were compared with uninhibited cell growth to determine relative percent inhibition. The percent inhibition was determined through the MTT assay. The percent viability is calculated through the comparison of a measured value and that of the uninhibited control: % viability = OD570E/OD570P × 100, where OD570E is the reading from the compound-exposed cells, while OD570P is the reading from the uninhibited cells (positive control). Cytotoxic potential is determined by a percent viability of <70% [43,59].

3.2.4. In Vitro Cell Viability Assay

The cytotoxic effect of the tested compounds was specified on THP1-Blue™ NF-κB cell line (Invivogen; San Diego, CA, USA), as described previously [28]. Briefly, cells resuspended in serum-free RPMI 1640 medium (Merck, Darmstadt, Germany) supplemented with antibiotics (100 U/mL penicillin and 100 mg/mL streptomycin (Merck)) and 10% FBS (Merck) were seeded into 96-well plates (100 µL/well, i.e., 50,000 cells per each well). After 2 h, tested compounds dissolved in DMSO (1.25–20 µM) were added to the cells. The final concentration of DMSO was 0.1% (v/v) in each well. The viability analysis was performed after 24 h incubation with the tested substances using the WST-1 Cell Proliferation Reagent kit (Roche Diagnostics, Basel, Switzerland) according to the manufacturer’s manual. The amount of formazan formed, which corresponded to the number of metabolically active cells in the culture, was calculated as a percentage of the control cells, which were treated only with serum-free RPMI 1640 medium and were assigned as 100%. The IC50 values were calculated by four-parameter logistic (4PL) analysis from obtained viability curves by GraphPad Prism 8.0.1 (San Diego, CA, USA) software. The results are summarized in Table 1 as mean ± SEM (n = 6).

3.2.5. Determination of NF-κB Activity

To evaluate the anti-inflammatory potential of novel compounds, their ability to attenuate the lipopolysaccharide (LPS)-activated pro-inflammatory transcription nuclear factor (NF)-κB was measured as was described previously [28]. Briefly, THP1-Blue™ NF-κB cells were pretreated by tested compounds dissolved in DMSO in the non-toxic concentration 1 µM for 1 h. After LPS (1 µg/mL) stimulation, the NF-κB activity was evaluated by Quanti-Blue medium (Invivogen) according to the manufacturer’s instructions. The results from 3 independent experiments performed in triplicate (n = 9) were analyzed by GraphPad Prism 8.0.1 software. The outlaying values were excluded by ROUT algorithms (Q = 5%).

3.3. Lipophilicity Determination by RP-HPLC (Capacity Factor k/Calculated log k)

The HPLC separation system Merck Hitachi LaChrom Elite® equipped with a Merck Hitachi LaChrom Elite® L-2455 Diode-Array Detector (Hitachi High Technologies America, San Jose, CA, USA) was used. A chromatographic column Symmetry® C18 5 μm, 4.6 × 250 mm, Part No. W21751W016 (Waters Corp., Milford, MA, USA) was used. The HPLC separation process was monitored by the EZ CHROM Elite® software (Hitachi High Technologies America). The total flow of the column was 1.0 mL/min, injection 10 μL, column temperature 40 °C, and sample temperature 10 °C. The detection wavelength 214 nm was chosen. A KI methanolic solution was used for the dead time (td) determination. Retention times (tr) were measured in minutes. Isocratic elution by a mixture of Metanol ChromasolvTM (Honeywell, St. Louis, MO, USA) (72%) and H2O-HPLC Mili-Q grade (Labconco, Kansas City, MO, USA) (28%) as a mobile phase was used for the determination of capacity factor k, while isocratic elution by a mixture of Metanol ChromasolvTM (Honeywell) (72%) and NaOAc buffer, pH 6.5 and 7.4 (28%) as a mobile phase were used for the determination of distribution coefficients D6.5 and D7.4. The capacity factors and distribution coefficients were calculated according to the formula k(D) = (trtd)/td, where tR is the retention time of the solute and td is the dead time obtained using an unretained analyte. Each experiment was repeated three times. The calculated log k, log D6.5, and log D7.4 values of individual compounds are shown in Table 1.

3.4. Lipophilicity Determination by RP-TLC

Rm values were determined from the RP-18 TLC measurements. The solutions of compounds in Metanol ChromasolvTM (Honeywell) were spotted on a RP-TLC plate (Silica gel Nano-SIL C18-100 UV 254, 10 × 10 cm, Macherey-Nagel, Duren, Germany), 1.5 cm from the edge. The volatiles were carefully evaporated, and the plate was developed by MeOH (100%) or MeOH: H2O-HPLC (72:28 v/v) or MeOH: NaOAc buffer, pH 7.4 (72:28 v/v). After drying, the spots were visualized under UV (λ = 365 nm). Rm data were obtained from equation: Rm = log(1/Rf-1). Each experiment was repeated three times. The Rm values of individual compounds are shown in Table 1.

3.5. Model Building and Experimental vs. Theoretical Lipophilicity Prediction

CACTVS/csed and CORINA editors were engaged to produce each structural model and its initial spatial geometry. OpenBabel (inter)change file format converter was employed for data conversion. Sybyl-X 2.0/Certara software package running on a HP Z200 workstation with a Debian 10.0 operating system was used to conduct the molecular modeling simulations. The initial compound geometry optimization with MAXMIN2 module was performed using the standard Tripos force field (POWELL conjugate gradient algorithm) with a 0.01 kcal/mol energy gradient convergence criterion. The specification of the electrostatic potential values based on the partial atomic charges was carried out with the Gasteiger–Hückel method implemented in Sybyl-X.
An ensemble of freely/commercially available in silico predictors can be engaged to specify theoretically the numerical value of partition coefficients (clogP) as follows:
AlogPS—algorithm implemented by Tetko et al. [37] based on atom-type electrotopological-state (E-state) indices and neural networks (NN);
milogP—procedure proposed by Molinspiration for practical logP calculations of almost all organic molecules as a sum of fragment-based contributions and correction factors;
ClogP—fragment-based approach for estimation of lipophilicity based on structure-dependent correction values retrieved from Hansch and Leo’s database that is implemented in Sybyl/Centara software;
HyperChem logP—an atom-additive method that estimates lipophilicity using the individual atomic contribution based on procedure proposed by Ghose, Prichett and Crippen;
MarvinSketch logP—the overall lipophilicity of a molecule is composed of the contributing values of its atom types that were redefined to accommodate electron delocalization and contributions of ionic forms;
ChemSketch logP—a comprehensive fragment-based algorithm with high quality models built using empirical data. Well-characterized logP contributions have been compiled for atoms; structural fragments and intramolecular interactions provided for more than 12 × 103 experimental logP values;
Dragon AlogP—statistical estimators of the Ghose-Crippen-Viswanadhan model were specified on the basis of known experimental logP for the training set of 8364 compounds. The overall approach of the lipophilic atomic-based constant is estimated with the contribution of 115 atom types;
Dragon MlogP—the calculated partition coefficient includes VdW volume and Moriguchi polar parameters as correction factors. A regression MlogP model is based on 13 structural parameters that were rated on the training group of 1,230 organic molecules;
Kowwin—estimates the log octanol-water partition coefficient of chemicals using the atom/fragment contribution protocol;
XlogP3—an atom-additive procedure with well-defined correction factors that engages an optimized atom typing approach calibrated on a big training set;
OSIRIS clogP—in house approach based on the cumulative sum of atom contributions calculated for more than 5000 compounds with experimentally measured logP values as a training set. Predicting engine distinguishes 369 atom types;
ChemDraw clogP—the combination of Classic and GALAS algorithms for the prediction of partition coefficient based on a training set of >11 × 103 compounds provides coverage for a broad chemical space;
Percepta clogP—based on >12 × 103 of empirical logP values with the algorithm that uses the principal of isolating carbons.
In order to detect the redundant descriptors in QSAR/QSPR studies, several methods of variable selection/elimination have been proposed, including the uninformative variable elimination (UVE–PLS), as well as its modifications, namely iterative variable elimination (IVE–PLS) [60]. Overall, the entire algorithm comprises of the following stages:
Stage 1. Standard PLS analysis with LOO–CV to evaluate the performance of the PLS model
Stage 2. Elimination of the matrix column with the lowest abs(mean(b)/std(b)) value
Stage 3. Standard PLS analysis of the new matrix without the column eliminated in Stage 2.
Stage 4. Iterative repetition of the Stages 1–3 to maximize the LOO q c v 2 .

3.6. Similarity Assessment Using PCA and Tanimoto Coefficient

The proper mapping of the molecular diversity in the theoretically infinite chemical space (CS ≈ 1060–10200) into the corresponding property space basically requires the multi-dimensional description of a molecule by a set of structural (S) and physicochemical (P) properties organized in a vector [61]. The molecular distribution of the experimental-based (FCS) and virtual-derived (VCS) compounds/models might be graphically displayed using the human friendly 2D/3D plots, e.g., in the procedure called Principal Component Analysis (PCA) [62]. PCA is a linear projection method designed to model multivariate data with a relatively small number of so-called principal components (scores and loadings) constructed in order to maximize the variance description of input data [63]. The PCA model with f principal components for a data matrix X can be presented as follows:
X = TPT + E
where X is a data matrix with m objects and n variables, T is the score matrix with dimensions (m × f), PT is a transposed matrix of loadings with dimensions (f × n) and E is a matrix of the residual variance (m × n) that is not explained by the first f principal components. Basically, the first few principal components often capture interesting information about the data structure and uncover groups of objects.
The structural relatedness between molecule library is usually estimated using a function mapping (dis)similarities between the pairs of bit-string descriptors given by the Tanimoto equation as follows:
T ( x , y ) = n x y ( n x + n y n x y )
where n x y   is the number of bits set into 1 shared in the fingerprint of molecules x and y, n x is the number of bits set into 1 in molecule x, n y is the number of bits set into 1 in molecule y. Top-ranked objects are supposed to have similar properties, although the validity of this assumption is fairly questionable, because 70% of compounds with T ( x , y ) > 0.85 to an active analog have comparatively low probability of being active in the same way [64].

4. Conclusions

A set of 20 cinnamic acid anilides (1 published recently and 19 newly synthesized) was investigated in relation to their biological activities and characterized by a series of experimental lipophilicity values generated using RP-HPLC and RP-TLC methods. All compounds were tested against the reference strain Staphylococcus aureus, two MRSA clinical isolates, and Mycobacterium tuberculosis. (2E)-N-[3-Fluoro-4-(trifluoromethyl)phenyl]-3-phenylprop-2-enamide (10) showed comparable or even better activity than the ampicillin. It was found that the activity of compound 10 is bactericidal. The screening of the cell viability performed using THP1-Blue™ NF-κB cells demonstrated that only (2E)-N-(4-bromo-3-chlorophenyl)-3-phenylprop-2-enamide (11) showed significant cytotoxic effect. Moreover, all compounds were tested for their anti-inflammatory potential; (2E)-N-(2,6-dibromo-3-chloro-4-fluorophenyl)-3-phenylprop-2-enamide (20) attenuated the lipopolysaccharide-induced NF-κB activation and was more potent than the parental cinnamic acid. Unfortunately, the design of compound that combines both high antimicrobial activity and anti-inflammatory effect is a great challenge; compounds with preferential anilide ring substitution at the meta positions and optionally in combination with para show the highest antimicrobial activity, while the ortho position optionally in combination with meta are anti-inflammatory preferential. The similarity-related property space evaluation for the congeneric series of structural analogues was carried out using the principal component analysis (PCA). Moreover, the in silico approximation of the lipophilic values for the ensemble of anilides 120 was performed employing a set of free/commercial clogP estimators, subsequently corrected using the corresponding pKa calculated at physiological pH and subsequently cross-compared with the experimental parameter. The mean and median value of the selected estimators that averaged over the chosen logD7.4 values were subsequently correlated with the experimental parameter with correlation coefficient of 0.65, because not only the best inter-correlated clogD7.4 values were specified in the consensus clogP approach. Finally, the similarity-driven investigation using Tanimoto metrics was conducted revealing the structural dissimilarities of nitro-substituted isomers (compounds 17 (R = 2-CF3-4-NO2) and 18 (R = 3-CF3-4-NO2)) as compared with the remaining ones, which confirms our previous PCA findings. Interestingly, mono-bromo/chloro-substituted isomers (compounds 11 (R = 3-Cl-4-Br) and 12 (R = 2-Br-4-Cl)) indicate the structural similarity to di-/tri-bromo/chloro-substituted positional isomers (molecules 49). Unfortunately, the similarity investigation did not provide valuable hints that could explain the noticeable variations in the toxic effect exerted by molecule 11 (IC50 = 6.5 µM on THP1-Blue™ NF-κB cells) and the remaining ones. In general, the distribution coefficient provides a more realistic estimation of lipophilicity in the relevant pH environments; therefore, logDpH ought to be preferentially engaged in the QSPR study, especially for compounds that are likely to ionize in physiological media. Based on this study, the antiproliferative/antineoplastic activity of compound 11 will be investigated, while the rest of the tested compounds will be studied in relation to their antimicrobial and anti-inflammatory activities.

Supplementary Materials

The following are available online, Table S1: Theoretically estimated partition coefficient calculated by set of alternative methods for anilides 120. Table S2: Theoretically estimated pKa calculated by ACD/Percepta/pKa for anilides 120. Figure S1: 13C-NMR (DMSO-d6) spectrum of (2E)-3-phenyl-N-(2,4,6-trifluorophenyl)prop-2-enamide (2). Figure S2: HR-MS record of (2E)-3-phenyl- N-(2,4,6-trifluorophenyl)prop-2-enamide (2). Figure S3: 13C-NMR (DMSO-d6) spectrum of (2E)-3-phenyl- N-(3,4,5-trifluorophenyl)prop-2-enamide (3). Figure S4: HR-MS record of (2E)-3-phenyl-N-(3,4,5-trifluorophenyl)- prop-2-enamide (3). Figure S5: 13C-NMR (DMSO-d6) spectrum of (2E)-N-(2,4-dichlorophenyl)-3-phenylprop- 2-enamide (4). Figure S6: HR-MS record of (2E)-N-(2,4-dichlorophenyl)-3-phenylprop-2-enamide (4). Figure S7: 13C-NMR (DMSO-d6) spectrum of (2E)-3-phenyl-N-(2,4,5-trichlorophenyl)prop-2-enamide (5). Figure S8: HR-MS record of (2E)-3-phenyl-N-(2,4,5-trichlorophenyl)prop-2-enamide (5). Figure S9: 13C-NMR (DMSO-d6) spectrum of (2E)-3-phenyl-N-(3,4,5-trichlorophenyl)prop-2-enamide (6). Figure S10: HR-MS record of (2E)-3-phenyl- N-(3,4,5-trichlorophenyl)prop-2-enamide (6). Figure S11: 13C-NMR (DMSO-d6) spectrum of (2E)-N-(2,4-dibromo- phenyl)-3-phenylprop-2-enamide (7). Figure S12: HR-MS record of (2E)-N-(2,4-dibromophenyl)-3-phenylprop- 2-enamide (7). Figure S13: 13C-NMR (DMSO-d6) spectrum of (2E)-N-(5-chloro-2-fluorophenyl)-3-phenylprop- 2-enamide (8). Figure S14: HR-MS record of (2E)-N-(5-chloro-2-fluorophenyl)-3-phenylprop-2-enamide (8). Figure S15: 13C-NMR (DMSO-d6) spectrum of (2E)-N-(4-bromo-3-fluorophenyl)-3-phenylprop-2-enamide (9). Figure S16: HR-MS record of (2E)-N-(4-bromo-3-fluorophenyl)-3-phenylprop-2-enamide (9). Figure S17: 13C-NMR (DMSO-d6) spectrum of (2E)-N-[3-fluoro-4-(trifluoromethyl)phenyl]-3-phenylprop-2-enamide (10). Figure S18: HR-MS record of (2E)-N-[3-fluoro-4-(trifluoromethyl)phenyl]-3-phenylprop-2-enamide (10). Figure S19: 13C-NMR (DMSO-d6) spectrum of (2E)-N-(4-bromo-3-chlorophenyl)-3-phenylprop-2-enamide (11). Figure S20: HR-MS record of (2E)-N-(4-bromo-3-chlorophenyl)-3-phenylprop-2-enamide (11). Figure S21: 13C-NMR (DMSO-d6) spectrum of (2E)-N-(2-bromo-4-chlorophenyl)-3-phenylprop-2-enamide (12). Figure S22: HR-MS record of (2E)-N-(2-bromo-4-chlorophenyl)-3-phenylprop-2-enamide (12). Figure S23: 13C-NMR (DMSO-d6) spectrum of (2E)-N-[2-bromo-5-(trifluoromethyl)phenyl]-3-phenylprop-2-enamide (13). Figure S24: HR-MS record of (2E)-N-[2-bromo-5-(trifluoromethyl)phenyl]-3-phenylprop-2-enamide (13). Figure S25: 13C-NMR (DMSO-d6) spectrum of (2E)-N-[4-fluoro-2-(trifluoromethyl)phenyl]-3-phenylprop-2-enamide (14). Figure S26: HR-MS record of (2E)-N-[4-fluoro-2-(trifluoromethyl)phenyl]-3-phenylprop-2-enamide (14). Figure S27: 13C-NMR (DMSO-d6) spectrum of (2E)-N-[4-chloro-2-(trifluoromethyl)phenyl]-3-phenylprop-2-enamide (15). Figure S28: HR-MS record of (2E)-N-[4-chloro-2-(trifluoromethyl)phenyl]-3-phenylprop-2-enamide (15). Figure S29: 13C-NMR (DMSO-d6) spectrum of (2E)-N-[4-bromo-2-(trifluoromethyl)phenyl]-3-phenylprop-2-enamide (16). Figure S30: HR-MS record of (2E)-N-[4-bromo-2-(trifluoromethyl)phenyl]-3-phenylprop-2-enamide (16). Figure S31: 13C-NMR (DMSO-d6) spectrum of (2E)-N-[4-nitro-2-(trifluoromethyl)phenyl]-3-phenylprop-2-enamide (17). Figure S32: HR-MS record of (2E)-N-[4-nitro-2-(trifluoromethyl)phenyl]-3-phenylprop-2-enamide (17). Figure S33: 13C-NMR (DMSO-d6) spectrum of (2E)-N-[4-nitro-3-(trifluoromethyl)phenyl]-3-phenylprop-2-enamide (18). Figure S34: HR-MS record of (2E)-N-[4-nitro-3-(trifluoromethyl)phenyl]-3-phenylprop-2-enamide (18). Figure S35: 13C-NMR (DMSO-d6) spectrum of (2E)-N-[2,6-dibromo-4-(trifluoromethyl)phenyl]-3-phenylprop-2-enamide (19). Figure S36: HR-MS record of (2E)-N-[2,6-dibromo-4-(trifluoromethyl)phenyl]-3-phenylprop-2-enamide (19). Figure S37: 13C-NMR (DMSO-d6) spectrum of (2E)-N-(2,6-dibromo-3-chloro-4-fluorophenyl)-3-phenylprop-2-enamide (20). Figure S38: HR-MS record of (2E)-N-(2,6-dibromo-3-chloro-4-fluorophenyl)-3-phenylprop-2-enamide (20).

Author Contributions

J.K., T.S. and F.D. synthesized the compounds. M.O., T.J., M.H. analyzed the compounds. H.M. and J.H. performed biological screening. J.J. designed the compounds. A.B., V.K., A.S. (Adam Smolinski) and A.S. (Aleksandra Swietlicka) performed theoretical lipophilicity calculations, PCA, IVE-PLS. A.B. and J.J. wrote the paper. All authors have read and agreed to the published version of the manuscript.

Funding

This study was supported by the Slovak Research and Development Agency (APVV-17-0373) and by Palacky University Olomouc (IGA_PrF_2020_023). Knowledge gained within project APVV-0516-12 has been used in the results. M.O. was supported by SustES (CZ.02.1.01/0.0/0.0/16_019/0000797).

Acknowledgments

We would like to acknowledge the OpenEye and OpenBabel Scientific Software for providing free academic licenses.

Conflicts of Interest

The authors declare no conflict of interest.

References

  1. Medzhitov, R. Origin and physiological roles of inflammation. Nature 2008, 454, 428–435. [Google Scholar] [CrossRef]
  2. Oehling, A.K. Bacterial infection as an important triggering factor in bronchial asthma. J. Investig. Allergol. Clin. Immunol. 1999, 9, 6–13. [Google Scholar]
  3. Sreenivasan, P.K.; Gaffar, A. Antibacterials as anti-inflammatory agents: Dual action agents for oral health. Antonie Van Leeuwenhoek 2008, 93, 227–239. [Google Scholar] [CrossRef] [PubMed]
  4. Qiu, C.C.; Caricchio, R.; Gallucci, S. Triggers of autoimmunity: The role of bacterial infections in the extracellular exposure of lupus nuclear autoantigens. Front. Immunol. 2019, 10, 2608. [Google Scholar] [CrossRef] [PubMed] [Green Version]
  5. Van Elsland, D.; Neefjes, J. Bacterial infections and cancer. EMBO Rep. 2018, 19, e46632. [Google Scholar] [CrossRef]
  6. Chen, L.; Deng, H.; Cui, H.; Fang, J.; Zuo, Z.; Deng, J.; Li, Y.; Wang, X.; Zhao, L. Inflammatory responses and inflammation-associated diseases in organs. Oncotarget 2017, 9, 7204–7218. [Google Scholar] [CrossRef] [PubMed] [Green Version]
  7. Vasaikar, S.; Bhatia, P.; Bhatia, P.G.; Yaiw, K.C. Complementary approaches to existing target based drug discovery for identifying novel drug targets. Biomedicines 2016, 4, 27. [Google Scholar] [CrossRef] [PubMed]
  8. Ul Islam, N.; Amin, R.; Shahid, M.; Amin, M.; Zaib, S.; Iqbal, J. A multi-target therapeutic potential of Prunus domestica gum stabilized nanoparticles exhibited prospective anticancer, antibacterial, urease-inhibition, anti-inflammatory and analgesic properties. BMC Complement. Altern. Med. 2017, 17, 276. [Google Scholar] [CrossRef]
  9. Brullo, C.; Massa, M.; Rapetti, F.; Alfei, S.; Bertolotto, M.B.; Montecucco, F.; Signorello, M.G.; Bruno, O. New hybrid pyrazole and imidazopyrazole antinflammatory agents able to reduce ROS production in different biological targets. Molecules 2020, 25, 899. [Google Scholar] [CrossRef] [Green Version]
  10. Ramsay, R.R.; Popovic-Nikolic, M.R.; Nikolic, K.; Uliassi, E.; Bolognesi, M.L. A perspective on multi-target drug discovery and design for complex diseases. Clin. Transl. Med. 2018, 7, 3. [Google Scholar] [CrossRef] [Green Version]
  11. Bolognesi, M.L. Polypharmacology in a single drug: Multitarget drugs. Curr. Med. Chem. 2013, 20, 1639–1645. [Google Scholar] [CrossRef] [PubMed]
  12. Talevi, A. Multi-target pharmacology: Possibilities and limitations of the “skeleton key approach” from a medicinal chemist perspective. Front. Pharmacol. 2015, 6, 205. [Google Scholar] [CrossRef] [PubMed] [Green Version]
  13. Bräse, S. Privileged Scaffolds in Medicinal Chemistry: Design, Synthesis, Evaluation; Royal Society of Chemistry: Cambridge, UK, 2016. [Google Scholar]
  14. Gaikwad, N.; Nanduri, S.; Madhavi, Y.V. Cinnamamide: An insight into the pharmacological advances and structure-activity relationships. Eur. J. Med. Chem. 2019, 181, 111561. [Google Scholar] [CrossRef] [PubMed]
  15. Das, A.B.; Goud, V.V.; Das, C. Phenolic compounds as functional ingredients in beverages. In Value-Added Ingredients and Enrichments of Beverages; Grumezescu, A.M., Holban, A.M., Eds.; Woodhead Publishing: Duxford, UK; Elsevier: Duxford, UK, 2019; pp. 285–323. [Google Scholar]
  16. Sharma, P. Cinnamic acid derivatives: A new chapter of various pharmacological activities. J. Chem. Pharm. Res. 2011, 3, 403–423. [Google Scholar]
  17. Peperidou, A.; Kapoukranidou, D.; Kontogiorgis, C.; Hadjipavlou-Litina, D. Multitarget molecular hybrids of cinnamic acids. Molecules 2014, 19, 20197–20226. [Google Scholar] [CrossRef]
  18. Peperidou, A.; Pontiki, E.; Hadjipavlou-Litina, D.; Voulgari, E.; Avgoustakis, K. Multifunctional cinnamic acid derivatives. Molecules 2017, 22, 1247. [Google Scholar] [CrossRef]
  19. Guzman, J.D. Natural cinnamic acids, synthetic derivatives and hybrids with antimicrobial activity. Molecules 2014, 19, 19292–19349. [Google Scholar] [CrossRef]
  20. Lima, T.C.; Ferreira, A.R.; Silva, D.F.; Lima, E.O.; de Sousa, D.P. Antifungal activity of cinnamic acid and benzoic acid esters against Candida albicans strains. Nat. Prod. Res. 2018, 32, 572–575. [Google Scholar] [CrossRef]
  21. Dolab, J.G.; Lima, B.; Spaczynska, E.; Kos, J.; Cano, N.H.; Feresin, G.; Tapia, A.; Garibotto, F.; Petenatti, E.; Olivella, M.; et al. Antimicrobial activity of Annona emarginata (Schltdl.) H. Rainer and most active isolated compound against clinically important bacteria. Molecules 2018, 23, 1187. [Google Scholar] [CrossRef] [Green Version]
  22. Pontiki, E.; Peperidou, A.; Fotopoulos, I.; Hadjipavlou-Litina, D. Cinnamate hybrids: A unique family of compounds with multiple biological activities. Curr. Pharm. Biotechnol. 2018, 19, 1019–1048. [Google Scholar] [CrossRef]
  23. Silva, A.T.; Bento, C.M.; Pena, A.C.; Figueiredo, L.M.; Prudencio, C.; Aguiar, L.; Silva, T.; Ferraz, R.; Gomes, M.S.; Teixeira, C.; et al. Cinnamic acid conjugates in the rescuing and repurposing of classical antimalarial drugs. Molecules 2019, 25, 66. [Google Scholar] [CrossRef] [Green Version]
  24. Martinez, M.D.; Riva, D.A.; Garcia, C.; Duran, F.J.; Burton, G. Synthesis and antibacterial activity of difluoromethyl cinnamoyl amides. Molecules 2020, 25, 789. [Google Scholar] [CrossRef] [PubMed] [Green Version]
  25. Fungicide Resistance Action Committee. FRAC Code List© 2020: Fungal Control Agents Sorted by Cross Resistance Pattern and Mode of Action; Fungicide Resistance Action Committee, Croplife International: Brussels, Belgium, 2020. [Google Scholar]
  26. Pospisilova, S.; Kos, J.; Michnova, H.; Kapustikova, I.; Strharsky, T.; Oravec, M.; Moricz, A.M.; Bakonyi, J.; Kauerova, T.; Kollar, P.; et al. Synthesis and spectrum of biological activities of novel N-arylcinnamamides. Int. J. Mol. Sci. 2018, 19, 2318. [Google Scholar] [CrossRef] [PubMed] [Green Version]
  27. Pospisilova, S.; Kos, J.; Michnova, H.; Strharsky, T.; Cizek, A.; Jampilek, J. N-Arylcinnamamides as Antistaphylococcal Agents. In Proceedings of the 4th International Electronic Conference on Medicinal Chemistry, ECMC-4, 1–30 November 2018; p. 5576. Available online: https://sciforum.net/manuscripts/5576/slides.pdf (accessed on 4 August 2020).
  28. Hosek, J.; Kos, J.; Strharsky, T.; Cerna, L.; Starha, P.; Vanco, J.; Travnicek, Z.; Devinsky, F.; Jampilek, J. Investigation of anti-inflammatory potential of n-arylcinnamamide derivatives. Molecules 2019, 24, 4531. [Google Scholar] [CrossRef] [PubMed] [Green Version]
  29. Veber, D.F.; Johnson, S.R.; Cheng, H.Y.; Smith, B.R.; Ward, K.W.; Kopple, K.D. Molecular properties that influence the oral bioavailability of drug candidates. J. Med. Chem. 2002, 45, 2615–2623. [Google Scholar] [CrossRef] [PubMed]
  30. Van de Waterbeemd, H.; Gifford, E. ADMET in silico modeling: Towads prediction paradise? Nat. Rev. Drug Discov. 2003, 2, 192–204. [Google Scholar] [CrossRef] [PubMed]
  31. Fukunishi, Y.; Nakamura, H. Definition of drug-likeness for compound affinity. J. Chem. Inf. Model. 2011, 51, 1012–1016. [Google Scholar] [CrossRef]
  32. Lipinski, C.A.; Lombardo, F.; Dominy, B.W.; Feeney, P.J. Experimental and computational approaches to estimate solubility and permeability in drug discovery and development settings. Adv. Drug Deliv. Rev. 2001, 46, 3–26. [Google Scholar] [CrossRef]
  33. Bak, A.; Kozik, V.; Smolinski, A.; Jampilek, J. In silico estimation of basic activity-relevant parameters for a set of drug absorption promoters. SAR QSAR Environ. Res. 2017, 28, 427–449. [Google Scholar] [CrossRef]
  34. Arnott, J.A.; Planey, S.L. The influence of lipophilicity in drug discovery and design. Expert Opin. Drug Discov. 2012, 7, 863–875. [Google Scholar] [CrossRef]
  35. Efremov, R.G.; Chugunov, A.O.; Pyrkov, T.V.; Priestle, J.P.; Arseniev, A.S.; Jacoby, E. Molecular lipophilicity in protein modeling and drug design. Curr. Med. Chem. 2007, 14, 393–415. [Google Scholar] [CrossRef] [PubMed]
  36. Mannhold, R.; Poda, G.I.; Ostermann, C.; Tetko, I.V. Calculation of molecular lipophilicity: State-of-the-art and comparison of logP methods on more than 96,000 compounds. J. Pharm. Sci. 2009, 3, 861–864. [Google Scholar] [CrossRef] [PubMed]
  37. Tetko, I.; Poda, G.I. Application of ALOGPS 2.1 to predict logD distribution coefficient for Pfizer proprietary compounds. J. Med. Chem. 2004, 47, 5601–5604. [Google Scholar] [PubMed]
  38. Lipinski, C.A. Lead- and drug-like compounds: The rule-of-five revolution. Drug Discov. Today Technol. 2004, 1, 337–341. [Google Scholar] [CrossRef] [PubMed]
  39. Kah, M.; Brown, C.D. LogD: Lipophilicity for ionisable compounds. Chemosphere 2008, 72, 1401–1408. [Google Scholar] [CrossRef] [PubMed]
  40. Bhal, S.K.; Kassam, K.; Peirson, I.G.; Pearl, G.M. The rule of five revisited: Applying logD in place of logP in drug-likeness filters. Mol. Pharm. 2007, 40, 556–560. [Google Scholar] [CrossRef]
  41. Xing, L.; Glen, C. Novel methods for the predicition of logP, pKa and logD. J. Chem. Inf. Comput. Sci. 2002, 42, 796–805. [Google Scholar] [CrossRef]
  42. Rupp, M.; Körner, R.; Tetko, I.V. Predicting the pKa of small molecules. Comb. Chem. High Throughput Screen. 2011, 14, 307–327. [Google Scholar] [CrossRef]
  43. Zadrazilova, I.; Pospisilova, S.; Masarikova, M.; Imramovsky, A.; Ferriz, J.M.; Vinsova, J.; Cizek, A.; Jampilek, J. Salicylanilide carbamates: Promising antibacterial agents with high in vitro activity against methicillin-resistant Staphylococcus aureus (MRSA). Eur. J. Pharm. Sci. 2015, 77, 197–207. [Google Scholar] [CrossRef]
  44. International Organization for Standardization. ISO 10993-5:2009 Biological Evaluation of Medical Devices Part 5: Tests for In Vitro Cytotoxicity; International Organization for Standardization: Geneva, Switzerland, 2009; last revision 2017. [Google Scholar]
  45. Grela, E.; Kozłowska, J.; Grabowiecka, A. Current methodology of MTT assay in bacteria—A review. Acta Histochem. 2018, 120, 303–311. [Google Scholar] [CrossRef]
  46. Bender, A.; Scheiber, J.; Jenkins, J.L.; Sukuru, S.C. How similar are similarity searching methods? A principal component analysis of molecular descriptor space. J. Chem. Inf. Model. 2009, 49, 108–119. [Google Scholar] [CrossRef]
  47. Fialkowski, M.; Bishop, K.J.M.; Chubukov, V.A.; Campbell, C.J.; Grzybowski, B.A. Architecture and evolution of organic chemistry. Angew. Chem. Int. Ed. 2005, 44, 7263–7269. [Google Scholar] [CrossRef] [PubMed]
  48. Bak, A.; Pizova, H.; Kozik, V.; Vorcakova, K.; Kos, J.; Treml, J.; Odehnalova, K.; Oravec, M.; Imramovsky, A.; Bobal, P.; et al. SAR-mediated similarity assessment of the property profile for new, silicon-based AChE/BChE inhibitors. Int. J. Mol. Sci. 2019, 20, 5385. [Google Scholar] [CrossRef] [PubMed] [Green Version]
  49. Bak, A.; Kozik, V.; Malik, I.; Jampilek, J.; Smolinski, A. Probability-driven 3D pharmacophore mapping of antimycobacterial potential of hybrid molecules combining phenylcarbamoyloxy and N-arylpiperazine fragments. SAR QSAR Environ. Res. 2018, 29, 801–821. [Google Scholar] [CrossRef]
  50. Pizova, H.; Havelkova, M.; Stepankova, S.; Bak, A.; Kauerova, T.; Kozik, V.; Oravec, M.; Imramovsky, A.; Kollar, P.; Bobal, P.; et al. Proline-based carbamates as cholinesterase inhibitors. Molecules 2017, 22, 1969. [Google Scholar] [CrossRef] [Green Version]
  51. Martel, S.; Gillerat, F.; Carosati, E.; Maiarelli, D.; Tetko, I.V.; Mannhold, R.; Carrupt, P.A. Large, chemically diverse dataset of logP measurements for benchmarking studies. Eur. J. Pharm. Sci. 2013, 48, 21–29. [Google Scholar] [CrossRef] [PubMed]
  52. Tetko, I.V. Computing chemistry on the web. Drug Discov. Today 2005, 10, 1497–1500. [Google Scholar] [CrossRef]
  53. Peltason, L.; Bajorath, J. Systematic computational analysis of structure-activity relationships: Concepts, challenges and recent advances. Future Med. Chem. 2009, 1, 451–466. [Google Scholar] [CrossRef]
  54. Maggiora, G.M.; Shanmugasundaram, V. Molecular similarity measures. Methods Mol. Biol. 2011, 672, 39–100. [Google Scholar] [PubMed]
  55. Holliday, J.D.; Salim, N.; Whittle, M.; Willett, P. Analysis and display of the size dependence of chemical similarity coefficients. J. Chem. Inf. Comput. Sci. 2003, 43, 819–828. [Google Scholar] [CrossRef] [PubMed]
  56. Rozas, I.; Du, Q.; Arteca, G.A. Interrelation between electrostatic and lipophilicity potentials on molecular surfaces. J. Mol. Graph. 1995, 13, 98–108. [Google Scholar] [CrossRef]
  57. Zupan, J.; Gasteiger, J. Neural Networks and Drug Design for Chemists, 2nd ed.; Wiley-VCH: Weinheim, Germany, 1999. [Google Scholar]
  58. Bak, A.; Wyszomirski, M.; Magdziarz, T.; Smolinski, A.; Polanski, J. Structure-based modeling of dye-fiber affinity with SOM-4D-QSAR paradigm: Application to set of anthraquinone derivatives. Comb. Chem. High Throughput Screen. 2014, 17, 485–502. [Google Scholar] [CrossRef]
  59. Michnova, H.; Pospisilova, S.; Gonec, T.; Kapustikova, I.; Kollar, P.; Kozik, V.; Musiol, R.; Jendrzejewska, I.; Vanco, J.; Travnicek, Z.; et al. Bioactivity of methoxylated and methylated 1-hydroxynaphthalene-2-carboxanilides: Comparative molecular surface analysis. Molecules 2019, 24, 2991. [Google Scholar] [CrossRef] [PubMed] [Green Version]
  60. Bak, A.; Polanski, J. Modeling robust QSAR 3: SOM-4D-QSAR with iterative variable elimination IVE-PLS: Application to steroid, azo dye, and benzoic acid series. J. Chem. Inf. Model. 2007, 47, 1469–1480. [Google Scholar] [CrossRef] [PubMed]
  61. Polanski, J.; Bak, A.; Gieleciak, R.; Magdziarz, T. Modeling robust QSAR. J. Chem. Inf. Model. 2003, 46, 2310–2318. [Google Scholar] [CrossRef] [PubMed]
  62. Bak, A.; Kozik, V.; Smolinski, A.; Jampilek, J. Multidimensional (3D/4D-QSAR) probability-guided pharmacophore mapping: Investigation of activity profile for a series of drug absorption promoters. RSC Adv. 2016, 6, 76183–76205. [Google Scholar] [CrossRef]
  63. Bak, A.; Kozik, V.; Kozakiewicz, D.; Gajcy, K.; Strub, D.J.; Swietlicka, A.; Stepankova, S.; Imramovsky, A.; Polanski, J.; Smolinski, A.; et al. Novel benzene-based carbamates for AChE/BChE inhibition: Synthesis and ligand/structure-oriented SAR study. Int. J. Mol. Sci. 2019, 20, 1524. [Google Scholar] [CrossRef] [Green Version]
  64. Xie, X.Q.; Chen, J.Z. Data mining a small molecule drug screening representative subset from NIH PubChem. J. Chem. Inf. Model. 2008, 48, 465–475. [Google Scholar] [CrossRef]
Sample Availability: Samples of the compounds are available from the authors.
Scheme 1. Synthesis of ring-substituted (2E)-N-aryl-3-phenylprop-2-enamides 120. Reagents and conditions: (a) PCl3, chlorobenzene, MW (max. 500 W), 130 °C, 30 min [26,28].
Molecules 25 04121 sch001
Figure 1. Effect of tested compounds on activity of transcription factor NF-κB. THP1-Blue™ NF-κB cells were pretreated by compounds (1 µM) dissolved in dimethyl sulfoxide (DMSO) for 1 h. Then, lipopolysaccharide (LPS) 1 µg/mL was added to trigger the NF-κB activation. The activity of NF-κB was measured 24 h after LPS stimulation using QuantiBlue™ assay. The graph represents mean ± SEM (n = 9). The red dotted line shows the value of the DMSO-only treated group. Groups were compared with the help of the one-way ANOVA test followed by Fisher’s LSD multiple comparison test. * indicates statistical significance (p < 0.05) to DMSO group; ** indicates statistical significance (p < 0.01) to DMSO group; *** indicates statistical significance (p < 0.001) to DMSO group; **** indicates statistical significance (p < 0.0001) to DMSO group. CA—cinnamic acid.
Molecules 25 04121 g001
Figure 2. Projection of cinnamic acid anilides 120 on plane defined by first vs. second principal components for Dragon descriptors (a) with experimental logD7.4 (b). Colors code numerical values of logD at pH = 7.4.
Molecules 25 04121 g002
Figure 3. Projection of cinnamic acid anilides 120 on a plane defined by first vs. second principal components for Dragon descriptors with Ro5 rule violations (a) and cytotoxic effect IC50 (b). Colors code numerical values of Ro5 violations and IC50.
Molecules 25 04121 g003
Figure 4. Matrix of correlation coefficients of linear relationships between experimental and calculated logD7.4 lipophilicity specified using different programs.
Molecules 25 04121 g004
Figure 5. Distribution of Tanimoto coefficients (a) and triangular matrix of Tanimoto coefficients (b) for 120 anilides.
Molecules 25 04121 g005
Figure 6. Superimposition of 120 anilides according to AAA hypothesis.
Molecules 25 04121 g006
Figure 7. Molecular electrostatic potential topography of 120 anilides. Blue color codes negative values; red color codes positive MESP values.
Molecules 25 04121 g007
Figure 8. Comparative SOM 40 × 40 maps for 120 anilides. Colors code MESP values, white color indicates non-active neurons.
Molecules 25 04121 g008
Table 1. Structure of ring-substituted (2E)-N-aryl-3-phenylprop-2-enamides 120, in vitro anti-Staphylococcus activities’ minimum inhibitory concentration (MIC; μM) in comparison with standard ampicillin (AMP), in vitro antitubercular activity MIC (μM) in comparison with standard isoniazid (INH), and their influence on viability of THP1-Blue™ NF-κB cell line (IC50 (µM) ± SEM, n = 6).
Molecules 25 04121 i001
Comp.RMIC (μM)Tox IC50 (µM) ± SEM
SAMRSA 63718MRSA SA 630Mtb
1 *H>1146>1146>1146286>20
22,4,6-F>924>924>924>462>20
33,4,5-F462>924>924>462>20
42,4-Cl>880>880>880>440>20
52,4,5-Cl>790>790>790>395>20
63,4,5-Cl>790>790>790>395>20
72,4-Br>677>677>677>339>20
82-F-5-Cl931>931>931>465>20
93-F-4-Br>805>805805>403>20
103-F-4-CF325.925.912.9>414>20
113-Cl-4-Br>766192192>3836.5 ± 1.0
122-Br-4-Cl>766>766>766>383>20
132-Br-5-CF3>696>696>696>348>20
142-CF3-4-F>828>828>828>414>20
152-CF3-4-Cl>788>788>788>394>20
162-CF3-4-Br>696>696>696>348>20
172-CF3-4-NO2>762>762>762>381>20
183-CF3-4-NO2>762>762>762>381>20
192,6-Br-4-CF3>574>574>574>287>20
202,6-Br-3-Cl-4-F>595>595>595>298>20
AMP5.7245.845.8
INH36.6
* compound was described in reference [26]; SA = Staphylococcus aureus ATCC 29213; MRSA = clinical isolates of methicillin-resistant S. aureus 63,718 and SA 630 (National Institute of Public Health, Prague, Czech Republic); Mtb = Mycobacterium tuberculosis H37Ra.
Table 2. Experimentally found lipophilicity determined using HPLC and TLC approaches for N-arylcinnamanilides 120.
Comp.RRP-HPLCRP-TLC
Logk alogD blogD cRM dRM eRM f
1H0.02700.12510.1090−0.50870.28480.4038
22,4,6-F−0.08310.02600.0107−0.65360.12180.1951
33,4,5-F0.48930.54950.5274−0.42060.60740.5495
42,4-Cl0.52780.58850.5685−0.39330.65460.5495
52,4,5-Cl0.83730.88790.8647−0.24970.96950.9832
63,4,5-Cl0.96711.01040.9897−0.18701.08521.1306
72,4-Br0.61520.67040.6518−0.30980.73310.7295
82-F-5-Cl0.36920.43340.4154−0.47110.54110.5495
93-F-4-Br0.50250.55970.5408−0.40810.67970.6895
103-F-4-CF30.57890.63270.6095−0.50320.79230.5960
113-Cl-4-Br0.66110.71260.6912−0.33760.83880.8181
122-Br-4-Cl0.54760.60640.5860−0.40720.65530.6484
132-Br-5-CF30.55610.61570.5936−0.43250.71940.5619
142-CF3-4-F0.16070.24260.2220−0.67970.30110.1330
152-CF3-4-Cl0.41130.47410.454−0.61020.53050.3219
162-CF3-4-Br0.46830.53160.5105−0.56240.57300.4273
172-CF3-4-NO20.37940.44310.3989−0.56330.49980.4311
183-CF3-4-NO20.50040.55710.5098−0.48040.69270.6160
192,6-Br-4-CF30.43210.49410.4731−0.52060.53010.3733
202,6-Br-3-Cl-4-F0.31390.39220.3699−0.55410.43200.4138
a 72:28 MeOH:H2O; b 72:28 MeOH:NaOAc buffer (pH 7.4), c 72:28 MeOH: NaOAc buffer (pH 6.5), d 100% MeOH, e 72:28 MeOH:H2O, f 72:28 MeOH: NaOAc buffer (pH 7.4).

