Article

Efficient Method for the Concentration Determination of Fmoc Groups Incorporated in the Core-Shell Materials by Fmoc–Glycine

1
Department of Analytical Chemistry, Faculty of Chemistry, University of Gdansk, Wita Stwosza 63, 80-308 Gdansk, Poland
2
Corrosion and Materials Engineering, Department of Electrochemistry, Faculty of Chemistry, Gdansk University of Technology, Narutowicza 11/12, 80-233 Gdansk, Poland
*
Author to whom correspondence should be addressed.
Molecules 2020, 25(17), 3983; https://doi.org/10.3390/molecules25173983
Submission received: 23 July 2020 / Revised: 22 August 2020 / Accepted: 31 August 2020 / Published: 1 September 2020

Abstract

:
In this paper, we described the synthesis procedure of TiO2@SiO2 core-shell modified with 3-(aminopropyl)trimethoxysilane (APTMS). The chemical attachment of Fmoc–glycine (Fmoc–Gly–OH) at the surface of the core-shell structure was performed to determine the amount of active amino groups on the basis of the amount of Fmoc group calculation. We characterized nanostructures using various methods: transmission electron microscope (TEM), scanning electron microscopy (SEM), Fourier-transform infrared spectroscopy (FTIR), thermogravimetric analysis (TGA) and X-ray photoelectron spectroscopy (XPS) to confirm the modification effectiveness. The ultraviolet-visible spectroscopy (UV-vis) measurement was adopted for the quantitative determination of amino groups present on the TiO2@SiO2 core-shell surface by determination of Fmoc substitution. The nanomaterials were functionalized by Fmoc–Gly–OH and then the fluorenylmethyloxycarbonyl (Fmoc) group was cleaved using 20% (v/v) solution of piperidine in DMF. This reaction led to the formation of a dibenzofulvene–piperidine adduct enabling the estimation of free Fmoc groups by measurement the maximum absorption at 289 and 301 nm using UV-vis spectroscopy. The calculations of Fmoc loading on core-shell materials was performed using different molar absorption coefficient: 5800 and 6089 dm3 × mol−1 × cm−1 for λ = 289 nm and both 7800 and 8021 dm3 × mol−1 × cm−1 for λ = 301 nm. The obtained results indicate that amount of Fmoc groups present on TiO2@SiO2–(CH2)3–NH2 was calculated at 6 to 9 µmol/g. Furthermore, all measurements were compared with Fmoc–Gly–OH used as the model sample.

Graphical Abstract

1. Introduction

Titanium dioxide (TiO2) possesses many advantages, is nontoxic, highly efficient, photocatalytically stable and cost-effective [1,2]. Therefore, this compound has been extensively used in many fields. Recently, TiO2 has found several applications, including the development of new fluorescent materials [3,4], UV filters for cosmetics and paint pigments, [5] or photocatalysts used for water and air purification [6].
Nowadays, various metal nanoparticles such as silver, gold or titanium are widely used not only in industry, but also in nanotechnology and other various fields of research [7,8]. The titanium dioxide nanoparticles (TiO2 NPs) are utilized in many fields of industry [9]. Nevertheless, one of the biggest drawbacks of TiO2 NPs is the tendency to agglomerate. This limitation has been solved by the deposition of TiO2 NPs on surfaces of other materials such as silica (SiO2) resulting in the formation of TiO2@SiO2 core-shell particles. The SiO2 coating of NPs provides the colloidal stability, but the presence of silanol groups on the NPs surface contribute to the possible additional modification by various functional groups such as: alkyl [10], hydroxyl [11], thiol (-SH) [12,13], carboxyl (-COOH) [14], amine (-NH2) [15], EDTA derivatives [16] or other nanoparticles and ions [17,18].
3-(Aminopropyl)trimethoxysilane (APTES) is one of the most popular agents used for modifications of various nanoparticles such as TiO2 NPs [19], Fe3O4 [20], glass [21] or solid electrodes [22]. The presence of amino silane after reaction with hydroxyl-terminated surface makes it possible to obtain a new material with terminal amino groups. Consequently, these amino groups enable the immobilization of new biomolecules, such as proteins [23], enzymes [24], antibodies [25,26] or DNA samples [27].
The mechanism of NPs modification by alkoxysilanes consists of two steps. The first process is associated with the hydrolysis of silane groups of used modification agent which leads to the formation of alcohol and active alkoxysilane derivative. The second step leads to the condensation of organosilanols with hydroxyl groups present on the modified NPs surface. In this step, the condensation process also occurs [28]. The mechanism of action for APTES is based on the reaction with the hydroxyl group of the oxidized surface by SN2 exchange and loss of ethanol. The same reaction is observed in the case of APTMS usage, but during the surface covering the methanol is formed as a byproduct. The detailed studies of APTES hydrolysis and then condensation. including various details such as time reaction, concentration, temperature or pH is described elsewhere [25,29,30,31].
In the synthesis of modified nanoparticles—as well as in immobilization of biomolecules onto the surface—an important parameter characterizing the modified material is the estimation of the number of functional groups deposited on the surface to assess further modifications or material analyses. Determination of the amino group concentration is the most important parameter after modification by amino silanes. Estimation of amino groups can be obtained by various analytical methods, including acid–base back titration or reaction [32], conductometric titrations [33], NMR [34] or ζ-potential and direct measurements [35], thermogravimetric analysis [36] or X-ray photoelectron spectroscopy (XPS) analysis [37].
Additionally, amino functional groups can be estimated using various analytical methods after chemical reaction described above. The absorbance measurements after reaction with fluorescent rhodamine B isothiocyanate [32], the ninhydrin assay, as well as 4-nitrobenzaldehyde assay and NMR measurements are exceptionally useful for the determination of the amino functional groups [38]. Nevertheless, all of these methods show various sensitivities and advantages, but the main limitation of the methods listed above is the small amount of NPs for analyses.
In this work, we obtained TiO2@SiO2 core-shell by Stöber method. The main advantage of the Stöber method based on sol–gel chemistry is simplicity, wide availability of reagents and possibility of obtaining three-dimensional materials such as core shell nanoparticles in a one-pot synthesis. This method allow to obtain nanostructures with nano to micrometers size [39].
Subsequently, obtained TiO2@SiO2 core-shell was modified using (3-aminopropyl)trimethoxysilane (APTMS) to determine Fmoc groups concentration, what enabled the estimation of the amino group presence on the surface. Nowadays, the estimation of amino group presence on the surface of amino-modified nanomaterials is very problematic and requires much effort and instruments. Therefore, the nanoparticles were functionalized by Fmoc–Gly–OH and then Fmoc group was cleaved using 20% (v/v) piperidine solution in DMF. This reaction led to the formation of dibenzofulvene–piperidine adduct, used for the estimation of free amino groups by the measurement of the maximum absorption at 289 and 301 nm. The obtained results indicate that amount of Fmoc groups present on TiO2@SiO2–(CH2)3–NH2 was calculated at 6 to 9 µmol/g. All measurements were also compared with the solution of Fmoc–Gly–OH used as the model sample.

2. Results and Discussion

2.1. Synthesis

The synthesis and modification steps of TiO2 NPs are presented on Scheme 1. The TiO2 NPs were obtained in the reaction of titanium (IV) isopropoxide (TTIP) used as a titanium source and SDS as a surfactant by the microemulsion method previously described in Yuenyongsuwan procedure [40].
TiO2 NPs obtained using this method were used for further modifications. The TiO2@SiO2 core-shell structures were synthesized using Stöber method [41] with tetraethyl orthosilicate (TEOS) in the solution of pH = 9 adjusted by ammonia hydroxide.
In described Stöber method the core shell nanostructures are formed by hydrolysis and condensation of TEOS in ethanol and water catalyzed by ammonia hydroxide at room temperature [39,42].
The TiO2@SiO2 core-shell structures in this work were obtained by the adoption of the method described for the preparation of Ag@SiO2 core-shell nanoparticles [43].
In the next step, the obtained core-shell TiO2@SiO2 nanostructures were modified by an aminosilanization process using the post-grafting method with 3-(aminopropyl)trimethoxysilane (APTMS) as the reagent [44]. After the completion of the reaction, the presence of amino groups was confirmed using chloranil test performed on TiO2@SiO2–(CH2)3–NH2 with microscopic magnification [45]. Figure 1 shows the comparison of chloranil test performed for TiO2@SiO2 and TiO2@SiO2–(CH2)3–NH2 and its microscopic magnification. The chloranil test used in our experiments was consist of equally volumetric amounts of 2% solutions acetaldehyde in DMF and 2% solution of p-chloranil dissolved in DMF. After 15 min the change of colors from white to greenish blue was observed for TiO2@SiO2–(CH2)3–NH2 NPs indicating the presence of amino groups. On the other hand, the change of color for core-shell TiO2@SiO2 nanostructure were not observed due to the fact of absence of amino group.
Subsequently, the modified TiO2@SiO2–(CH2)3–NH2 NPs were used for coupling with Fmoc–glycine (Fmoc–Gly–OH). This reaction was performed in a solution consisting of methylene chloride: DMF, 1:1, (v/v) in the presence of 4-dimethylaminopyridine (DMAP) and diisopropylcarbodiimide (DIC) obtaining TiO2@SiO2–(CH2)3–NH–Gly–Fmoc. This procedure is used in peptide chemistry for the attachment of amino acids for resins calculations [46]. The Fmoc deprotection was performed using 20% (v/v) piperidine in DMF commonly used in the solid-phase peptide synthesis [47].

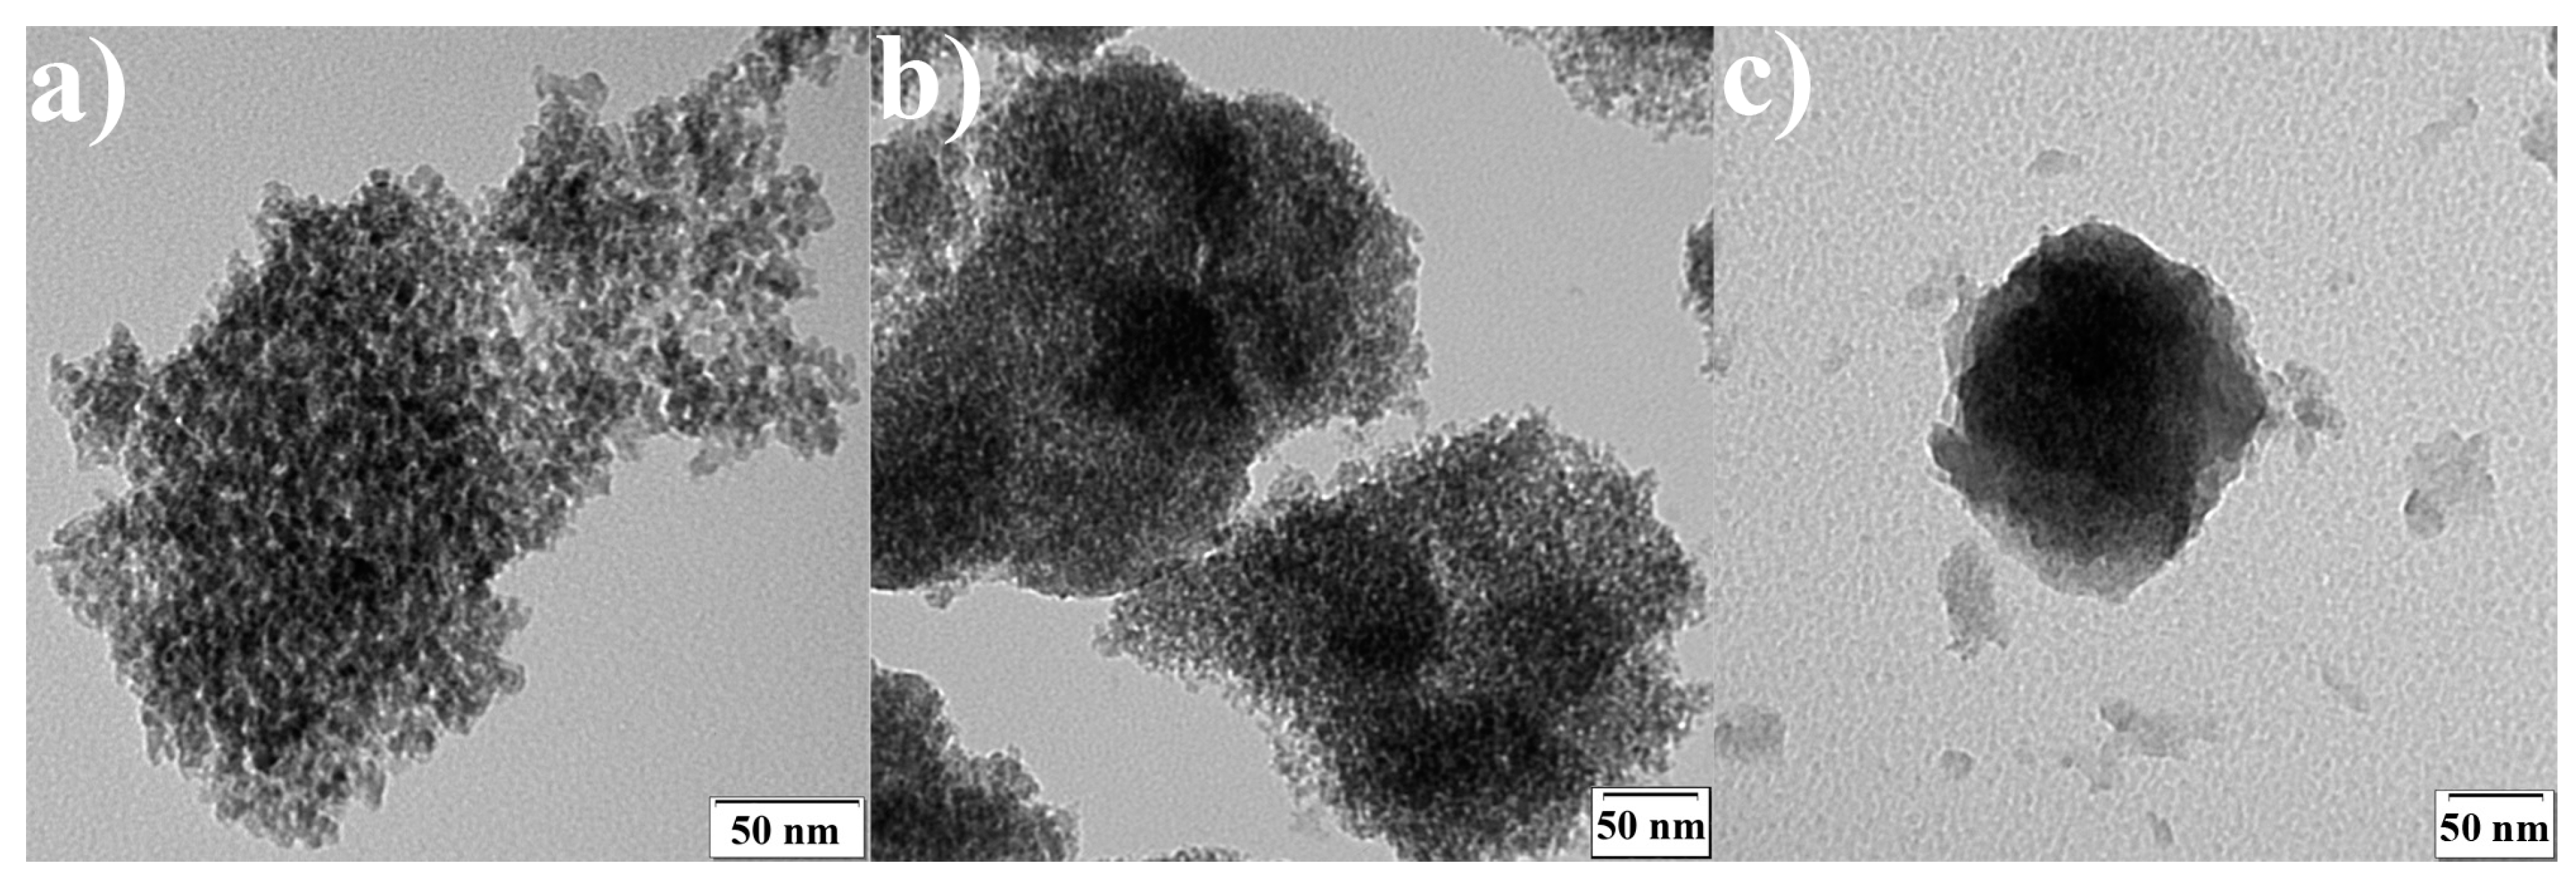
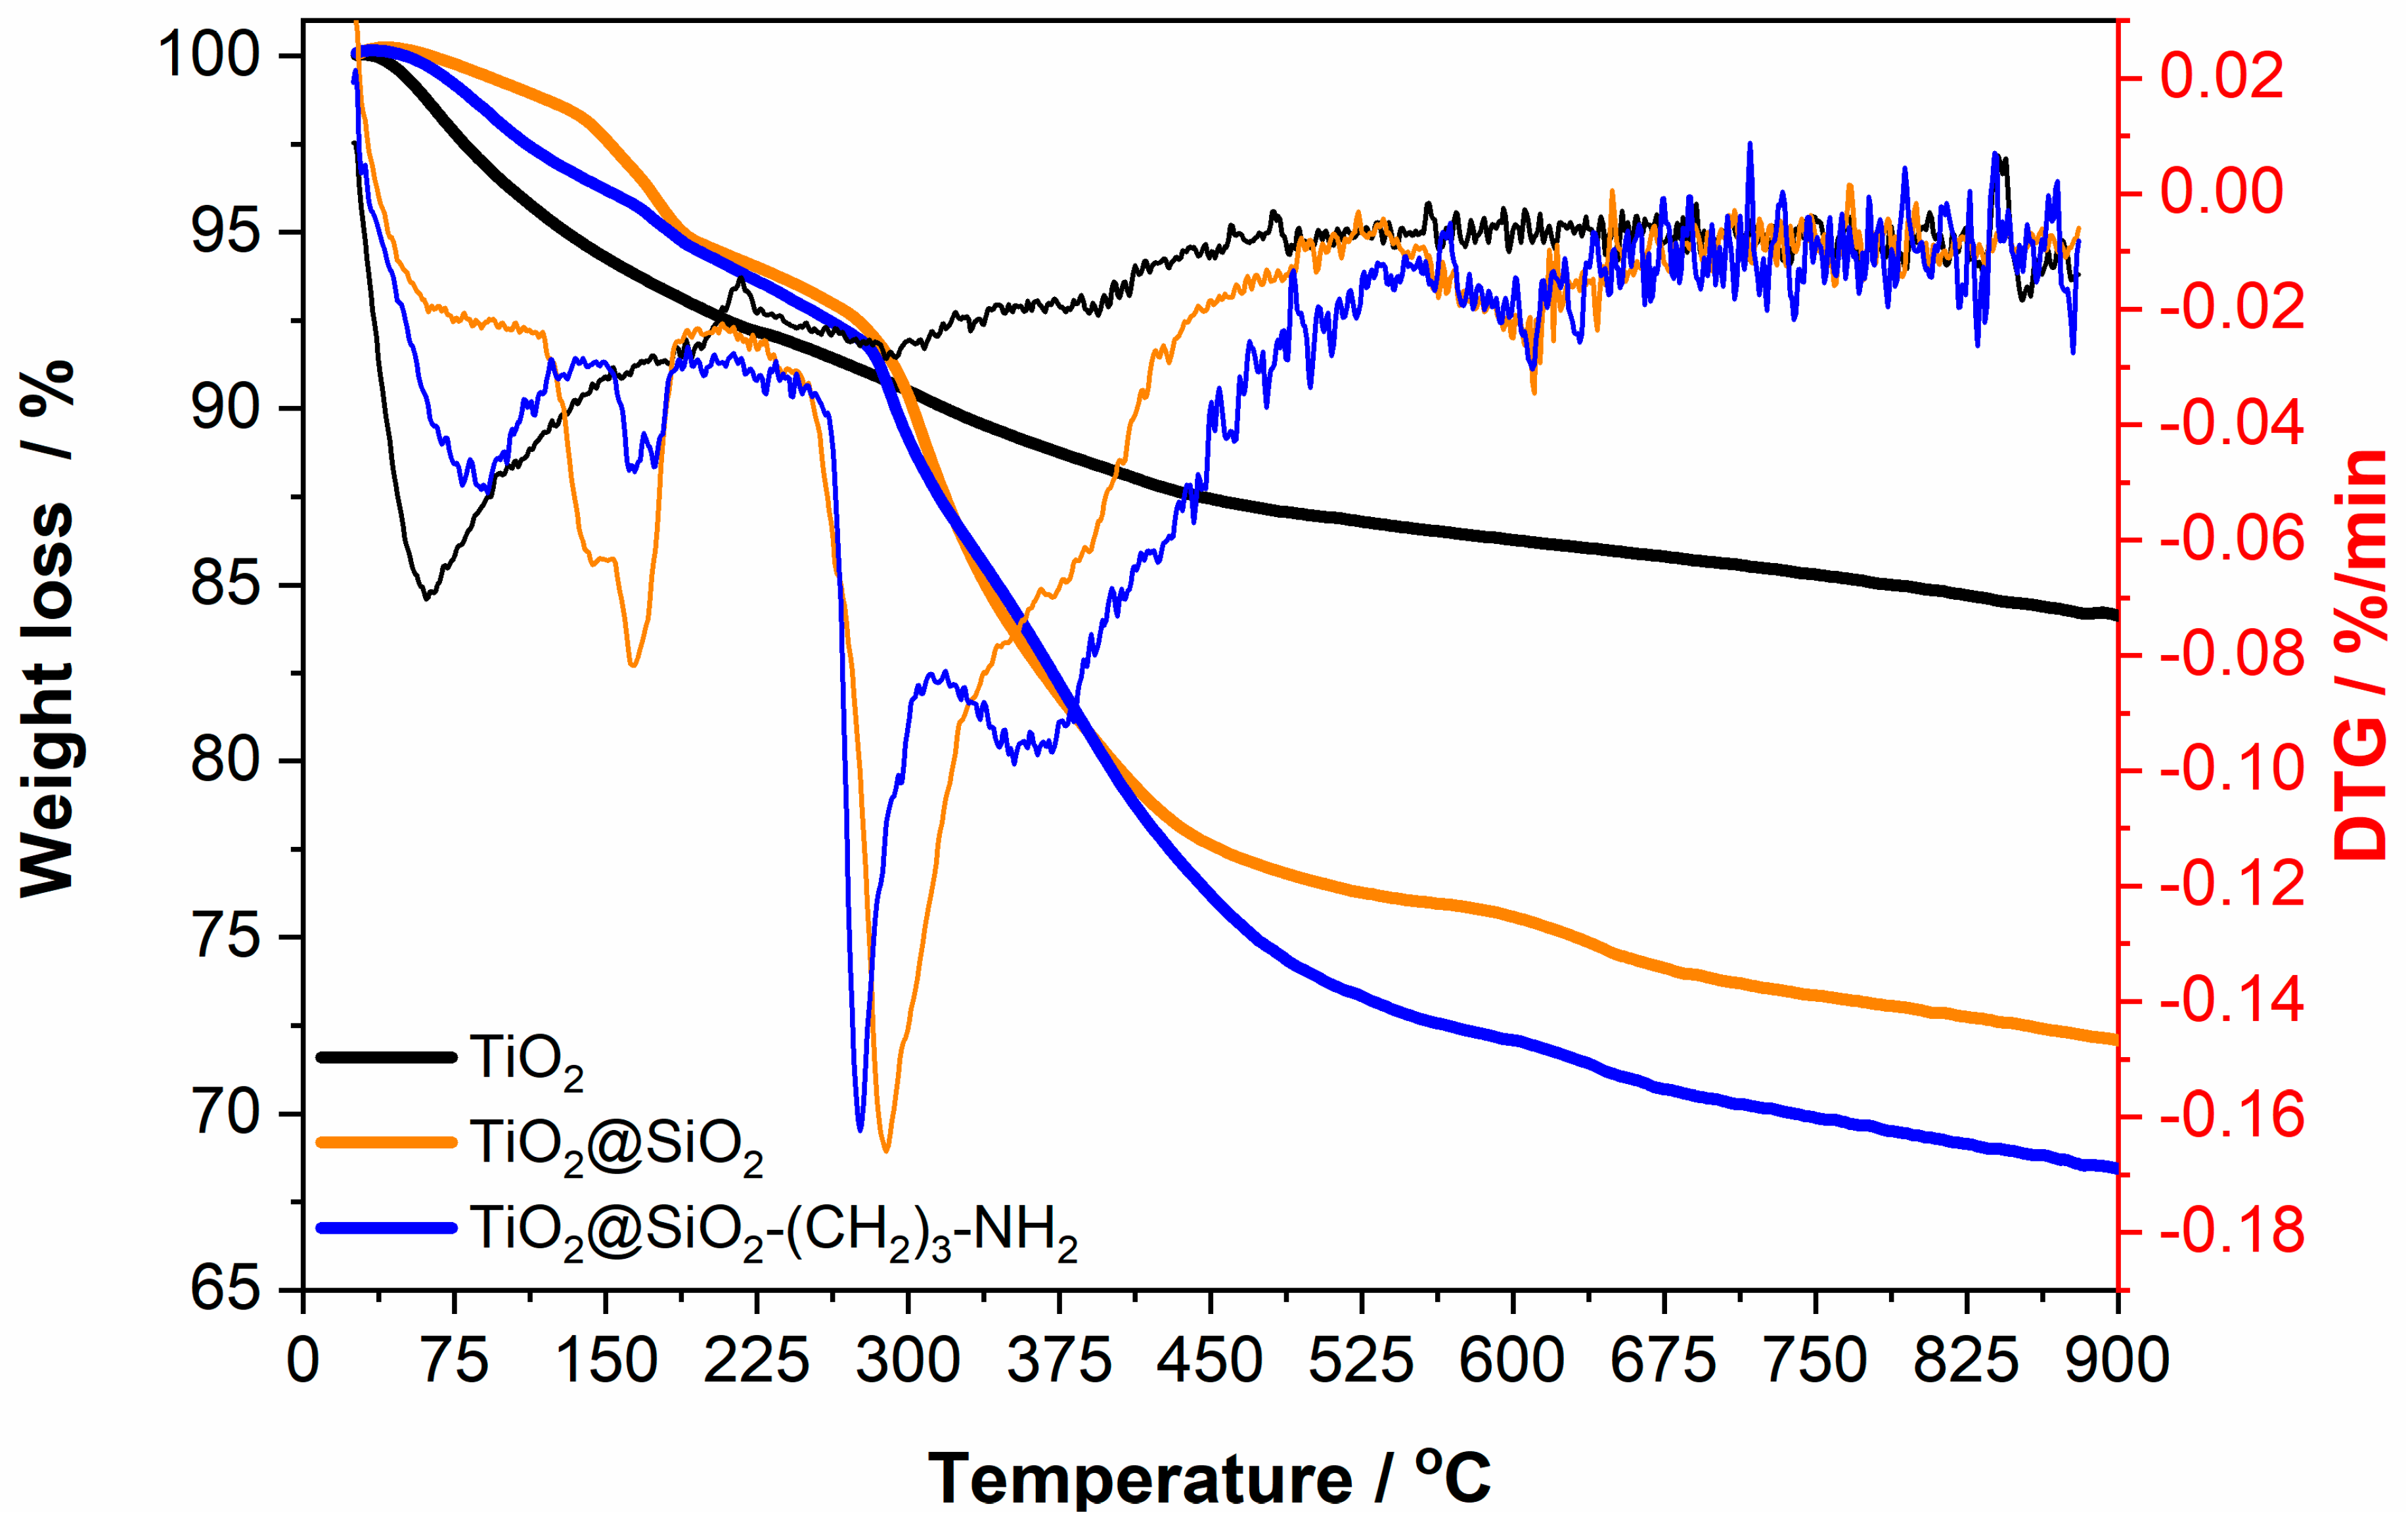
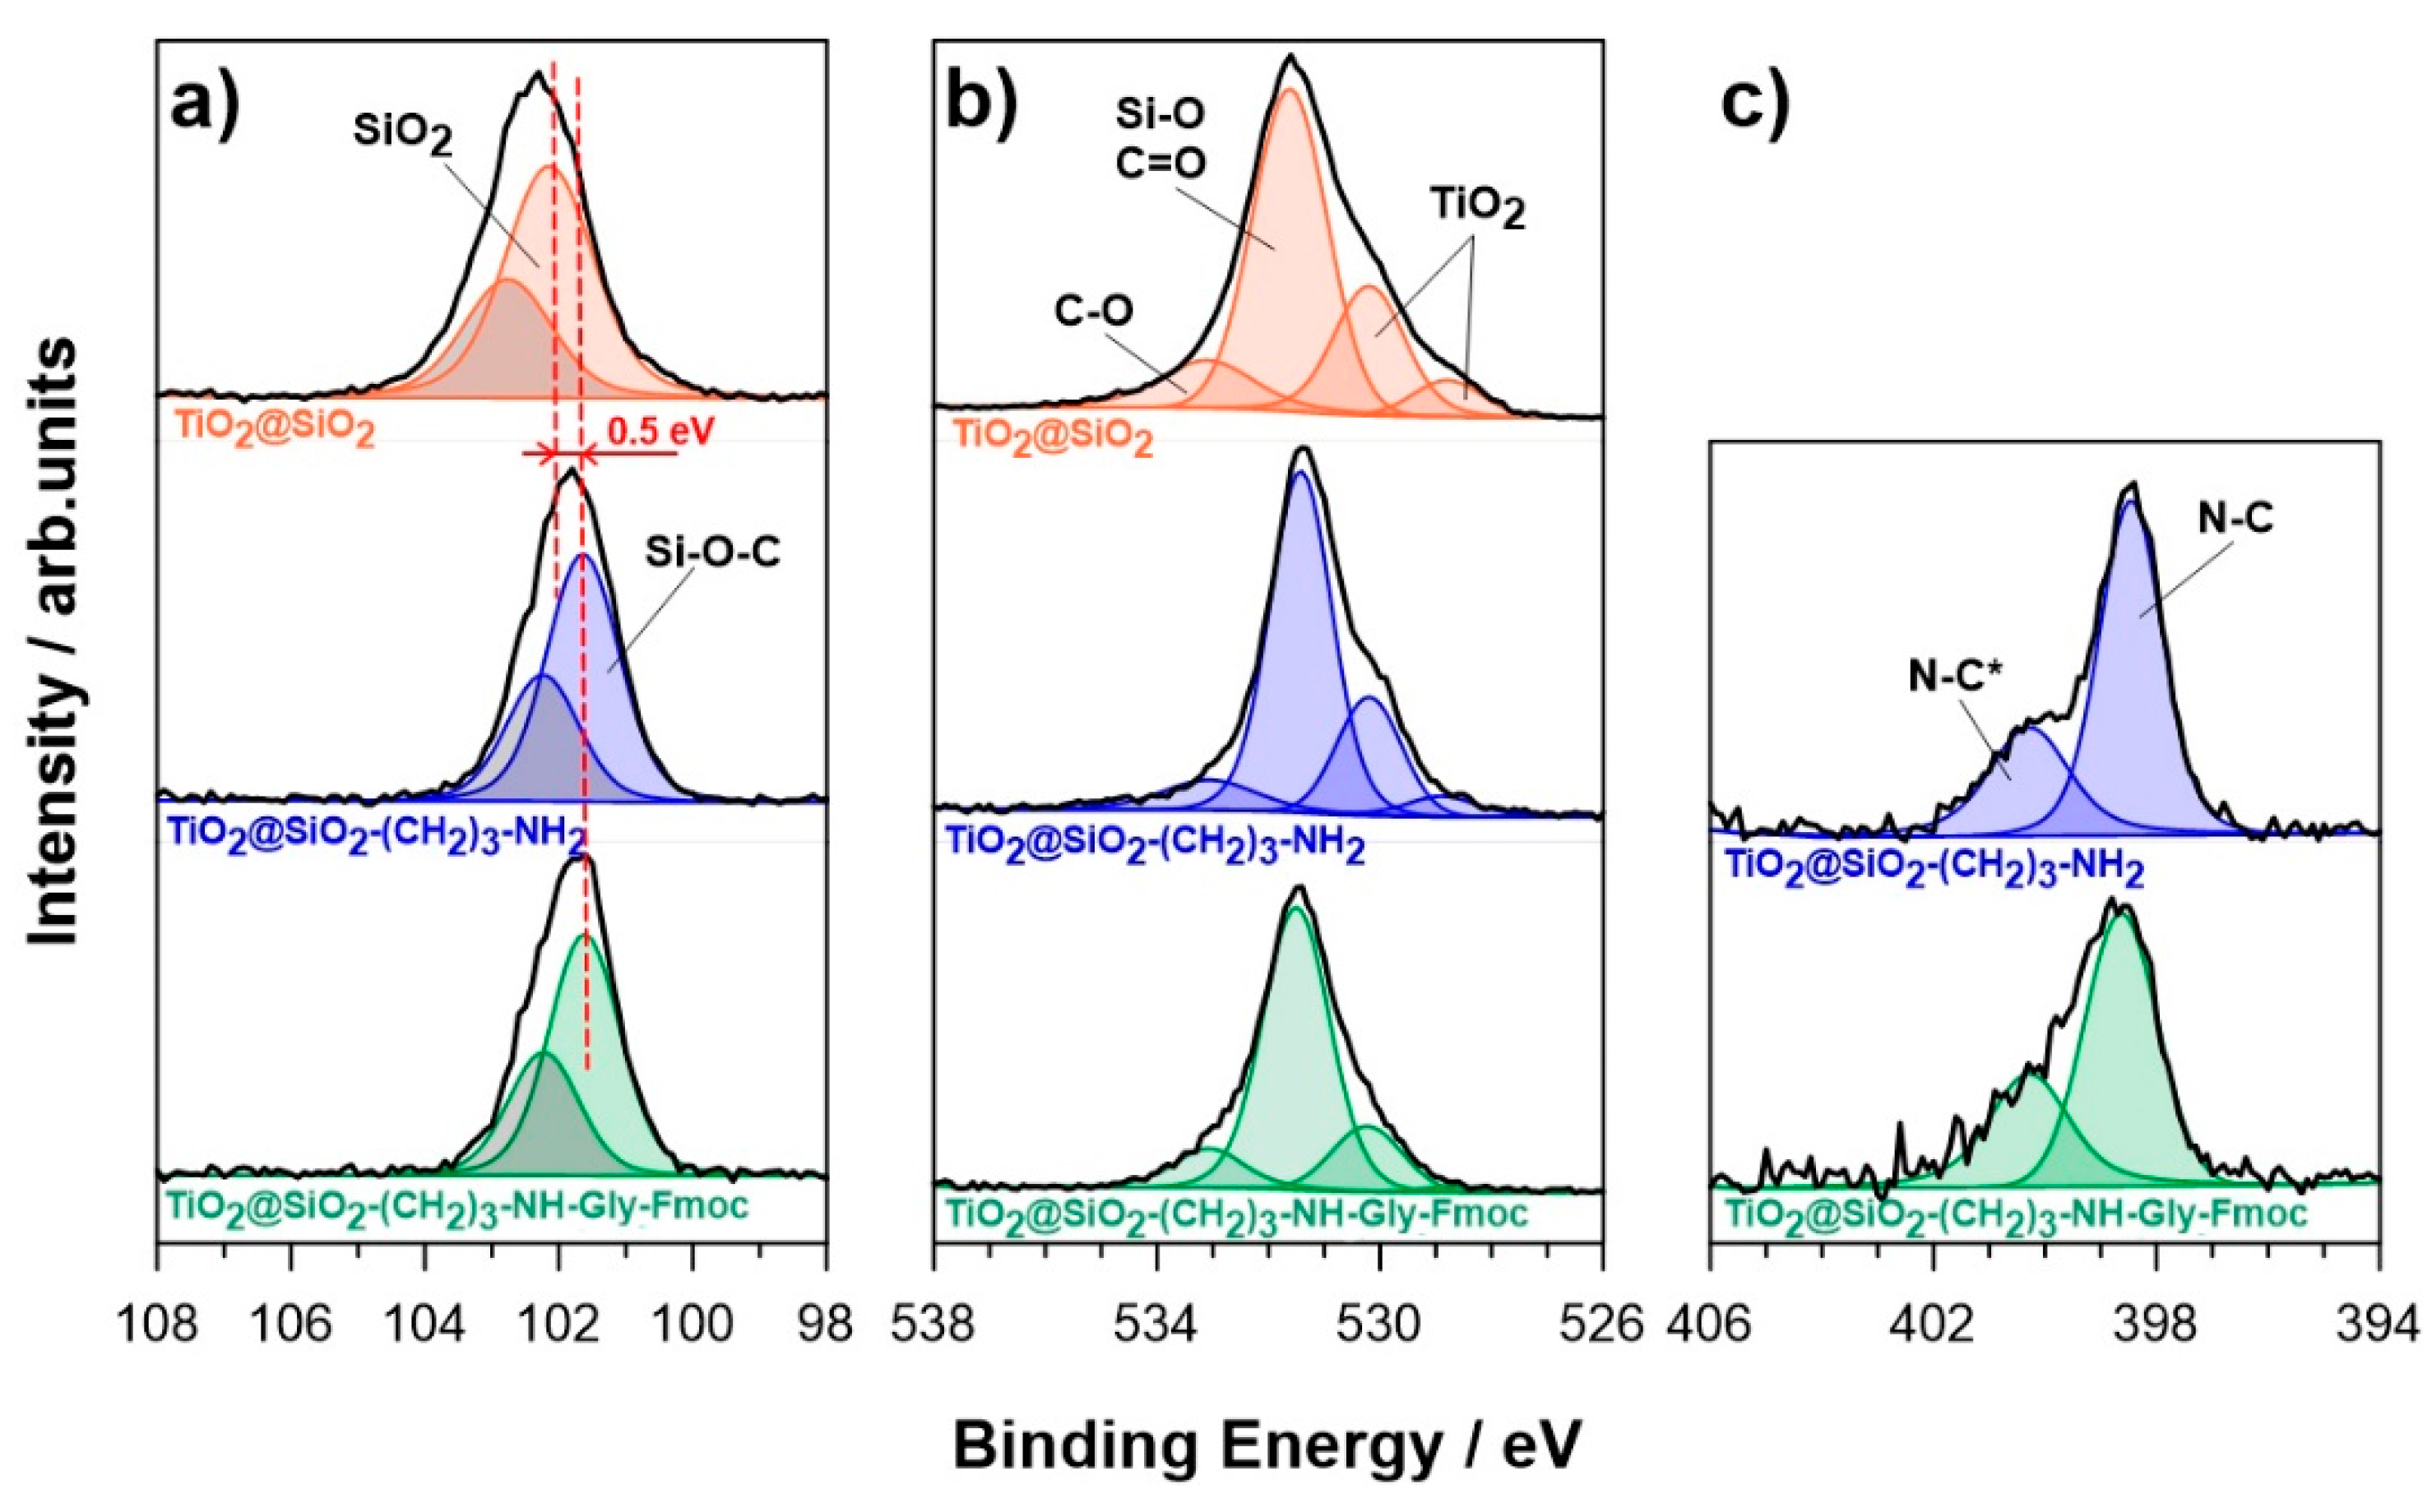
2.2. Analysis of Obtained Nanoparticles

TiO2 nanostructures as well as other studied nanoparticles were characterized using scanning electron microscopy (SEM). SEM images presented in Figure 2 show the presence of nanoparticles in the highly aggregated state.
No significant differences between the nanoparticles are not observed after each step of modifications. Therefore, in order to receive more precise visualization of studied nanoparticles surface the TEM images were obtained (Figure 3). SEM analysis of all nanoparticles were performed for powders, while TEM images were obtained for the nanoparticle suspensions which influence on the behavior of studied nanostructures.
The TEM images of three kinds of nanostructures—TiO2, TiO2@SiO2, and TiO2@SiO2–(CH2)3–NH2—are presented in Figure 3. The structure of TiO2@SiO2–(CH2)3–NH–Gly–Fmoc is strikingly similar to TiO2@SiO2–(CH2)3–NH2, thus these images are not presented.
All nanoparticles have a spherical shape, but they significantly differ in the aggregation levels. We can observe that aggregation into larger clusters decreased with the modification degree. The highest aggregation is observed in the decreasing order for TiO2@SiO2–(CH2)3–NH2, TiO2@SiO2 and TiO2. The covering of TiO2 nanoparticles by silica core-shell structures and further modification by APTMS prevent the aggregation process [48,49].
The average size of nanoparticles is about 10 nm for TiO2, TiO2@SiO2 and 100 nm for TiO2@SiO2–(CH2)3–NH2.
Figure 4 shows a sequence of FTIR spectra for TiO2, TiO2@SiO2, TiO2@SiO2–(CH2)3–NH2 and TiO2@SiO2–(CH2)3–NH–Gly–Fmoc the characteristic bands of TiO2 were observed Figure 4a. The broadband region located at the 3380 cm−1 is related to the stretching vibration of the hydroxyl group (-OH). The band at the 1633 cm−1 is assigned to bending modes of Ti–OH water. Additionally, the last band located at 620 cm−1 range represents the stretching vibrations of Ti–O–Ti binding [50,51]. However, the FTIR spectrum of TiO2@SiO2—presented in Figure 4a—shows more absorption bands in comparison with the absorption bands observed for the titanium dioxide. The characteristic bands at 3450 cm−1 and 1600 cm−1 in the spectra are attributed to the stretching vibration and bending vibration of hydroxyl groups. The band at 1400 cm−1 was assigned as the Ti–O–Ti vibration [52]. The peaks at 1080 cm−1, 950 cm−1 and 470 cm−1 correspond to the stretching vibrations for Si–O–Si, Ti–O–Si and Ti–O, respectively [53]. Figure 4b presents TiO2@SiO2–(CH2)3–NH2 particles. The peak at 3400 cm−1 is associated with -NH2 stretching vibrations and the peaks at 2930 cm−1 are assigned to the stretching vibrations of -CH2 groups. The absorption band at 1600 cm−1 is associated with the presence of -NH2 deformation mode [54]. Furthermore, the absorption peaks at 1130 and 1030 cm−1 belong to Si–O–Si, peak at 690 cm−1 was assigned to the stretching vibration of the Ti–O–Ti bond, the Ti–O group is observed at 460 cm−1. For TiO2@SiO2–(CH2)3–NH–Gly–Fmoc (Figure 4b) similar bands are observed as in the case of TiO2@SiO2–(CH2)3–NH2. One of the most characteristic peaks is observed at 1660 cm−1 which presents stretching groups combined with carbonyl groups (-C=O) [55]. This analysis confirmed the modification of TiO2 with silica, amino groups and Fmoc–Gly–OH.
Thermogravimetric analysis (TGA) and derivative thermogravimetric analysis (DTG) for TiO2, TiO2@SiO2 and TiO2@SiO2–(CH2)3–NH2 is presented at Figure 5. For TiO2 NPs, the 7.92% weight loss is observed between 65 and 200 °C, this process is probably associated with physical desorption of water on the surface [49]. Next visible changes are observed within the range 300 to 410 °C with the weight loss of 5.28% attributed to the reduction of hydroxyl groups.
For TiO2@SiO2 core-shell, 6.65% weight loss in the 350 to 500 °C range indicates the disintegration of hydroxyl groups in silanol moieties [56]. The range of 500 to 700 °C is characterized with the weight loss of 2.74% due to the degradation of -CH2CH3 alkyl group in TEOS [49].
In the case of TiO2@SiO2–(CH2)3–NH2 structure, the largest decrease in mass of 14.01% within 400 to 600 °C range was caused by the thermal decomposition of APTMS molecule.
Figure 6 reveals the changes in the surface chemistry of the nanoparticles upon consecutive functionalization steps during formation of the core-shell materials.
First, the successful formation of the TiO2@SiO2 particles was confirmed through the appearance of strong Si2p peak doublet at approx. 102.1 eV, which is typical for SiO2 monolayer surface coverage on TiO2 [57,58] (Figure 6a). The TiO2@SiO2 O1s reveals a complex nature, with multiple components characteristic for the SiO2 (531.6 eV), TiO2 (528.8 eV) and atomically mixed TiO2–SiO2 thin film (530.2 eV) [16,58], which are further modified by the presence of small amounts of adventitious carbon, carbonate and adsorbed water contamination resultant from the air exposure [59]. The observed SiO2:mixed:TiO2 ratio was 9.2:3.5:1. The detailed information regarding the deconvolution with the proposed model is summarized in Table 1.
The consecutive functionalization of the core-shell TiO2@SiO2–(CH2)3–NH2 with amino groups led to a negative shift of the Si2p peak doublet position by 0.5 eV due to the appearance of silicon oxycarbide Si–O–C interaction [60,61]. In parallel, the oxygen surface chemistry is significantly altered. The share of mixed TiO2–SiO2, SiO2, and TiO2 components drops approximately by a factor of 1.5. Last, but not least, a strong signal recorded in the N1s energy range revealed the presence of the amino -NH2 species (398.5 eV) [62,63]. The N1s signal is characterized by a complex structure, with a second, two times smaller component, which may be the effect of NH3+ protonation or deprotonation on NH-.
Finally, the incorporation of Fmoc–glycine on the surface of encapsulated TiO2@SiO2 nanoparticles only slightly changed the chemistry, based on XPS analyses. Further decay in the O1s signal strength from titanium and silicon oxides was observed, except for the component located at 531.6 eV, which source next to SiO2 is also C=O bonds in glycine [64,65]. Based on the XPS analyses of core level Si2p, O1s and N1s binding energy range (Figure 6a–c), the chemistry of SiO2 and NH2 species did not change significantly between TiO2@SiO2–(CH2)3–NH2 and TiO2@SiO2–(CH2)3–NH–Gly–Fmoc nanoparticles. Moreover, the TiO2 presence may no longer be recognized based on the Ti2p spectra.

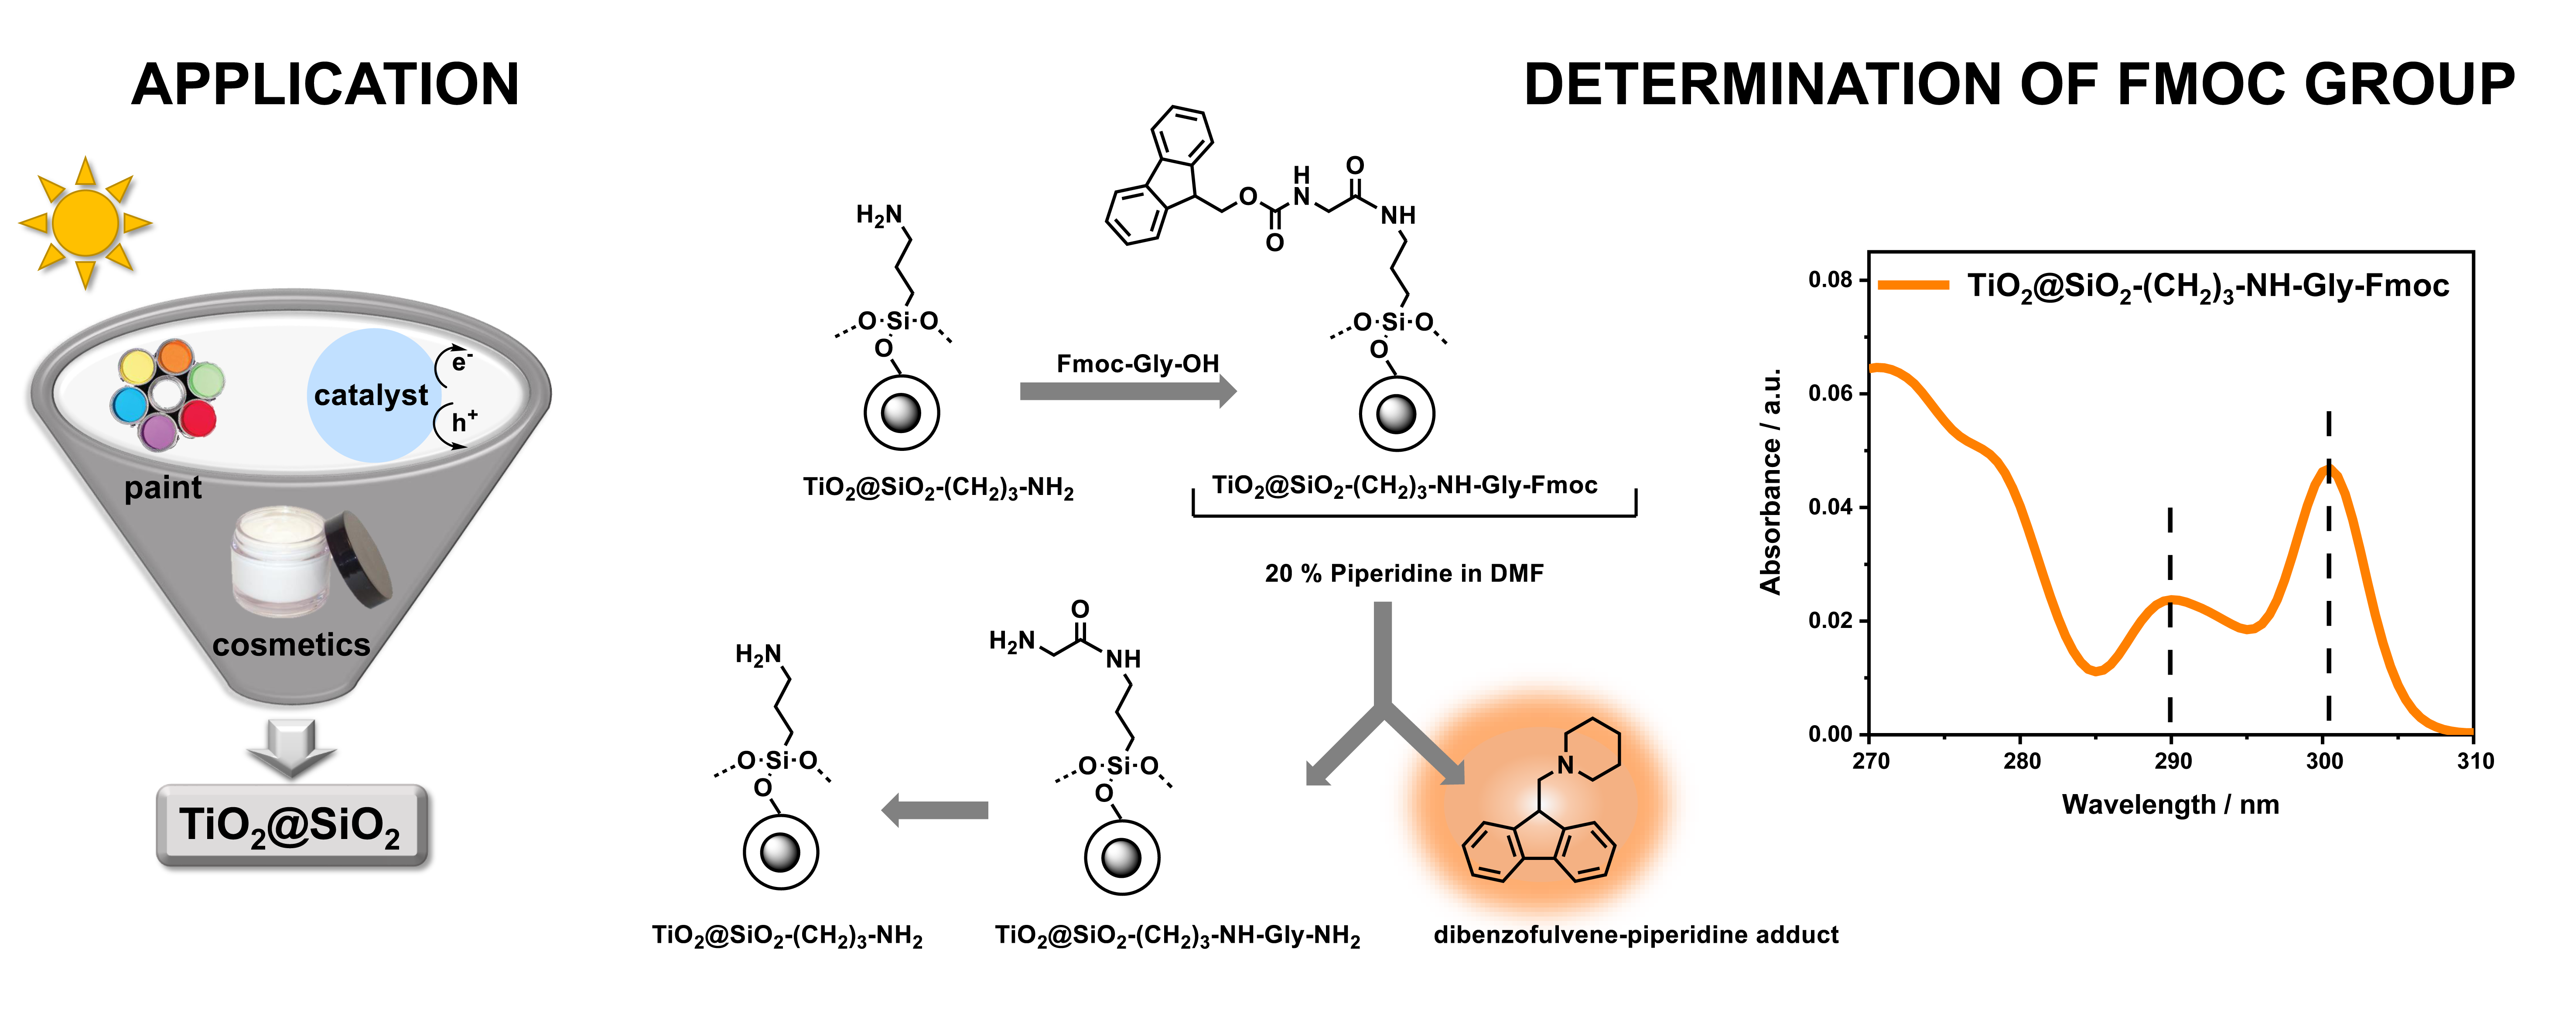
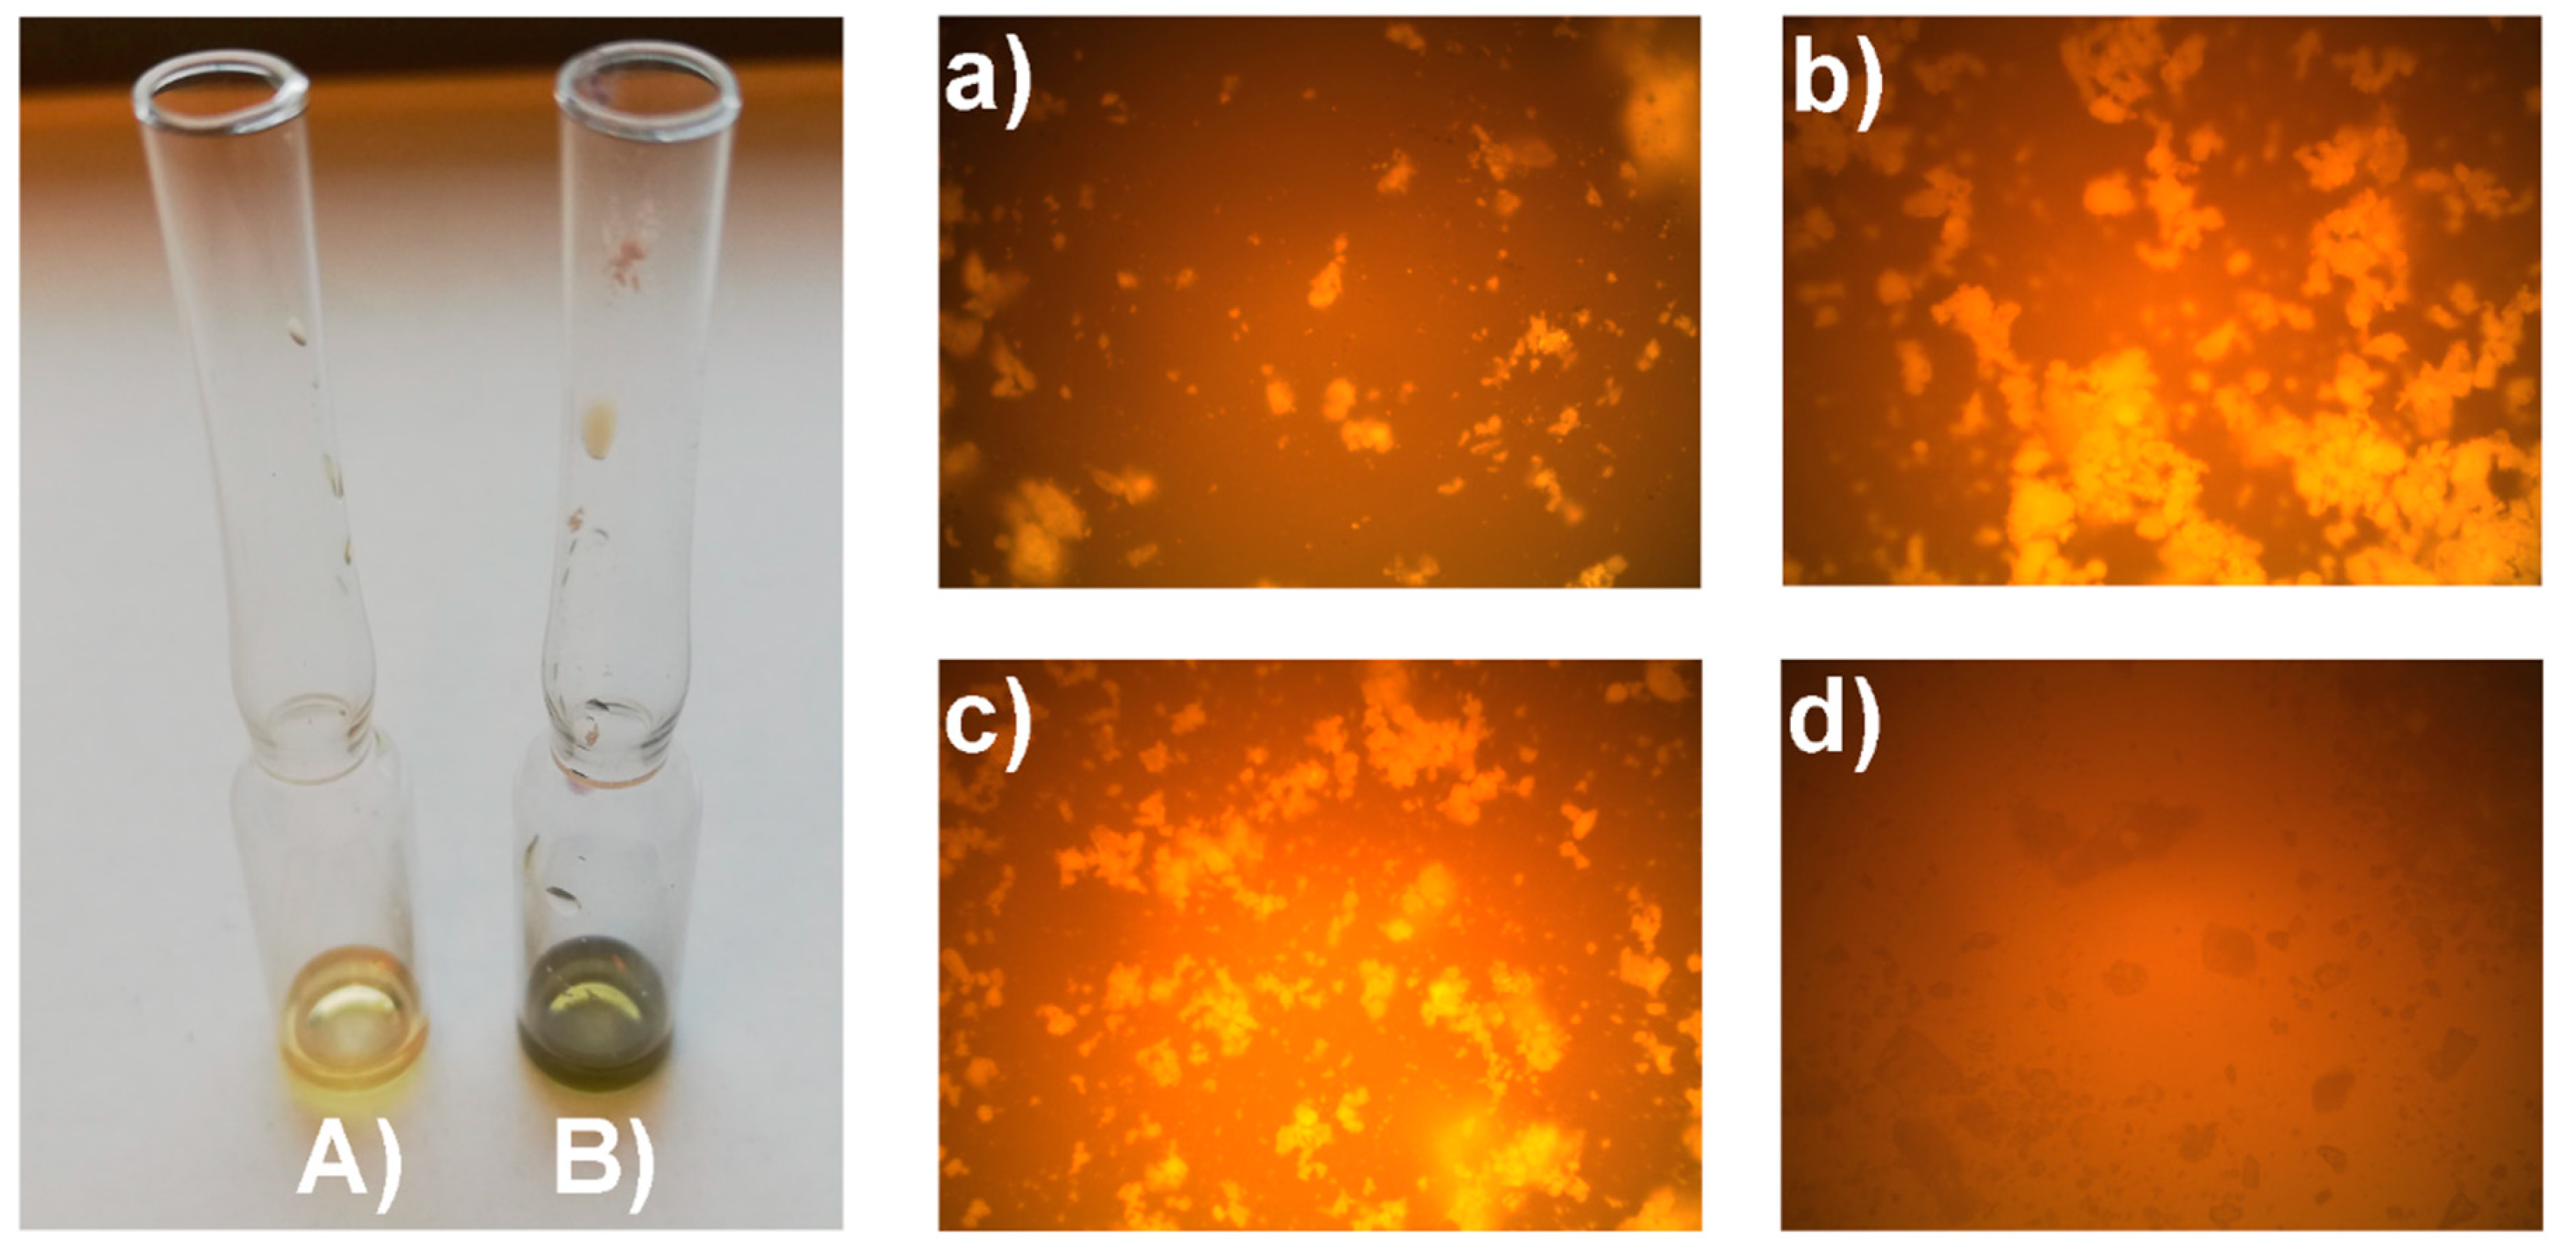
2.3. Determination of Fmoc Group Loading on TiO2@SiO2–(CH2)3–NH–Gly–Fmoc Core-Shell Nanostructure

Nowadays, the solid-phase peptide synthesis using Fmoc/t-Bu method is one of the most frequent strategies to obtain a peptide. This method is applied for the peptide synthesis on a solid support with amino acid derivatives containing a base-labile Fmoc group protecting the amino group and acid-labile side chains [66]. Since there is a wide distribution of Fmoc amino acid derivatives, the peptide synthesis using this strategy is particularly cost-effective and does not require the usage of toxic hydrogen fluoride [67]. Fmoc group during synthesis is usually removed in a weak basic conditions, in 20% of piperidine in DMF. The reaction mechanism of Fmoc cleavage from solid support presented in Scheme 2 in the first step is based on β-elimination [68]. Initially, the proton from the fluorenyl group at the 9-position is removed by piperidine with the formation of dibenzofulvene Scheme 2. In the next step, the presence of piperidine causes the formation of dibenzofulvene–piperidine adducts based on the Michael-type addition [69]. This reaction usually occurs in electron-donor polar solvents, such as DMF.
The reaction of Fmoc protected core-shell and piperidine led to the formation of piperidine-dibenzofulvene adduct. Due to the fact that this adduct is soluble in reaction solvents, one can use the spectrophotometric measurement to determine the concentration of Fmoc groups based on Beer–Lambert law. The determination of Fmoc groups loading at core-shell nanostructure enable the calculation of the amino group prevalence at amino core-shell structure before the modification by Fmoc–Gly–OH.
In this work, we adopted the method previously invented for the determination of first anchored Fmoc-protected amino acids on resins to measure the presence of amino groups on the core-shell structure. Both mechanism and determination of molar absorption coefficient (ε) for piperidine-dibenzofulvene in different solutions have been reported in many studies. Therefore, we decided to calculate and compare the loading of Fmoc groups based the on literature data using a different ε value both for core-shell structure, as well as for Fmoc–Gly–OH model sample.
The spectrophotometric measurements performed for both TiO2@SiO2–(CH2)3–NH–Gly–Fmoc and Fmoc–Gly–OH are presented in Figure 7. In both graphs, two absorption maxima at 289 and 301-nm wavelengths are observed, corresponding to the presence of dibenzofulvene–piperidine adduct in the solution. The mechanism of the occurring reaction is presented in Scheme 2. The molar absorption coefficient (ε) was determined previously for this absorption maxima: ε (267 nm) = 17,500 dm3 × mol−1 × cm−1,ε (290 nm) = 5800 dm3 × mol−1 × cm−1 and ε (301 nm) 7800 dm3 × mol−1 × cm−1 in methylene chloride [70]. The similar value was also used for DMF solution: ε (266 nm) = 17,500 dm3 × mol−1 × cm−1, ε (289 nm) = 5800 dm3 × mol−1 × cm−1 and ε (300 nm) 7800 dm3 × mol−1 × cm−1 [71]. In many studies only one ε coefficient (301 nm) 7800 dm3 × mol−1 × cm−1 was used for the calculation of the loading of amino acids and other molecules on a resin [69,72,73,74,75].
Nevertheless, the detailed research on Fmoc-substituted resin at a different wavelength determined previously (ε = 6089 dm3 × mol−1 × cm−1) at 289,8 nm and (ε = 8021 dm3 × mol−1 × cm−1) at 301 nm [76] encouraged us to compare different ε coefficient of dibenzofulvene–piperidine in DMF for calculation of Fmoc groups on core-shell nanostructures and model sample (Fmoc–Gly–OH).
All measurements of adsorption spectra of dibenzofulvene–piperidine adduct were performed in triplicates. In the case of TiO2@SiO2–(CH2)3–NH–Gly–Fmoc as well as Fmoc–Gly–OH, two absorption maxima were observed at 289 nm and 301 nm Figure 7. In both cases also the absorption band was observed at 267 nm, but due to the fact of intensity differences, this band was not included in the calculations of Fmoc loading. The detailed data of the maximum absorbance value for the examined materials are presented in Table 2.
The estimation of the Fmoc group (Z) loading on the TiO2@SiO2–(CH2)3–NH–Gly–Fmoc core-shell nanostructure surface was calculated according to the equation presented in the paragraph 3.4. The comparison of all calculated loadings of the Fmoc group for both examined materials is presented in Table 3. The obtained data directly indicate that in the case of TiO2@SiO2–(CH2)3–NH–Gly–Fmoc the similar values of loading for Fmoc groups were obtained (6 µmol/g) taking into consideration the maximum band at λ = 289 nm and using both molar absorption coefficients: ε = 5800 and 6089 dm3 × mol−1 × cm−1. The calculation performed for 301-nm wavelength confirmed the relation presented above. Conducted calculations gave the similar values of loading for Fmoc groups at the core-shell nanostructure of about 8 or 9 µmol/g using molar absorption coefficient ε = 7800 and 8021 dm3 × mol−1 × cm−1.
The differences in the given calculations of Fmoc group loading probably decrease with the increasing mass of TiO2@SiO2–(CH2)3–NH–Gly–Fmoc samples used for a measurement.
In the case of Fmoc group presence determination for Fmoc–Gly–OH in the solution used as the model sample, our calculation is almost the same regardless of the intensity of absorption band both at 289 nm, as well as 301 nm. The concentration of the Fmoc group was obtained at the level of 2 mmol/g.
The calculation of Fmoc-group loading at solid materials described in this work provides the information on how many active amino groups are present at these materials before modifications. The presented method is much simpler and cost-effective in comparison with the commonly used methods for amino groups determination. Additionally, presented method can be adopted for the characterization of nanomaterials.

3. Materials and Methods

3.1. Materials

All reagents and solvents were of analytical grade and used without purification. Sodium dodecyl sulfate (SDS), titanium (IV) isopropoxide (TTIP), sodium citrate dihydrate, tetraethyl orthosilicate (TEOS), 3-(aminopropyl)trimethoxysilane (APTMS), Fmoc–glycine (Fmoc–Gly–OH) used as a control sample, piperidine, N,N′-diisopropylcarbodiimide (DIC), 4-dimethylaminopyridine (DMAP) and tetrachloro-p-benzoquinone (p-chloranil) were purchased from Sigma-Aldrich (Poznan, Poland).

3.2. Synthesis of TiO2 Derivatives

3.2.1. Synthesis of TiO2

Titanium precursor (TTIP) (9.678 g, 33.7 mmol) was added to 200 mL of 8-mmol/L SDS dissolved in water. The reaction mixture was stirred for 1 h in 90 °C until white precipitate was obtained. Subsequently, the obtained product was separated by centrifugation, washed with distilled water until complete removal of SDS and the dried on air.

3.2.2. Synthesis of TiO2@SiO2

TiO2 (50 mg, 6.25 mmol) obtained in the procedure mentioned above was added to 100 mL of ethanol solution containing 30 mg of sodium citrate. The solution was vigorously stirred on magnetic stirrer and adjusted to pH = 9 using ammonia hydroxide. Then, 10 mL (44.83 mmol) of tetraethyl orthosilicate (TEOS) was added to the reaction mixture. After stirring for 24 h, the obtained white precipitate was collected by centrifugation, washed with ethanol and dried.

3.2.3. Synthesis of TiO2@SiO2–(CH2)3–NH2

TiO2@SiO2 (100 mg) and 3-(aminopropyl)trimethoxysilane (APTMS; 0.7 mL, 4.00 mmol) were dissolved in 1.5 mL of toluene. Subsequently, the solution was transferred to a round-bottomed flask equipped with a reflux condenser and stirred at 120 °C for 24 h. The reaction mixture was cooled down to the room temperature, the obtained participate was washed with diethyl ether and dichloromethane and dried in a stream of nitrogen. The effectiveness of the amination reaction was confirmed based on the chloranil test [45].

3.2.4. Synthesis of TiO2@SiO2–(CH2)3–NH–Gly–Fmoc

The mixture of TiO2@SiO2–(CH2)3–NH2 (40 mg) and Fmoc–glycine (Fmoc–Gly–OH) (10 mg, 0.0336 mmol) dissolved in methylene chloride: DMF, 1:1, (v/v) was cooled in an ice-bath to 0 °C. Then, 50 µL of N,N′-diisopropylcarbodiimide (DIC) and 0.5 mg of 4-dimethylaminopyridine (DMAP) were added to the solution and stirred overnight. After this time, the resulting residue was centrifuged and washed several times with DMF and dichloromethane until the absence of substrates. Obtained residue was dried in vacuum desiccator over P2O5 for 12 h at room temperature, resulting in 31 mg of the desired product.

3.3. Material Characterization

Transmission electron microscope (TEM) images were obtained on Tecnai G2 Spirit BioTWIN by FEI (Eindhoven, the Netherlands). Scanning electron microscopy (SEM) images were obtained on Hitachi S-3400N scanning electron microscope. Fourier-transform infrared spectroscopy (FT-IR) analyses were carried out using Bruker IFS 66 Spectrometer (Ettlingen, Germany).
The thermal analysis of the nanostructures was measured using Jupiter STA 449 F3 thermogravimetry connected to the QMS 403 C quadrupole mass spectrometer (Netzsch, Selb, Germany). The measurements were carried out in an inert gas (argon) atmosphere, from room temperature to 1000 °C, with a heating rate of 10 °C/min.
X-ray photoelectron spectroscopy (XPS) studies were carried out on PHI QUANTERA II spectrometer. The spectroscope is equipped with monochromatic AlKα source, the analyses were carried out with a spot diameter of 250 µm and in the binding energy range of C1s, O1s, N1s, Si2p and Ti2p spectra. Measurements were conducted with 20 eV pass energy, with the charge compensation controlled through low-energy electron and Ar+ ions flow by a flood gun.
The spectrophotometric measurements were determined by using UV-vis spectrophotometer, Perkin Elmer, Lambda 650 model (Shelton, CT, USA). The measurement was performed at 298 K using 1-cm-thick quartz spectrophotometric cuvettes in 20% (v/v) solution of piperidine in DMF at the 200–800 nm wavelength range.

3.4. The Procedure of Amino Group Loading on Nanoparticles

The dibenzofulvene–piperidine adducts is usually soluble in the reaction solvent. The occurrence of dibenzofulvene–piperidine in the solution after cleavage with piperidine gives the possibility to use the absorbance spectroscopy. This method is utilized to calculate the number of amino groups in the case of amino acid derivatives or surface coverage by amino groups in the case of NPs derivatives containing amino groups protected by Fmoc groups. In this work, we adopted the spectrophotometric measurements to determine the concentration of amino groups at the TiO2 NPs modified by Fmoc–Gly–OH derivative (TiO2@SiO2–(CH2)3–NH–Gly–Fmoc). Additionally, we calculated the amount of amino groups for Fmoc–Gly–OH used as a model sample according to the procedure described below.
About 2 mg of TiO2@SiO2–(CH2)3–NH–Gly–Fmoc sample Table 2 was weighted in a spectrophotometric quartz cuvette. Then, 3 mL of 20% (v/v) piperidine in DMF was added and the suspension was stirred for 20 min. After this time, the precipitate was left for 1 h to settle down at the bottom of the cuvette and then the absorption spectra were obtained. The estimation of the Fmoc group loading was conducted according to the equation [76]. The knowledge concerning the loading of Fmoc groups attached to NPs enables the estimation of amino groups load at the nanoparticle surface.
Z = A × v ε × m × l
  • Z—Fmoc group loading (mol/g)
  • A—Absorbance value at the maximum absorption (nm)
  • v—Volume of solvent (dm3)
  • ε—Molar absorption coefficient (dm3×mol−1×cm−1 maximum absorption)
  • m—Sample weight (mg)
  • l—Length of the cell (1 cm)

4. Conclusions

In this study, the synthesis of TiO2, TiO2@SiO2, TiO2@SiO2–(CH2)3–NH2 core-shell structures was presented. The Fmoc–glycine (Fmoc–Gly–OH) was used as a modification agent of TiO2@SiO2–(CH2)3–NH2 to obtain TiO2@SiO2–(CH2)3–NH–Gly–Fmoc. All the obtained nanostructures were described using various analytical methods: transmission electron microscopy (TEM), Fourier-transform infrared spectroscopy (FTIR), thermogravimetric analysis (TGA) and X-ray photoelectron spectroscopy (XPS). Additionally, all of these measurements confirmed the effectiveness of each modification step. The deposition of Fmoc–glycine (Fmoc–Gly–OH) on the core-shell structure was used to develop the method for quantitative determination of Fmoc groups present at newly obtained materials. In this procedure, (Fmoc) groups were cleaved using 20% (v/v) solution of piperidine in DMF. This reaction leads to the formation of dibenzofulvene–piperidine adduct enabling the estimation of Fmoc groups loading by UV-vis spectroscopy. The comparison of different molar absorption coefficients—5800 and 6089 dm3 × mol−1 × cm−1 and 7800 and 8021 dm3 × mol−1 × cm−1 was used to calculate the loading of Fmoc groups at 289 nm and 301 nm, respectively. Furthermore, the presence of Fmoc groups in solution was calculated for Fmoc–Gly–OH used as the model sample. The described methodology is particularly useful for the determination of the number of amino groups in various nanomaterials.

Author Contributions

Conceptualization, E.S. and P.N. methodology, E.S.; P.N.; J.R. formal analysis, E.S.; P.N.; B.G.; J.R.; investigation, E.S.; B.G.; P.N.; J.R.; A.K. writing—original draft preparation, E.S.; P.N.; B.G.; J.R. writing—review and editing, E.S.; P.N.; B.G.; J.R.; T.O.; A.K. visualization, E.S.; P.N.; supervision, P.N.; B.G.; J.R.; T.O. All authors have read and agreed to the published version of the manuscript.

Funding

This research project was supported by the University of Gdansk supporting young scientists and PhD students (grant No. BMN 539-T050-B465-20) (E.S.).

Conflicts of Interest

The authors declare no conflict of interest.

References

  1. Lewkowicz, A.; Synak, A.; Grobelna, B.; Bojarski, P.; Bogdanowicz, R.; Karczewski, J.; Szczodrowski, K.; Behrendt, M. Thickness and structure change of titanium(IV) oxide thin films synthesized by the sol–gel spin coating method. Opt. Mater. 2014, 36, 1739–1744. [Google Scholar] [CrossRef]
  2. Wang, Y.; Sun, C.; Zhao, X.; Cui, B.; Zeng, Z.; Wang, A.; Liu, G.; Cui, H. The Application of Nano-TiO2 Photo Semiconductors in Agriculture. Nanoscale Res. Lett. 2016, 11, 529. [Google Scholar] [CrossRef] [PubMed] [Green Version]
  3. Lewkowicz, A.; Bojarski, P.; Synak, A.; Grobelna, B.; Akopova, I.; Gryczyński, I.; Kułak, L. Concentration-Dependent Fluorescence Properties of Rhodamine 6G in Titanium Dioxide and Silicon Dioxide Nanolayers. J. Phys. Chem. C 2012, 116, 12304–12311. [Google Scholar] [CrossRef]
  4. Synak, A.; Bojarski, P.; Grobelna, B.; Kułak, L.; Szczepańska, E.; Mońka, M. Concentration—Dependent fluorescence properties of Nile Red in TiO2 based thin films. J. Mol. Liq. 2020, 306. [Google Scholar] [CrossRef]
  5. Mahltig, B.; Böttcher, H.; Rauch, K.; Dieckmann, U.; Nitsche, R.; Fritz, T. Optimized UV protecting coatings by combination of organic and inorganic UV absorbers. Thin Solid Films 2005, 1–2, 108–114. [Google Scholar] [CrossRef]
  6. Liu, S.; Zhang, N.; Tang, Z.-R.; Xu, Y.-J. Synthesis of One-Dimensional CdS@TiO2 Core–Shell Nanocomposites Photocatalyst for Selective Redox: The Dual Role of TiO2 Shell. ACS Appl. Mater. Interfaces 2012, 4, 6378–6385. [Google Scholar] [CrossRef]
  7. Szczepańska, E.; Bielicka-Giełdoń, A.; Niska, K.; Strankowska, J.; Żebrowska, J.; Inkielewicz-Stępniak, I.; Łubkowska, B.; Swebocki, T.; Skowron, P.; Grobelna, B. Synthesis of silver nanoparticles in context of their cytotoxicity, antibacterial activities, skin penetration and application in skincare products. Supramol. Chem. 2020, 32, 207–221. [Google Scholar] [CrossRef]
  8. Synak, A.; Szczepańska, E.; Grobelna, B.; Gondek, J.; Mońka, M.; Gryczynski, I.; Bojarski, P. Photophysical properties and detection of Valrubicin on plasmonic platforms. Dyes Pigment. 2019, 163, 623–627. [Google Scholar] [CrossRef]
  9. Baranowska-Wójcik, E.; Szwajgier, D.; Oleszczuk, P.; Winiarska-Mieczan, A. Effects of Titanium Dioxide Nanoparticles Exposure on Human Health—A Review. Biol. Trace Elem. Res. 2020, 193, 118–129. [Google Scholar] [CrossRef] [Green Version]
  10. Zhang, X.; Niu, H.; Pan, Y.; Shi, Y.; Cai, Y. Modifying the surface of Fe3O4/SiO2 magnetic nanoparticles with C18/NH2 mixed group to get an efficient sorbent for anionic organic pollutants. J. Colloid Interface Sci. 2011, 362, 107–112. [Google Scholar] [CrossRef]
  11. Ta, T.K.H.; Trinh, M.-T.; Long, N.V.; Nguyen, T.T.M.; Nguyen, T.L.T.; Thuoc, T.L.; Phan, B.T.; Mott, D.; Maenosono, S.; Tran-Van, H.; et al. Synthesis and surface functionalization of Fe3O4-SiO2 core-shell nanoparticles with 3-glycidoxypropyltrimethoxysilane and 1,1′-carbonyldiimidazole for bio-applications. Colloids Surf. A Physicochem. Eng. Asp. 2016, 504, 376–383. [Google Scholar] [CrossRef]
  12. Roto, R.; Yusran, Y.; Kuncaka, A. Magnetic adsorbent of Fe3O4@SiO2 core-shell nanoparticles modified with thiol group for chloroauric ion adsorption. Appl. Surf. Sci. 2016, 377, 30–36. [Google Scholar] [CrossRef]
  13. Zhang, S.; Zhang, Y.; Liu, J.; Xu, Q.; Xiao, H.; Wang, X.; Xu, H.; Zhou, J. Thiol modified Fe3O4@SiO2 as a robust, high effective, and recycling magnetic sorbent for mercury removal. Chem. Eng. J. 2013, 226, 30–38. [Google Scholar] [CrossRef] [Green Version]
  14. Marchant, M.J.; Guzmán, L.; Corvalán, A.H.; Kogan, M.J. Gold@Silica Nanoparticles Functionalized with Oligonucleotides: A Prominent Tool for the Detection of the Methylated Reprimo Gene in Gastric Cancer by Dynamic Light Scattering. Nanomaterials 2019, 9, 1333. [Google Scholar] [CrossRef] [Green Version]
  15. Teng, Y.; Jiang, C.; Ruotolo, A.; Pong, P.W.T. Amine-Functionalized Fe2O3–SiO2 Core–Shell Nanoparticles with Tunable Sizes. IEEE Trans. Nanotechnol. 2018, 17, 69–77. [Google Scholar] [CrossRef]
  16. Kulpa, A.; Ryl, J.; Skowierzak, G.; Koterwa, A.; Schroeder, G.; Ossowski, T.; Niedziałkowski, P. Comparison of Cadmium Cd2+ and Lead Pb2+ Binding by Fe2O3@SiO2 -EDTA Nanoparticles—Binding Stability and Kinetic Studies. Electroanalysis 2020, 32, 588–597. [Google Scholar] [CrossRef]
  17. Xu, X.; Sun, Y.; Zhang, Q.; Cai, H.; Li, Q.; Zhou, S. Synthesis and photocatalytic activity of plasmon-enhanced core-shell upconversion luminescent photocatalytic Ag@SiO2@YF3:Ho3+@TiO2 nanocomposites. Opt. Mater. 2019, 94, 444–453. [Google Scholar] [CrossRef]
  18. Liu, H.; Lin, C.; Ma, Z.; Yu, H.; Zhou, S. Gold Nanoparticles on Mesoporous SiO2-Coated Magnetic Fe3O4 Spheres: A Magnetically Separatable Catalyst with Good Thermal Stability. Molecules 2013, 18, 14258–14267. [Google Scholar] [CrossRef]
  19. Cheng, F.; Sajedin, S.M.; Kelly, S.M.; Lee, A.F.; Kornherr, A. UV-stable paper coated with APTES-modified P25 TiO2 nanoparticles. Carbohydr. Polym. 2014, 114, 246–252. [Google Scholar] [CrossRef]
  20. Kulpa, A.; Ryl, J.; Schroeder, G.; Koterwa, A.; Sein Anand, J.; Ossowski, T.; Niedziałkowski, P. Simultaneous voltammetric determination of Cd2+, Pb2+, and Cu2+ ions captured by Fe3O4@SiO2 core-shell nanostructures of various outer amino chain length. J. Mol. Liq. 2020, 314, 113677. [Google Scholar] [CrossRef]
  21. Kyaw, H.H.; Al-Harthi, S.H.; Sellai, A.; Dutta, J. Self-organization of gold nanoparticles on silanated surfaces. Beilstein J. Nanotechnol. 2015, 6, 2345–2353. [Google Scholar] [CrossRef] [PubMed]
  22. Masitas, R.A.; Khachian, I.V.; Bill, B.L.; Zamborini, F.P. Effect of Surface Charge and Electrode Material on the Size-Dependent Oxidation of Surface-Attached Metal Nanoparticles. Langmuir 2014, 30, 13075–13084. [Google Scholar] [CrossRef] [PubMed]
  23. Qin, M.; Hou, S.; Wang, L.; Feng, X.; Wang, R.; Yang, Y.; Wang, C.; Yu, L.; Shao, B.; Qiao, M. Two methods for glass surface modification and their application in protein immobilization. Colloids Surf. B Biointerfaces 2007, 60, 243–249. [Google Scholar] [CrossRef] [PubMed]
  24. Kim, H.; Kwon, J.-Y. Enzyme immobilization on metal oxide semiconductors exploiting amine functionalized layer. RSC Adv. 2017, 7, 19656–19661. [Google Scholar] [CrossRef] [Green Version]
  25. Vashist, S.K.; Lam, E.; Hrapovic, S.; Male, K.B.; Luong, J.H.T. Immobilization of Antibodies and Enzymes on 3-Aminopropyltriethoxysilane-Functionalized Bioanalytical Platforms for Biosensors and Diagnostics. Chem. Rev. 2014, 114, 11083–11130. [Google Scholar] [CrossRef] [Green Version]
  26. Gunda, N.S.K.; Singh, M.; Norman, L.; Kaur, K.; Mitra, S.K. Optimization and characterization of biomolecule immobilization on silicon substrates using (3-aminopropyl)triethoxysilane (APTES) and glutaraldehyde linker. Appl. Surf. Sci. 2014, 305, 522–530. [Google Scholar] [CrossRef]
  27. Son, J.; Kim, J.; Lee, K.; Hwang, J.; Choi, Y.; Seo, Y.; Jeon, H.; Kang, H.C.; Woo, H.-M.; Kang, B.-J.; et al. DNA aptamer immobilized hydroxyapatite for enhancing angiogenesis and bone regeneration. Acta Biomater. 2019, 99, 469–478. [Google Scholar] [CrossRef]
  28. Ruiz-Cañas, M.C.; Corredor, L.M.; Quintero, H.I.; Manrique, E.; Romero Bohórquez, A.R. Morphological and Structural Properties of Amino-Functionalized Fumed Nanosilica and Its Comparison with Nanoparticles Obtained by Modified Stöber Method. Molecules 2020, 25, 2868. [Google Scholar] [CrossRef]
  29. Howarter, J.A.; Youngblood, J.P. Optimization of Silica Silanization by 3-Aminopropyltriethoxysilane. Langmuir 2006, 22, 11142–11147. [Google Scholar] [CrossRef]
  30. Yamaura, M.; Camilo, R.L.; Sampaio, L.C.; Macêdo, M.A.; Nakamura, M.; Toma, H.E. Preparation and characterization of (3-aminopropyl)triethoxysilane-coated magnetite nanoparticles. J. Magn. Magn. Mater. 2004, 279, 210–217. [Google Scholar] [CrossRef]
  31. Asenath Smith, E.; Chen, W. How To Prevent the Loss of Surface Functionality Derived from Aminosilanes. Langmuir 2008, 24, 12405–12409. [Google Scholar] [CrossRef] [PubMed] [Green Version]
  32. Jung, H.-S.; Moon, D.-S.; Lee, J.-K. Quantitative Analysis and Efficient Surface Modification of Silica Nanoparticles. Available online: https://www.hindawi.com/journals/jnm/2012/593471/ (accessed on 3 July 2020).
  33. Kralj, S.; Drofenik, M.; Makovec, D. Controlled surface functionalization of silica-coated magnetic nanoparticles with terminal amino and carboxyl groups. J. Nanopart. Res. 2011, 13, 2829–2841. [Google Scholar] [CrossRef]
  34. Kunc, F.; Balhara, V.; Brinkmann, A.; Sun, Y.; Leek, D.M.; Johnston, L.J. Quantification and Stability Determination of Surface Amine Groups on Silica Nanoparticles Using Solution NMR. Anal. Chem. 2018, 90, 13322–13330. [Google Scholar] [CrossRef] [PubMed]
  35. Čampelj, S.; Makovec, D.; Drofenik, M. Functionalization of magnetic nanoparticles with 3-aminopropyl silane. J. Magn. Magn. Mater. 2009, 321, 1346–1350. [Google Scholar] [CrossRef]
  36. Morozov, R.; Avdin, V.; Krivtsov, I.; Gorshkov, A.; Urzhumova, A.; Osinskaya, A.; Yuzhalkin, D. Modification with Amino Groups of Composite SiO2–TiO2 and Pure TiO2 Spheres Prepared via the Peroxo Route. Chem 2018, 10, 24–36. [Google Scholar] [CrossRef] [Green Version]
  37. Torelli, M.D.; Putans, R.A.; Tan, Y.; Lohse, S.E.; Murphy, C.J.; Hamers, R.J. Quantitative Determination of Ligand Densities on Nanomaterials by X-ray Photoelectron Spectroscopy. ACS Appl. Mater. Interfaces 2015, 7, 1720–1725. [Google Scholar] [CrossRef]
  38. Hennig, A.; Borcherding, H.; Jaeger, C.; Hatami, S.; Würth, C.; Hoffmann, A.; Hoffmann, K.; Thiele, T.; Schedler, U.; Resch-Genger, U. Scope and Limitations of Surface Functional Group Quantification Methods: Exploratory Study with Poly(acrylic acid)-Grafted Micro- and Nanoparticles. J. Am. Chem. Soc. 2012, 134, 8268–8276. [Google Scholar] [CrossRef]
  39. Li, W.; Zhao, D. Extension of the Stöber Method to Construct Mesoporous SiO2 and TiO2 Shells for Uniform Multifunctional Core–Shell Structures. Adv. Mater. 2013, 25, 142–149. [Google Scholar] [CrossRef]
  40. Yuenyongsuwan, J.; Nithiyakorn, N.; Sabkird, P.; O’Rear, E.A.; Pongprayoon, T. Surfactant effect on phase-controlled synthesis and photocatalyst property of TiO2 nanoparticles. Mater. Chem. Phys. 2018, 214, 330–336. [Google Scholar] [CrossRef]
  41. Stöber, W.; Fink, A.; Bohn, E. Controlled growth of monodisperse silica spheres in the micron size range. J. Colloid Interface Sci. 1968, 26, 62–69. [Google Scholar] [CrossRef]
  42. Nozawa, K.; Gailhanou, H.; Raison, L.; Panizza, P.; Ushiki, H.; Sellier, E.; Delville, J.P.; Delville, M.H. Smart Control of Monodisperse Stöber Silica Particles: Effect of Reactant Addition Rate on Growth Process. Langmuir 2005, 21, 1516–1523. [Google Scholar] [CrossRef] [PubMed]
  43. Kang, J.; Li, Y.; Chen, Y.; Wang, A.; Yue, B.; Qu, Y.; Zhao, Y.; Chu, H. Core–shell Ag@SiO2 nanoparticles of different silica shell thicknesses: Preparation and their effects on photoluminescence of lanthanide complexes. Mater. Res. Bull. 2015, 71, 116–121. [Google Scholar] [CrossRef]
  44. Kamarudin, N.H.N.; Jalil, A.A.; Triwahyono, S.; Salleh, N.F.M.; Karim, A.H.; Mukti, R.R.; Hameed, B.H.; Ahmad, A. Role of 3-aminopropyltriethoxysilane in the preparation of mesoporous silica nanoparticles for ibuprofen delivery: Effect on physicochemical properties. Microporous Mesoporous Mater. 2013, 180, 235–241. [Google Scholar] [CrossRef]
  45. Thorkild, C. A qualitative test for monitoring coupling completeness in solid phase peptide synthesis using chloranil. Acta Chem. Scand. B 1979, 33, 763–766. [Google Scholar] [CrossRef]
  46. Jia, C.; Qi, W.; He, Z.; Yang, H.; Qiao, B. Synthesis of heptapeptides and analysis of sequence by tandem ion trap mass spectrometry. Cent. Eur. J. Chem. 2006, 4, 285–298. [Google Scholar] [CrossRef]
  47. Czupryniak, J.; Niedziałkowski, P.; Karbarz, M.; Ossowski, T.; Stojek, Z. Lysine and Arginine Oligopeptides Tagged with Anthraquinone: Electrochemical Properties. Electroanalysis 2012, 24, 975–982. [Google Scholar] [CrossRef]
  48. Ullah, S.; Ferreira-Neto, E.P.; Pasa, A.A.; Alcântara, C.C.J.; Acuña, J.J.S.; Bilmes, S.A.; Martínez Ricci, M.L.; Landers, R.; Fermino, T.Z.; Rodrigues-Filho, U.P. Enhanced photocatalytic properties of core@shell SiO2@TiO2 nanoparticles. Appl. Catal. B Environ. 2015, 179, 333–343. [Google Scholar] [CrossRef]
  49. Bai, Y.; Li, Z.; Cheng, B.; Zhang, M.; Su, K. Higher UV-shielding ability and lower photocatalytic activity of TiO2@SiO2/APTES and its excellent performance in enhancing the photostability of poly(p-phenylene sulfide). RSC Adv. 2017, 7, 21758–21767. [Google Scholar] [CrossRef] [Green Version]
  50. Panwar, K.; Jassal, M.; Agrawal, A.K. TiO2–SiO2 Janus particles with highly enhanced photocatalytic activity. RSC Adv. 2016, 6, 92754–92764. [Google Scholar] [CrossRef]
  51. León, A.; Reuquen, P.; Garín, C.; Segura, R.; Vargas, P.; Zapata, P.; Orihuela, P.A. FTIR and Raman Characterization of TiO2 Nanoparticles Coated with Polyethylene Glycol as Carrier for 2-Methoxyestradiol. Appl. Sci. 2017, 7, 49. [Google Scholar] [CrossRef]
  52. Huang, C.; Bai, H.; Huang, Y.; Liu, S.; Yen, S.; Tseng, Y. Synthesis of Neutral/Hydrosol and Its Application as Antireflective Self-Cleaning Thin Film. Int. J. Photoenergy 2012, 2012, 1–8. [Google Scholar] [CrossRef] [Green Version]
  53. Fatimah, I.; Prakoso, N.I.; Sahroni, I.; Musawwa, M.M.; Sim, Y.-L.; Kooli, F.; Muraza, O. Physicochemical characteristics and photocatalytic performance of TiO2/SiO2 catalyst synthesized using biogenic silica from bamboo leaves. Heliyon 2019, 5, e02766. [Google Scholar] [CrossRef] [PubMed]
  54. Li, S.; Ma, W.; Zhou, Y.; Chen, X.; Ma, M.; Xu, Y.; Ding, Z.; Wu, X. 3-aminopropyltriethoxysilanes Modified Porous Silicon as a Voltammetric Sensor for Determination of Silver Ion. Int. J. Electrochem. Sci. 2013, 8, 12. [Google Scholar]
  55. Pretsch, E.; Bühlmann, P.; Badertscher, M. Structure Determination of Organic Compounds; Springer: Berlin/Heidelberg, Germany, 2009; ISBN 978-3-540-93809-5. [Google Scholar]
  56. Zhao, J.; Milanova, M.; Warmoeskerken, M.; Dutschk, V. Surface modification of TiO2 nanoparticles with silane coupling agents. Colloid Surf. A 2012, 413, 273–279. [Google Scholar] [CrossRef]
  57. Abad, J.; Gonzalez, C.; de Andres, P.L.; Roman, E. Characterization of thin silicon overlayers on rutileTiO2(110)−(1×1). Phys. Rev. B 2010, 82, 165420. [Google Scholar] [CrossRef] [Green Version]
  58. Ondračka, P.; Nečas, D.; Carette, M.; Elisabeth, S.; Holec, D.; Granier, A.; Goullet, A.; Zajíčková, L.; Richard-Plouet, M. Unravelling local environments in mixed TiO2–SiO2 thin films by XPS and ab initio calculations. Appl. Surf. Sci. 2020, 510, 145056. [Google Scholar] [CrossRef]
  59. Barr, T.L.; Seal, S. Nature of the use of adventitious carbon as a binding energy standard. J. Vac. Sci. Technol. A 1995, 13, 1239–1246. [Google Scholar] [CrossRef]
  60. Önneby, C.; Pantano, C.G. Silicon oxycarbide formation on SiC surfaces and at the SiC/SiO2 interface. J. Vac. Sci. Technol. A 1997, 15, 1597–1602. [Google Scholar] [CrossRef]
  61. Kaur, A.; Chahal, P.; Hogan, T. Selective Fabrication of SiC/Si Diodes by Excimer Laser Under Ambient Conditions. IEEE Electron Device Lett. 2016, 37, 142–145. [Google Scholar] [CrossRef]
  62. Niedziałkowski, P.; Bogdanowicz, R.; Zięba, P.; Wysocka, J.; Ryl, J.; Sobaszek, M.; Ossowski, T. Melamine-modified Boron-doped Diamond towards Enhanced Detection of Adenine, Guanine and Caffeine. Electroanalysis 2016, 28, 211–221. [Google Scholar] [CrossRef]
  63. Bogdanowicz, R.; Sawczak, M.; Niedzialkowski, P.; Zieba, P.; Finke, B.; Ryl, J.; Karczewski, J.; Ossowski, T. Novel Functionalization of Boron-Doped Diamond by Microwave Pulsed-Plasma Polymerized Allylamine Film. J. Phys. Chem. C 2014, 118, 8014–8025. [Google Scholar] [CrossRef]
  64. Calborean, A.; Martin, F.; Marconi, D.; Turcu, R.; Kacso, I.E.; Buimaga-Iarinca, L.; Graur, F.; Turcu, I. Adsorption mechanisms of L-Glutathione on Au and controlled nano-patterning through Dip Pen Nanolithography. Mater. Sci. Eng. C Mater. Biol. Appl. 2015, 57, 171–180. [Google Scholar] [CrossRef] [PubMed]
  65. Wysocka, J.; Cieślik, M.; Krakowiak, S.; Ryl, J. Carboxylic acids as efficient corrosion inhibitors of aluminium alloys in alkaline media. Electrochim. Acta 2018, 289, 175–192. [Google Scholar] [CrossRef]
  66. Zinieris, N.; Leondiadis, L.; Ferderigos, N. Nα-Fmoc Removal from Resin-Bound Amino Acids by 5% Piperidine Solution. J. Comb. Chem. 2005, 7, 4–6. [Google Scholar] [CrossRef] [PubMed]
  67. Behrendt, R.; White, P.; Offer, J. Advances in Fmoc solid-phase peptide synthesis. J. Pept. Sci. 2016, 22, 4–27. [Google Scholar] [CrossRef] [Green Version]
  68. Luna, O.F.; Gomez, J.; Cárdenas, C.; Albericio, F.; Marshall, S.H.; Guzmán, F. Deprotection Reagents in Fmoc Solid Phase Peptide Synthesis: Moving Away from Piperidine? Molecules 2016, 21, 1542. [Google Scholar] [CrossRef]
  69. Vergel Galeano, C.F.; Rivera Monroy, Z.J.; Rosas Pérez, J.E.; García Castañeda, J.E. Efficient Synthesis of Peptides with 4-Methylpiperidine as Fmoc Removal Reagent by Solid Phase Synthesis. J. Mex. Chem. Soc. 2014, 58, 386–392. [Google Scholar]
  70. Meienhofer, J.; Waki, M.; Heimre, E.P.; Lambros, T.J.; Makofske, R.C.; Chang, C.-D. Solid Phase Synthesis Without Repetitive Acidolysis. Int. J. Pept. Protein Res. 1979, 13, 35–42. [Google Scholar] [CrossRef]
  71. Seebach, D.; Schreiber, J.V.; Abele, S.; Daura, X.; van Gunsteren, W.F. Structure and Conformation of β-Oligopeptide Derivatives with Simple Proteinogenic Side Chains: Circular Dichroism and Molecular Dynamics Investigations. Helv. Chim. Acta 2000, 83, 34–57. [Google Scholar] [CrossRef]
  72. Zarra, R.; Montesarchio, D.; Coppola, C.; Bifulco, G.; Di Micco, S.; Izzo, I.; De Riccardis, F. Design, Synthesis, and Hybridisation of Water-Soluble, Peptoid Nucleic Acid Oligomers Tagged with Thymine. Eur. J. Org. Chem. 2009, 2009, 6113–6120. [Google Scholar] [CrossRef]
  73. Carbajo, D.; El-Faham, A.; Royo, M.; Albericio, F. Optimized Stepwise Synthesis of the API Liraglutide Using BAL Resin and Pseudoprolines. ACS Omega 2019, 4, 8674–8680. [Google Scholar] [CrossRef] [Green Version]
  74. Ziegler, T.; Schips, C. An efficient Mitsunobu protocol for the one-pot synthesis of S -glycosyl amino-acid building blocks and their use in combinatorial spot synthesis of glycopeptide libraries. Nat. Protoc. 2006, 1, 1987–1994. [Google Scholar] [CrossRef] [PubMed]
  75. Friligou, I.; Papadimitriou, E.; Gatos, D.; Matsoukas, J.; Tselios, T. Microwave-assisted solid-phase peptide synthesis of the 60–110 domain of human pleiotrophin on 2-chlorotrityl resin. Amino Acids 2011, 40, 1431–1440. [Google Scholar] [CrossRef] [PubMed]
  76. Eissler, S.; Kley, M.; Bächle, D.; Loidl, G.; Meier, T.; Samson, D. Substitution determination of Fmoc-substituted resins at different wavelengths: Substitution Determination of Fmoc-substituted Resins. J. Pept. Sci. 2017, 23, 757–762. [Google Scholar] [CrossRef]
Sample Availability: Not available.
Figure 1. Chloranil test performed for (A) TiO2@SiO2 and (B) TiO2@SiO2–(CH2)3–NH2. The microscopic magnification for core-shell TiO2@SiO2 nanostructures (a) before and (b) after chloranil test and for TiO2@SiO2–(CH2)3–NH2 NPs (c) before and (d) after chloranil test.
Molecules 25 03983 g001
Scheme 1. Synthesis of TiO2@SiO2 with (3-aminopropyl)trimethoxysilane (APTMS), Fmoc–Gly–OH and cleavage by piperidine in 20% (v/v) solution in DMF.
Molecules 25 03983 sch001
Figure 2. Scanning electron microscopy (SEM) images of (a) TiO2, (b) TiO2@SiO2, (c) TiO2@SiO2–(CH2)3–NH2 and (d) TiO2@SiO2–(CH2)3–NH–Gly–Fmoc.
Molecules 25 03983 g002
Figure 3. Transmission electron microscopy (TEM) images of (a) TiO2, (b) TiO2@SiO2 and (c) TiO2@SiO2–(CH2)3–NH2.
Molecules 25 03983 g003
Figure 4. Fourier-transform infrared spectra of (a) TiO2, TiO2@SiO2 and (b) TiO2@SiO2–(CH2)3–NH2, TiO2@SiO2–(CH2)3–NH–Gly–Fmoc.
Molecules 25 03983 g004
Figure 5. Thermogravimetric (TG) and thermogravimetric derivative (DTG) curves for TiO2, TiO2@SiO2 and TiO2@SiO2–(CH2)3–NH2.
Molecules 25 03983 g005
Figure 6. High-resolution XPS spectra for (a) Si2p, (b) O1s and (c) N1s recorded for each studied surface-modification and encapsulation step of TiO2@SiO2, together with the proposed deconvolution procedure.
Molecules 25 03983 g006
Scheme 2. Mechanism of Fmoc group removal from solid support and formation of dibenzofulvene–piperidine adduct in the presence of piperidine.
Molecules 25 03983 sch002
Figure 7. Absorption spectra with the concentrations in mol/dm3 of (a) TiO2@SiO2–(CH2)3–NH–Gly–Fmoc, (b) Fmoc–Gly–OH used as the model sample.
Molecules 25 03983 g007
Table 1. Distribution of Si, N, O and Ti chemical states, based on the Si2p, N1s, O1s and Ti2p high-resolution XPS spectral analyses with the proposed deconvolution model for each studied TiO2@SiO2 nanoparticle functionalization step.
BE/eVTiO2@SiO2TiO2@SiO2–(CH2)3–NH2TiO2@SiO2–(CH2)3–NH–Gly–Fmoc
Si2pSiO2102.127
Si–O–C101.625.725.1
O1sC–O, H2O533.17.25.46.4
SiO2, C=O531.641.835.238.8
SiO2–TiO2530.216.712.29.2
TiO2528.84.52.71.1
N1sN–C398.512.112.7
N=C400.35.86.7
Ti2pTiO2459.22.80.9
Table 2. The absorbance maxima for TiO2@SiO2–(CH2)3–NH–Gly–Fmoc and Fmoc–Gly–OH at 289 nm and 301 nm.
SampleTiO2@SiO2–(CH2)3–NH–Gly–FmocFmoc–Gly–OH
m (mg)A@289 nmA@301 nmm (mg)A@289 nmA@301 nm
(1)2.060.0250.0480.251.151.49
(2)2.060.0240.0470.170.811.03
(3)2.080.0250.0440.110.570.74
Table 3. Loading of Fmoc group (Z) for and Fmoc–Gly–OH calculated for 4 samples using a different value of molar absorption coefficient (ε).
TiO2@SiO2–(CH2)3–NH–Gly–FmocFmoc–Gly–OH
ε
(dm3 × mol−1 × cm−1)
Z@289 nm (µmol/g)Z@ 301 nm (µmol/g)Z@289 nm (mmol/g)Z@ 301 nm (mmol/g)
58006.3; 6.0; 6.22.38; 2.46; 2.68
78009.0;8.8;8.12.29; 2.33; 2.58
60896.0; 5.7; 5.92.27; 2.35; 2.55
80218.7; 8.5; 7.92.23; 2.27; 2.52

