
NIR Absorbing AzaBODIPY Dyes for pH Sensing


Abstract
1. Introduction
2. Results
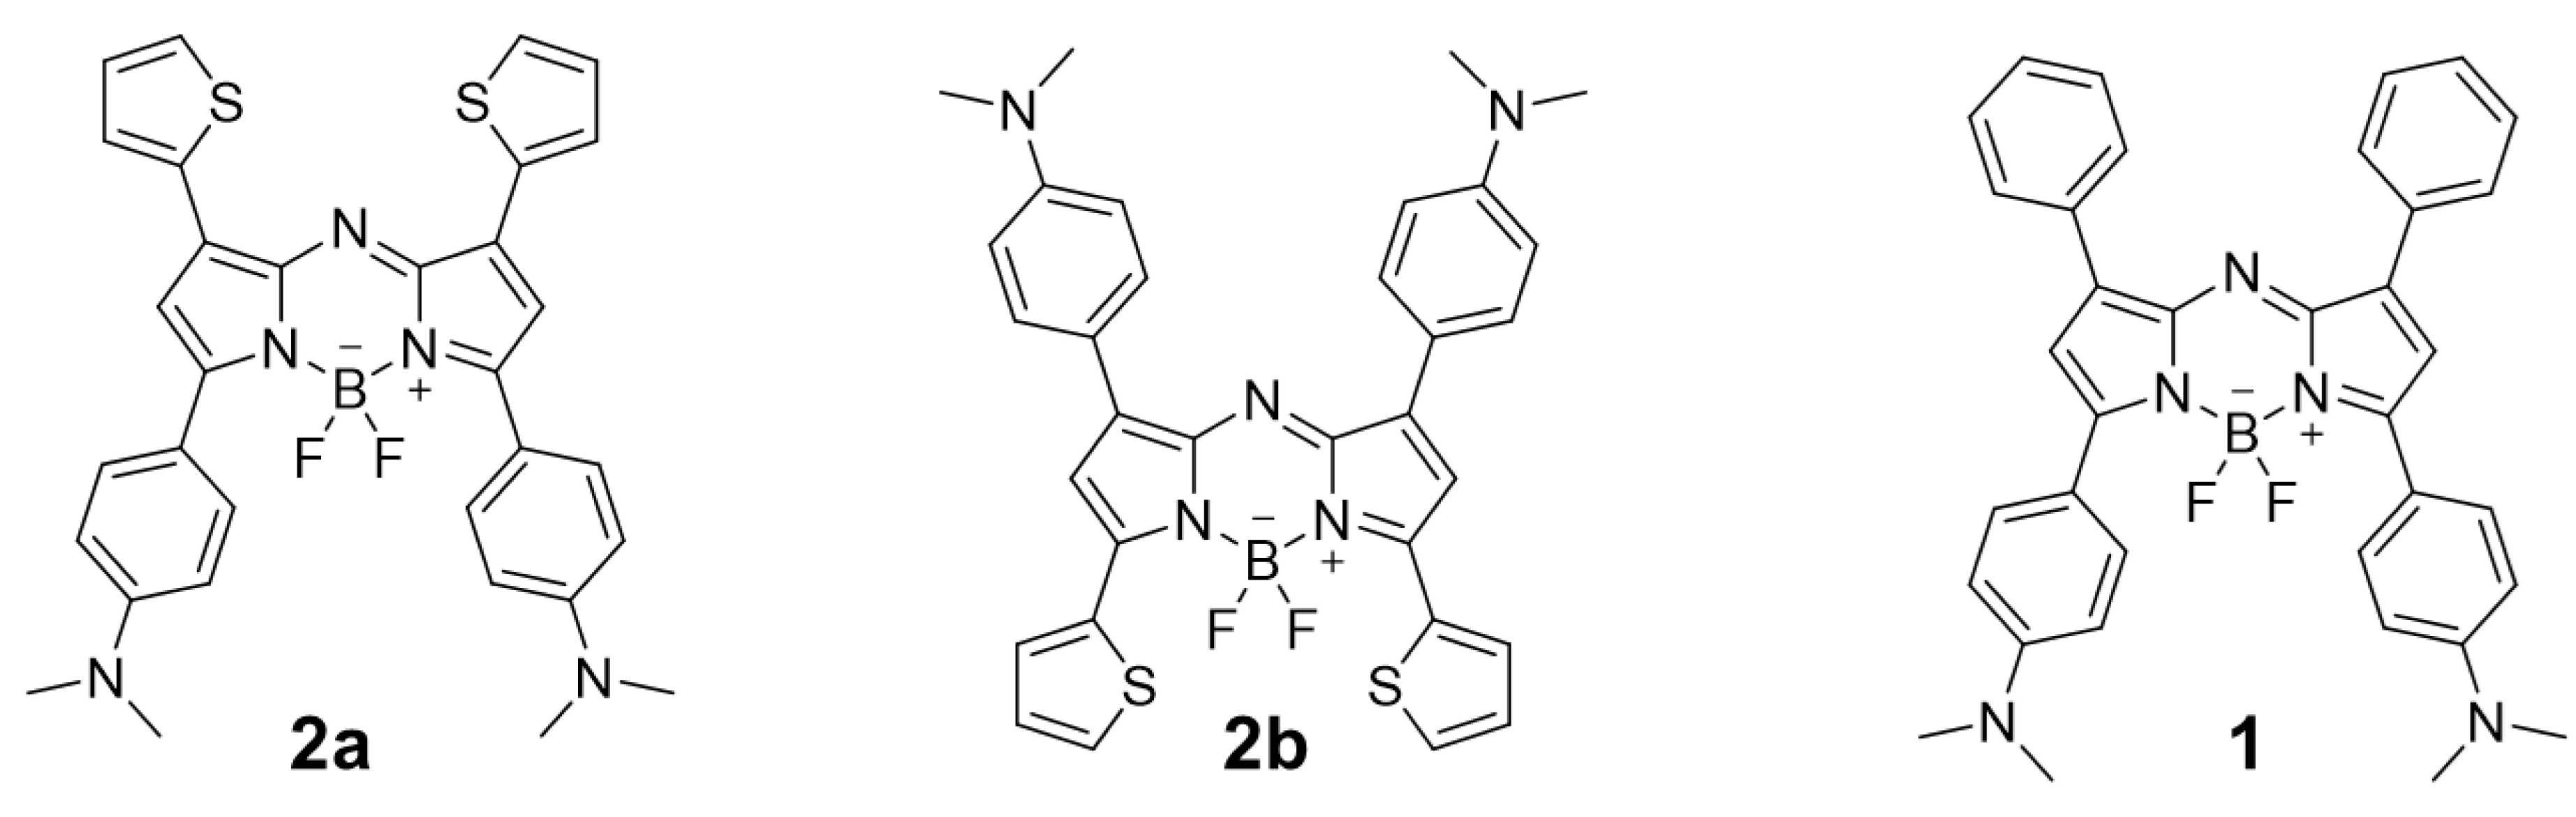
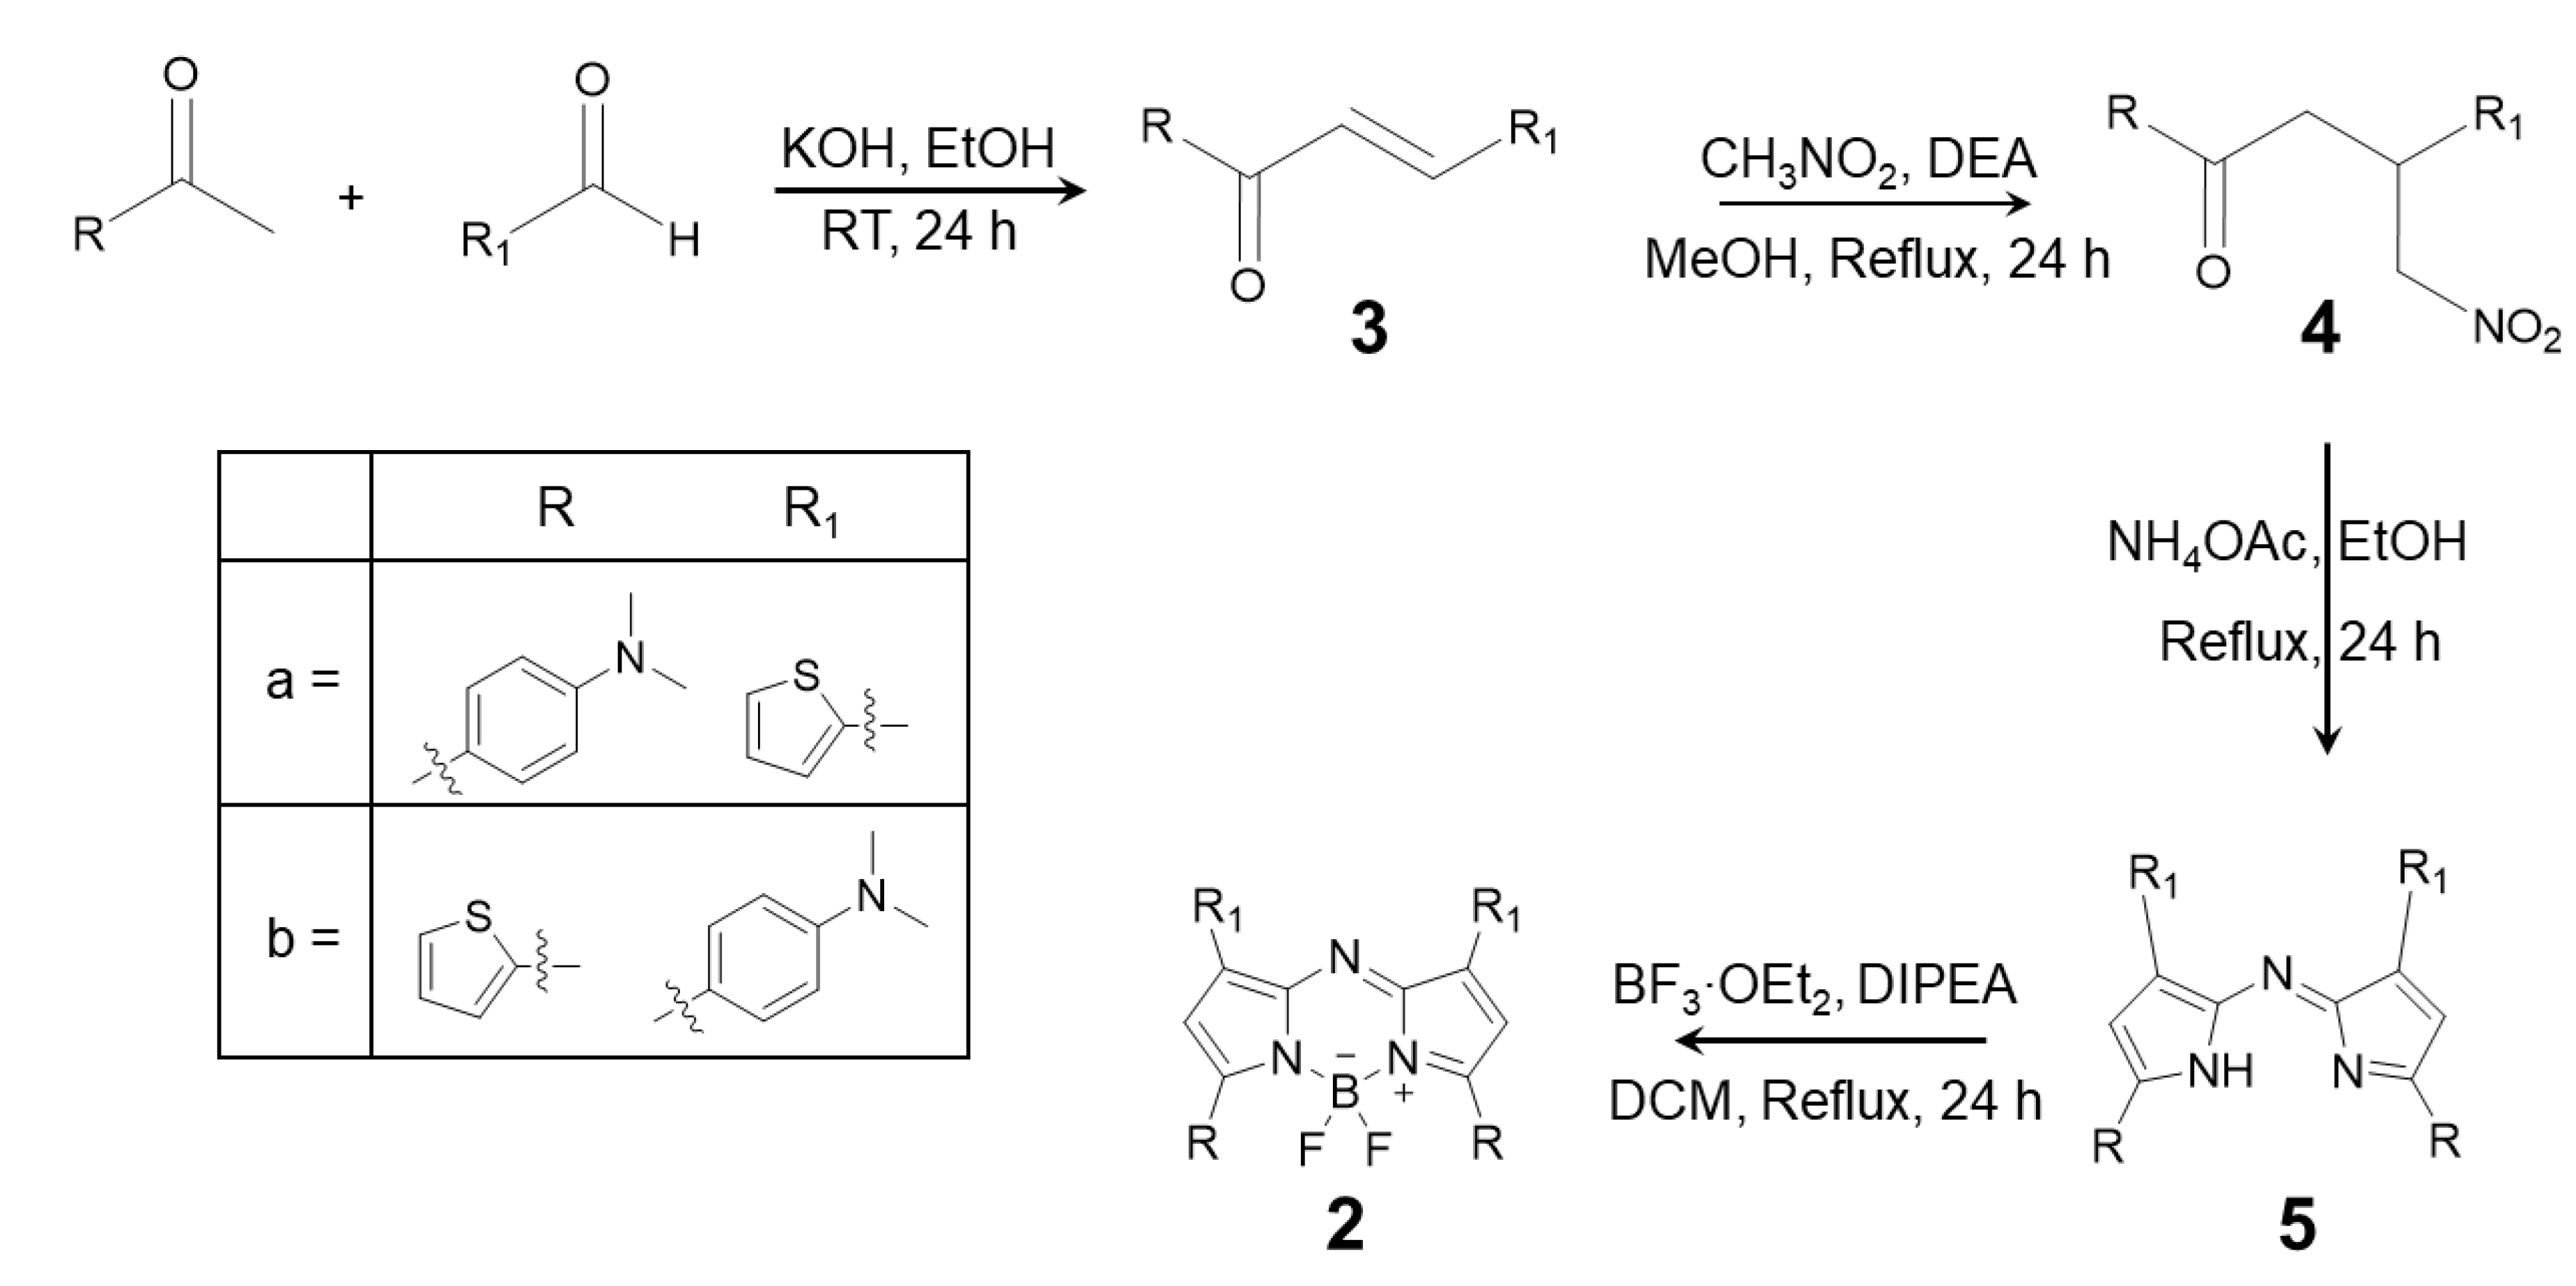
2.1. Synthesis
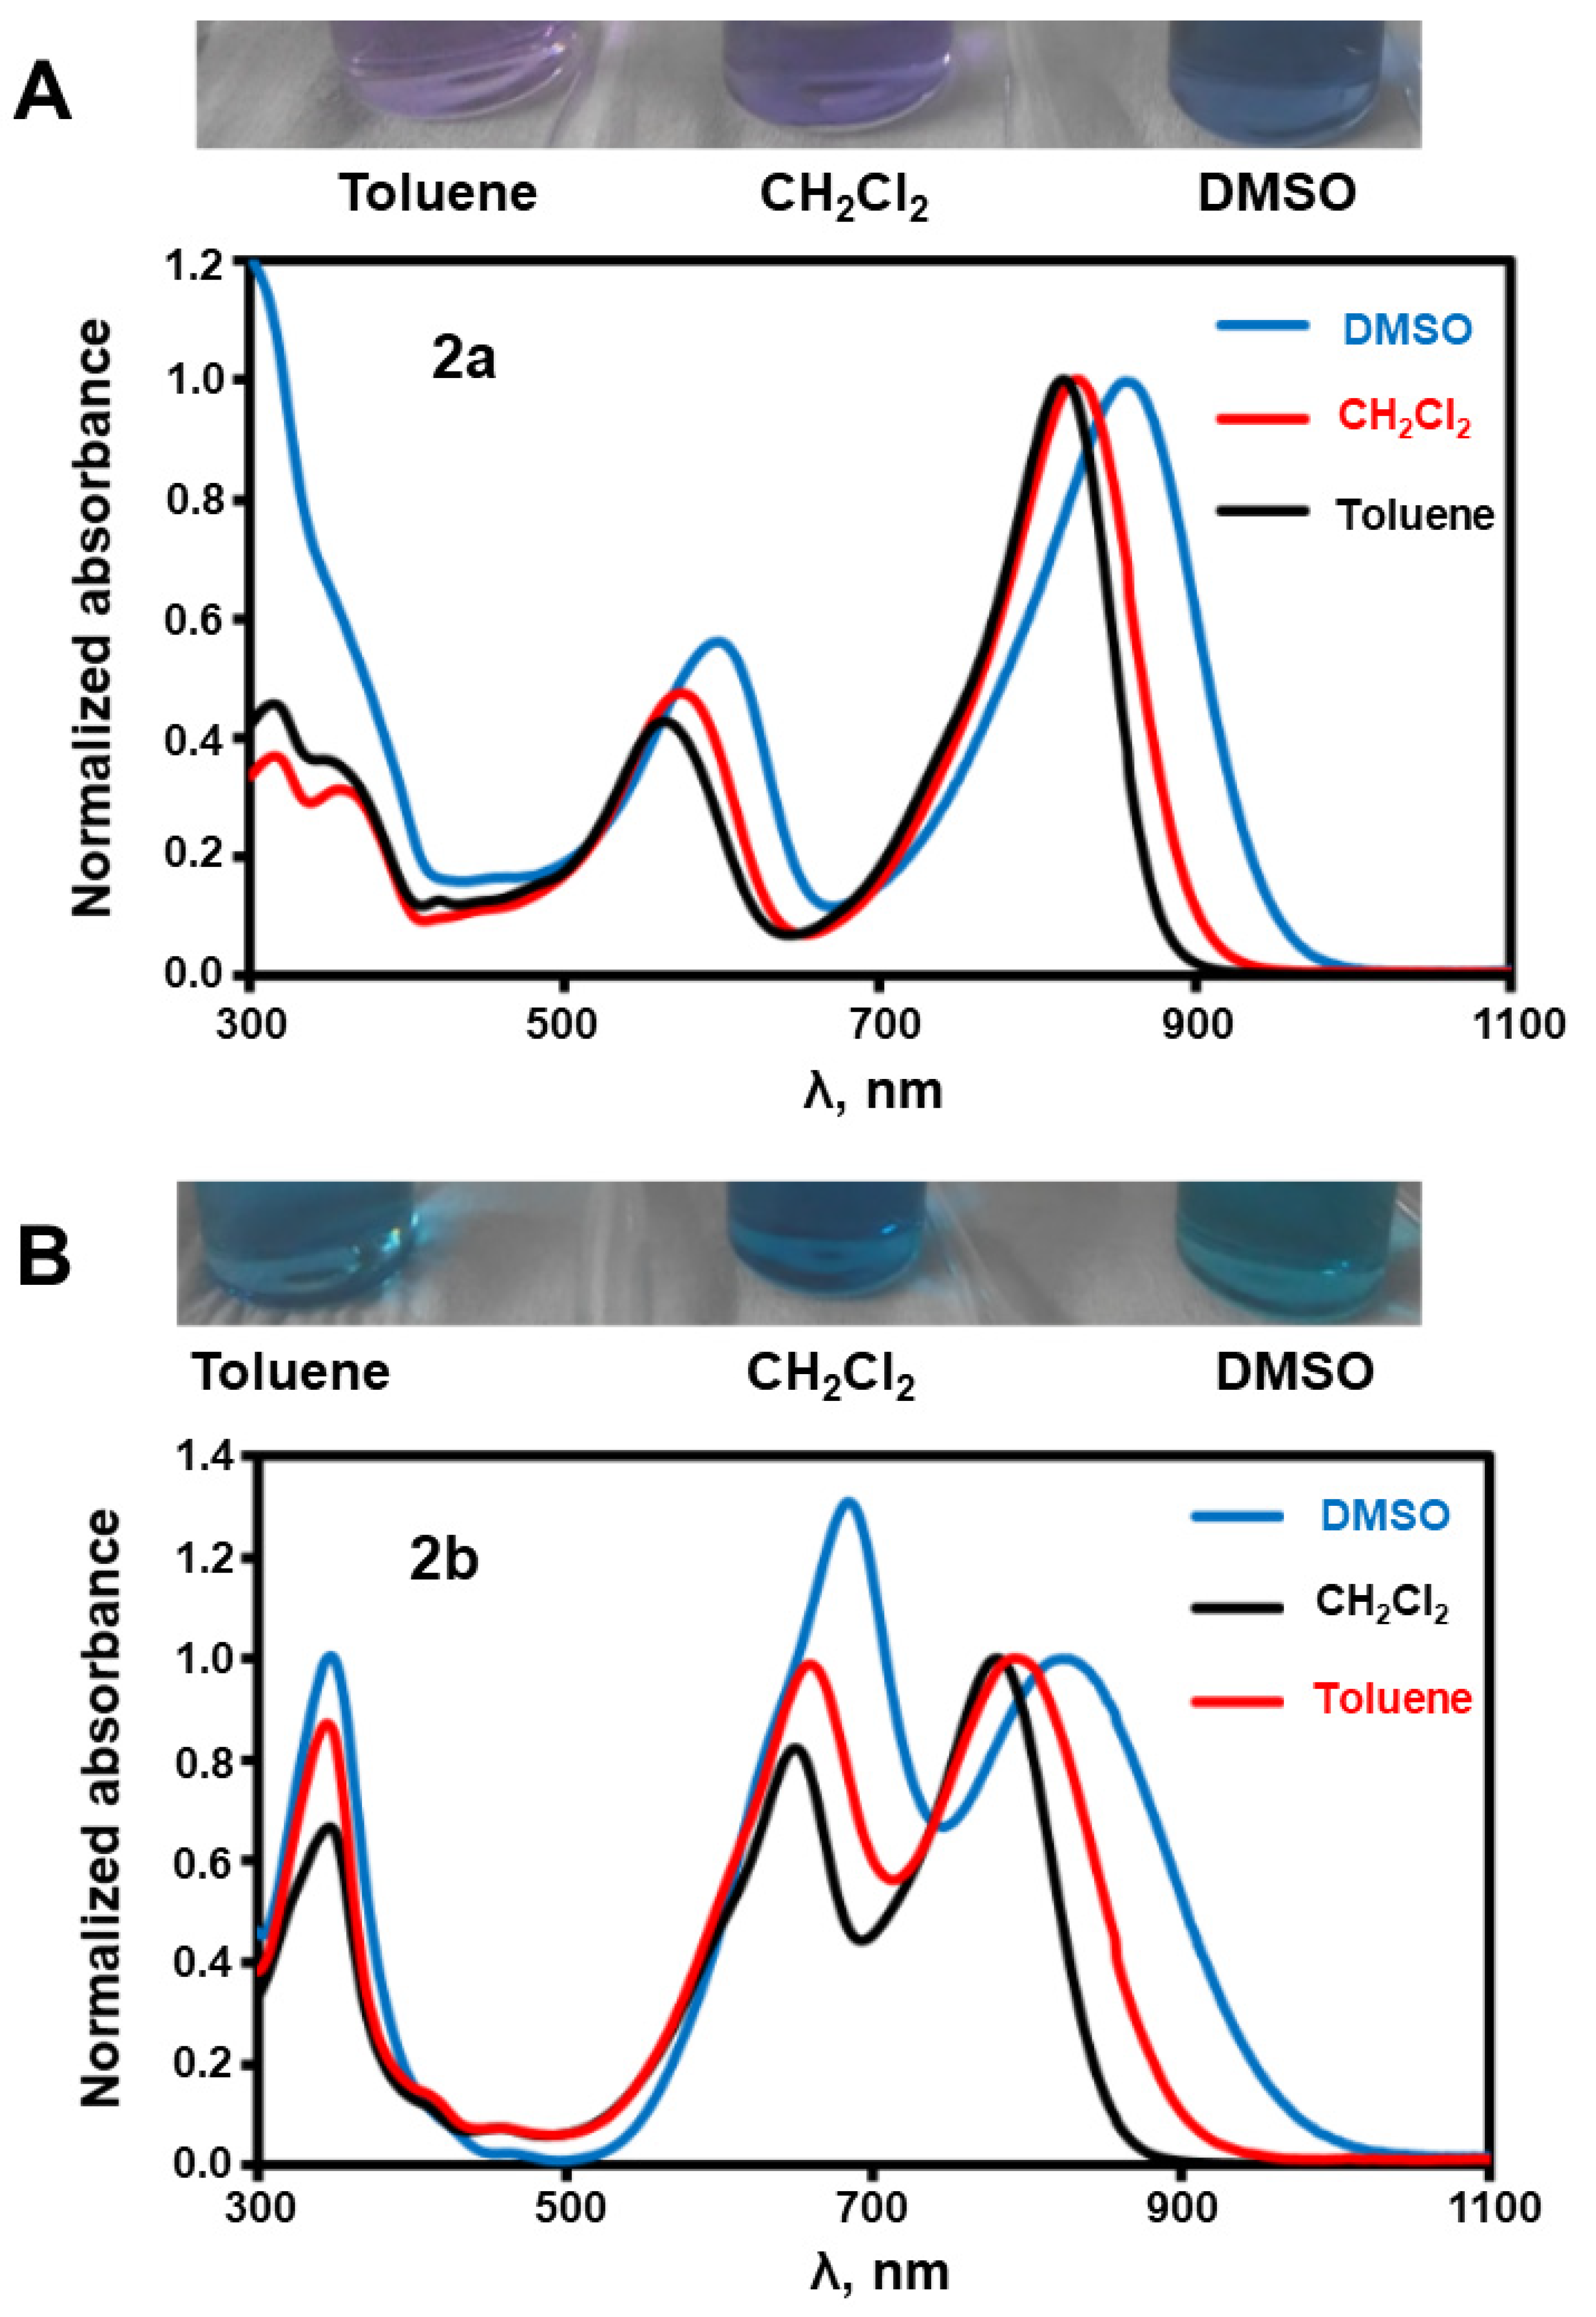
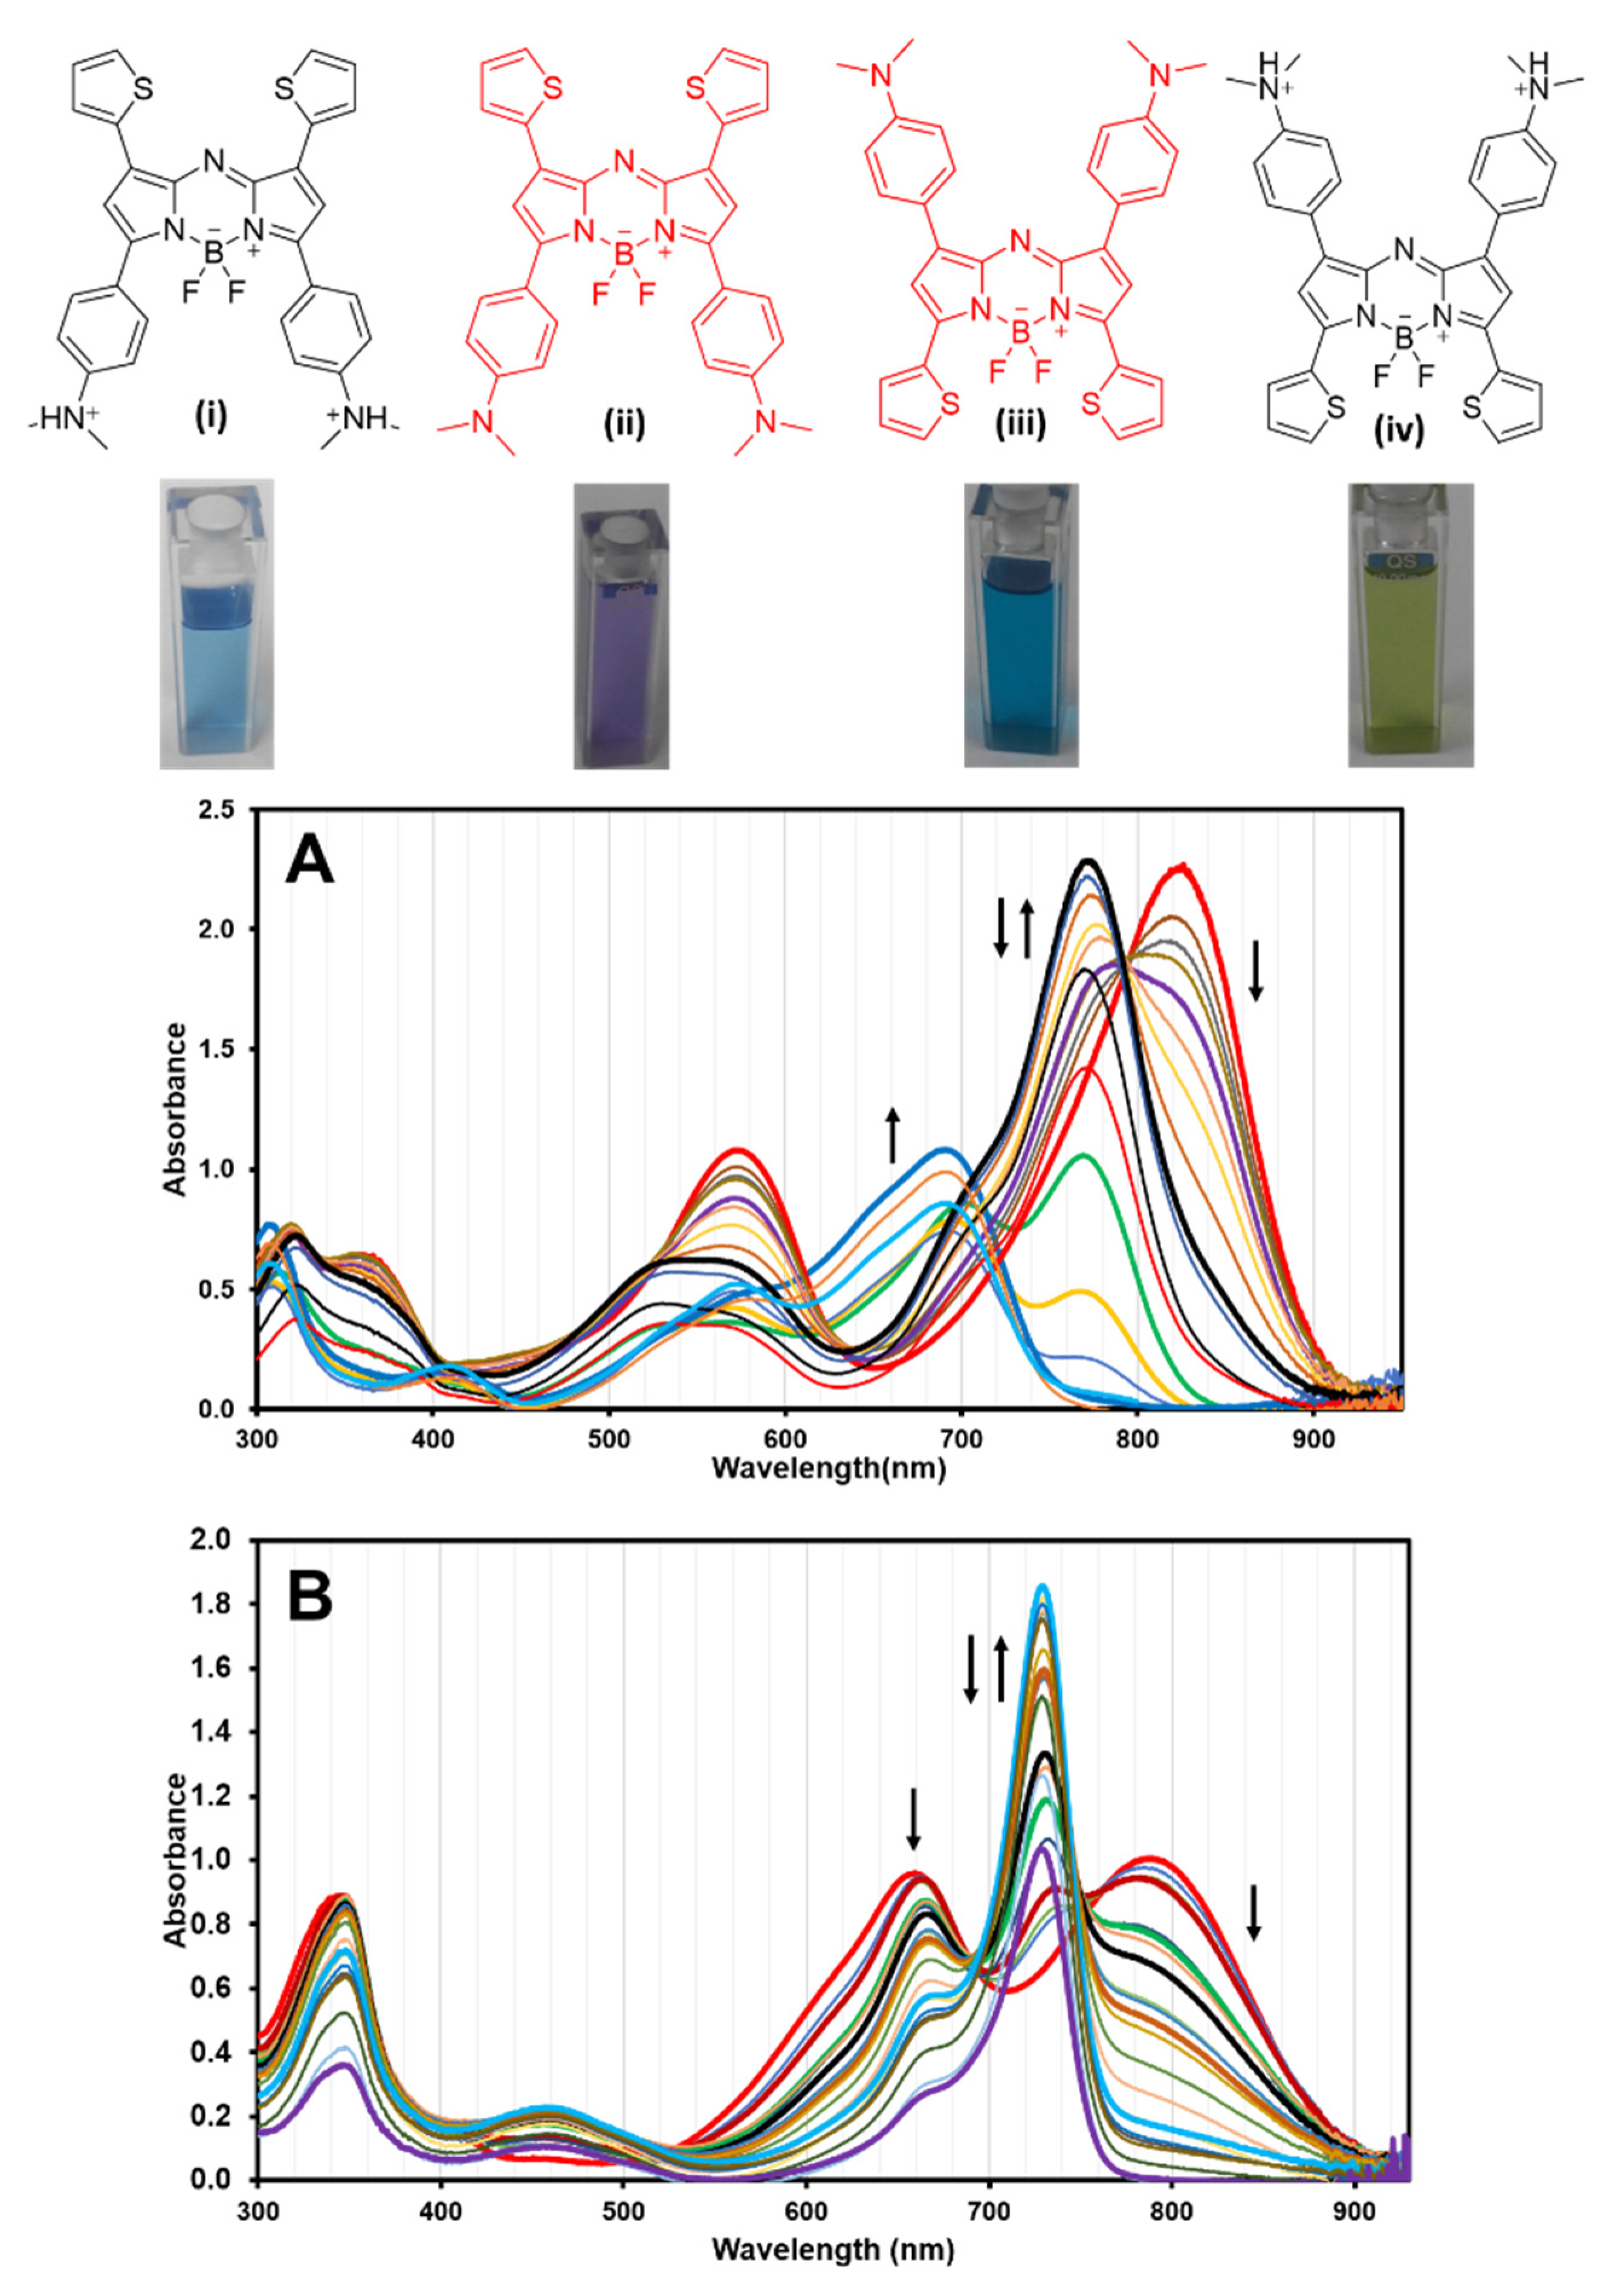
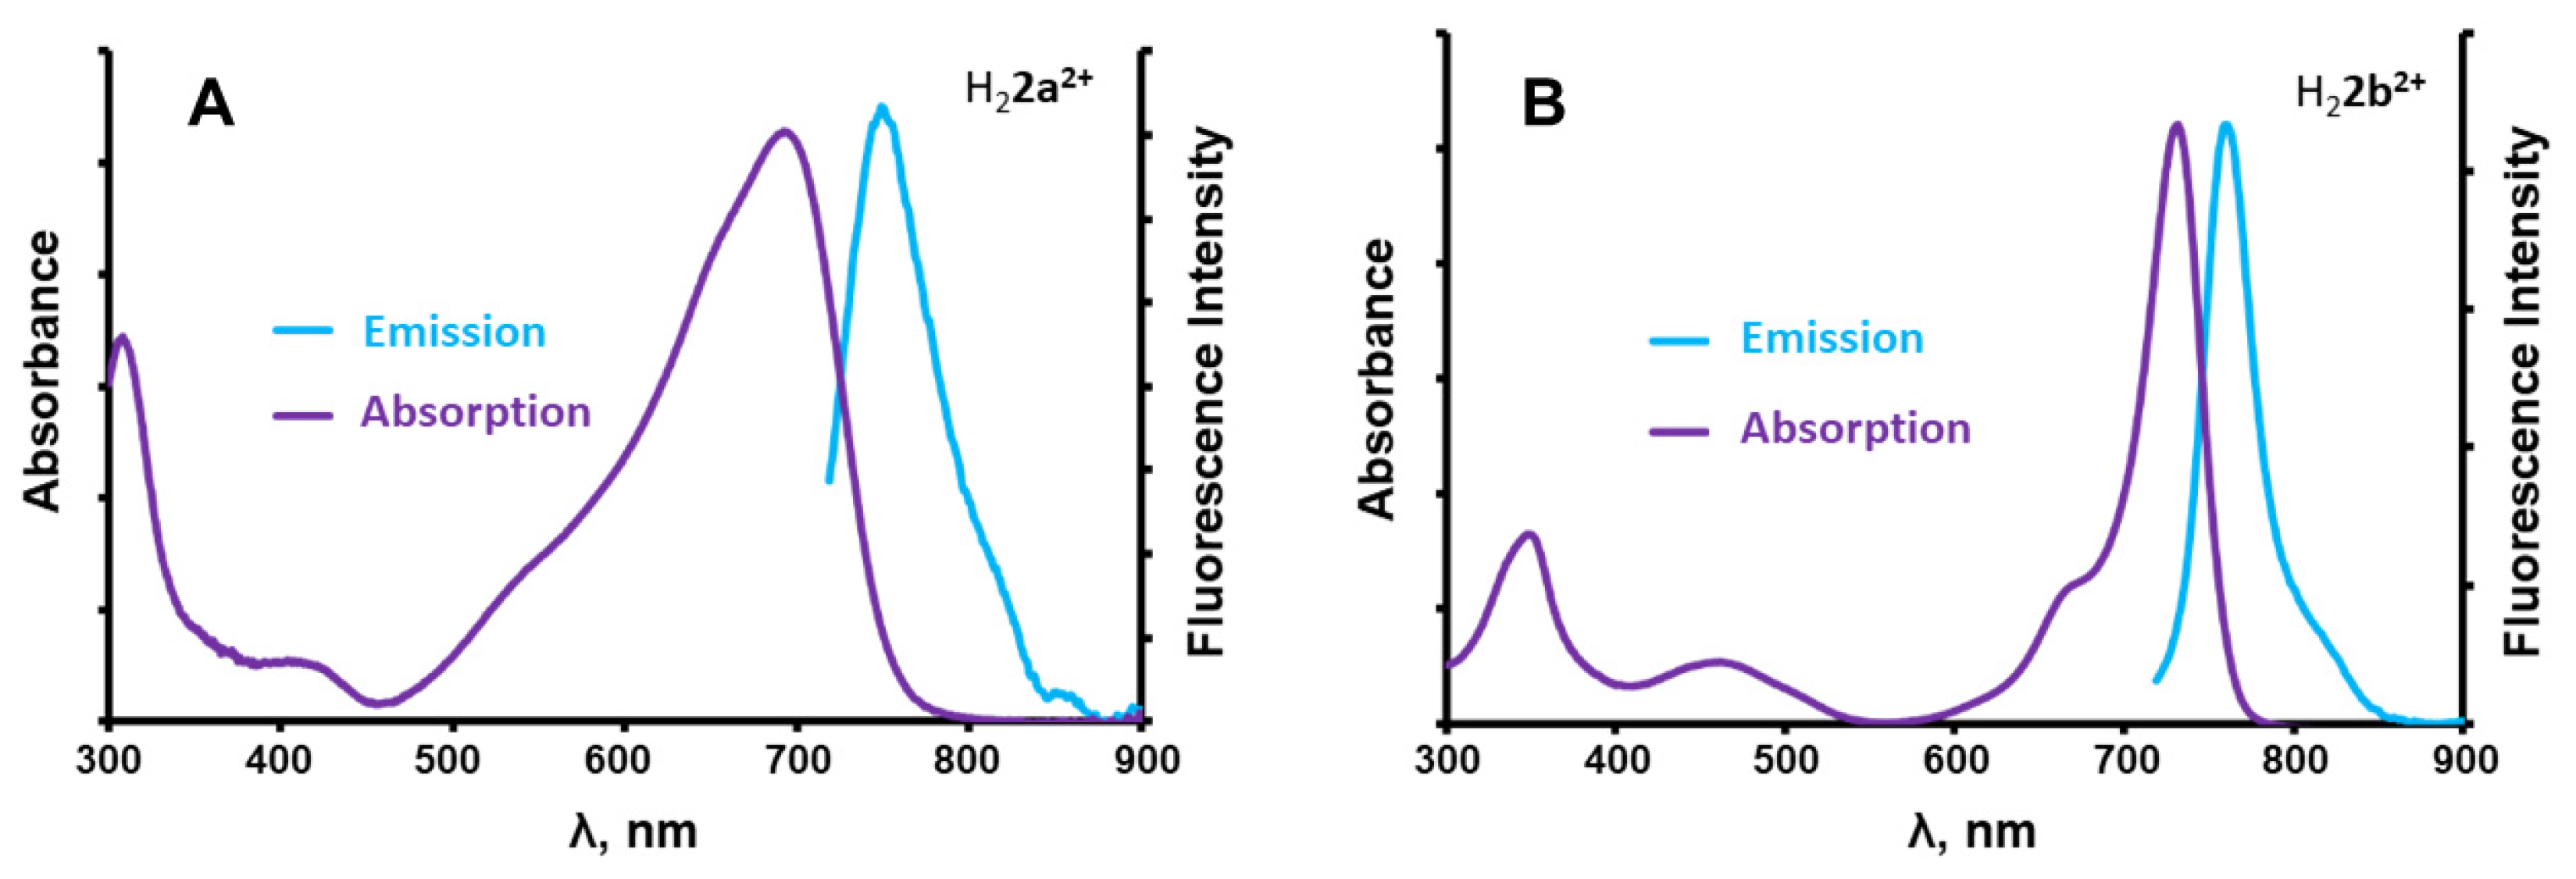
2.2. Photophysical Properties
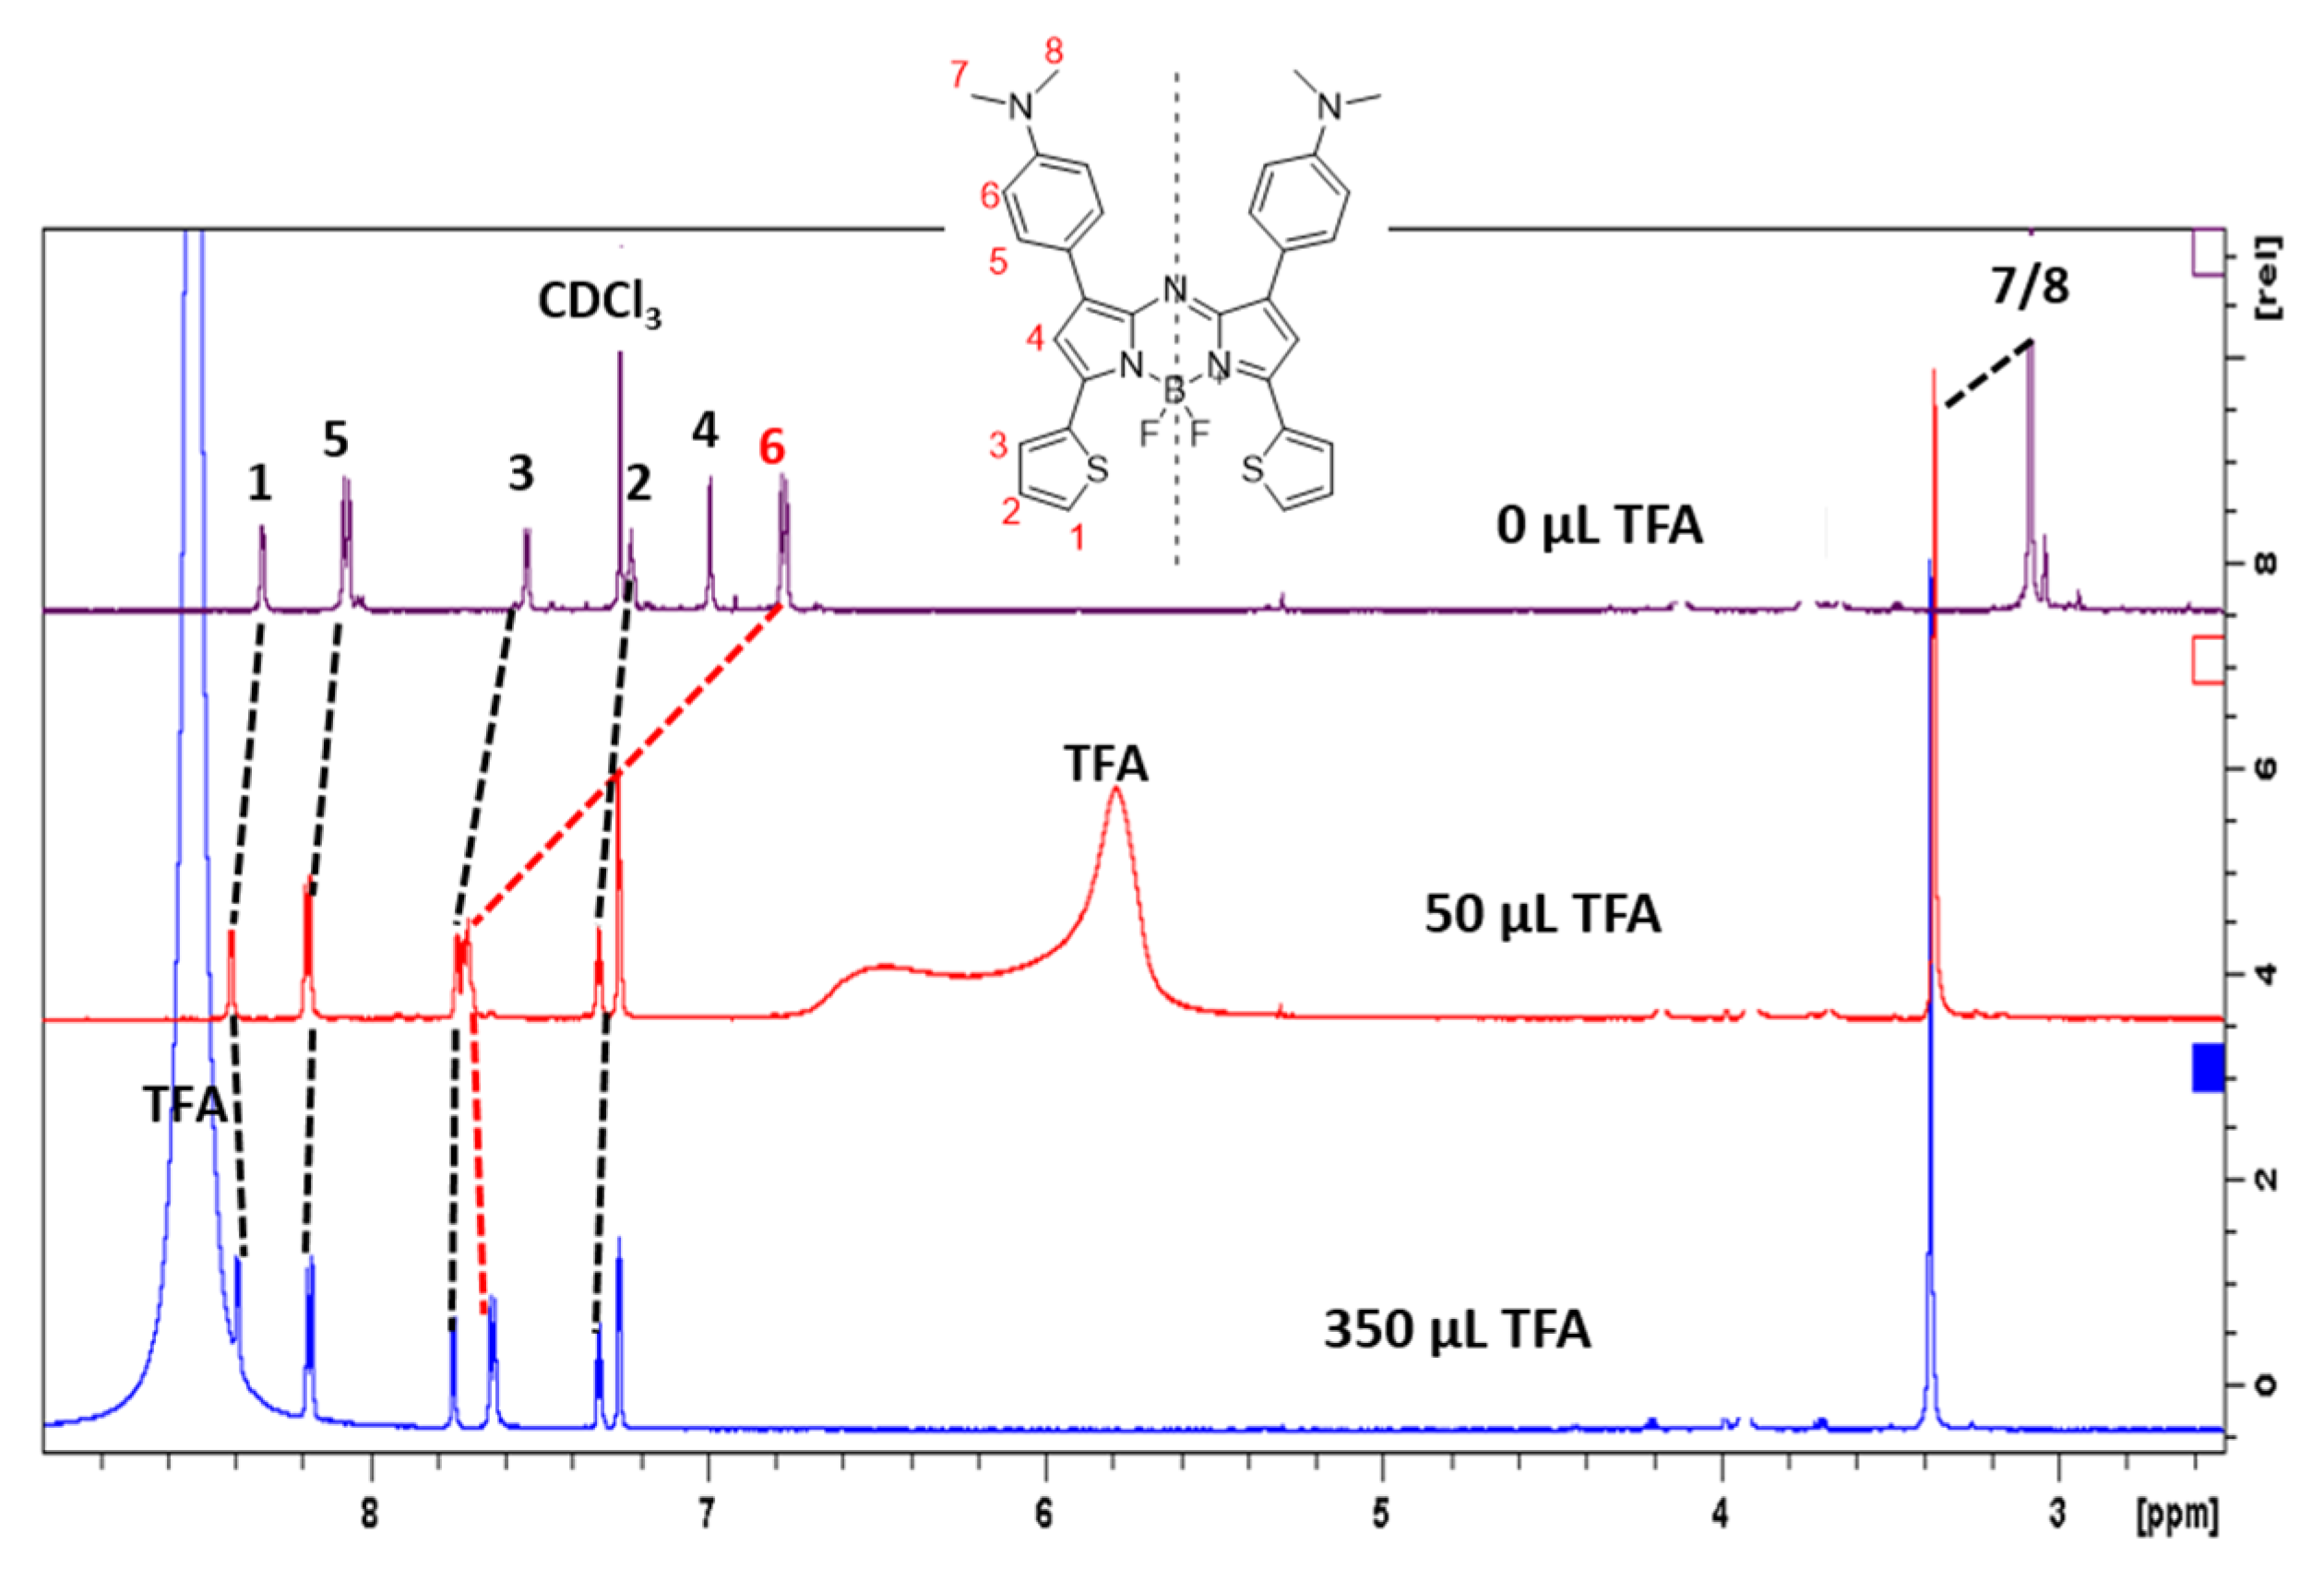
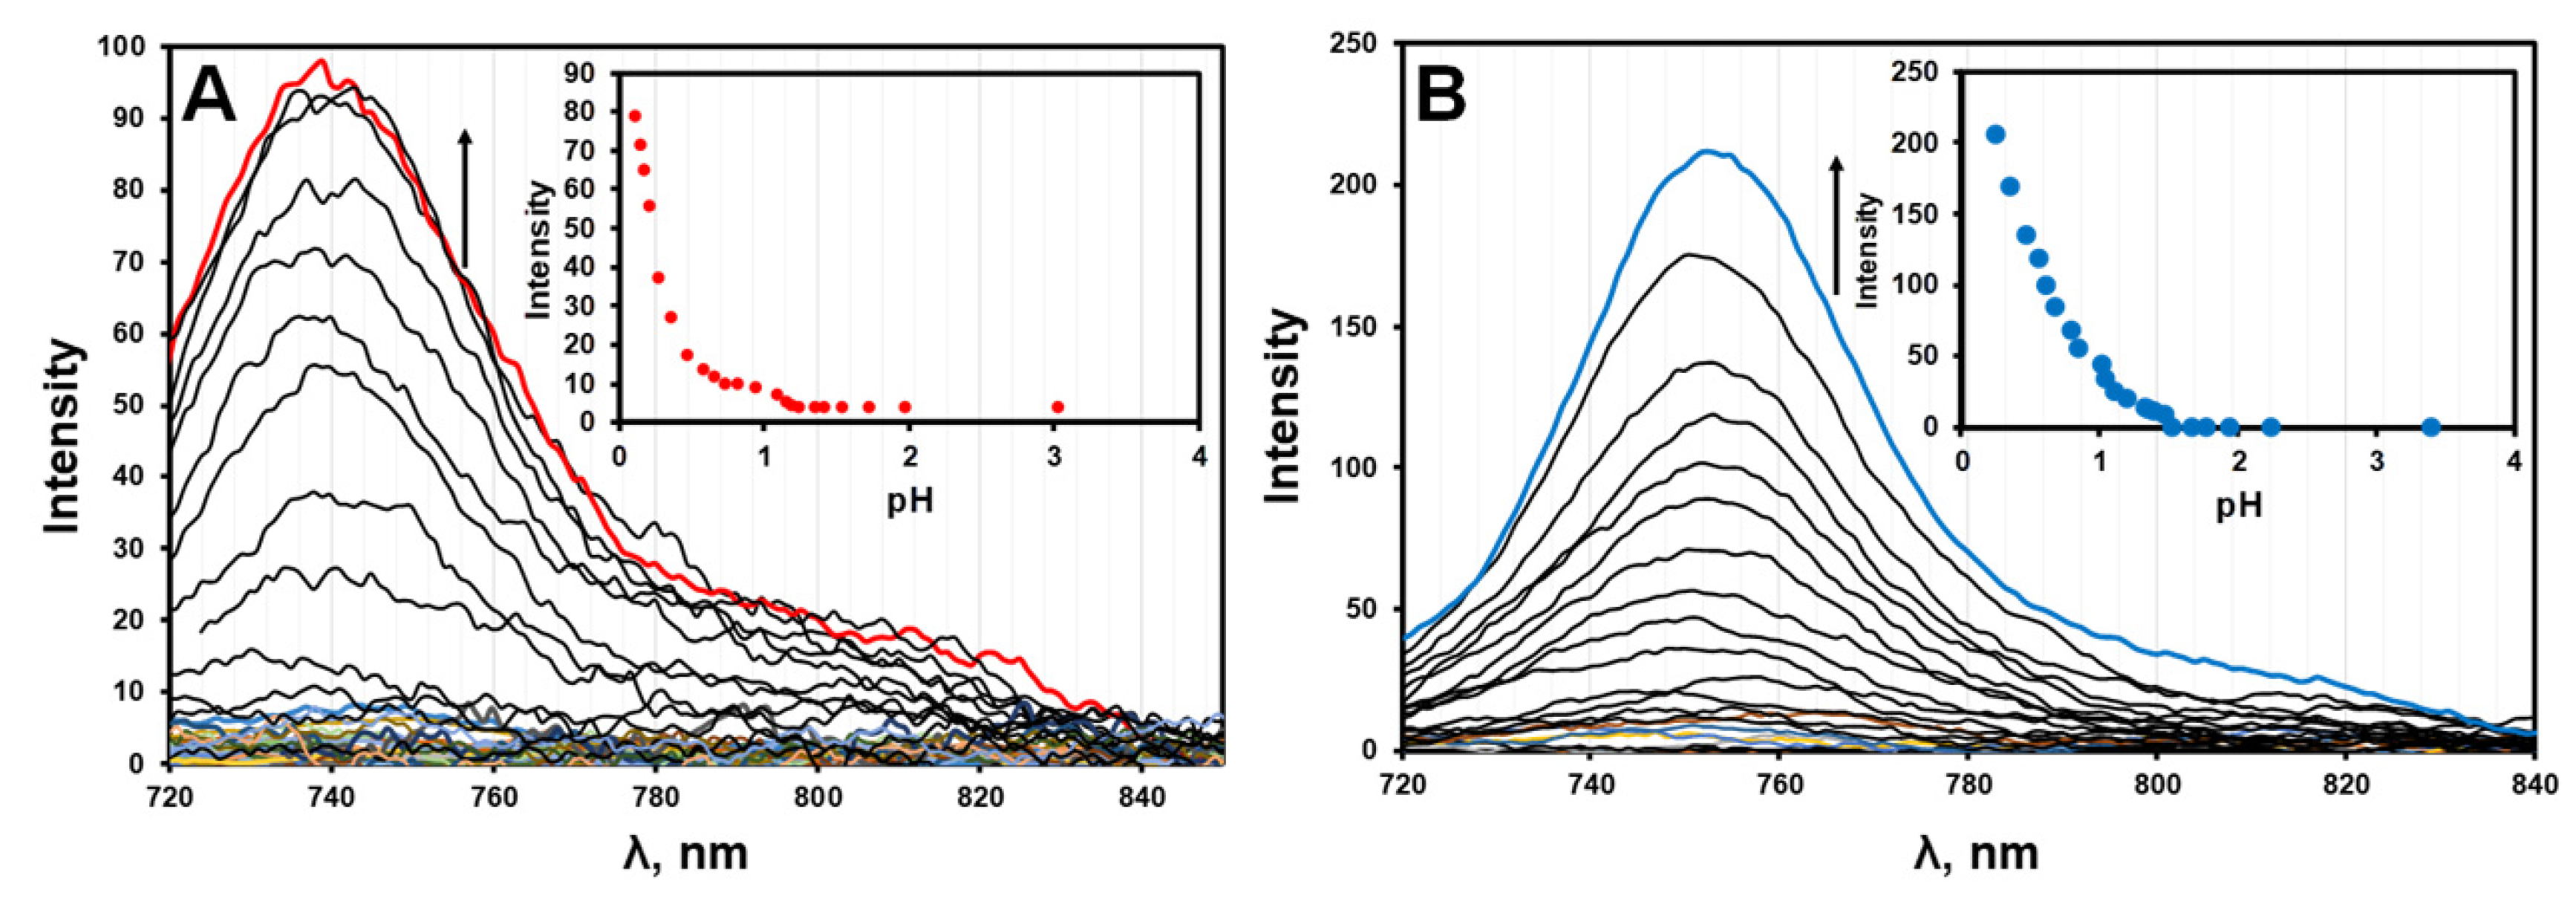
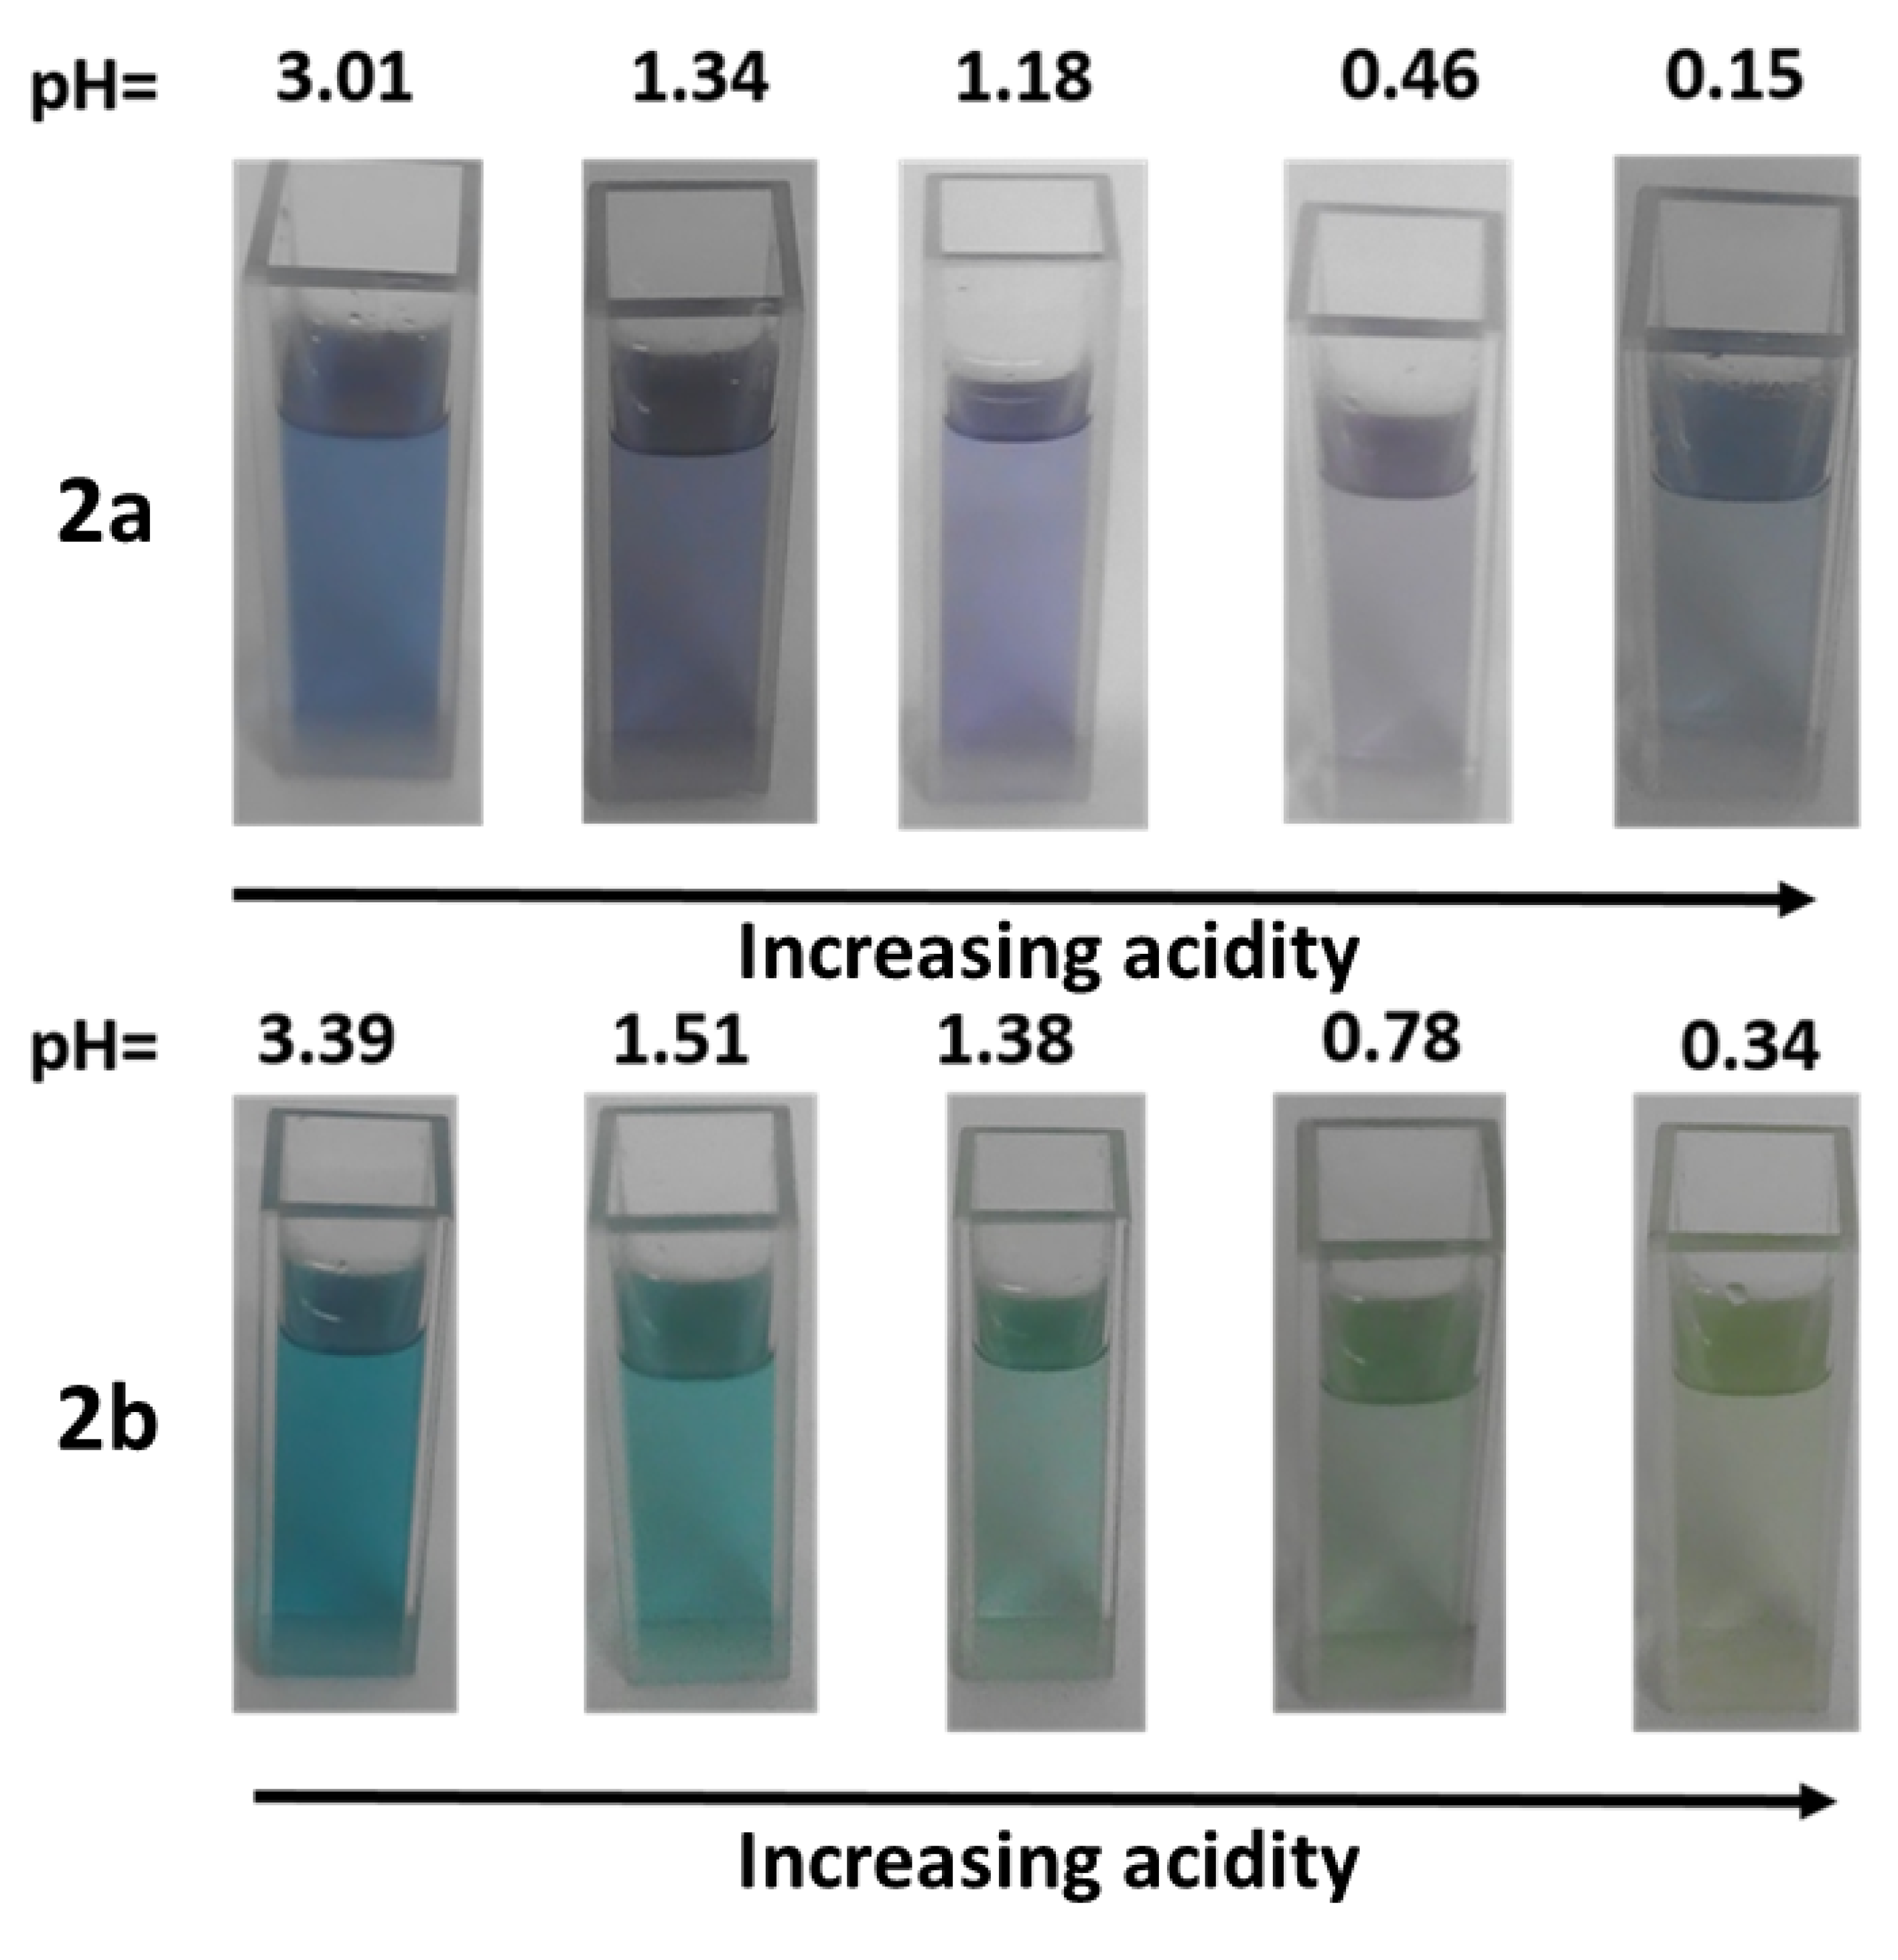
2.3. Effect of Protonation in CH2Cl2
3. Discussion
3.1. Effect of Protonation in DMSO/Aqueous Solutions
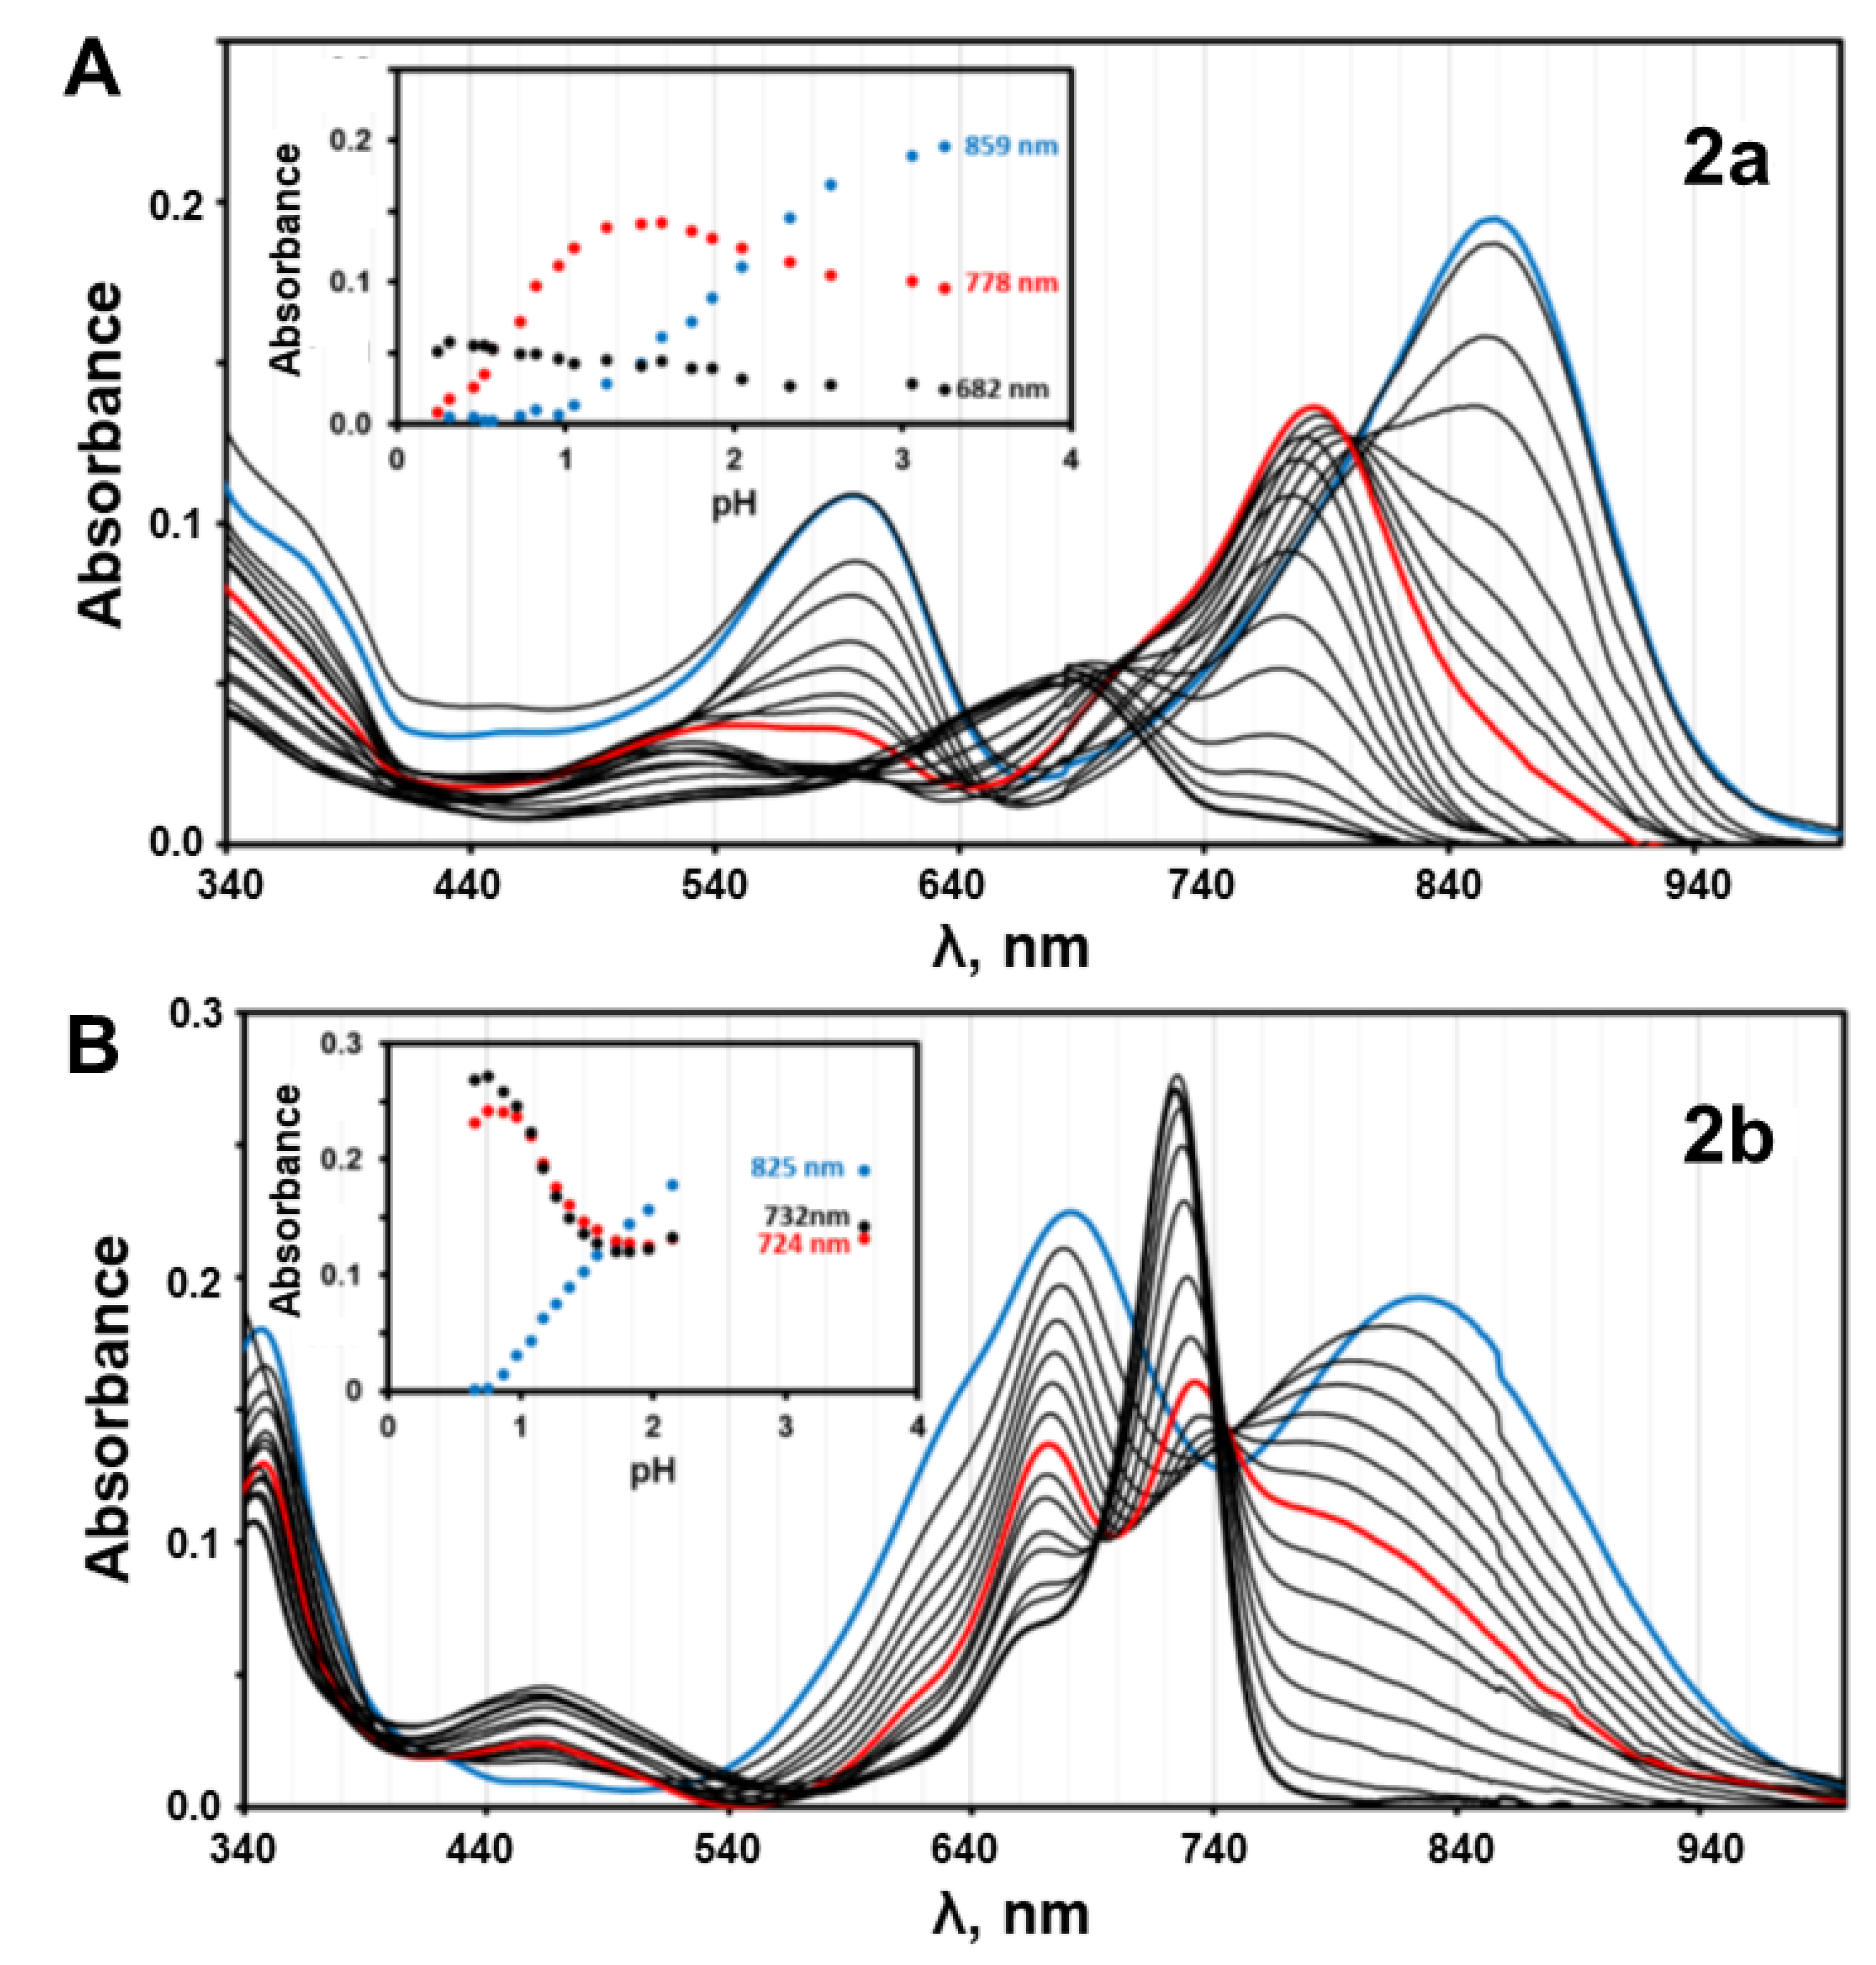
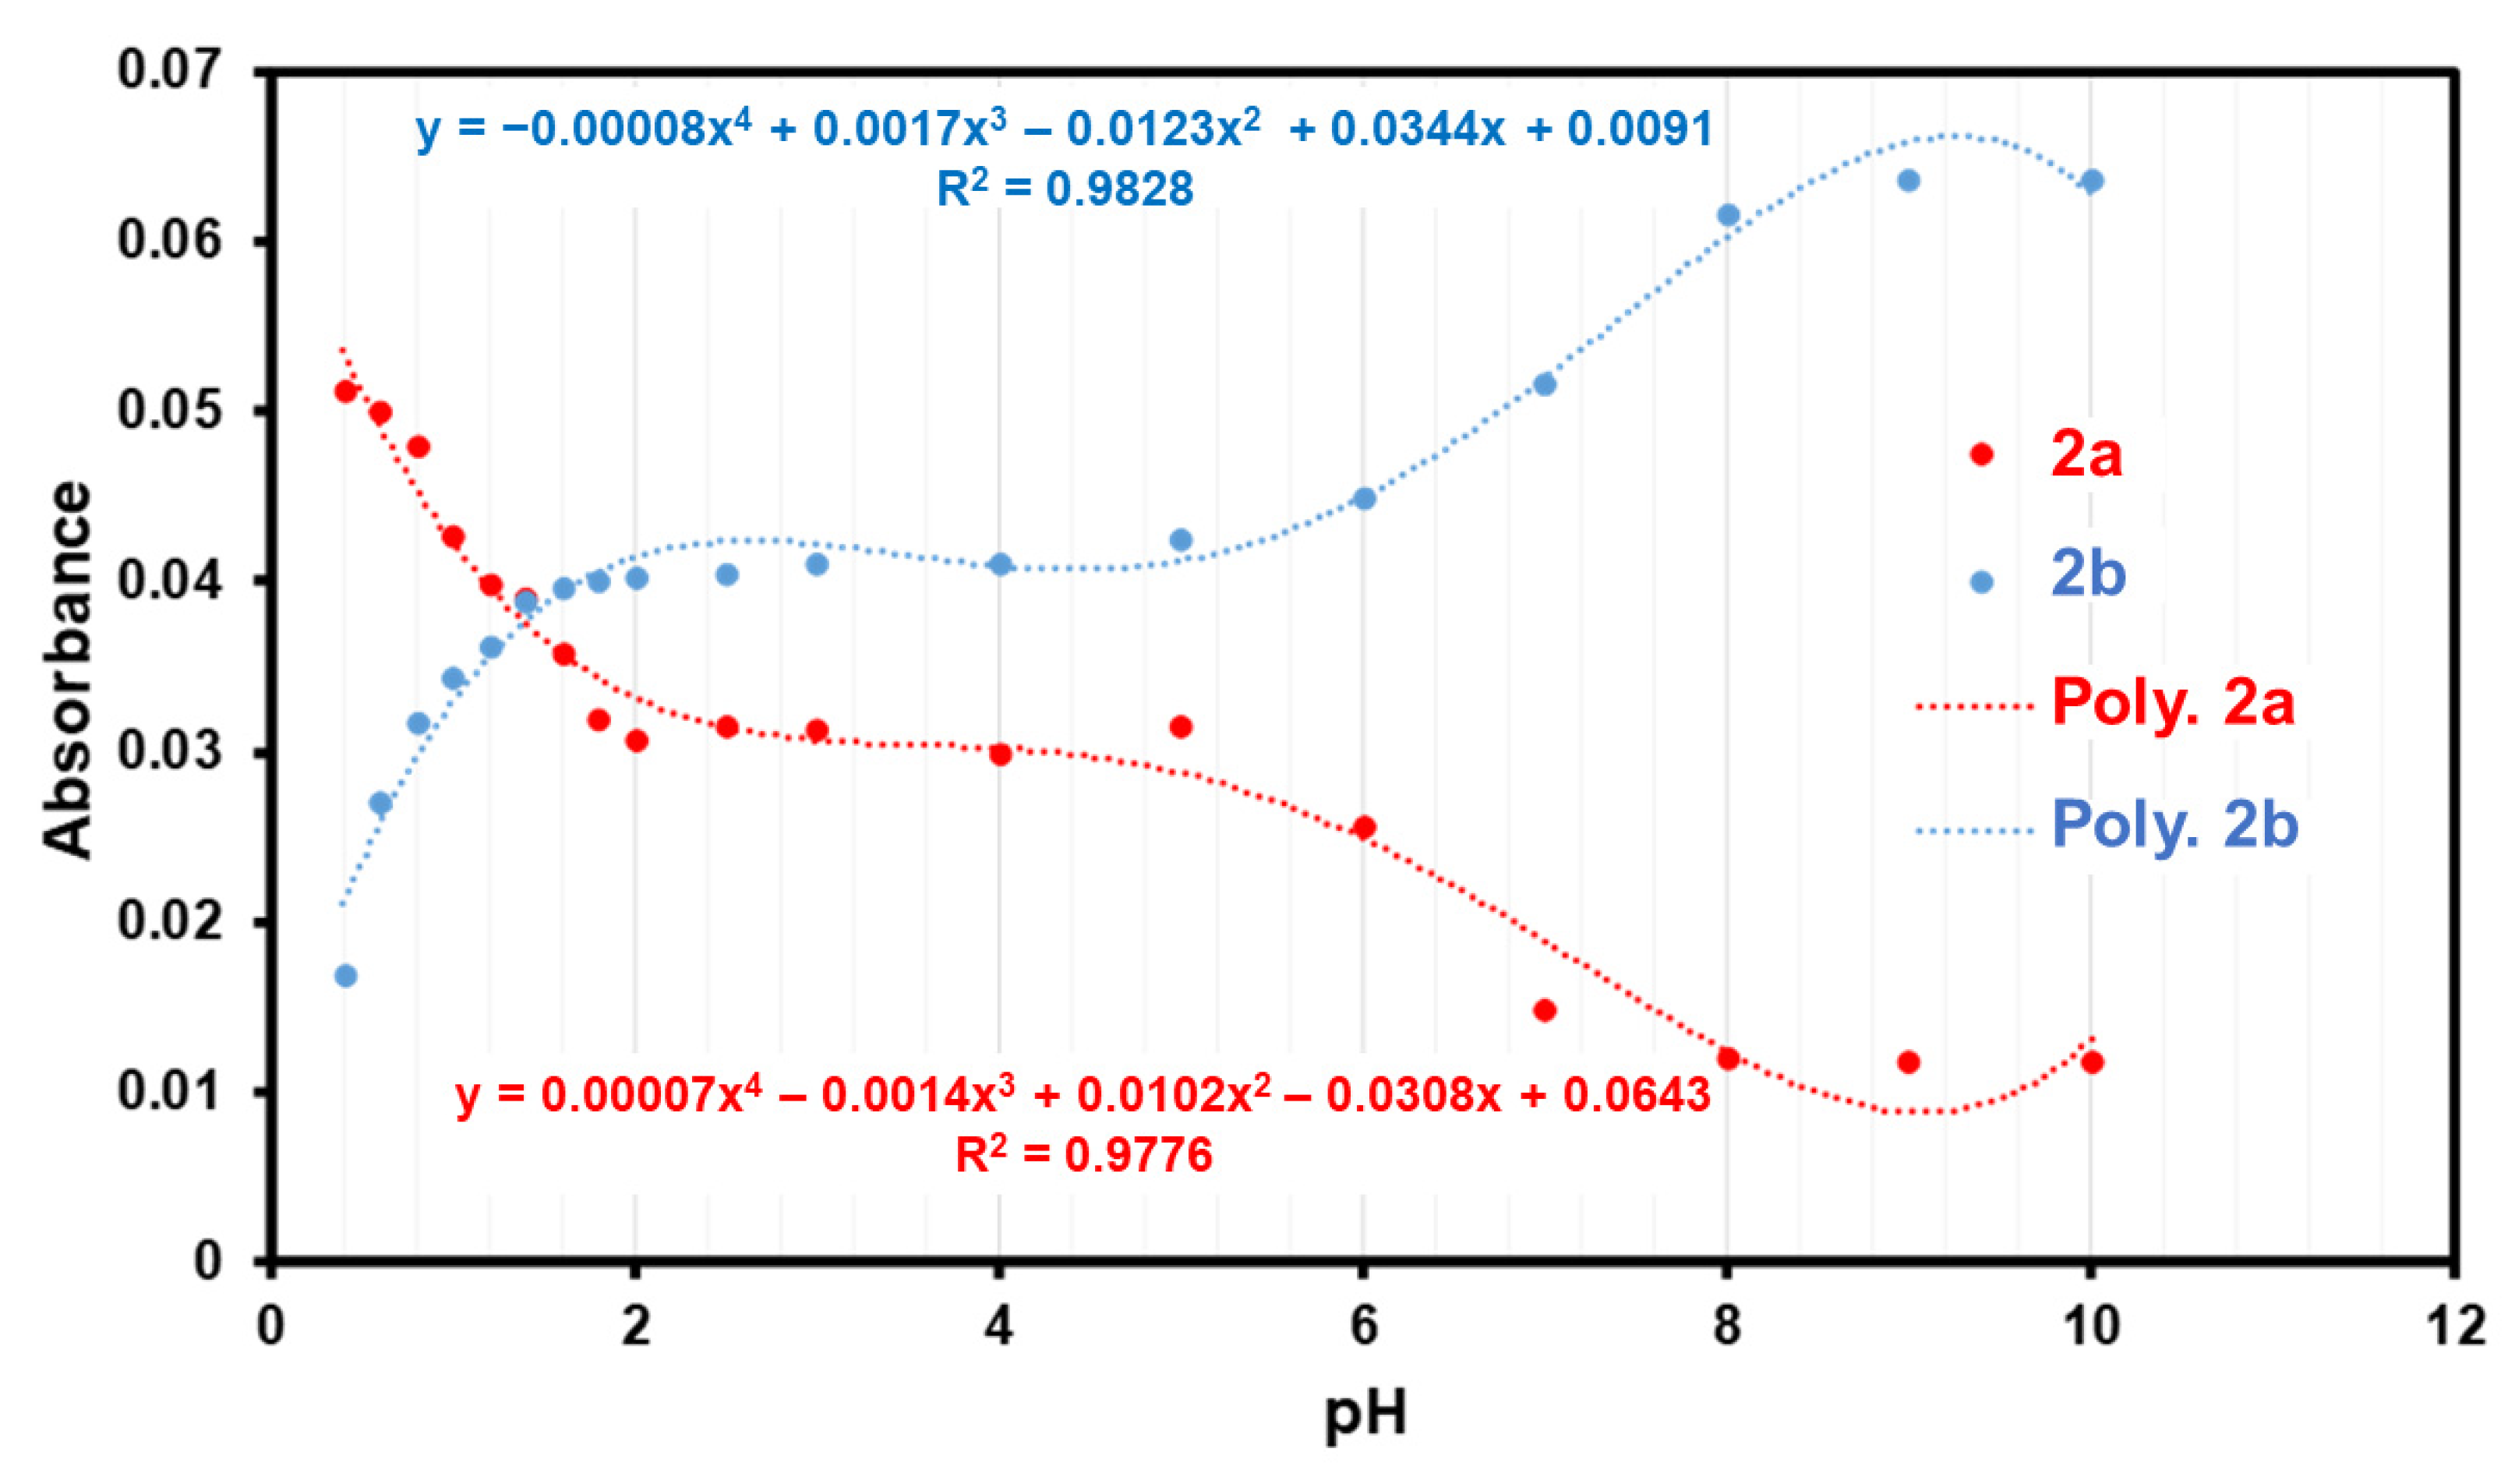
3.2. pKa Determination
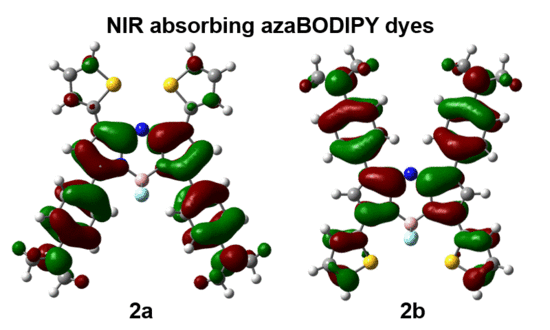
3.3. Molecular Modelling
4. Materials and Methods
4.1. Materials
4.2. Equipment
4.3. Synthesis
4.4. Photophysical Parameters
4.5. pH Studies
4.6. Theoretical Calculations
5. Conclusions
Supplementary Materials
Author Contributions
Funding
Acknowledgments
Conflicts of Interest
References
- Ni, Y.; Wu, J. Far-red and near infrared BODIPY dyes: Synthesis and applications for fluorescent pH probes and bio-imaging. Org. Biomol. Chem. 2014, 12, 3774–3791. [Google Scholar] [CrossRef] [PubMed]
- Kiyose, K.; Kojima, H.; Urano, Y.; Nagano, T. Development of a Ratiometric Fluorescent Zinc Ion Probe in Near-Infrared Region, Based on Tricarbocyanine Chromophore. J. Am. Chem. Soc. 2006, 128, 6548–6549. [Google Scholar] [CrossRef] [PubMed]
- Loudet, A.; Bandichhor, R.; Burgess, K.; Palma, A.; McDonnell, S.O.; Hall, M.; O’Shea, D.F. B,O-Chelated Azadipyrromethenes as Near-IR Probes. Org. Lett. 2008, 10, 4771–4774. [Google Scholar] [CrossRef] [PubMed]
- Gut, A.; Łapok, Ł.; Drelinkiewicz, D.; Pedzinski, T.; Marciniak, B.; Nowakowska, M. Visible-Light Photoactive, Highly Efficient Triplet Sensitizers Based on Iodinated Aza-BODIPYs: Synthesis, Photophysics and Redox Properties. Chem. Asian J. 2017, 13, 55–65. [Google Scholar] [CrossRef] [PubMed]
- Gresser, R.; Hartmann, H.; Wrackmeyer, M.; Leo, K.; Riede, M.K. Synthesis of thiophene-substituted aza-BODIPYs and their optical and electrochemical properties. Tetrahedron 2011, 67, 7148–7155. [Google Scholar] [CrossRef]
- Wu, Y.; Cheng, C.; Jiao, L.; Yu, C.; Wang, S.; Wei, Y.; Mu, X.; Hao, E. β-Thiophene-Fused BF2-Azadipyrromethenes as Near-Infrared Dyes. Org. Lett. 2014, 16, 748–751. [Google Scholar] [CrossRef]
- Zhang, X.; Yu, H.; Xiao, Y. Replacing Phenyl Ring with Thiophene: An Approach to Longer Wavelength Aza-dipyrromethene Boron Difluoride (Aza-BODIPY) Dyes. J. Org. Chem. 2011, 77, 669–673. [Google Scholar] [CrossRef]
- Jiang, X.-D.; Zhao, J.; Li, Q.; Sun, C.-L.; Guan, J.; Sun, G.-T.; Xiao, L.-J. Synthesis of NIR fluorescent thienyl-containing aza-BODIPY and its application for detection of Hg2+: Electron transfer by bonding with Hg2+. Dyes and Pigments 2016, 125, 136–141. [Google Scholar] [CrossRef]
- Zhao, W.; Carreira, E. Conformationally Restricted Aza-Bodipy: A Highly Fluorescent, Stable, Near-Infrared-Absorbing Dye. Angew. Chem. Int. Ed. 2005, 44, 1677–1679. [Google Scholar] [CrossRef]
- Killoran, J.; Allen, L.; Gallagher, J.F.; Gallagher, W.M.; O’Shea, D.F. Synthesis of BF2 chelates of tetraarylazadipyrromethenes and evidence for their photodynamic therapeutic behaviour. Chem. Commun. 2002, 1862–1863. [Google Scholar] [CrossRef]
- Andersson, P.; Gillbro, T.; Asato, A.; Liu, R. Dual singlet state emission in a series of mini-carotenes. J. Lumin. 1992, 51, 11–20. [Google Scholar] [CrossRef]
- McDonnell, S.O.; O’Shea, D.F. Near-infrared sensing properties of dimethlyamino-substituted BF2-azadipyrromethenes. Org. Lett. 2006, 8, 3493–3496. [Google Scholar] [CrossRef] [PubMed]
- Maus, M.; Rurack, K. Monitoring pH and solvent proticity with donor–acceptor-substituted biphenyls: A new approach towards highly sensitive and powerful fluorescent probes by tuning the molecular structure. New J. Chem. 2000, 24, 677–686. [Google Scholar] [CrossRef]
- Li, C.-Y.; Zhang, X.-B.; Qiao, L.; Zhao, Y.; He, C.-M.; Huan, S.; Lu, L.-M.; Jian, L.-X.; Shen, G.-L.; Yu, R.-Q. Naphthalimide−Porphyrin Hybrid Based Ratiometric Bioimaging Probe for Hg2+: Well-Resolved Emission Spectra and Unique Specificity. Anal. Chem. 2009, 81, 9993–10001. [Google Scholar] [CrossRef] [PubMed]
- Dannhardt, G.; Kiefer, W.; Krämer, G.; Maehrlein, S.; Nowe, U.; Fiebich, B. The pyrrole moiety as a template for COX-1/COX-2 inhibitors. Eur. J. Med. Chem. 2000, 35, 499–510. [Google Scholar] [CrossRef]
- Peseke, K.; Gotze, L.; Reinke, H.; Cedeño, Q.A.; Suárez, J.Q.; Andreu, M.G.; Castro, H.V. A Synthesis of Substituted Tetrahydro-2-pyranols. J. Prakt. Chem. 1997, 339, 656–659. [Google Scholar] [CrossRef]
- Lu, H.; Mack, J.; Yang, Y.; Shen, Z. Structural modification strategies for the rational design of red/NIR region BODIPYs. Chem. Soc. Rev. 2014, 43, 4778–4823. [Google Scholar] [CrossRef]
- Yang, W.; Liu, H.-G.; Liu, G.-K.; Lin, Y.; Gao, M.; Zhao, X.-Y.; Zheng, W.-C.; Chen, Y.; Xu, J.; Li, L.-Z. Trivalent europium-doped strontium molybdate red phosphors in white light-emitting diodes: Synthesis, photophysical properties and theoretical calculations. Acta Mater. 2012, 60, 5399–5407. [Google Scholar] [CrossRef]
- Gorman, A.; Killoran, J.; O’Shea, C.; Kenna, T.; Gallagher, W.M.; O’Shea, D.F. In Vitro Demonstration of the Heavy-Atom Effect for Photodynamic Therapy. J. Am. Chem. Soc. 2004, 126, 10619–10631. [Google Scholar] [CrossRef]
- Jokić, T.; Borisov, S.M.; Saf, R.; Nielsen, D.A.; Kühl, M.; Klimant, I. Highly Photostable Near-Infrared Fluorescent pH Indicators and Sensors Based on BF2-Chelated Tetraarylazadipyrromethene Dyes. Anal. Chem. 2012, 84, 6723–6730. [Google Scholar] [CrossRef]
- Pandey, M.; Jaipal, A.; Kumar, A.; Malik, R.; Charde, S. Determination of pKa of felodipine using UV-Visible spectroscopy. Spectrochim. Acta 2013, 115, 887–890. [Google Scholar] [CrossRef] [PubMed]
- Horton, H.R.; Moran, L.A.; Ochs, R.S.; Rawn, J.D.; Scrimgeour, K.G. Principles of Biochemistry; Prentice Hall: Bergen County, NJ, USA, 1996. [Google Scholar]
- Raposo, M.M.M.; Fonseca, A.; Castro, M.C.R.; Belsley, M.; Cardoso, M.; Carvalho, L.; Coelho, P. Synthesis and characterization of novel diazenes bearing pyrrole, thiophene and thiazole heterocycles as efficient photochromic and nonlinear optical (NLO) materials. Dye. Pigment. 2011, 91, 62–73. [Google Scholar] [CrossRef]
- Tejada, R.P.; Pellejà, L.; Palomares, E.; Franco, S.; Orduna, J.; Garín, J.; Andreu, R. Novel 4 H -pyranylidene organic dyes for dye-sensitized solar cells: Effect of different heteroaromatic rings on the photovoltaic properties. Org. Electron. 2014, 15, 3237–3250. [Google Scholar] [CrossRef]
- James, N.S.; Chen, Y.; Joshi, P.; Ohulchanskyy, T.Y.; Ethirajan, M.; Henary, M.; Strekowsk, L.; Pandey, R.K. Evaluation of Polymethine Dyes as Potential Probes for Near Infrared Fluorescence Imaging of Tumors: Part-1. Theranostics 2013, 3, 692–702. [Google Scholar] [CrossRef]
- Martínez, C.H.R.; Dardonville, C. Rapid Determination of Ionization Constants (pKa) by UV Spectroscopy Using 96-Well Microtiter Plates. ACS Med. Chem. Lett. 2012, 4, 142–145. [Google Scholar] [CrossRef]
- Gaussian 09, Revision D. 01; Gaussian Inc.: Wallingford, CT, USA, 2009.
Sample Availability: Samples of compounds 2a and 2b are available from the authors. |


| DMSO | CH2Cl2 | THF | Toluene | Benzene | Ref. | |
|---|---|---|---|---|---|---|
| 1 | --- 1 | --- | --- | 798 | --- | [12] |
| 2a | 859 | 824 | 819 | 816 | 814 | --- |
| 2b | 810 | 790 | 786 | 776 | 779 | --- |
© 2020 by the authors. Licensee MDPI, Basel, Switzerland. This article is an open access article distributed under the terms and conditions of the Creative Commons Attribution (CC BY) license (http://creativecommons.org/licenses/by/4.0/).
Share and Cite
Kubheka, G.; Mack, J.; Nyokong, T.; Shen, Z. NIR Absorbing AzaBODIPY Dyes for pH Sensing. Molecules 2020, 25, 3689. https://doi.org/10.3390/molecules25163689
Kubheka G, Mack J, Nyokong T, Shen Z. NIR Absorbing AzaBODIPY Dyes for pH Sensing. Molecules. 2020; 25(16):3689. https://doi.org/10.3390/molecules25163689
Chicago/Turabian StyleKubheka, Gugu, John Mack, Tebello Nyokong, and Zhen Shen. 2020. "NIR Absorbing AzaBODIPY Dyes for pH Sensing" Molecules 25, no. 16: 3689. https://doi.org/10.3390/molecules25163689
APA StyleKubheka, G., Mack, J., Nyokong, T., & Shen, Z. (2020). NIR Absorbing AzaBODIPY Dyes for pH Sensing. Molecules, 25(16), 3689. https://doi.org/10.3390/molecules25163689