
Transport and Electrochemical Interface Properties of Ionomers in Low-Pt Loading Catalyst Layers: Effect of Ionomer Equivalent Weight and Relative Humidity

 and
and
Abstract
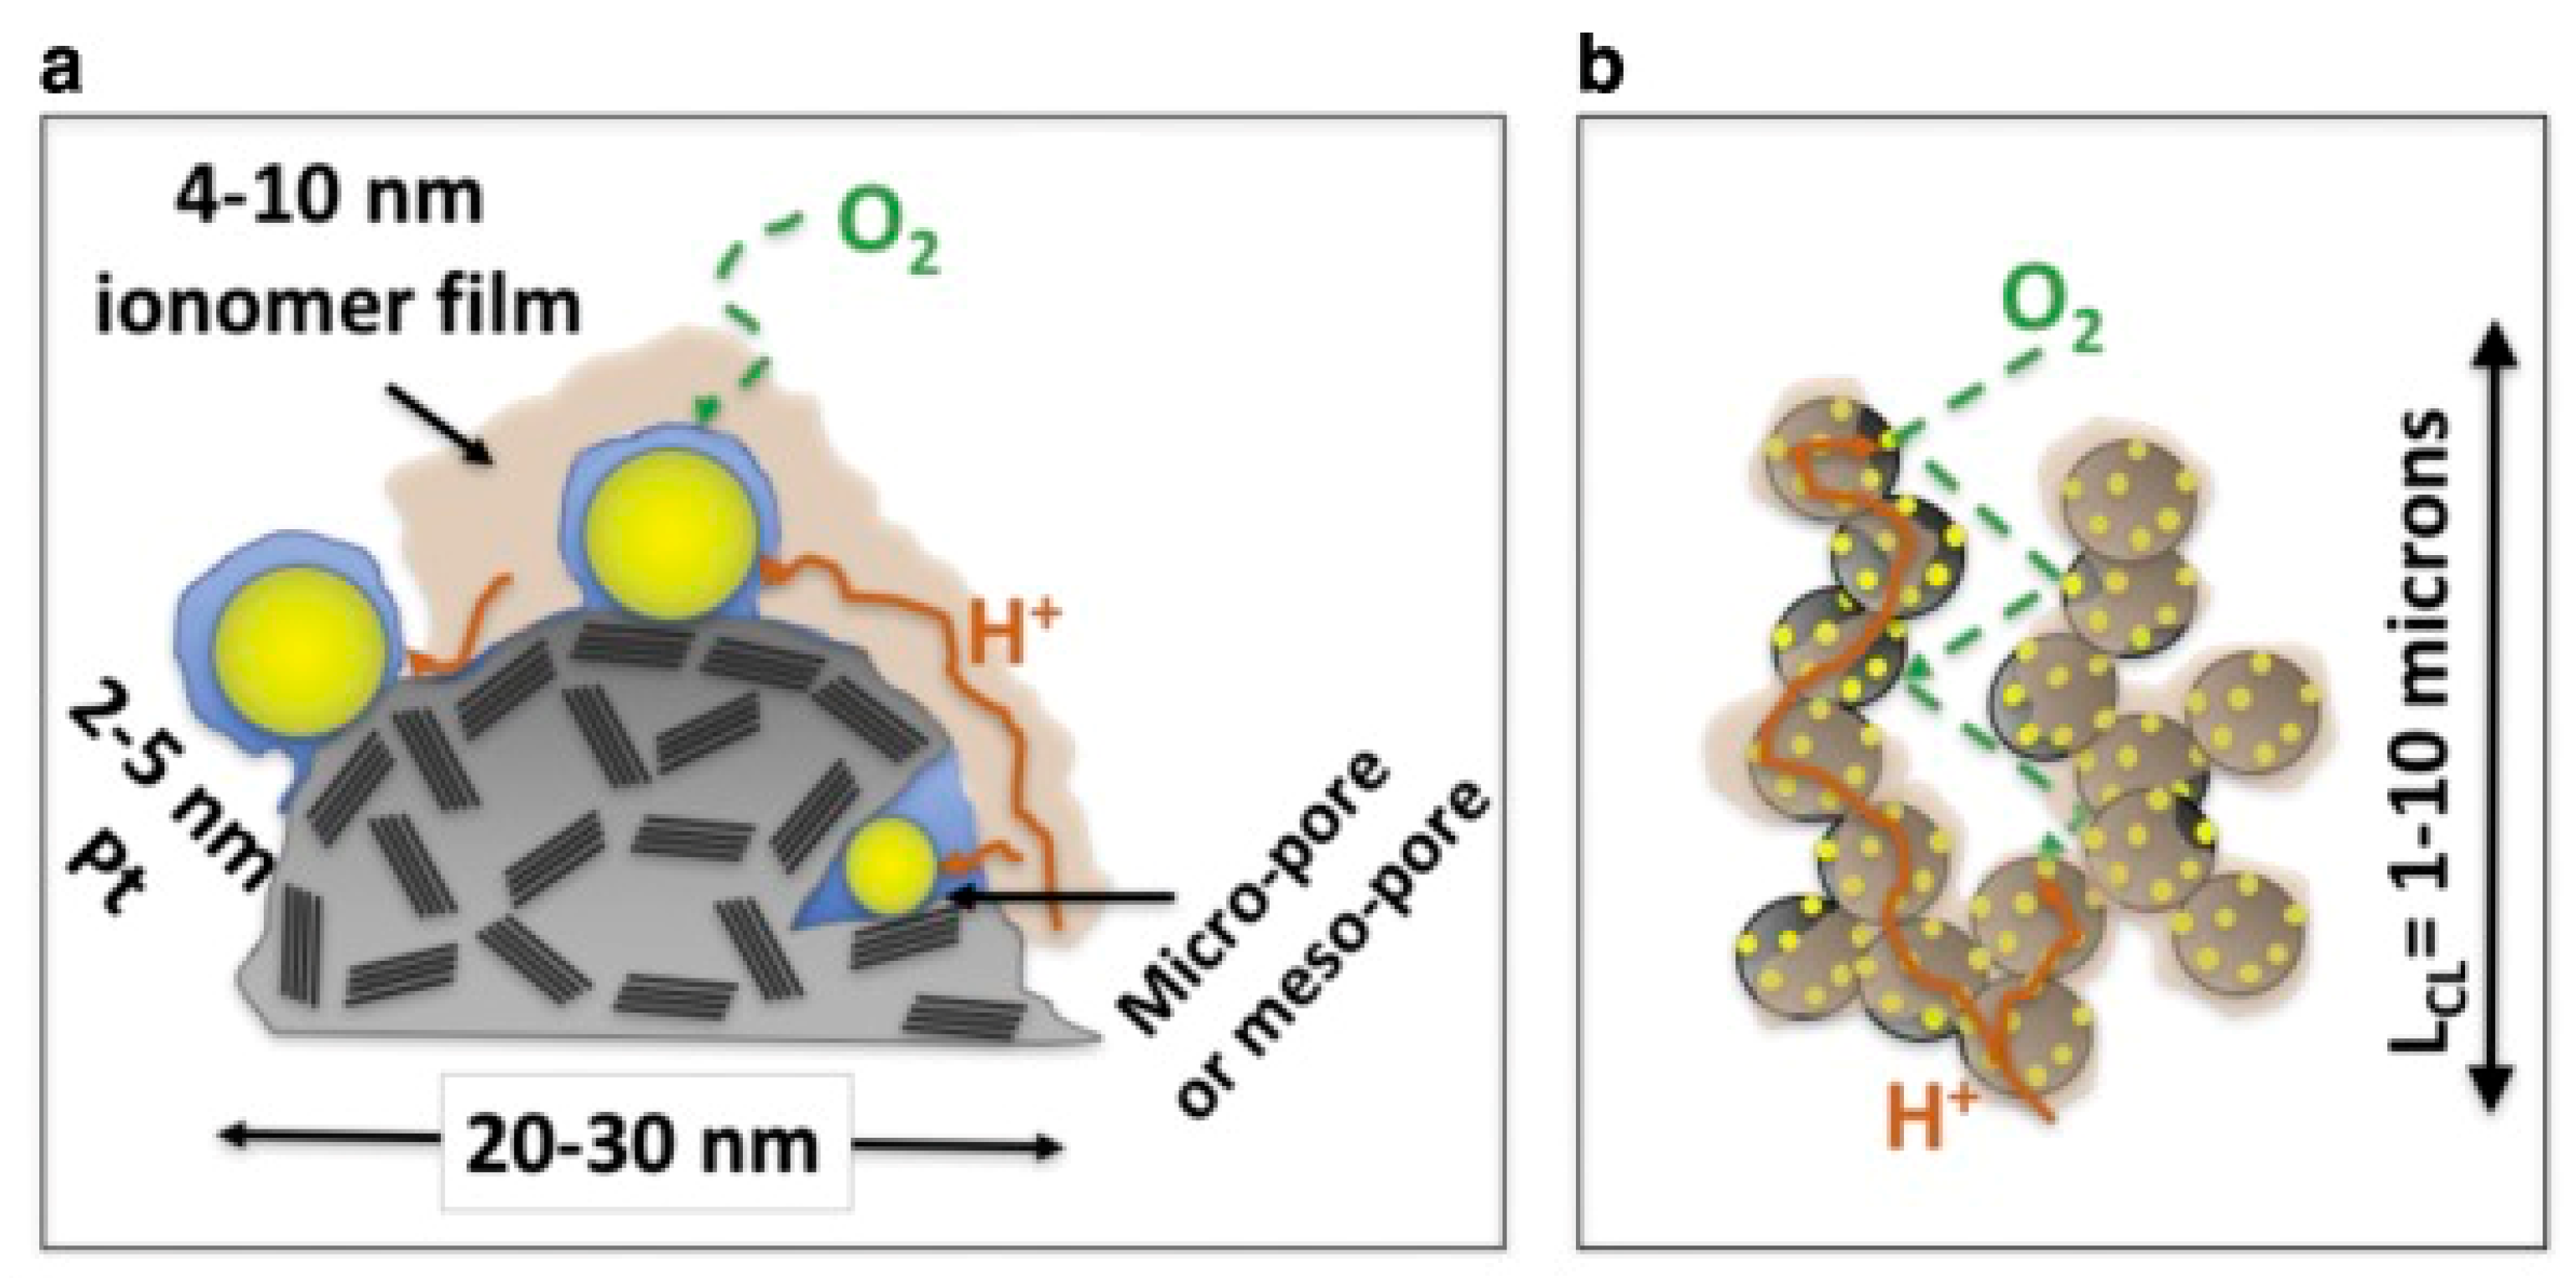
1. Introduction
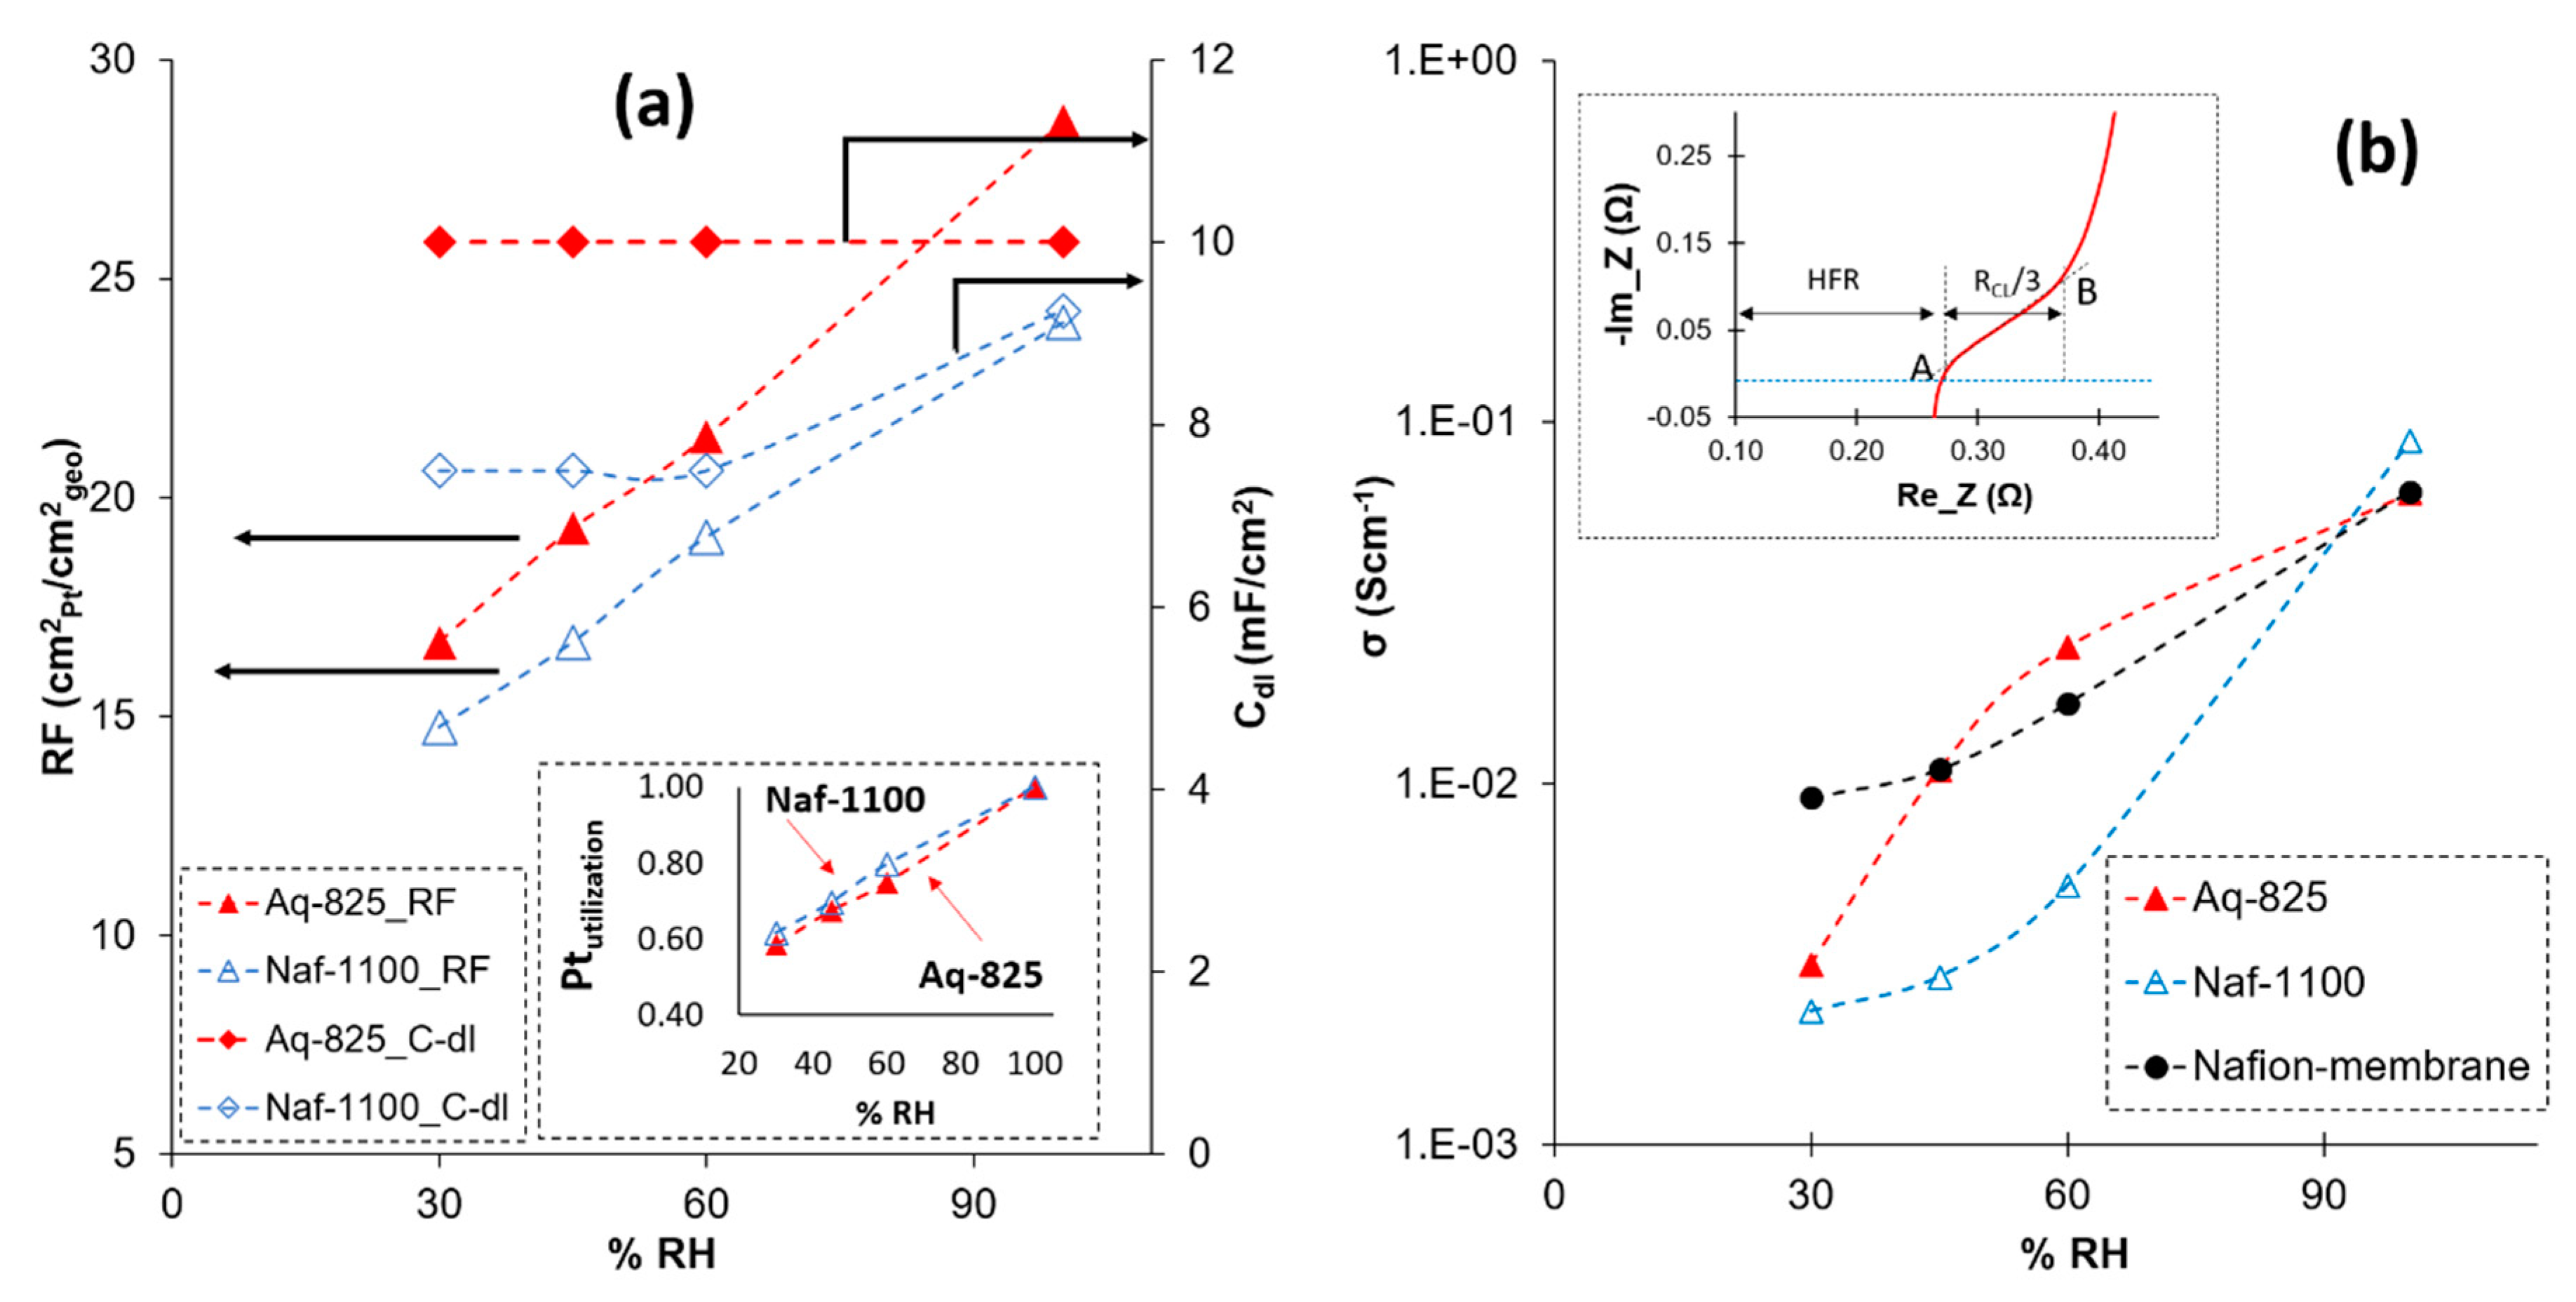
2. Results
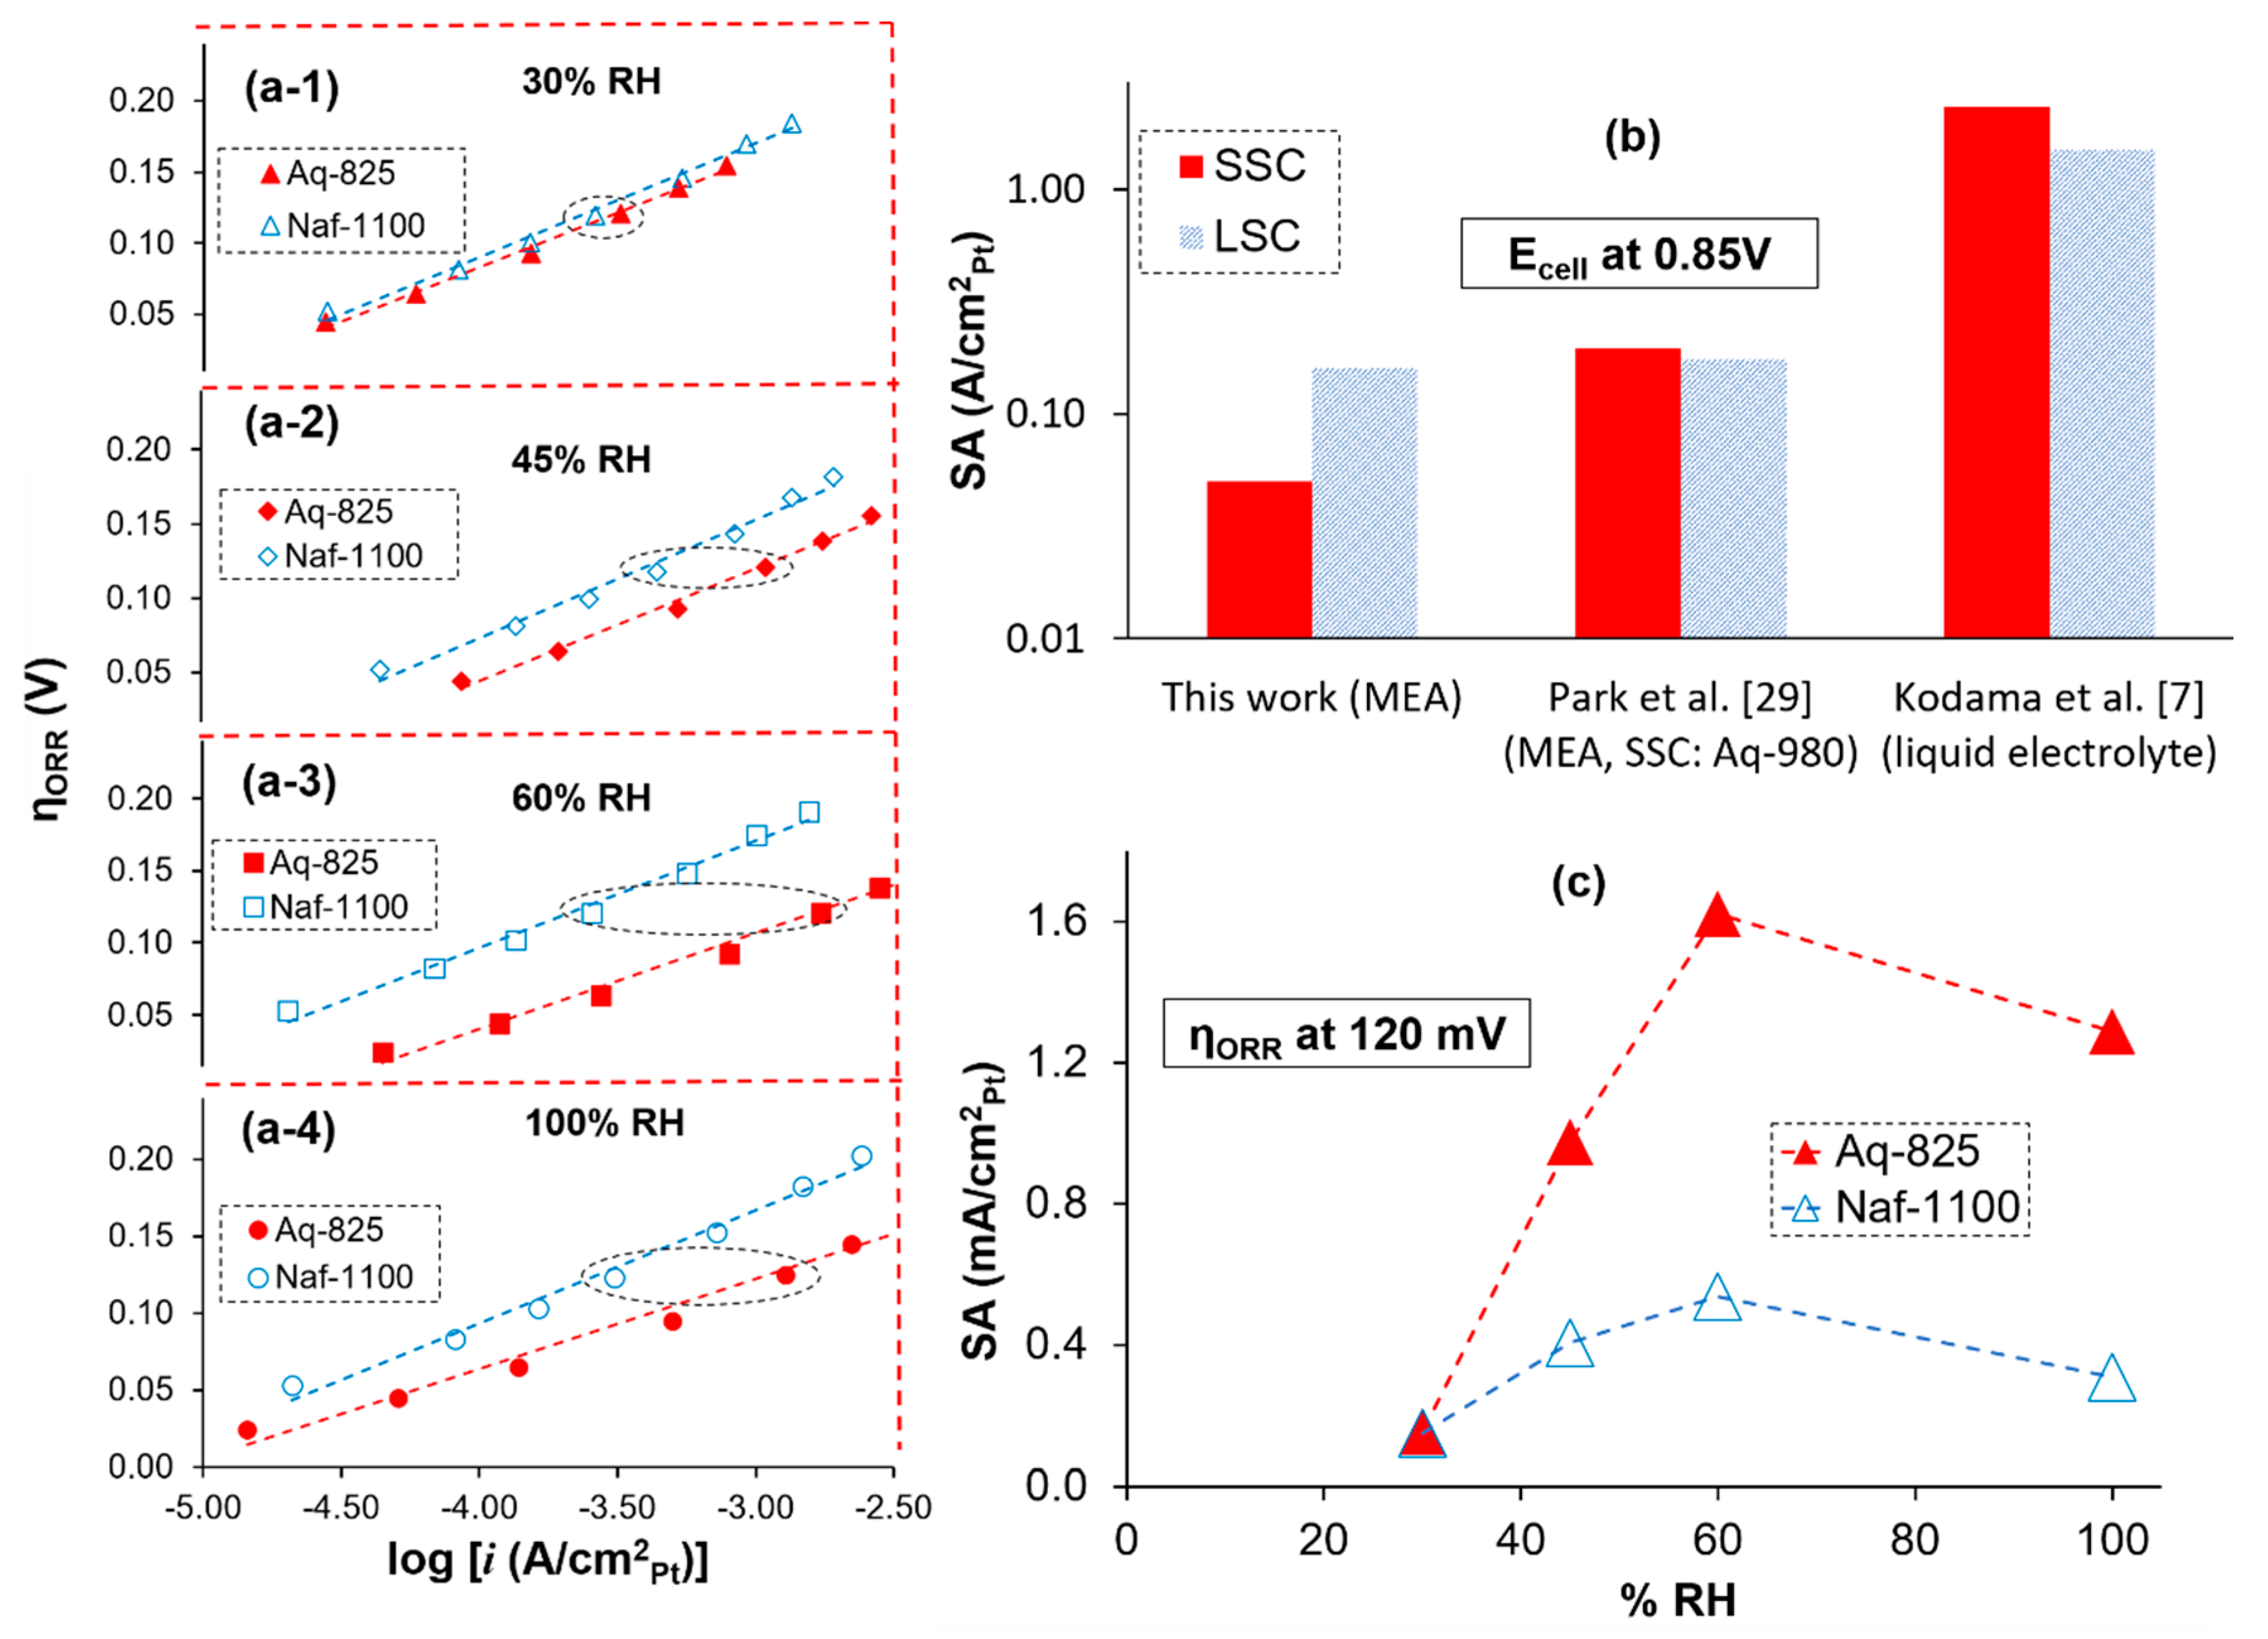
2.1. Oxygen Reduction Reaction (ORR) Kinetics
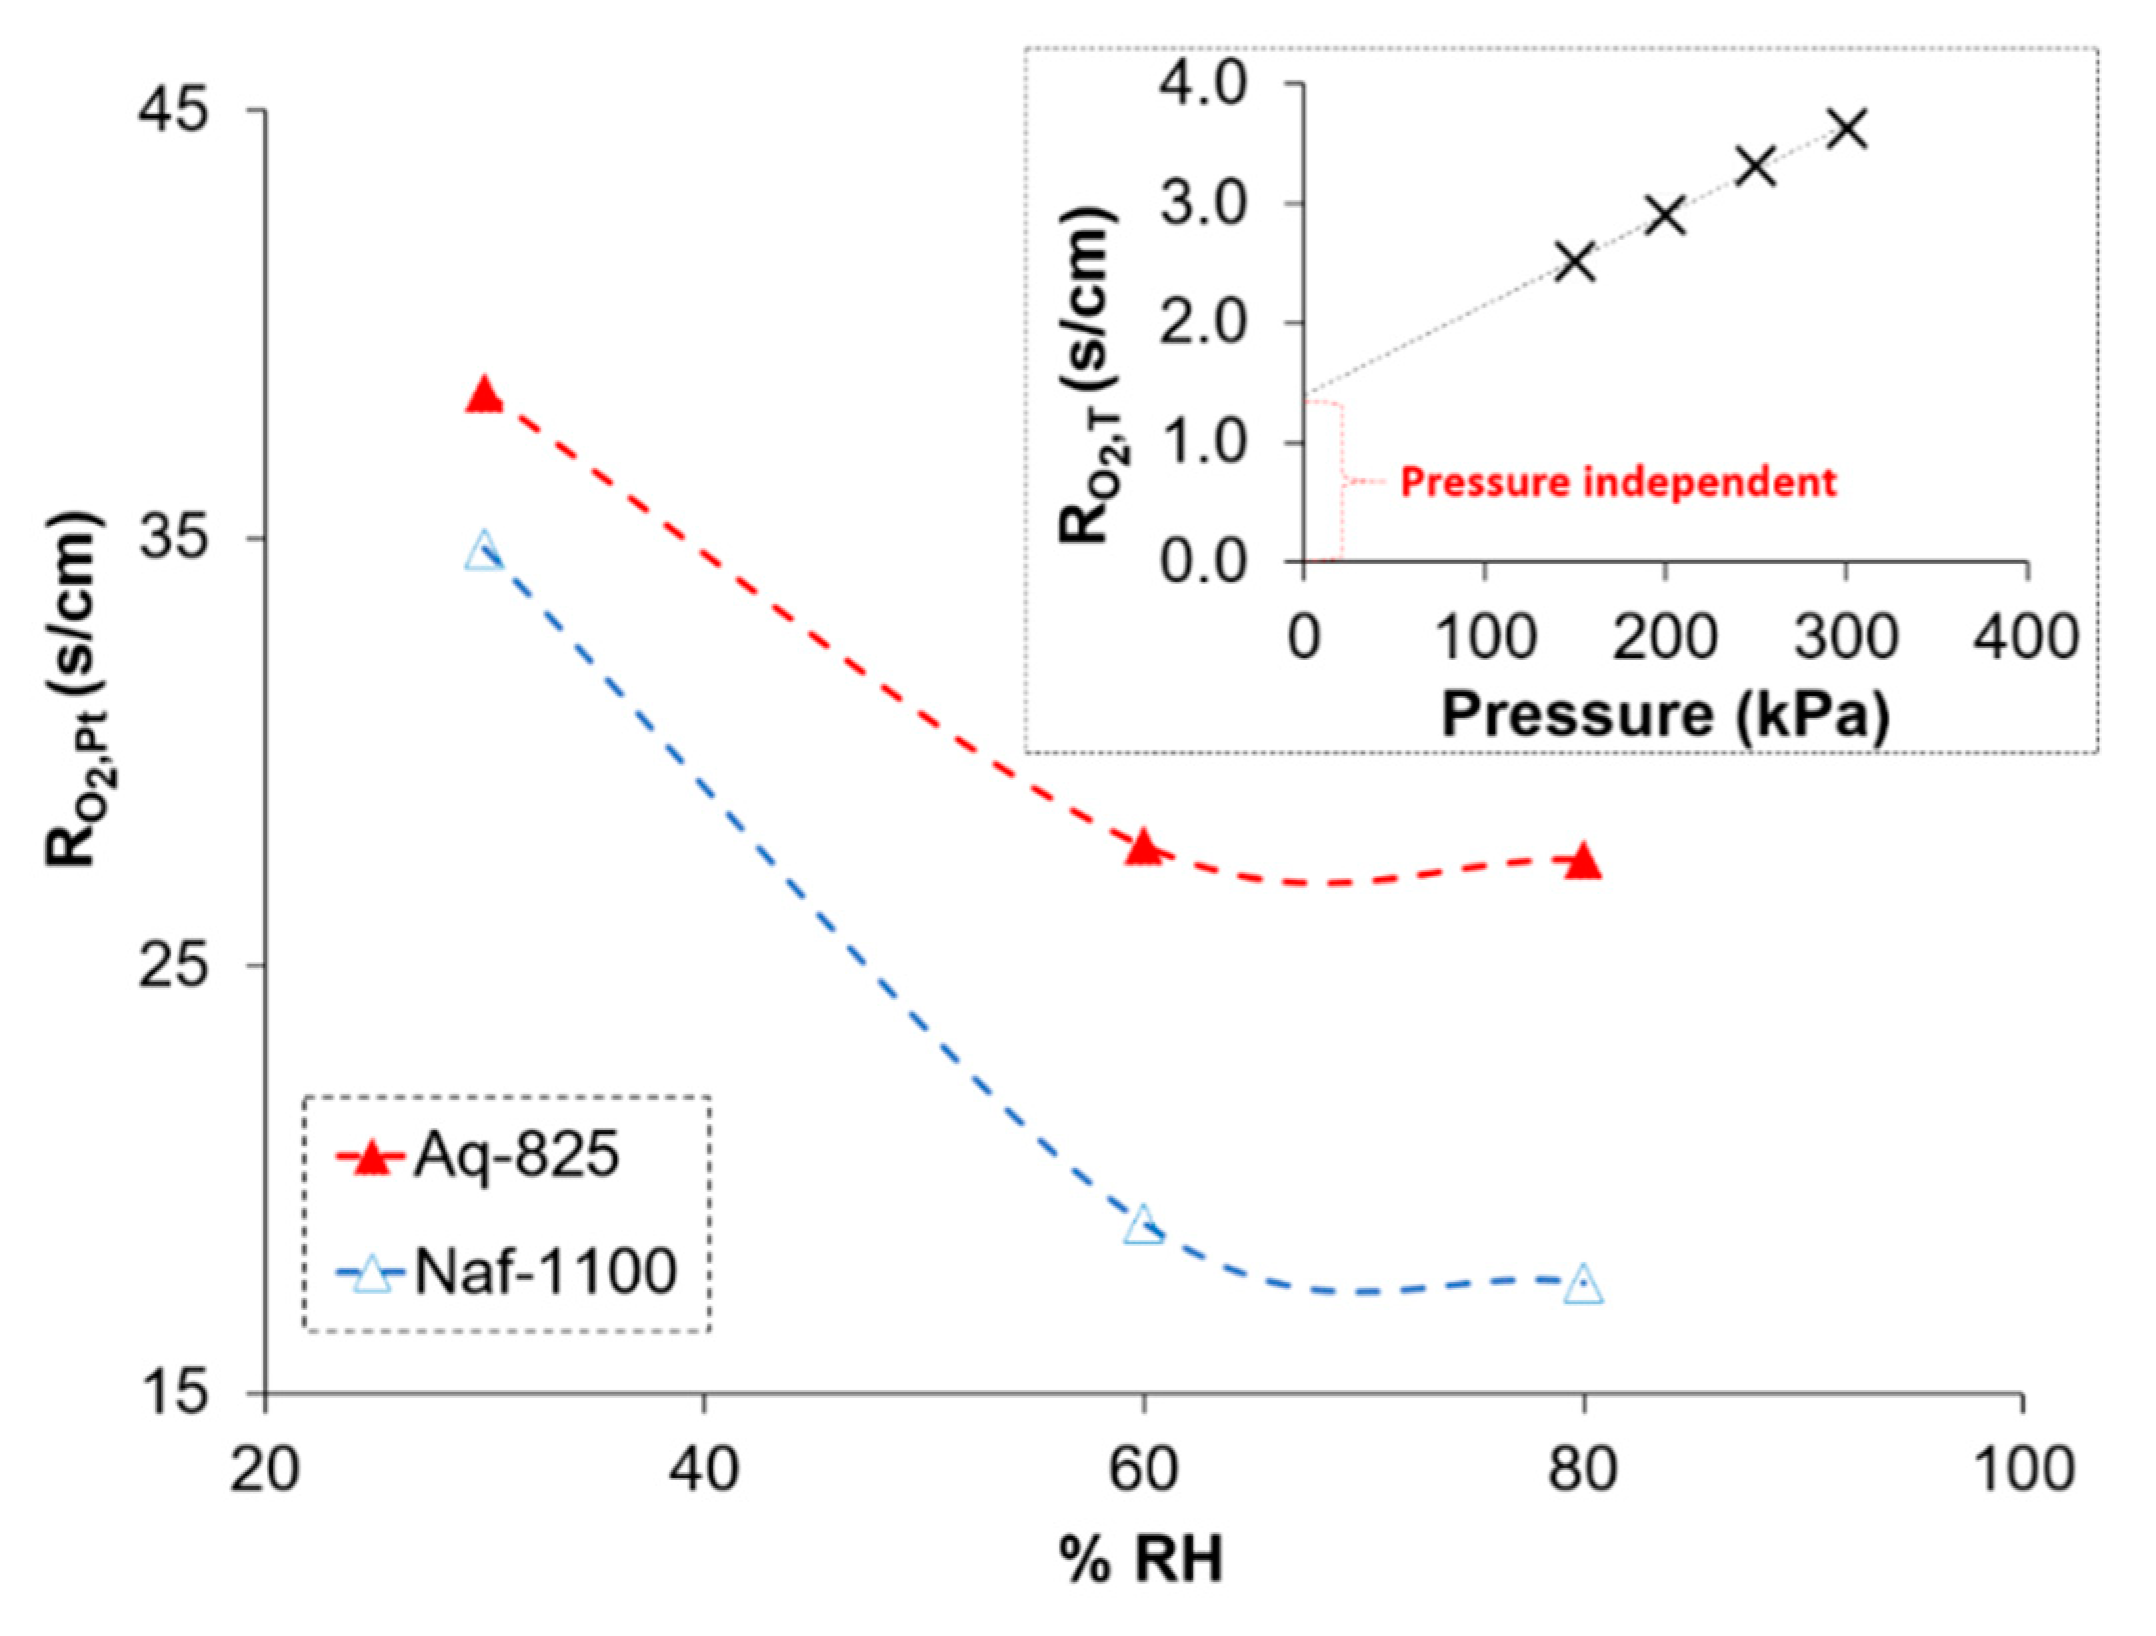
2.2. Oxygen Transport Resistance

3. Discussion
3.1. Pt Utilization
3.2. ORR Kinetics
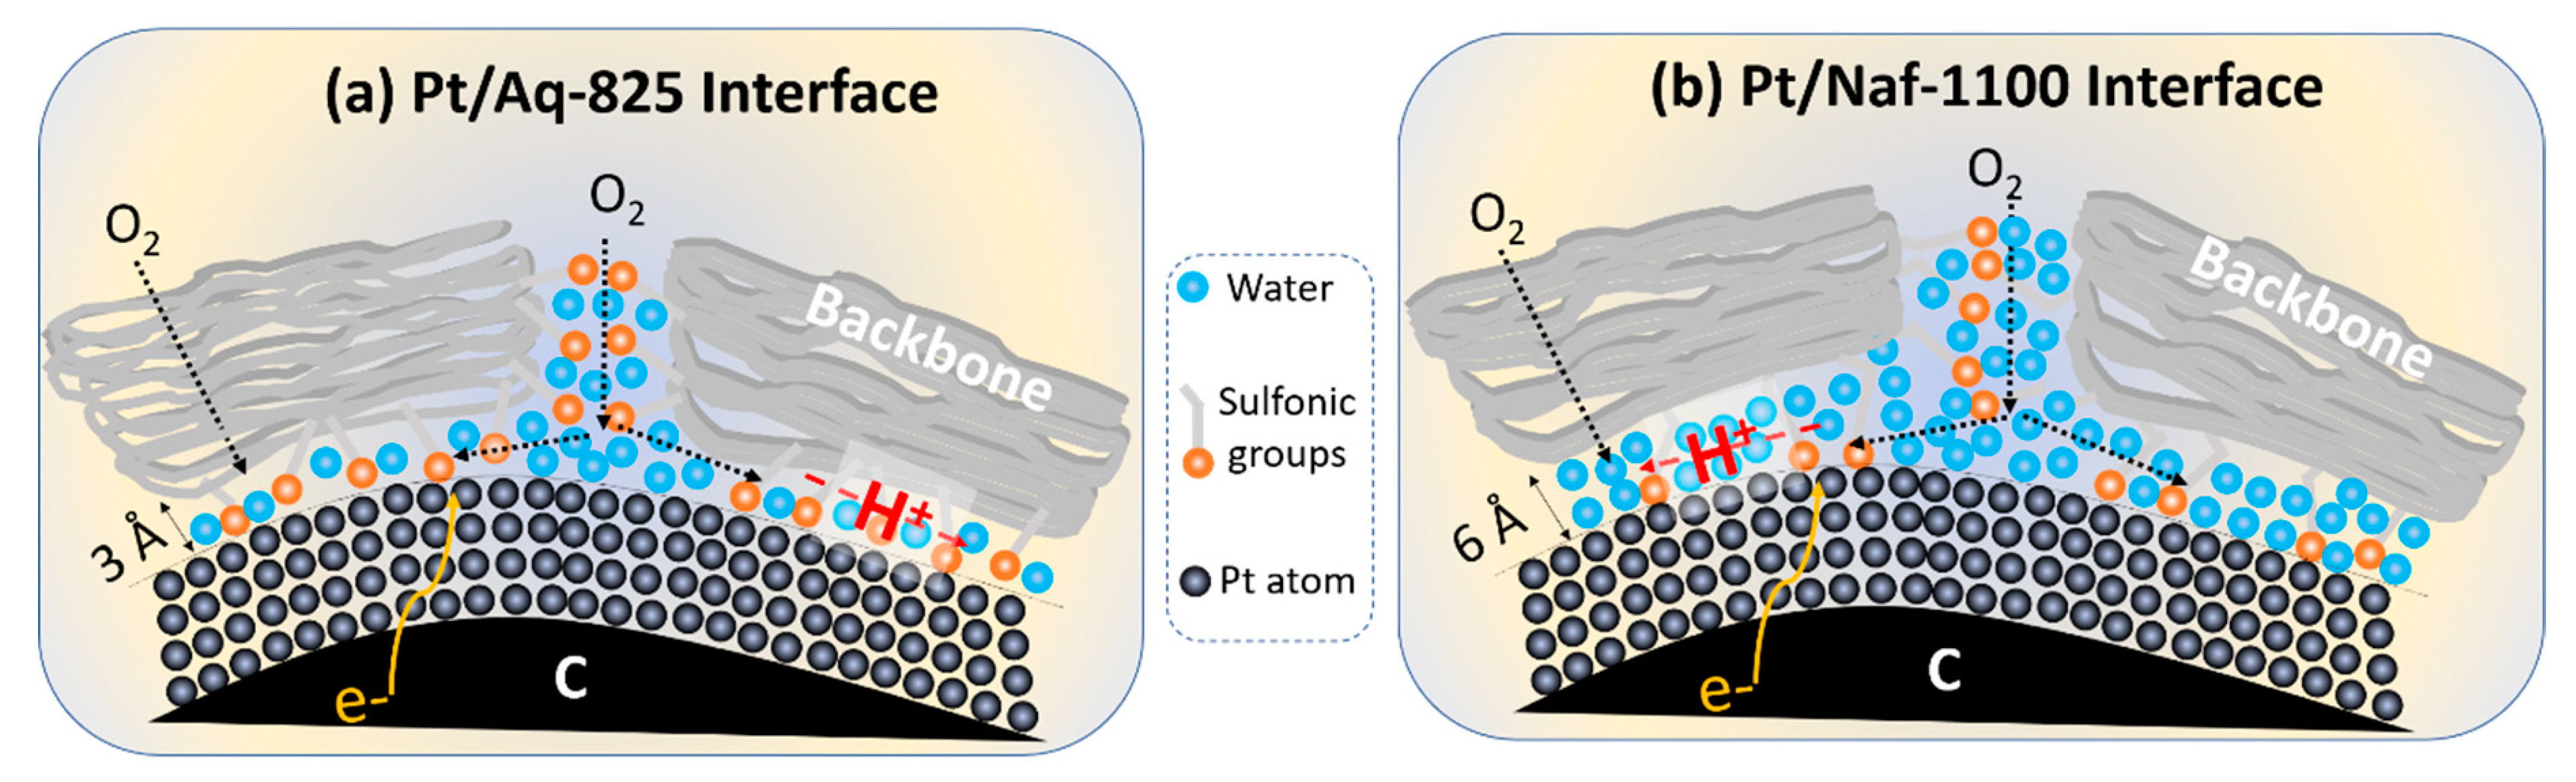
3.3. Oxygen Transport Resistance
4. Materials and Methods
4.1. Catalyst Ink Preparation
4.2. Membrane Electrode Assembly (MEA) Preparation
4.3. Fuel Cell Assembly and Testing
5. Conclusions
Author Contributions
Funding
Conflicts of Interest
References
- Uchida, M. PEFC catalyst layers: Effect of support microstructure on both distributions of Pt and ionomer and cell performance and durability. Curr. Opin. Electrochem. 2020. [Google Scholar] [CrossRef]
- Holdcroft, S. Fuel cell catalyst layers: A polymer science perspective. Chem. Mater. 2014, 26, 381–393. [Google Scholar] [CrossRef]
- Karan, K. PEFC catalyst layer: Recent advances in materials, microstructural characterization, and modeling. Curr. Opin. Electrochem. 2017, 5, 27–35. [Google Scholar] [CrossRef]
- Lopez-Haro, M.; Guétaz, L.; Printemps, T.; Morin, A.; Escribano, S.; Jouneau, P.-H.; Bayle-Guillemaud, P.; Chandezon, F.; Gebel, G. Three-dimensional analysis of Nafion layers in fuel cell electrodes. Nat. Commun. 2014, 5, 1–6. [Google Scholar] [CrossRef] [PubMed]
- Balogun, E.O.; Hussain, N.; Chamier, J.; Barendse, P. Performance and durability studies of perfluorosulfonic acid ionomers as binders in PEMFC catalyst layers using Electrochemical Impedance Spectroscopy. Int. J. Hydrog. Energy 2019, 44, 32219–32230. [Google Scholar] [CrossRef]
- Neyerlin, K.; Gu, W.; Jorne, J.; Clark, A.; Gasteiger, H.A. Cathode catalyst utilization for the ORR in a PEMFC analytical model and experimental validation. J. Electrochem. Soc. 2007, 154, 279–287. [Google Scholar] [CrossRef]
- Kodama, K.; Motobayashi, K.; Shinohara, A.; Hasegawa, N.; Kudo, K.; Jinnouchi, R.; Osawa, M.; Morimoto, Y. Effect of the Side-Chain Structure of Perfluoro-Sulfonic Acid Ionomers on the Oxygen Reduction Reaction on the Surface of Pt. Acs Catal. 2018, 8, 694–700. [Google Scholar] [CrossRef]
- Fukuyama, Y.; Shiomi, T.; Kotaka, T.; Tabuchi, Y. The impact of platinum reduction on oxygen transport in proton exchange membrane fuel cells. Electrochim. Acta 2014, 117, 367–378. [Google Scholar] [CrossRef]
- Greszler, T.A.; Caulk, D.; Sinha, P. The impact of platinum loading on oxygen transport resistance. J. Electrochem. Soc. 2012, 159, 831–840. [Google Scholar] [CrossRef]
- Gittleman, C.S.; Kongkanand, A.; Masten, D.; Gu, W. Materials research and development focus areas for low cost automotive proton-exchange membrane fuel cells. Curr. Opin. Electrochem. 2019, 18, 81–89. [Google Scholar] [CrossRef]
- Weber, A.Z.; Kusoglu, A. Unexplained transport resistances for low-loaded fuel-cell catalyst layers. J. Mater. Chem. A 2014, 2, 17207–17211. [Google Scholar] [CrossRef]
- Karan, K.; Shrivastava, U.N.; Fritzsche, H. Neutron Reflectometry Investigation of Near Ionomer/Catalyst Interface Structure in Polymer Electrolyte Based Energy Devices. Phys. Can. 2018, 74, 45–48. [Google Scholar]
- Paul, D.K.; McCreery, R.; Karan, K. Proton transport property in supported Nafion nanothin films by electrochemical impedance spectroscopy. J. Electrochem. Soc. 2014, 161, 1395–1402. [Google Scholar] [CrossRef]
- Shrivastava, U.N.; Fritzsche, H.; Karan, K. Interfacial and Bulk Water in Ultrathin Films of Nafion, 3M PFSA, and 3M PFIA Ionomers on a Polycrystalline Platinum Surface. Macromolecules 2018, 51, 9839–9849. [Google Scholar] [CrossRef]
- Shrivastava, U.N.; Suetsugu, K.; Nagano, S.; Fritzsche, H.; Nagao, Y.; Karan, K. Cross-correlated humidity-dependent structural evolution of Nafion thin films confined on a platinum substrate. Soft Matter 2020, 16, 1190–1200. [Google Scholar] [CrossRef] [PubMed]
- Karan, K. Interesting Facets of Surface, Interfacial, and Bulk Characteristics of Perfluorinated Ionomer Films. Langmuir 2019, 35, 13489–13520. [Google Scholar] [CrossRef]
- Kusoglu, A.; Dursch, T.J.; Weber, A.Z. Nanostructure/Swelling Relationships of Bulk and Thin-Film PFSA Ionomers. Adv. Funct. Mater. 2016, 26, 4961–4975. [Google Scholar] [CrossRef]
- Kusoglu, A.; Kushner, D.; Paul, D.K.; Karan, K.; Hickner, M.A.; Weber, A.Z. Impact of substrate and processing on confinement of Nafion thin films. Adv. Funct. Mater. 2014, 24, 4763–4774. [Google Scholar] [CrossRef]
- DeCaluwe, S.C.; Kienzle, P.A.; Bhargava, P.; Baker, A.M.; Dura, J.A. Phase segregation of sulfonate groups in Nafion interface lamellae, quantified via neutron reflectometry fitting techniques for multi-layered structures. Soft Matter 2014, 10, 5763–5776. [Google Scholar] [CrossRef]
- DeCaluwe, S.C.; Baker, A.M.; Bhargava, P.; Fischer, J.E.; Dura, J.A. Structure-property relationships at Nafion thin-film interfaces: Thickness effects on hydration and anisotropic ion transport. Nano Energy 2018, 46, 91–100. [Google Scholar] [CrossRef]
- Kusoglu, A.; Weber, A.Z. New insights into perfluorinated sulfonic-acid ionomers. Chem. Rev. 2017, 117, 987–1104. [Google Scholar] [CrossRef] [PubMed]
- Kudo, K.; Jinnouchi, R.; Morimoto, Y. Humidity and temperature dependences of oxygen transport resistance of Nafion thin film on platinum electrode. Electrochim. Acta 2016, 209, 682–690. [Google Scholar] [CrossRef]
- Kabir, S.; Myers, D.J.; Kariuki, N.; Park, J.; Wang, G.; Baker, A.; Macauley, N.; Mukundan, R.; More, K.L.; Neyerlin, K.C. Elucidating the Dynamic Nature of Fuel Cell Electrodes as a Function of Conditioning: An ex Situ Material Characterization and in Situ Electrochemical Diagnostic Study. Acs Appl. Mater. Interfaces 2019, 11, 45016–45030. [Google Scholar] [CrossRef] [PubMed]
- Paul, D.K.; Karan, K. Conductivity and wettability changes of ultrathin Nafion films subjected to thermal annealing and liquid water exposure. J. Phys. Chem. C 2014, 118, 1828–1835. [Google Scholar] [CrossRef]
- Padgett, E.; Andrejevic, N.; Liu, Z.; Kongkanand, A.; Gu, W.; Moriyama, K.; Jiang, Y.; Kumaraguru, S.; Moylan, T.E.; Kukreja, R. Connecting fuel cell catalyst nanostructure and accessibility using quantitative cryo-STEM tomography. J. Electrochem. Soc. 2018, 165, 173–180. [Google Scholar] [CrossRef]
- Dura, J.A.; Murthi, V.S.; Hartman, M.; Satija, S.K.; Majkrzak, C.F. Multilamellar interface structures in Nafion. Macromolecules 2009, 42, 4769–4774. [Google Scholar] [CrossRef]
- Xu, H.; Kunz, H.R.; Bonville, L.J.; Fenton, J.M. Improving PEMFC Performance Using Low Equivalent Weight PFSA Ionomers and Pt-Co∕ C Catalyst in the Cathode. J. Electrochem. Soc. 2007, 154, 271–278. [Google Scholar] [CrossRef]
- Lei, C.; Bessarabov, D.; Ye, S.; Xie, Z.; Holdcroft, S.; Navessin, T. Low equivalent weight short-side-chain perfluorosulfonic acid ionomers in fuel cell cathode catalyst layers. J. Power Sources 2011, 196, 6168–6176. [Google Scholar] [CrossRef]
- Park, Y.-C.; Kakinuma, K.; Uchida, H.; Watanabe, M.; Uchida, M. Effects of short-side-chain perfluorosulfonic acid ionomers as binders on the performance of low Pt loading fuel cell cathodes. J. Power Sources 2015, 275, 384–391. [Google Scholar] [CrossRef]
- Garsany, Y.; Atkinson, R.W.; Sassin, M.B.; Hjelm, R.M.; Gould, B.D.; Swider-Lyons, K.E. Improving PEMFC performance using short-side-chain low-equivalent-weight PFSA ionomer in the cathode catalyst layer. J. Electrochem. Soc. 2018, 165, 381–391. [Google Scholar] [CrossRef]
- Ono, Y.; Ohma, A.; Shinohara, K.; Fushinobu, K. Influence of equivalent weight of ionomer on local oxygen transport resistance in cathode catalyst layers. J. Electrochem. Soc. 2013, 160, 779–787. [Google Scholar] [CrossRef]
- Jomori, S.; Komatsubara, K.; Nonoyama, N.; Kato, M.; Yoshida, T. An experimental study of the effects of operational history on activity changes in a PEMFC. J. Electrochem. Soc. 2013, 160. [Google Scholar] [CrossRef]
- Smith, C.P.; White, H.S. Theory of the interfacial potential distribution and reversible voltammetric response of electrodes coated with electroactive molecular films. Anal. Chem. 1992, 64, 2398–2405. [Google Scholar] [CrossRef] [PubMed]
- Makharia, R.; Mathias, M.F.; Baker, D.R. Measurement of catalyst layer electrolyte resistance in PEFCs using electrochemical impedance spectroscopy. J. Electrochem. Soc. 2005, 152, 970–977. [Google Scholar] [CrossRef]
- Liu, Y.; Murphy, M.W.; Baker, D.R.; Gu, W.; Ji, C.; Jorne, J.; Gasteiger, H.A. Proton conduction and oxygen reduction kinetics in PEM fuel cell cathodes: Effects of ionomer-to-carbon ratio and relative humidity. J. Electrochem. Soc. 2009, 156, 970–980. [Google Scholar] [CrossRef]
- Damjanovic, A.; Brusic, V. Electrode kinetics of oxygen reduction on oxide-free platinum electrodes. Electrochim. Acta 1967, 12, 615–628. [Google Scholar] [CrossRef]
- Garrick, T.R.; Moylan, T.E.; Yarlagadda, V.; Kongkanand, A. Characterizing electrolyte and platinum interface in PEM fuel cells using CO displacement. J. Electrochem. Soc. 2017, 164, 60–64. [Google Scholar] [CrossRef]
- Baker, D.R.; Caulk, D.A.; Neyerlin, K.C.; Murphy, M.W. Measurement of oxygen transport resistance in PEM fuel cells by limiting current methods. J. Electrochem. Soc. 2009, 156, 991–1003. [Google Scholar] [CrossRef]
- Ostadi, H.; Rama, P.; Liu, Y.; Chen, R.; Zhang, X.; Jiang, K. 3D reconstruction of a gas diffusion layer and a microporous layer. J. Membr. Sci. 2010, 351, 69–74. [Google Scholar] [CrossRef]
- Chun, J.H.; Park, K.T.; Jo, D.H.; Lee, J.Y.; Kim, S.G.; Lee, E.S.; Jyoung, J.-Y.; Kim, S.H. Determination of the pore size distribution of micro porous layer in PEMFC using pore forming agents under various drying conditions. Int. J. Hydrog. Energy 2010, 35, 11148–11153. [Google Scholar] [CrossRef]
- Sabharwal, M.; Pant, L.; Putz, A.; Susac, D.; Jankovic, J.; Secanell, M. Analysis of catalyst layer microstructures: From imaging to performance. Fuel Cells 2016, 16, 734–753. [Google Scholar] [CrossRef]
- Kurihara, Y.; Mabuchi, T.; Tokumasu, T. Molecular analysis of structural effect of ionomer on oxygen permeation properties in PEFC. J. Electrochem. Soc. 2017, 164, 628–637. [Google Scholar] [CrossRef]
- Yagi, I.; Inokuma, K.; Kimijima, K.i.; Notsu, H. Molecular structure of buried perfluorosulfonated ionomer/Pt interface probed by vibrational sum frequency generation spectroscopy. J. Phys. Chem. C 2014, 118, 26182–26190. [Google Scholar] [CrossRef]
- Shrivastava, U.N.; Tajiri, K. Sources of current density distribution in the land-channel direction of a pemfc. J. Electrochem. Soc. 2016, 163, 1072–1083. [Google Scholar] [CrossRef]
- Shrivastava, U.N.; Tajiri, K.; Chase, M. Current density and ohmic resistance distribution in the land-channel direction of a proton exchange membrane fuel cell. J. Power Sources 2015, 299, 189–194. [Google Scholar] [CrossRef]
- Caulk, D.A.; Baker, D.R. Heat and water transport in hydrophobic diffusion media of PEM fuel cells. J. Electrochem. Soc. 2010, 157, 1237–1244. [Google Scholar] [CrossRef]


| Catalyst Layer Type | CL Thickness (µm) | Pt Loading (mgPt/cm2geo) | Ionomer Loading (wt%) | Ionomer Loading (mg/cm2geo) |
|---|---|---|---|---|
| Nafion | 11 ± 1 | 0.043 | 42.07 | 0.34 |
| Aquivion | 10 ± 1 | 0.036 | 42.04 | 0.28 |
| Step # | Test | Tcell (°C) | Thum (°C) | Flow Rate An/Ca (NLPM) | Reactant Gas An/Ca | Back Pressure (kPag) | Time (hrs) |
|---|---|---|---|---|---|---|---|
| 1 | H2 pumping | 30 | 45 | 0.5/0.5 | H2/H2 | 0 | 0.5 |
| 2 | Flooding | 60 | 70 | 0.05/0.1 | H2/N2 | 50 | 8–12 |
| 3 | 0.6 V hold | 70 | 70 | 0.3/0.5 | H2/O2 | 200 | 12 |
| 4 | Potential cycling (0.6–0.8 V) | 70 | 70 | 0.3/0.5 | H2/O2 | 50 | Holding 5 min at each potential |
| Test | Tcell (°C) | RH (%) | Flow Rate An/Ca (NLPM) | Reactant Gas An/Ca | Back Pressure (kPag) |
|---|---|---|---|---|---|
| Diagnostics (CV, LSV, EIS) | 70 | 30, 45, 60, and 100 | 0.1/0.2 | H2/N2 | 50 |
| Performance | 0.3/0.5 | H2/Air | |||
| Limiting current | 30, 60, and 80 | 0.2/0.5 | H2/O2 (1–24%):N2 | 50, 100, 150, and 200 |
© 2020 by the authors. Licensee MDPI, Basel, Switzerland. This article is an open access article distributed under the terms and conditions of the Creative Commons Attribution (CC BY) license (http://creativecommons.org/licenses/by/4.0/).
Share and Cite
Poojary, S.; Islam, M.N.; Shrivastava, U.N.; Roberts, E.P.L.; Karan, K. Transport and Electrochemical Interface Properties of Ionomers in Low-Pt Loading Catalyst Layers: Effect of Ionomer Equivalent Weight and Relative Humidity. Molecules 2020, 25, 3387. https://doi.org/10.3390/molecules25153387
Poojary S, Islam MN, Shrivastava UN, Roberts EPL, Karan K. Transport and Electrochemical Interface Properties of Ionomers in Low-Pt Loading Catalyst Layers: Effect of Ionomer Equivalent Weight and Relative Humidity. Molecules. 2020; 25(15):3387. https://doi.org/10.3390/molecules25153387
Chicago/Turabian StylePoojary, Sushmit, Muhammad Naoshad Islam, Udit N. Shrivastava, Edward P. L. Roberts, and Kunal Karan. 2020. "Transport and Electrochemical Interface Properties of Ionomers in Low-Pt Loading Catalyst Layers: Effect of Ionomer Equivalent Weight and Relative Humidity" Molecules 25, no. 15: 3387. https://doi.org/10.3390/molecules25153387
APA StylePoojary, S., Islam, M. N., Shrivastava, U. N., Roberts, E. P. L., & Karan, K. (2020). Transport and Electrochemical Interface Properties of Ionomers in Low-Pt Loading Catalyst Layers: Effect of Ionomer Equivalent Weight and Relative Humidity. Molecules, 25(15), 3387. https://doi.org/10.3390/molecules25153387