
A Mass Spectrometry-Based Approach for Characterization of Red, Blue, and Purple Natural Dyes


Abstract
1. Introduction
2. Results and Discussion
2.1. Dyes
2.1.1. Indigo
2.1.2. Scale Insect Dyes
2.1.3. Madder
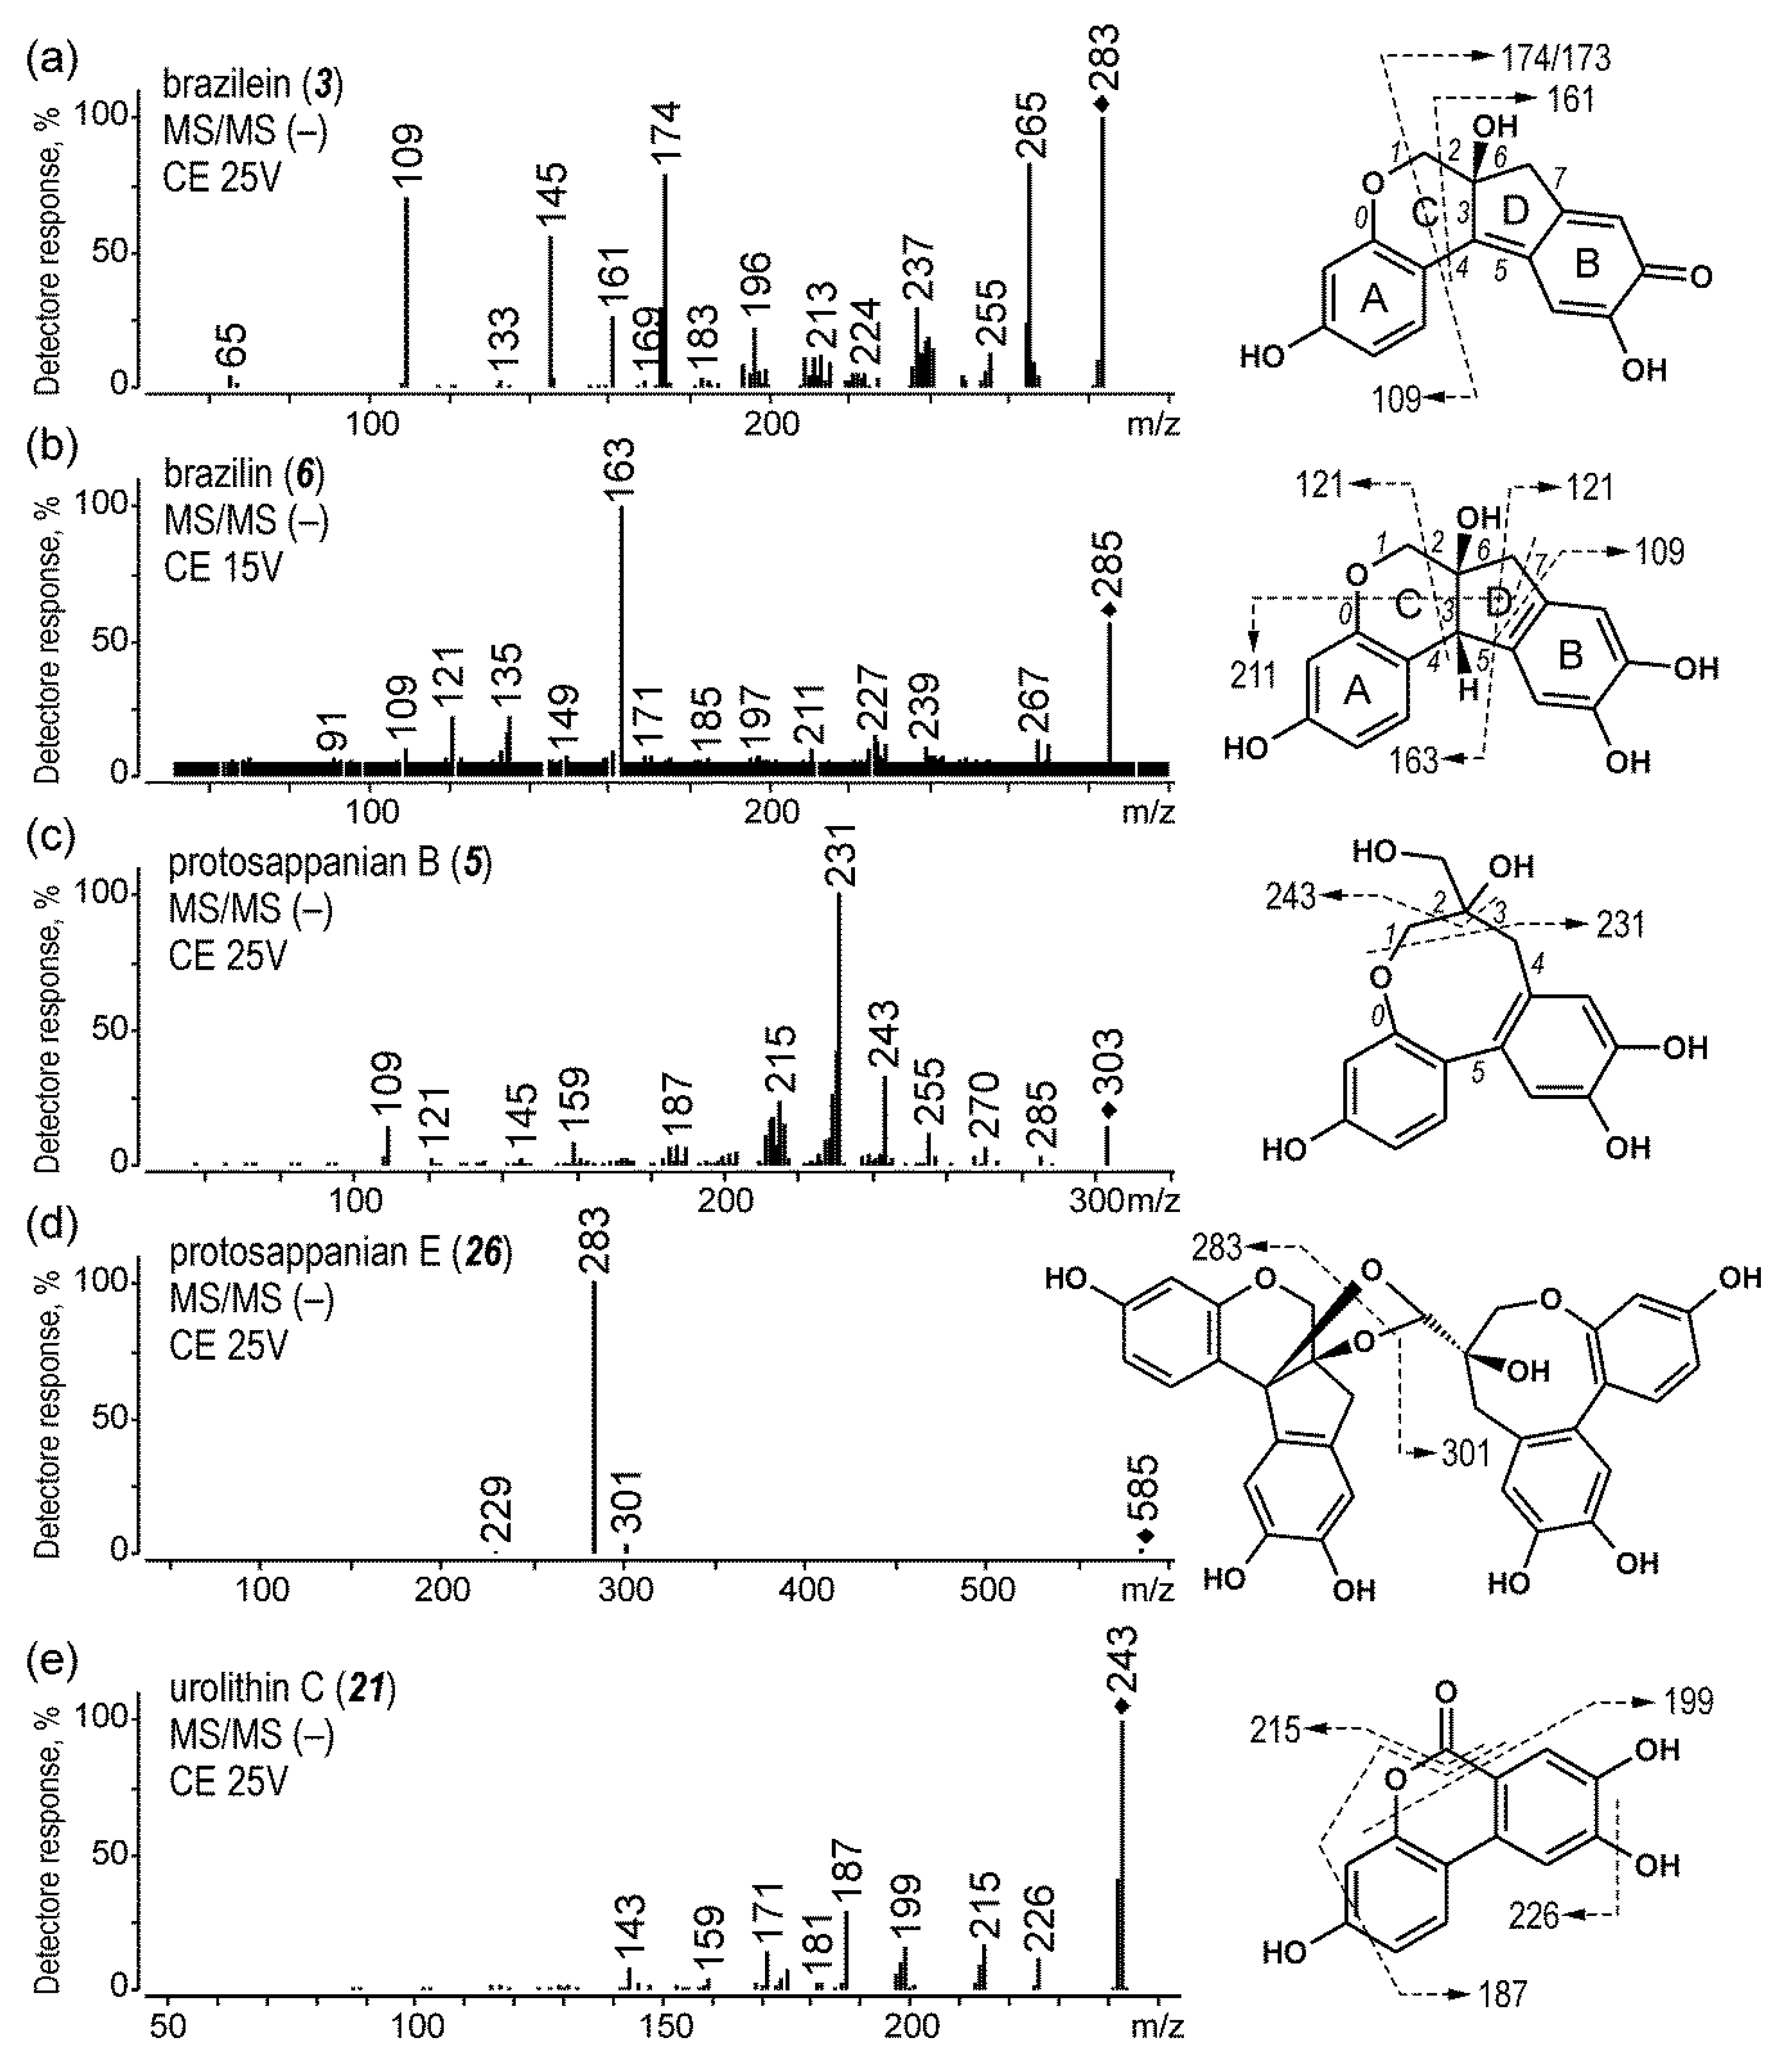
2.1.4. Brazilwood
2.1.5. Logwood
2.1.6. Sandalwood
2.1.7. Orchil
2.2. Protocol for Analyzing Historical Samples
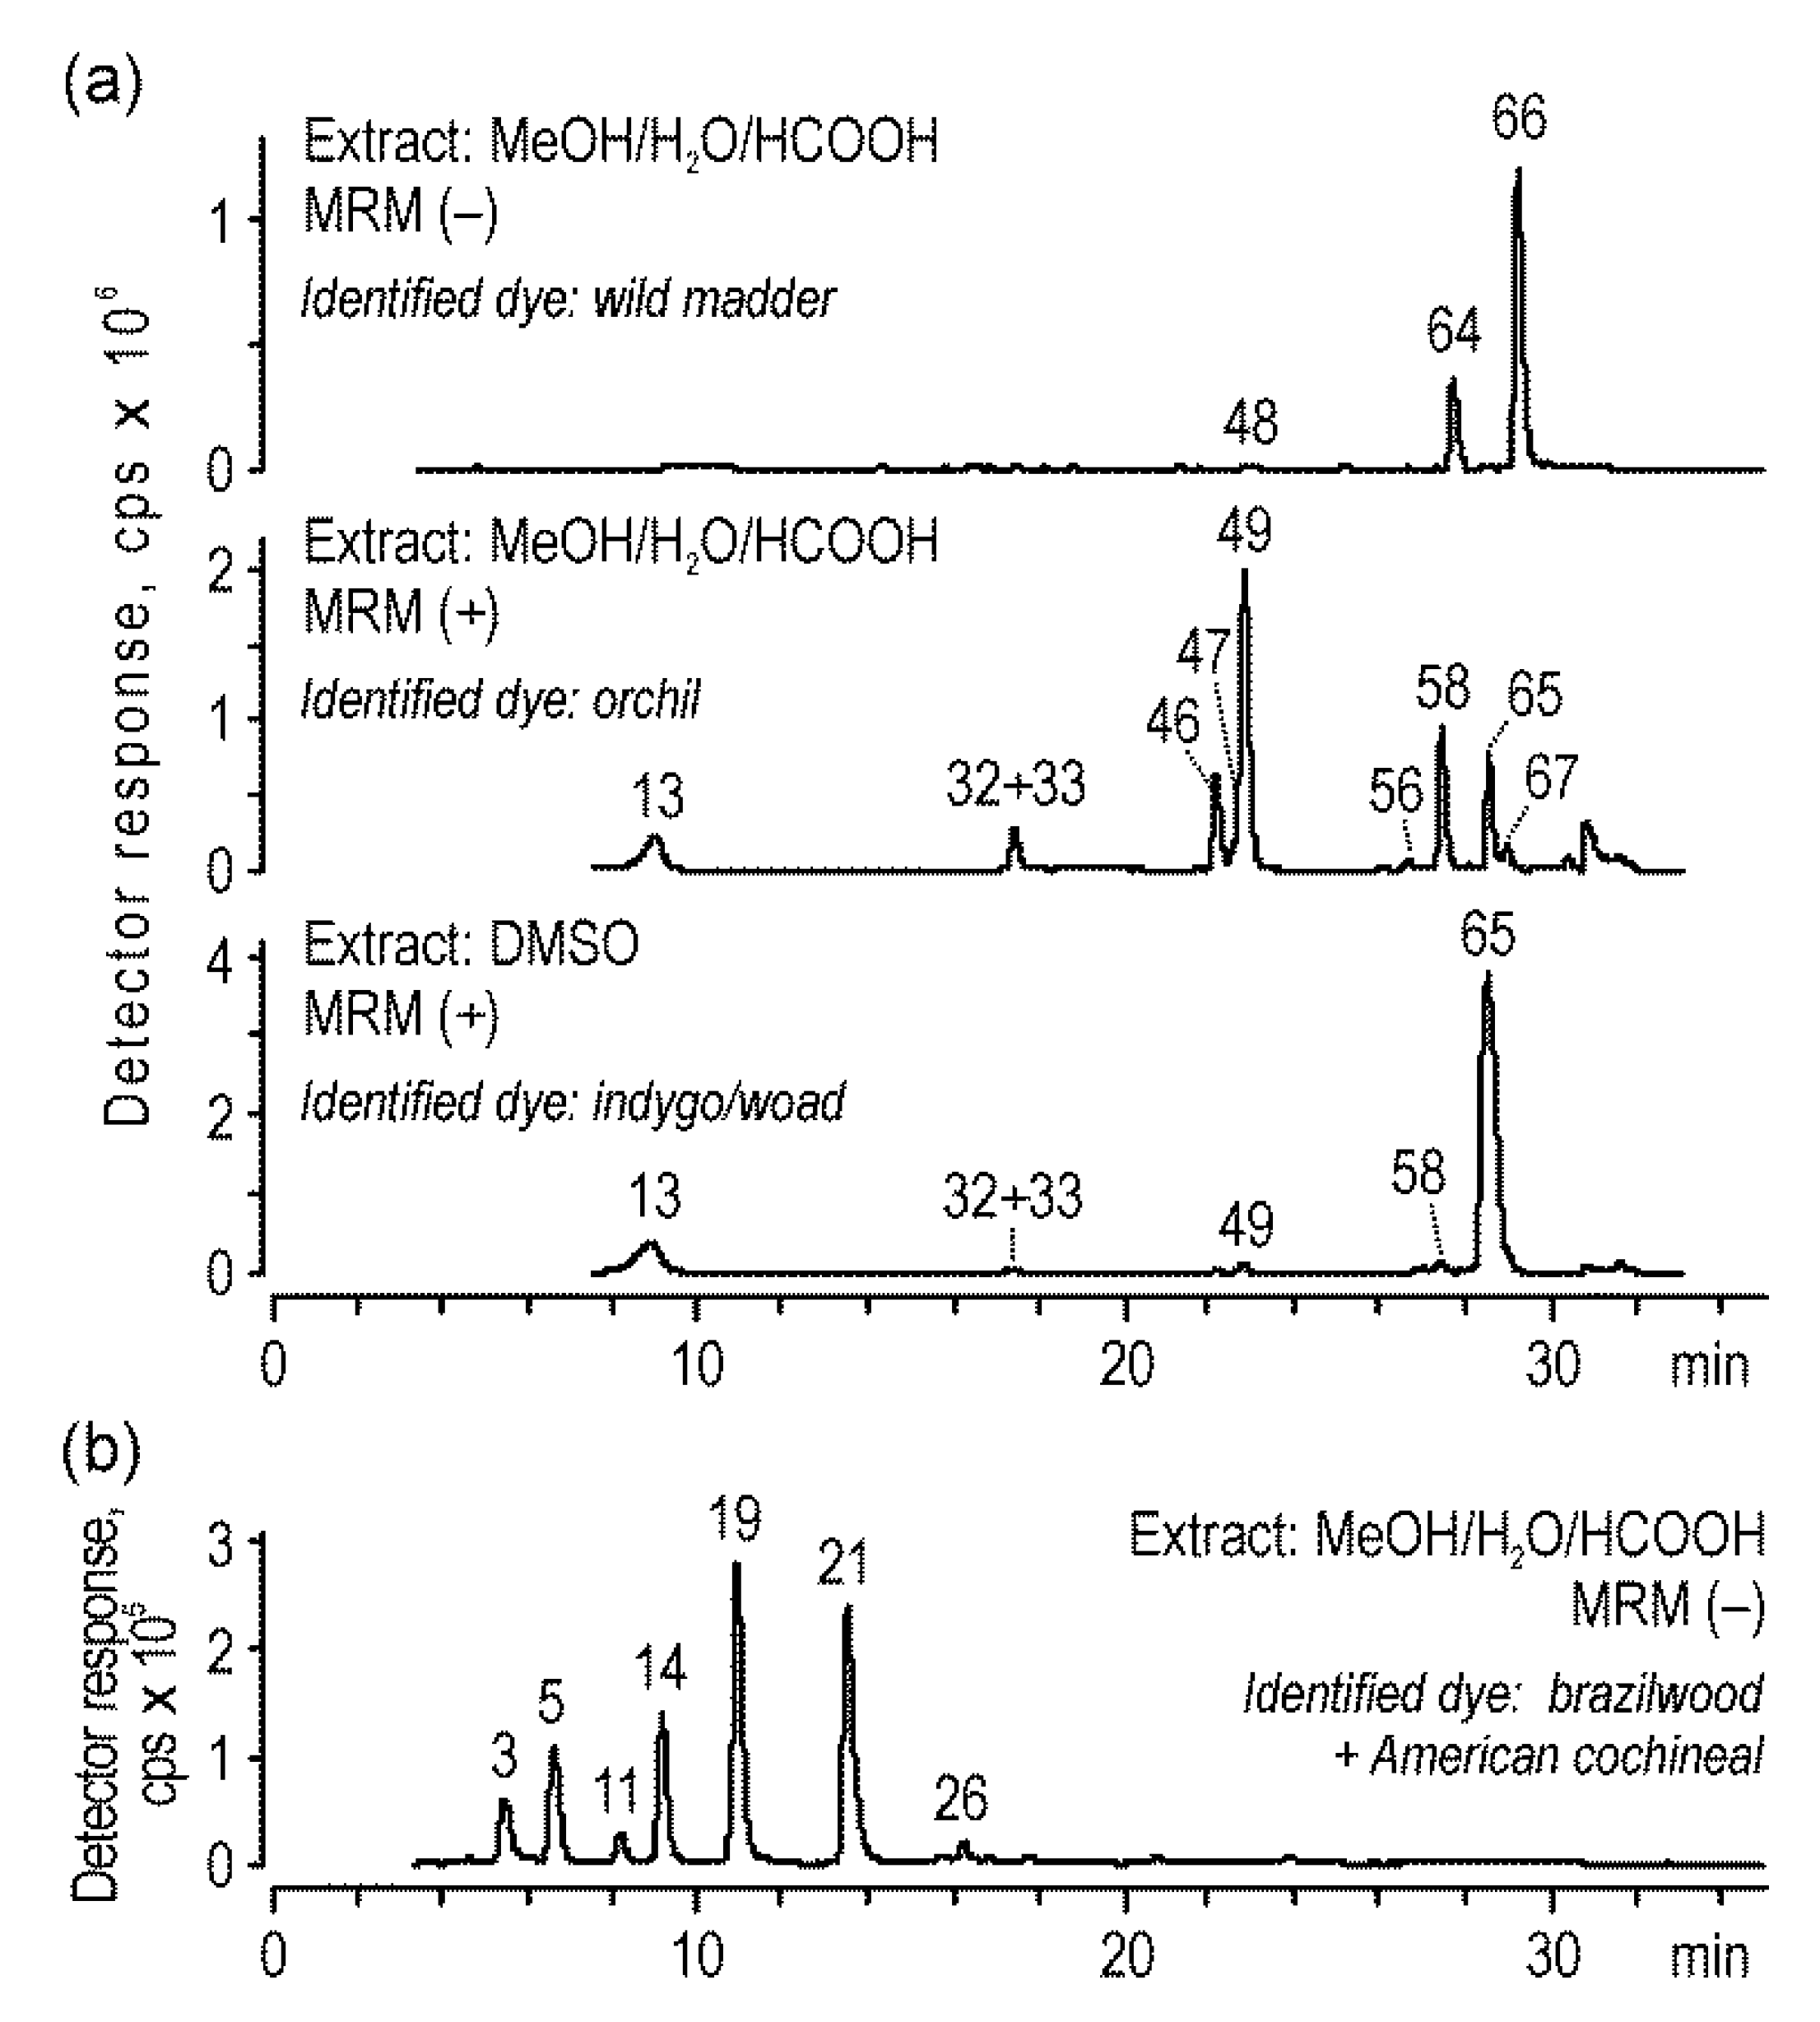
2.3. Analysis of Historical Samples
3. Materials and Methods
4. Conclusions
Supplementary Materials
Author Contributions
Funding
Acknowledgments
Conflicts of Interest
References
- Pauk, V.; Barták, P.; Lemr, K. Characterization of natural organic colorants in historical and art objects by high-performance liquid chromatography. J. Sep. Sci. 2014, 37, 3393–3410. [Google Scholar] [CrossRef] [PubMed]
- Degano, I.; Ribechini, E.; Modugno, F.; Colombini, M.P. Analytical methods for the characterization of organic dyes in artworks and in historical textiles. Appl. Spectrosc. Rev. 2009, 44, 363–410. [Google Scholar] [CrossRef]
- Surowiec, I. Application of high-performance separation techniques in archaeometry. Microchim. Acta. 2008, 162, 289–302. [Google Scholar] [CrossRef]
- Puchalska, M.; Polec-Pawlak, K.; Zadrozna, I.; Hryszko, H.; Jarosz, M. Identification of indigoid dyes in natural organic pigments used in historical art objects by high-performance liquid chromatography coupled to electrospray ionization mass spectrometry. J. Mass Spectrom. 2004, 39, 1441–1449. [Google Scholar] [CrossRef] [PubMed]
- Pawlak, K.; Puchalska, M.; Miszczak, A.; Rosłoniec, E.; Jarosz, M. Blue natural organic dyestuffs—Front textile dyeing to mural painting. Separation and characterization of coloring matters present in elderberry, logwood and indigo. J. Mass Spectrom. 2006, 41, 613–622. [Google Scholar] [CrossRef] [PubMed]
- Surowiec, I.; Szostek, B.; Trojanowicz, M. HPLC-MS of anthraquinoids, flavonoids, and their degradation products in analysis of natural dyes in archeological objects. J. Sep. Sci. 2007, 30, 2070–2079. [Google Scholar] [CrossRef]
- Degano, I.; Biesaga, M.; Colombini, M.P.; Trojanowicz, M. Historical and archaeological textiles: An insight on degradation products of wool and silk yarns. J. Chromatogr. A 2011, 1218, 5837–5847. [Google Scholar] [CrossRef]
- Lech, K.; Jarosz, M. Novel methodology for the extraction and identification of natural dyestuffs in historical textiles by HPLC-UV-Vis-ESI MS. Case study: Chasubles from the Wawel Cathedral collection. Anal. Bioanal. Chem. 2011, 399, 3241–3251. [Google Scholar] [CrossRef]
- Mantzouris, D.; Karapanagiotis, I.; Valianou, L.; Panayiotou, C. HPLC-DAD-MS analysis of dyes identified in textiles from Mount Athos. Anal. Bioanal. Chem. 2011, 399, 3065–3079. [Google Scholar] [CrossRef]
- Liu, J.; Mouri, C.; Laursen, R.; Zhao, F.; Zhou, Y.; Li, W. Characterization of dyes in ancient textiles from Yingpan, Xinjiang. J. Archaeol. Sci. 2013, 40, 4444–4449. [Google Scholar] [CrossRef]
- Manhita, A.; Balcaen, L.; Vanhaecke, F.; Ferreira, T.; Candeias, A.; Dias, C.B. Unveiling the colour palette of Arraiolos carpets: Material study of carpets from the 17th to 19th century period by HPLC-DAD-MS and ICP-MS. J. Cult. Herit. 2014, 15, 292–299. [Google Scholar] [CrossRef]
- Witkos, K.; Lech, K.; Jarosz, M. Identification of degradation products of indigoids by tandem mass spectrometry. J. Mass Spectrom 2015, 50, 1245–1251. [Google Scholar] [CrossRef] [PubMed]
- Otłowska, O.; Slebioda, M.; Kot-Wasik, A.; Karczewski, J.; Sliwka-Kaszynska, M. Chromatographic and spectroscopic identification and recognition of natural dyes, uncommon dyestuff components, and mordants: Case study of a 16th century carpet with chintamani motifs. Molecules 2018, 23, 339. [Google Scholar] [CrossRef] [PubMed]
- Orska-Gawryś, J.; Surowiec, I.; Kehl, J.; Rejniak, H.; Urbaniak-Walczak, K.; Trojanowicz, M. Identification of natural dyes in archeological Coptic textiles by liquid chromatography with diode array detection. J. Chromatogr. A 2003, 989, 239–248. [Google Scholar] [CrossRef]
- Blanc, R.; Espejo, T.; López-Montes, A.; Torres, D.; Crovetto, G.; Navalón, A.; Vílchez, J.L. Sampling and identification of natural dyes in historical maps and drawings by liquid chromatography with diode-array detection. J. Chromatogr. A 2006, 1122, 105–113. [Google Scholar] [CrossRef]
- Surowiec, I.; Quye, A.; Trojanowicz, M. Liquid chromatography determination of natural dyes in extracts from historical Scottish textiles excavated from peat bogs. J. Chromatogr. A 2006, 1112, 209–217. [Google Scholar] [CrossRef]
- Wouters, J.; Grzywacz, C.M.; Claro, A. A comparative investigation of hydrolysis methods to analyze natural organic dyes by HPLC-PDA: Nine methods, twelve biological sources, ten dye classes, dyed yarns, pigments and paints. Stud. Conserv 2011, 56, 231–249. [Google Scholar] [CrossRef]
- Deveoglu, O.; Torgan, E.; Karadag, R. Identification by RP-HPLC-DAD of natural dyestuffs from lake pigments prepared with a mixture of weld and dyer’s oak dye plants. J. Liq. Chromatogr. Relat. Technol. 2012, 35, 331–342. [Google Scholar] [CrossRef]
- Petroviciu, I.; Vanden Berghe, I.; Cretu, I.; Albu, F.; Medvedovici, A. Identification of natural dyes in historical textiles from Romanian collections by LC-DAD and LC-MS (single stage and tandem MS). J. Cult. Herit. 2012, 13, 89–97. [Google Scholar] [CrossRef]
- Karpova, E.; Vasiliev, V.; Mamatyuk, V.; Polosmak, N.; Kundo, L. Xiongnu burial complex: A study of ancient textiles from the 22nd Noin-Ula barrow (Mongolia, first century AD). J. Archaeol. Sci. 2016, 70, 15–22. [Google Scholar] [CrossRef]
- Ahmed, H.E.; Tahoun, I.F.; Elkholy, I.; Shehata, A.B.; Ziddan, Y. Identification of natural dyes in rare Coptic textile using HPLC- DAD and mass spectroscopy in museum of Faculty of Arts, Alexandria University, Egypt. Dye. Pigment. 2017, 145, 486–492. [Google Scholar] [CrossRef]
- Tamburini, D. Investigating Asian colourants in Chinese textiles from Dunhuang (7th-10th century AD) by high performance liquid chromatography tandem mass spectrometry – Towards the creation of a mass spectra database. Dye. Pigment. 2019, 163, 454–474. [Google Scholar] [CrossRef]
- Lech, K.; Witkos, K.; Jarosz, M. HPLC-UV-ESI MS/MS identification of the color constituents of sawwort (Serratula tinctoria L.). Anal. Bioanal. Chem. 2014, 406, 3703–3708. [Google Scholar] [CrossRef] [PubMed]
- Lech, K.; Witkos, K.; Wilenska, B.; Jarosz, M. Identification of unknown colorants in pre-Columbian textiles dyed with American cochineal (Dactylopius coccus Costa) using high-performance liquid chromatography and tandem mass spectrometry. Anal. Bioanal. Chem. 2015, 407, 855–867. [Google Scholar] [CrossRef] [PubMed]
- Lech, K.; Jarosz, M. Identification of Polish cochineal (Porphyrophora polonica L.) in historical textiles by high-performance liquid chromatography coupled with spectrophotometric and tandem mass spectrometric detection. Anal. Bioanal. Chem. 2016, 408, 3349–3358. [Google Scholar] [CrossRef]
- Dabrowski, D.; Lech, K.; Jarosz, M. Capillary-HPLC with tandem mass spectrometry in analysis of alkaloid dyestuffs - a new approach. Electrophoresis 2018, 39, 1276–1283. [Google Scholar] [CrossRef]
- Domon, B.; Costello, C.E. A systematic nomenclature for carbohydrate fragmentations in FAB-MS/MS spectra of glycoconjugates. Glycoconj. J. 1988, 5, 397–409. [Google Scholar] [CrossRef]
- Cuyckens, F.; Claeys, M. Mass spectrometry in the structural analysis of flavonoids. J. Mass Spectrom. 2004, 39, 1–15. [Google Scholar] [CrossRef] [PubMed]
- Demarque, D.P.; Crotti, A.E.; Vessecchi, R.; Lopes, J.L.; Lopes, N.P. Fragmentation reactions using electrospray ionization mass spectrometry: An important tool for the structural elucidation and characterization of synthetic and natural products. Nat. Prod. Rep. 2016, 33, 432–455. [Google Scholar] [CrossRef] [PubMed]
- Poulin, J. A New Methodology for the characterisation of natural dyes on museum objects using gas chromatography–mass spectrometry. Stud. Conserv. 2018, 63, 36–61. [Google Scholar] [CrossRef]
- Puchalska, M.; Orlinska, M.; Ackacha, M.A.; Polec-Pawlak, K.; Jarosz, M. Identification of anthraquinone coloring matters in natural red dyes by electrospray mass spectrometry coupled to capillary electrophoresis. J. Mass Spectrom. 2003, 38, 1252–1258. [Google Scholar] [CrossRef]
- Lopez-Montes, A.; Blanc Garcia, R.; Espejo, T.; Huertas-Perez, J.F.; Navalon, A.; Vilchez, J.L. Simultaneous identification of natural dyes in the collection of drawings and maps from The Royal Chancellery Archives in Granada (Spain) by CE. Electrophoresis 2007, 28, 1243–1251. [Google Scholar] [CrossRef] [PubMed]
- Witkowski, B.; Ganeczko, M.; Hryszko, H.; Stachurska, M.; Gierczak, T.; Biesaga, M. Identification of orcein and selected natural dyes in 14th and 15th century liturgical paraments with high-performance liquid chromatography coupled to the electrospray ionization tandem mass spectrometry (HPLC-ESI/MS/MS). Microchem. J. 2017, 133, 370–379. [Google Scholar] [CrossRef]
- Calà, E.; Benzi, M.; Gosetti, F.; Zanin, A.; Gulmini, M.; Idone, A.; Serafini, I.; Ciccola, A.; Curini, R.; Whitworth, I.; et al. Towards the identification of the lichen species in historical orchil dyes by HPLC-MS/MS. Microchem. J. 2019, 150, 104140. [Google Scholar] [CrossRef]
- Serafini, I.; Lombardi, L.; Fasolato, C.; Sergi, M.; Di Ottavio, F.; Sciubba, F.; Montesano, C.; Guiso, M.; Costanza, R.; Nucci, L.; et al. A new multi analytical approach for the identification of synthetic and natural dyes mixtures. The case of orcein-mauveine mixture in a historical dress of a Sicilian noblewoman of nineteenth century. Nat. Prod. Res. 2019, 33, 1040–1051. [Google Scholar] [CrossRef]
- Peggie, D.A.; Kirby, J.; Poulin, J.; Genuit, W.; Romanuka, J.; Wills, D.F.; De Simone, A.; Hulme, A.N. Historical mystery solved: A multi-analytical approach to the identification of a key marker for the historical use of brazilwood (Caesalpinia spp.) in paintings and textiles. Anal. Methods 2018, 10, 617–623. [Google Scholar] [CrossRef]
- Lech, K. Universal analytical method for characterization of yellow and related natural dyes in liturgical vestments from Krakow. J. Cult. Herit. 2020. [Google Scholar] [CrossRef]
- Lech, K. Dataset supporting the identification of natural dyes in yellow, orange, brown and green fibres from Krakow liturgical vestments. Data Brief. 2020, 31, 105735. [Google Scholar] [CrossRef]
- Dąbrowski, D.; Lech, K. A Contemporary approach to study of anthraquinone dye structure by tandem mass spectrometry. In Advances in Chemistry Research; Taylor, J.C., Ed.; Nova Science Publishers: New York, NY, USA, 2017; Volume 34, pp. 75–106. [Google Scholar]
- Lajko, E.; Banyai, P.; Zambo, Z.; Kursinszki, L.; Szoke, E.; Kohidai, L. Targeted tumor therapy by Rubia tinctorum L.: Analytical characterization of hydroxyanthraquinones and investigation of their selective cytotoxic, adhesion and migration modulator effects on melanoma cell lines (A2058 and HT168-M1). Cancer Cell Int. 2015, 15, 119. [Google Scholar] [CrossRef]
- Szostek, B.; Orska-Gawrys, J.; Surowiec, I.; Trojanowicz, M. Investigation of natural dyes occurring in historical Coptic textiles by high-performance liquid chromatography with UV-Vis and mass spectrometric detection. J. Chromatogr. A 2003, 1012, 179–192. [Google Scholar] [CrossRef]
- Hulme, A.N.; McNab, H.; Peggie, D.A.; Quye, A. Negative ion electrospray mass spectrometry of neoflavonoids. Phytochemistry 2005, 66, 2766–2770. [Google Scholar] [CrossRef] [PubMed]
- Lin, L.G.; Liu, Q.Y.; Ye, Y. Naturally occurring homoisoflavonoids and their pharmacological activities. Planta. Med. 2014, 80, 1053–1066. [Google Scholar] [CrossRef]
- Cardon, D. Natural Dyes: Sources, Tradition, Technology and Science; Archetype: London, UK, 2007. [Google Scholar]
- Chen, K.; Rannulu, N.S.; Cai, Y.; Lane, P.; Liebl, A.L.; Rees, B.B.; Corre, C.; Challis, G.L.; Cole, R.B. Unusual odd-electron fragments from even-electron protonated prodiginine precursors using positive-ion electrospray tandem mass spectrometry. J. Am. Soc. Mass Spectrom 2008, 19, 1856–1866. [Google Scholar] [CrossRef]
- Hofenk de Graaff, J.H. The Colorful Past. Origins, Chemistry and Identification of Natural Dyestuffs; Archetype Publications Ltd.: London, UK, 2004. [Google Scholar]
Sample Availability: Samples of the compounds are not available from the authors. |


| No | Compound Name | tR, min | [M − H]−, m/z | Frag., V | Product Ions, m/z (CE, V) | λmax, nm |
|---|---|---|---|---|---|---|
| 1 | hematein * | 4.0 | 299 | 130 | 281 (8), 253 (15), 174 (20), 125 (20) | 284, 383 |
| 2 | hematoxylin * | 5.2 | 301 | 150 | 283 (17), 179 (15), 137 (21), 123 (29) | 279, 397 |
| 3 | brazilein | 5.5 | 283 | 130 | 265 (25), 174 (25), 145 (25), 109 (25) | |
| 4 | hc1 | 5.8 | 319 | 90 | 259 (15), 247 (15), 241 (15), 227 (15) | |
| 5 | protosappanin B | 6.6 | 303 | 130 | 231 (15) | |
| 6 | brazilin | 7.1 | 285 | 110 | 163 (25), 135 (30), 121 (30) | |
| 7 | hc3 (hematoxylin dimer) | 7.2 | 603 | 150 | 301 (20), 179 (20) | |
| 8 | laccaic acid E | 7.9 | 494 | 90 | 450 (10), 406 (20) | 228, 288, 492 |
| 9 | deoxyerythrolaccin di-O-hexoside (pp2) | 8.0 | 593 | 170 | 431 (25), 269 (35) | |
| 10 | hc2 | 8.2 | 317 | 90 | 195 (15), 152 (15), 125 (30) | |
| 11 | ceas1 (brazilin-like) | 8.4 | 285 | 130 | 257 (15), 243 (25), 214 (25) | |
| 12 | kermesic acid di-C-hexoside (pp3) | 8.5 | 653 | 170 | 609 (20), 357 (30), 327 (30) | |
| 14 | caesD | 9.3 | 303 | 130 | 245 (10), 227 (10), 217 (25) | |
| 15 | hc4 (dimer) | 9.4 | 581 | 150 | 281 (25) | |
| 16 | laccaic acid C | 9.5 | 538 | 90 | 494 (10), 450 (20) | 228, 288, 492 |
| 17 | flavokermesic acid O-hexoside (pp6/ppI) | 10.3 | 475 | 170 | 431 (15), 269 (25) | 285, 339, 399 |
| 18 | flavokermesic acid 2-C-glucoside (dcII) | 10.5 | 475 | 170 | 431 (13), 341 (22), 311 (22), 282 (41) | 287, 435 |
| 19 | carminic acid * | 11.2 | 491 | 170 | 447 (14), 357 (22), 327 (22), 299 (34) | 276, 310, 496 |
| 20 | kermesic acid O-hexoside (pp7/ppII) | 11.8 | 491 | 170 | 447 (15), 285 (25) | 276, 466 |
| 21 | urolithin C | 13.9 | 243 | 130 | 215 (25), 199 (25), 187 (25) | |
| 22 | dc3 | 14.5 | 535 | 170 | 473 (20), 445 (30), 415 (25) | |
| 23 | flavokermesic acid 6-O-glucoside (dcOfka) | 14.8 | 475 | 170 | 431 (20), 268 (35), 240 (45) | 280, 342, 431 |
| 24 | carminic acid derivative | 15.1 | 519 | 170 | 475 (15), 357 (25), 327 (25), 298 (40) | |
| 25 | dc4 | 15.5 | 519 | 170 | 397 (30), 385 (25), 327 (35) | |
| 26 | protosappanin E | 16.2 | 585 | 90 | 283 (15) | |
| 27 | kermesic acid O-hexoside (pp9) | 16.3 | 491 | 170 | 447 (18), 284 (25) | |
| 28 | caes2 (brazilin-like) | 16.4 | 285 | 130 | 161 (15), 134 (25) | |
| 29 | deoxyerythrolaccin O-hexoside (pp10) | 16.5 | 431 | 170 | 269 (25) | |
| 30 | kermesic acid 7-C-glucofuranoside (dcIV) | 16.8 | 491 | 170 | 447 (15), 357 (25), 327 (35), 299 (40) | 277, 314, 493 |
| 34 | xantholaccaic acid B | 17.4 | 479 | 90 | 435 (10), 391 (25) | |
| 35 | lucidin O-primeveroside | 17.9 | 563 | 130 | 269 (10), 251 (45) | 246, 266, 342, 407 |
| 36 | kermesic acid 7-C-glucofuranoside (dcVII) | 18.4 | 491 | 170 | 447 (15), 357 (25), 327 (30), 299 (35) | 277, 312, 492 |
| 38 | ruberthyric acid | 18.5 | 533 | 130 | 239 (18) | 228, 258, 334, 416 |
| 39 | laccaic acid B | 19.2 | 495 | 90 | 451 (10), 407 (20), 389 (35) | 230, 288, 492 |
| 40 | xantholaccaic acid A | 19.4 | 520 | 90 | 476 (10), 432 (25) | 230, 288, 492 |
| 41 | deoxyerythrolaccin O-hexoside (pp12) | 21.5 | 431 | 170 | 268 (30) | |
| 42 | anthraflavic acid * | 21.6 | 239 | 130 | 211 (26), 210 (30), 195 (22), 182 (42) | 240, 273, 299, 346 |
| 43 | laccaic acid A | 21.6 | 536 | 90 | 492 (10), 448 (18), 430 (30), 358 (45) | 228, 288, 492 |
| 48 | rubiadin O-primeveroside | 22.6 | 547 | 130 | 253 (20) | |
| 50 | anthragallol | 23.6 | 255 | 130 | 227 (25), 153 (35), 125 (35) | |
| 51 | flavokermesic acid | 23.6 | 313 | 90 | 269 (10) | 284, 342, 431 |
| 52 | kermesic acid * | 24.2 | 329 | 90 | 285 (10) | 274, 308, 492 |
| 53 | kermesic acid O-hexoside derivative (1) (pp14) | 25.5 | 589 | 170 | 545 (20), 357 (25), 327 (25) | |
| 54 | lucidin | 25.7 | 299 | 130 | 251 (15), 223 (30), 195 (35) | |
| 55 | alizarin * | 26.4 | 239 | 170 | 211 (26), 210 (30) | 248, 274, 324, 429 |
| 57 | deoxyerythrolaccin | 27.2 | 269 | 130 | 241 (25), 225 (25) | |
| 59 | anthrarufin * | 27.4 | 239 | 170 | 211 (26), 182 (45) | 225, 252, 285, 417 |
| 60 | kermesic acid O-hexoside derivative (2) (pp15) | 27.4 | 617 | 170 | 545 (20), 357 (25), 327 (25) | |
| 61 | xanthopurpurin | 27.5 | 239 | 130 | 211 (25), 195 (25) | |
| 62 | santalin A | 27.6 | 581 | 130 | 566 (25), 551 (32), 523 (40) | |
| 63 | erythrolaccin | 27.9 | 285 | 130 | 257 (25), 241 (25) | |
| 64 | purpurin * | 28.3 | 255 | 130 | 227 (22), 171 (30), 129 (38), 101 (45) | 255, 290, 482 |
| 66 | rubiadin * | 29.0 | 253 | 110 | 225 (25), 209 (22), 195 (55) | 245, 278, 330, 411 |
| 68 | santalin B | 29.8 | 595 | 130 | 580 (25), 565 (35) | |
| 69 | chrysazin * | 29.8 | 239 | 170 | 211 (26) | 223, 252, 283, 428 |
| 70 | quinizarin * | 30.1 | 239 | 210 | 211 (18) | 224,248, 278, 324, 479 |
| 71 | ps1(santalin-like) | 30.2 | 503 | 130 | 488 (20), 473 (25), 445 (25) | |
| 72 | nordamnacanthal | 30.5 | 267 | 90 | 239 (14), 211 (25), 195 (34) | 259, 294, 418 |
| 73 | chrysophanol * | 30.8 | 253 | 170 | 225 (26) | 225, 256, 277, 287, 429 |
| 74 | santarubin A | 30.9 | 609 | 130 | 594 (25), 579 (25), 551 (40) | |
| 75 | atranorin * | 31.0 | 373 | 90 | 177 (10), 163 (14), 133 (22) | |
| 76 | rt1 (alizarin-licidin O-dimer) | 32.1 | 491 | 150 | 251 (25), 239 (35) | |
| No | Compound Name | tR, min | [M + H]+, m/z | Frag., V | Product Ions, m/z (CE, V) | λmax, nm |
| 13 | isatin * | 8.8 | 148 | 90 | 130 (15), 102 (25), 92 (20), 77 (25), 65 (30) | 296, 413 |
| 31 | indigoid compound A | 17.2 | 262 | 90 | 235 (30), 219 (30), 190 (40), 120 (30) | |
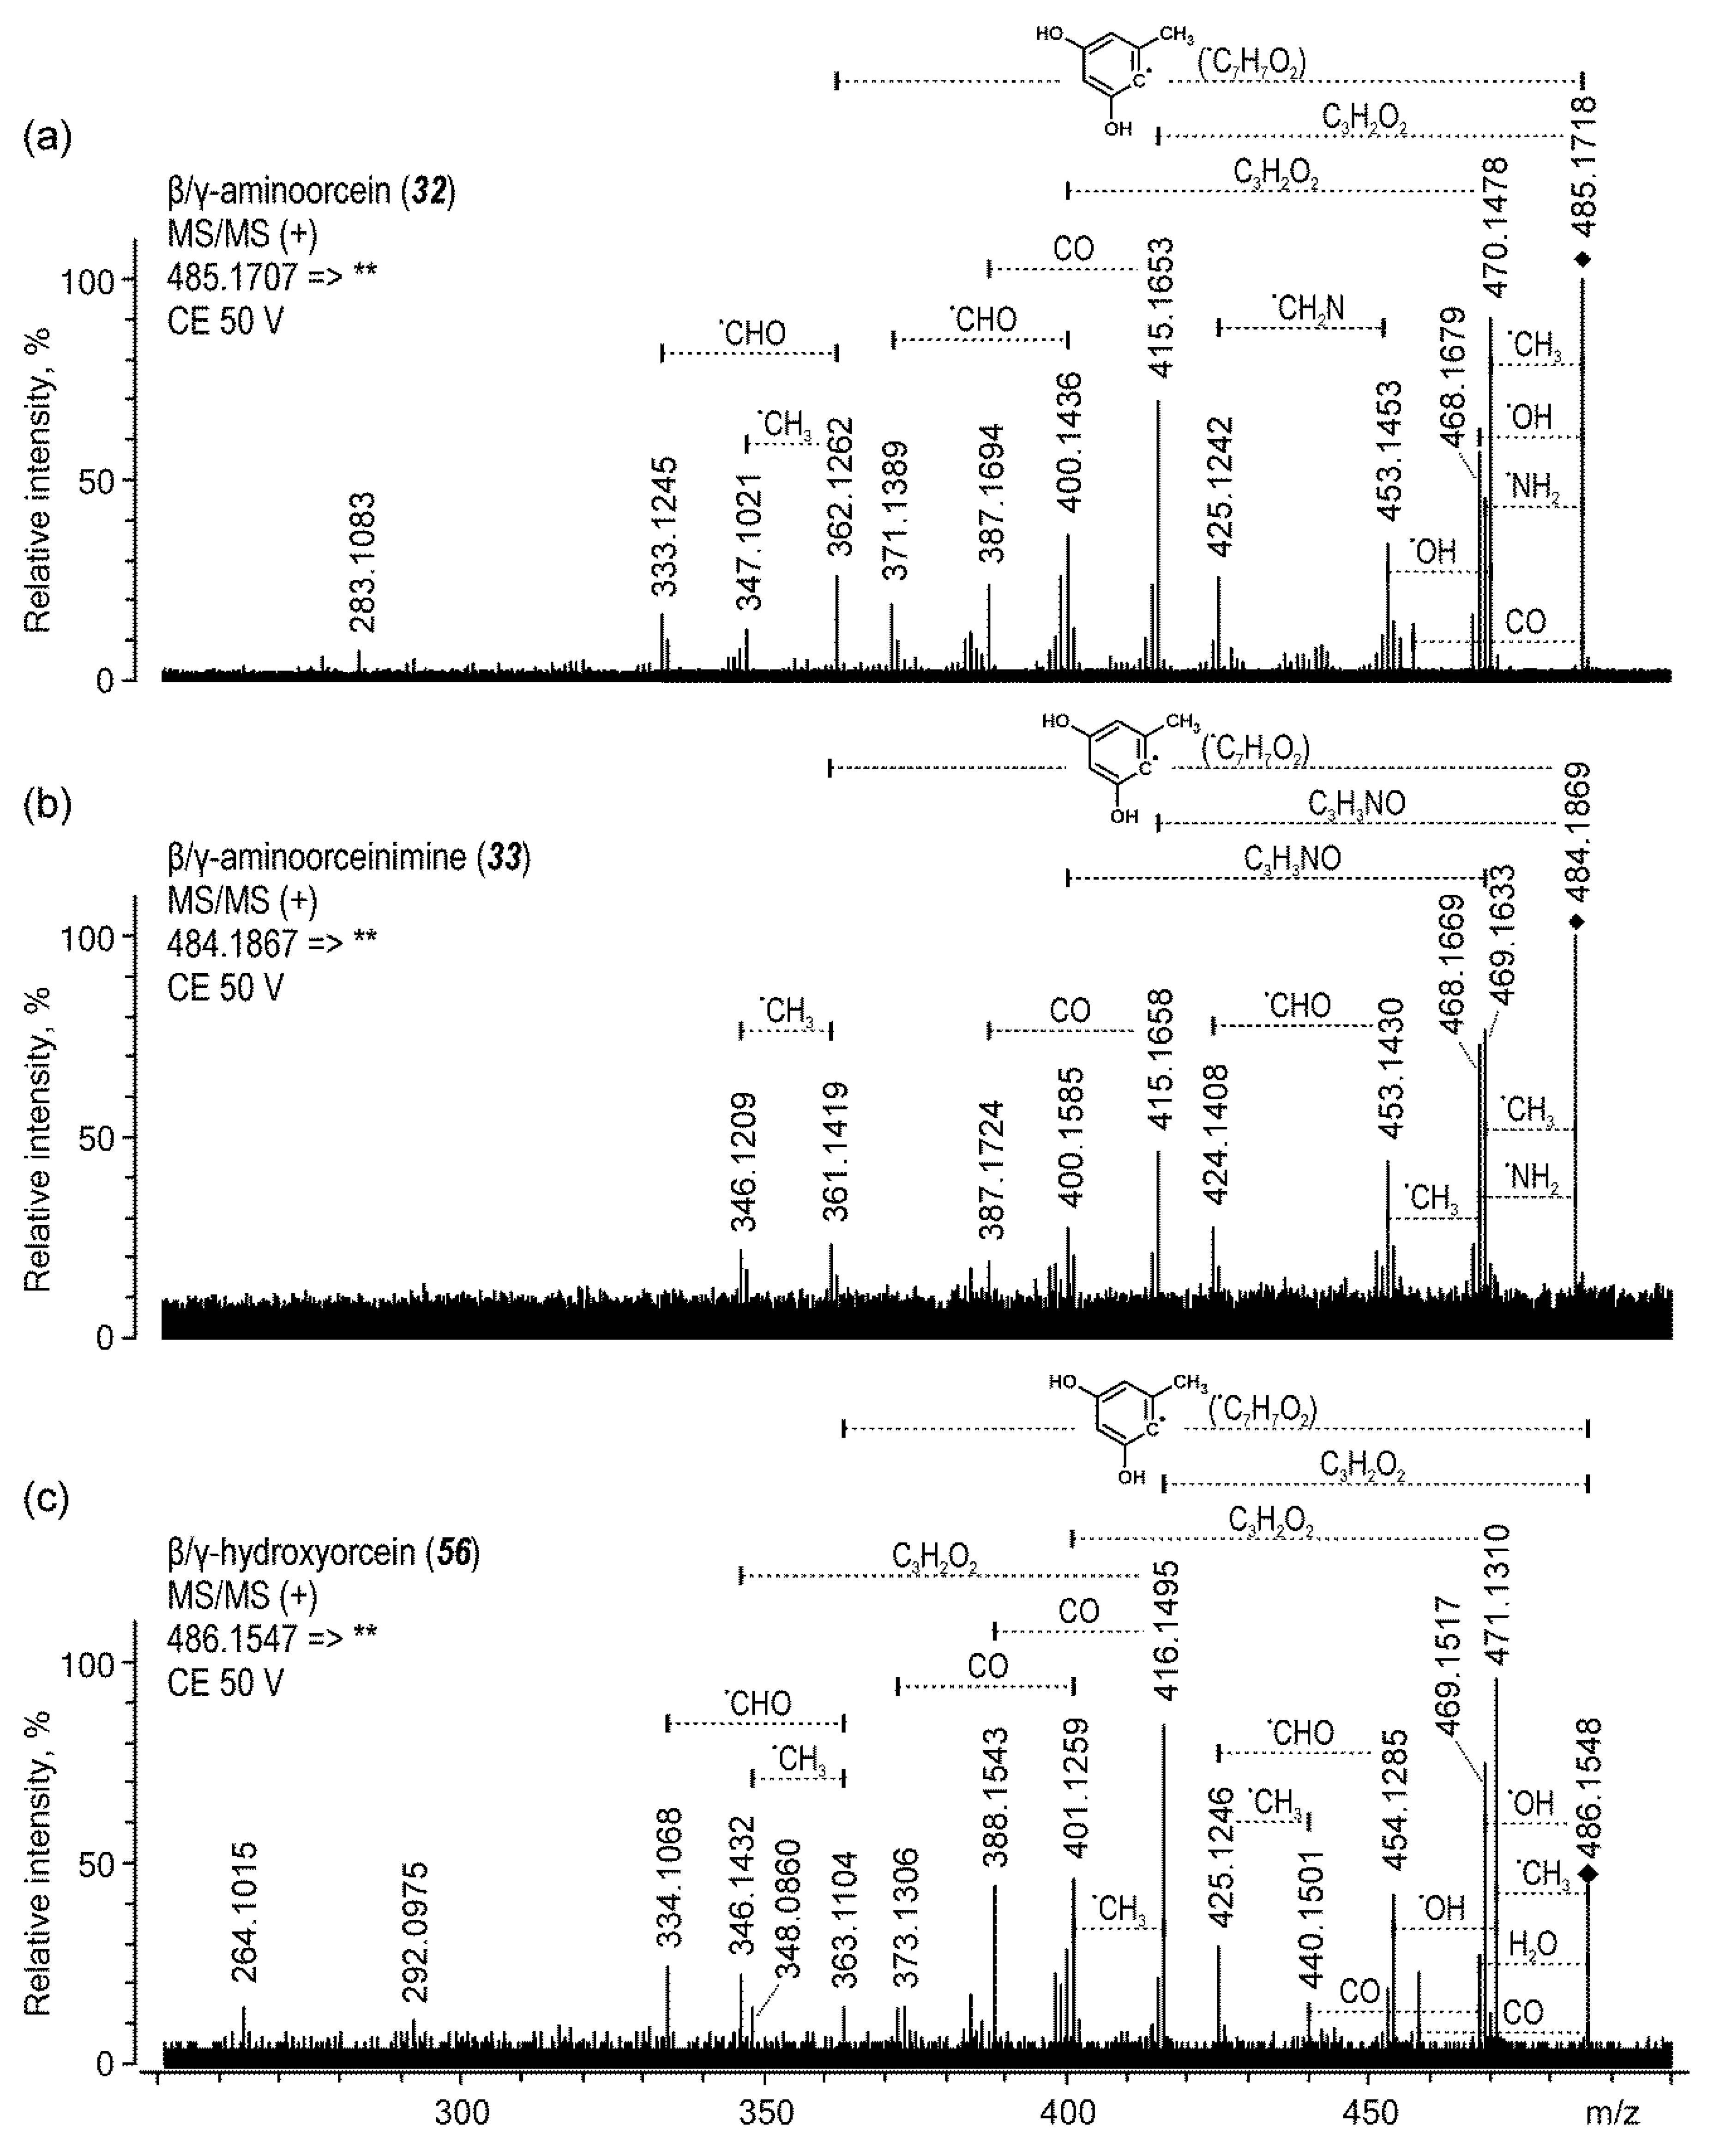
| 32 | β/γ-aminoorcein | 17.2 | 485 | 140 | 470 (45), 415 (40), 362 (42) | |
| 33 | β/γ-aminoorceinimine | 17.3 | 484 | 140 | 469 (50), 468 (42), 361 (50) | |
| 37 | indigoid compound B | 18.4 | 262 | 90 | 234 (20), 219 (20), 31 (30) | |
| 44 | β/γ-hydroxyorcein | 21.7 | 486 | 140 | 471 (45), 469 (40), 416 (40) | |
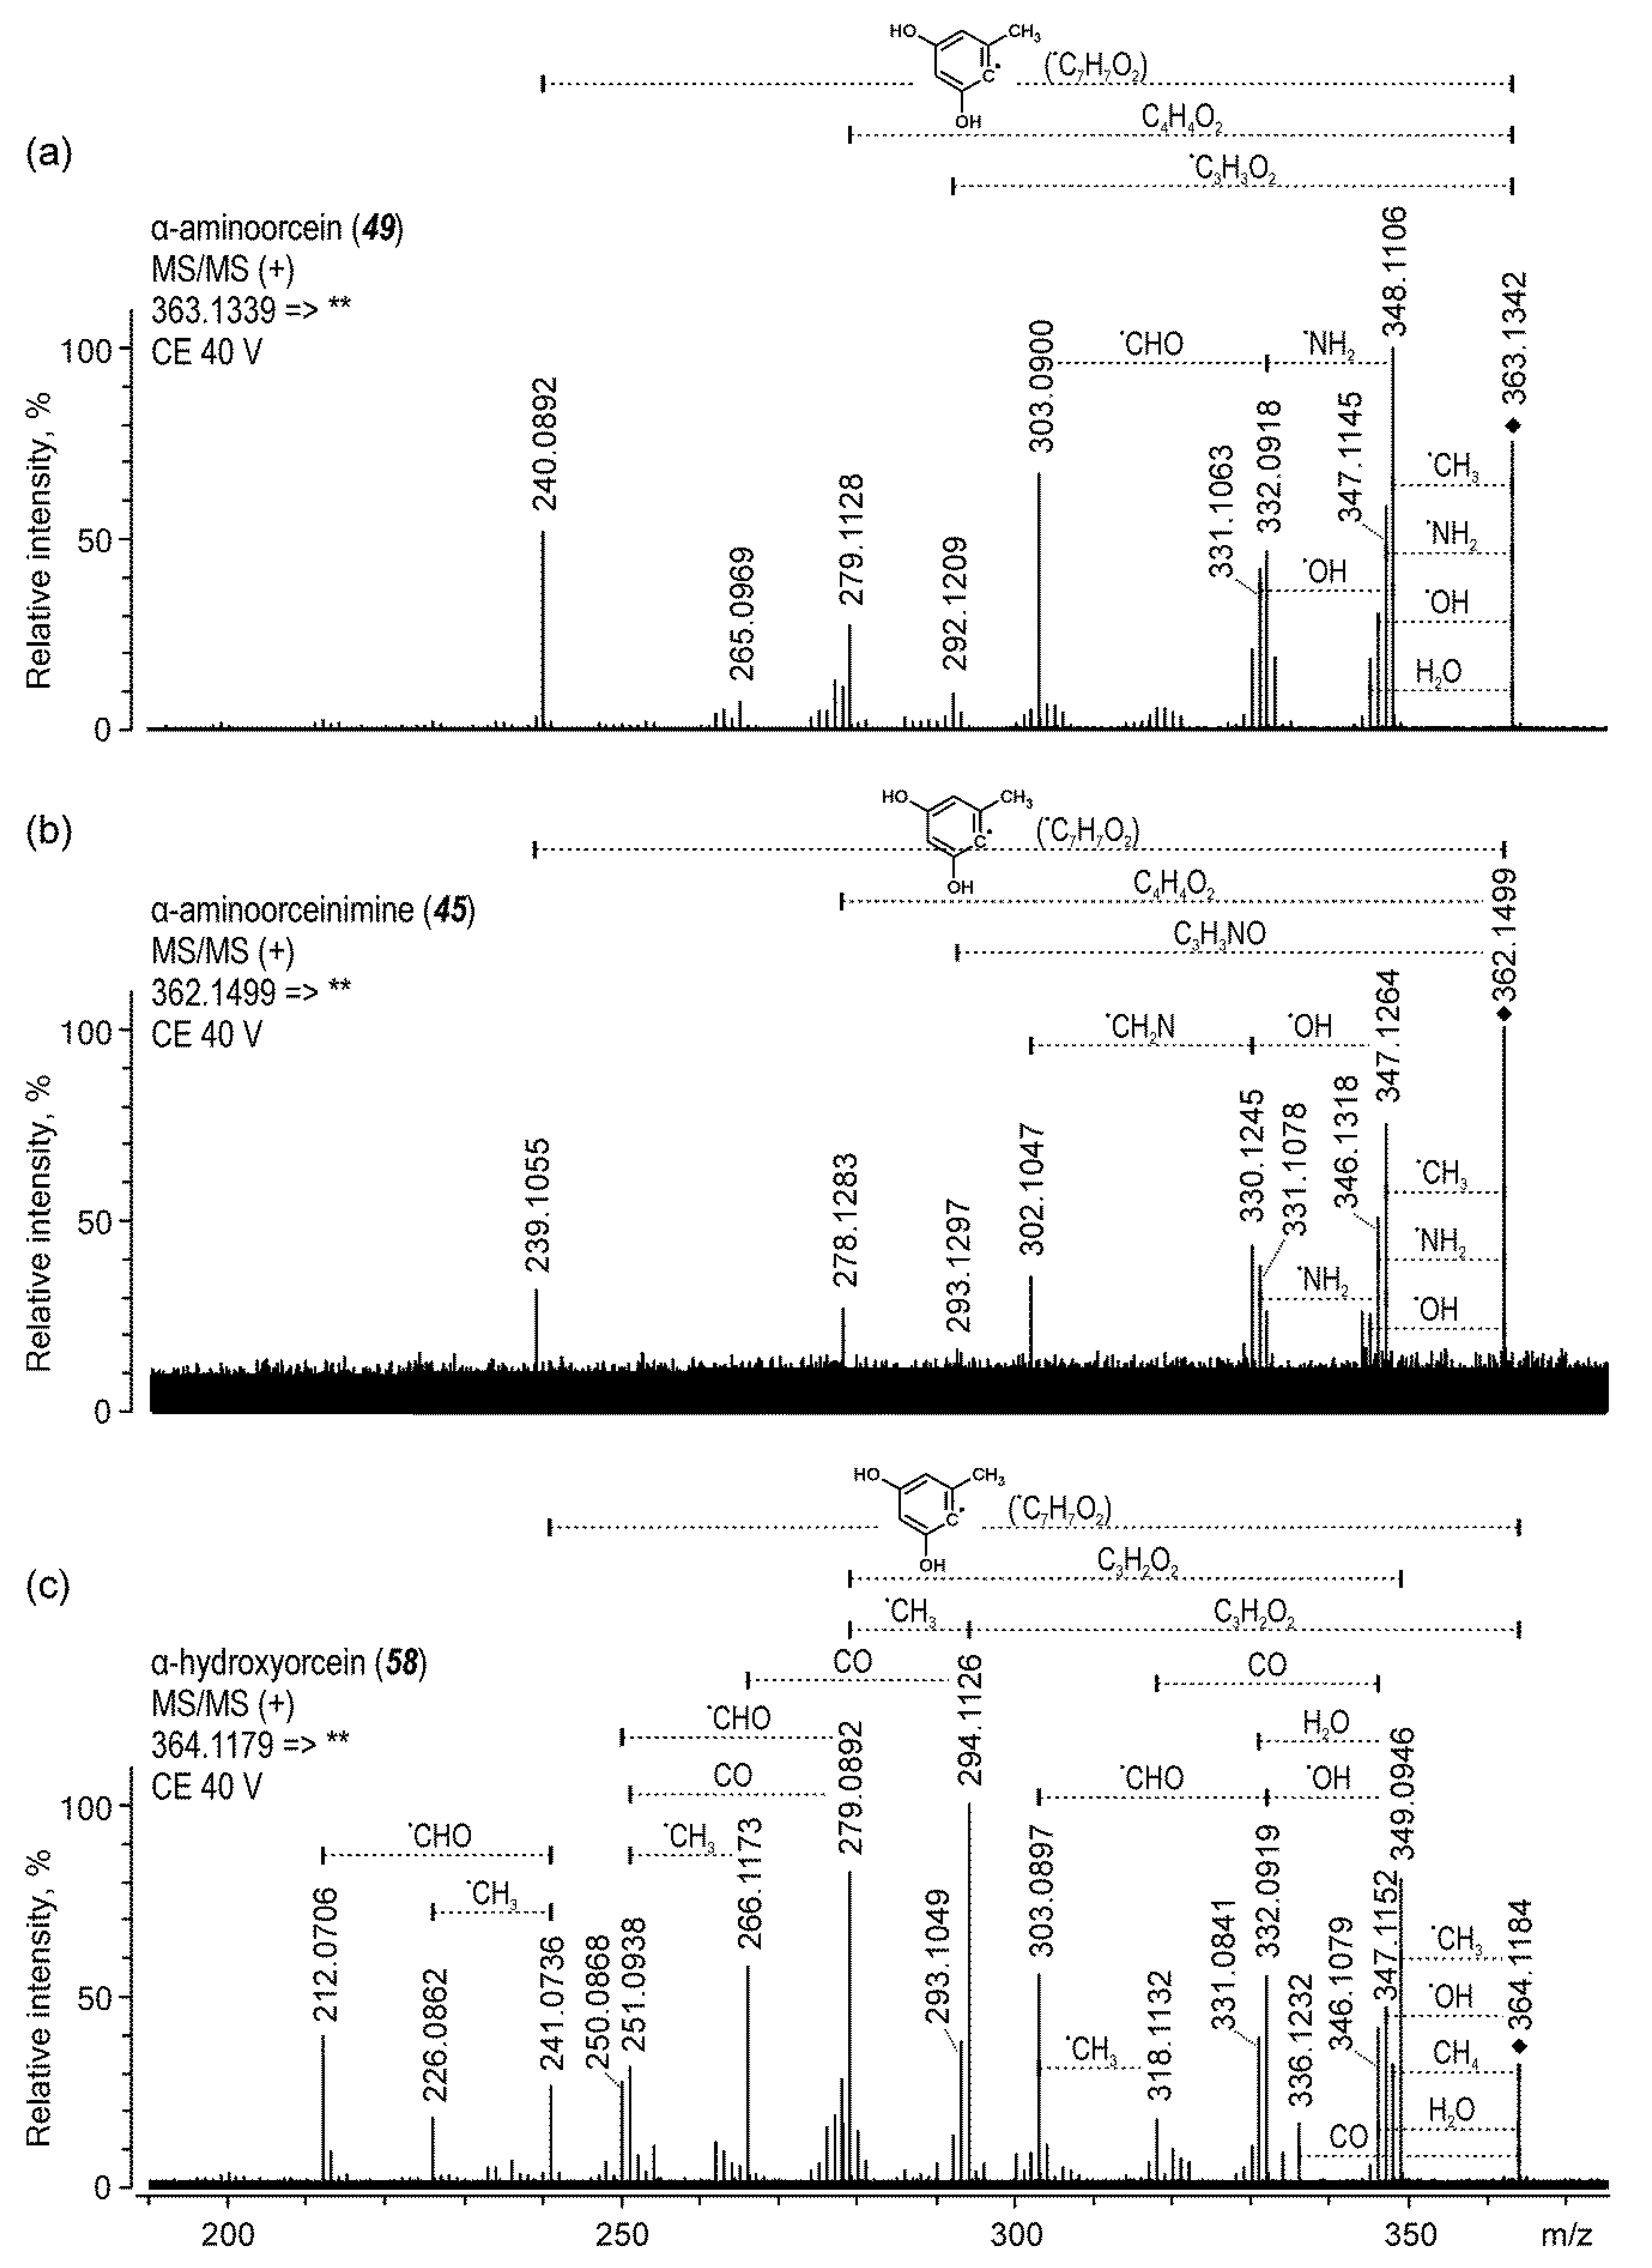
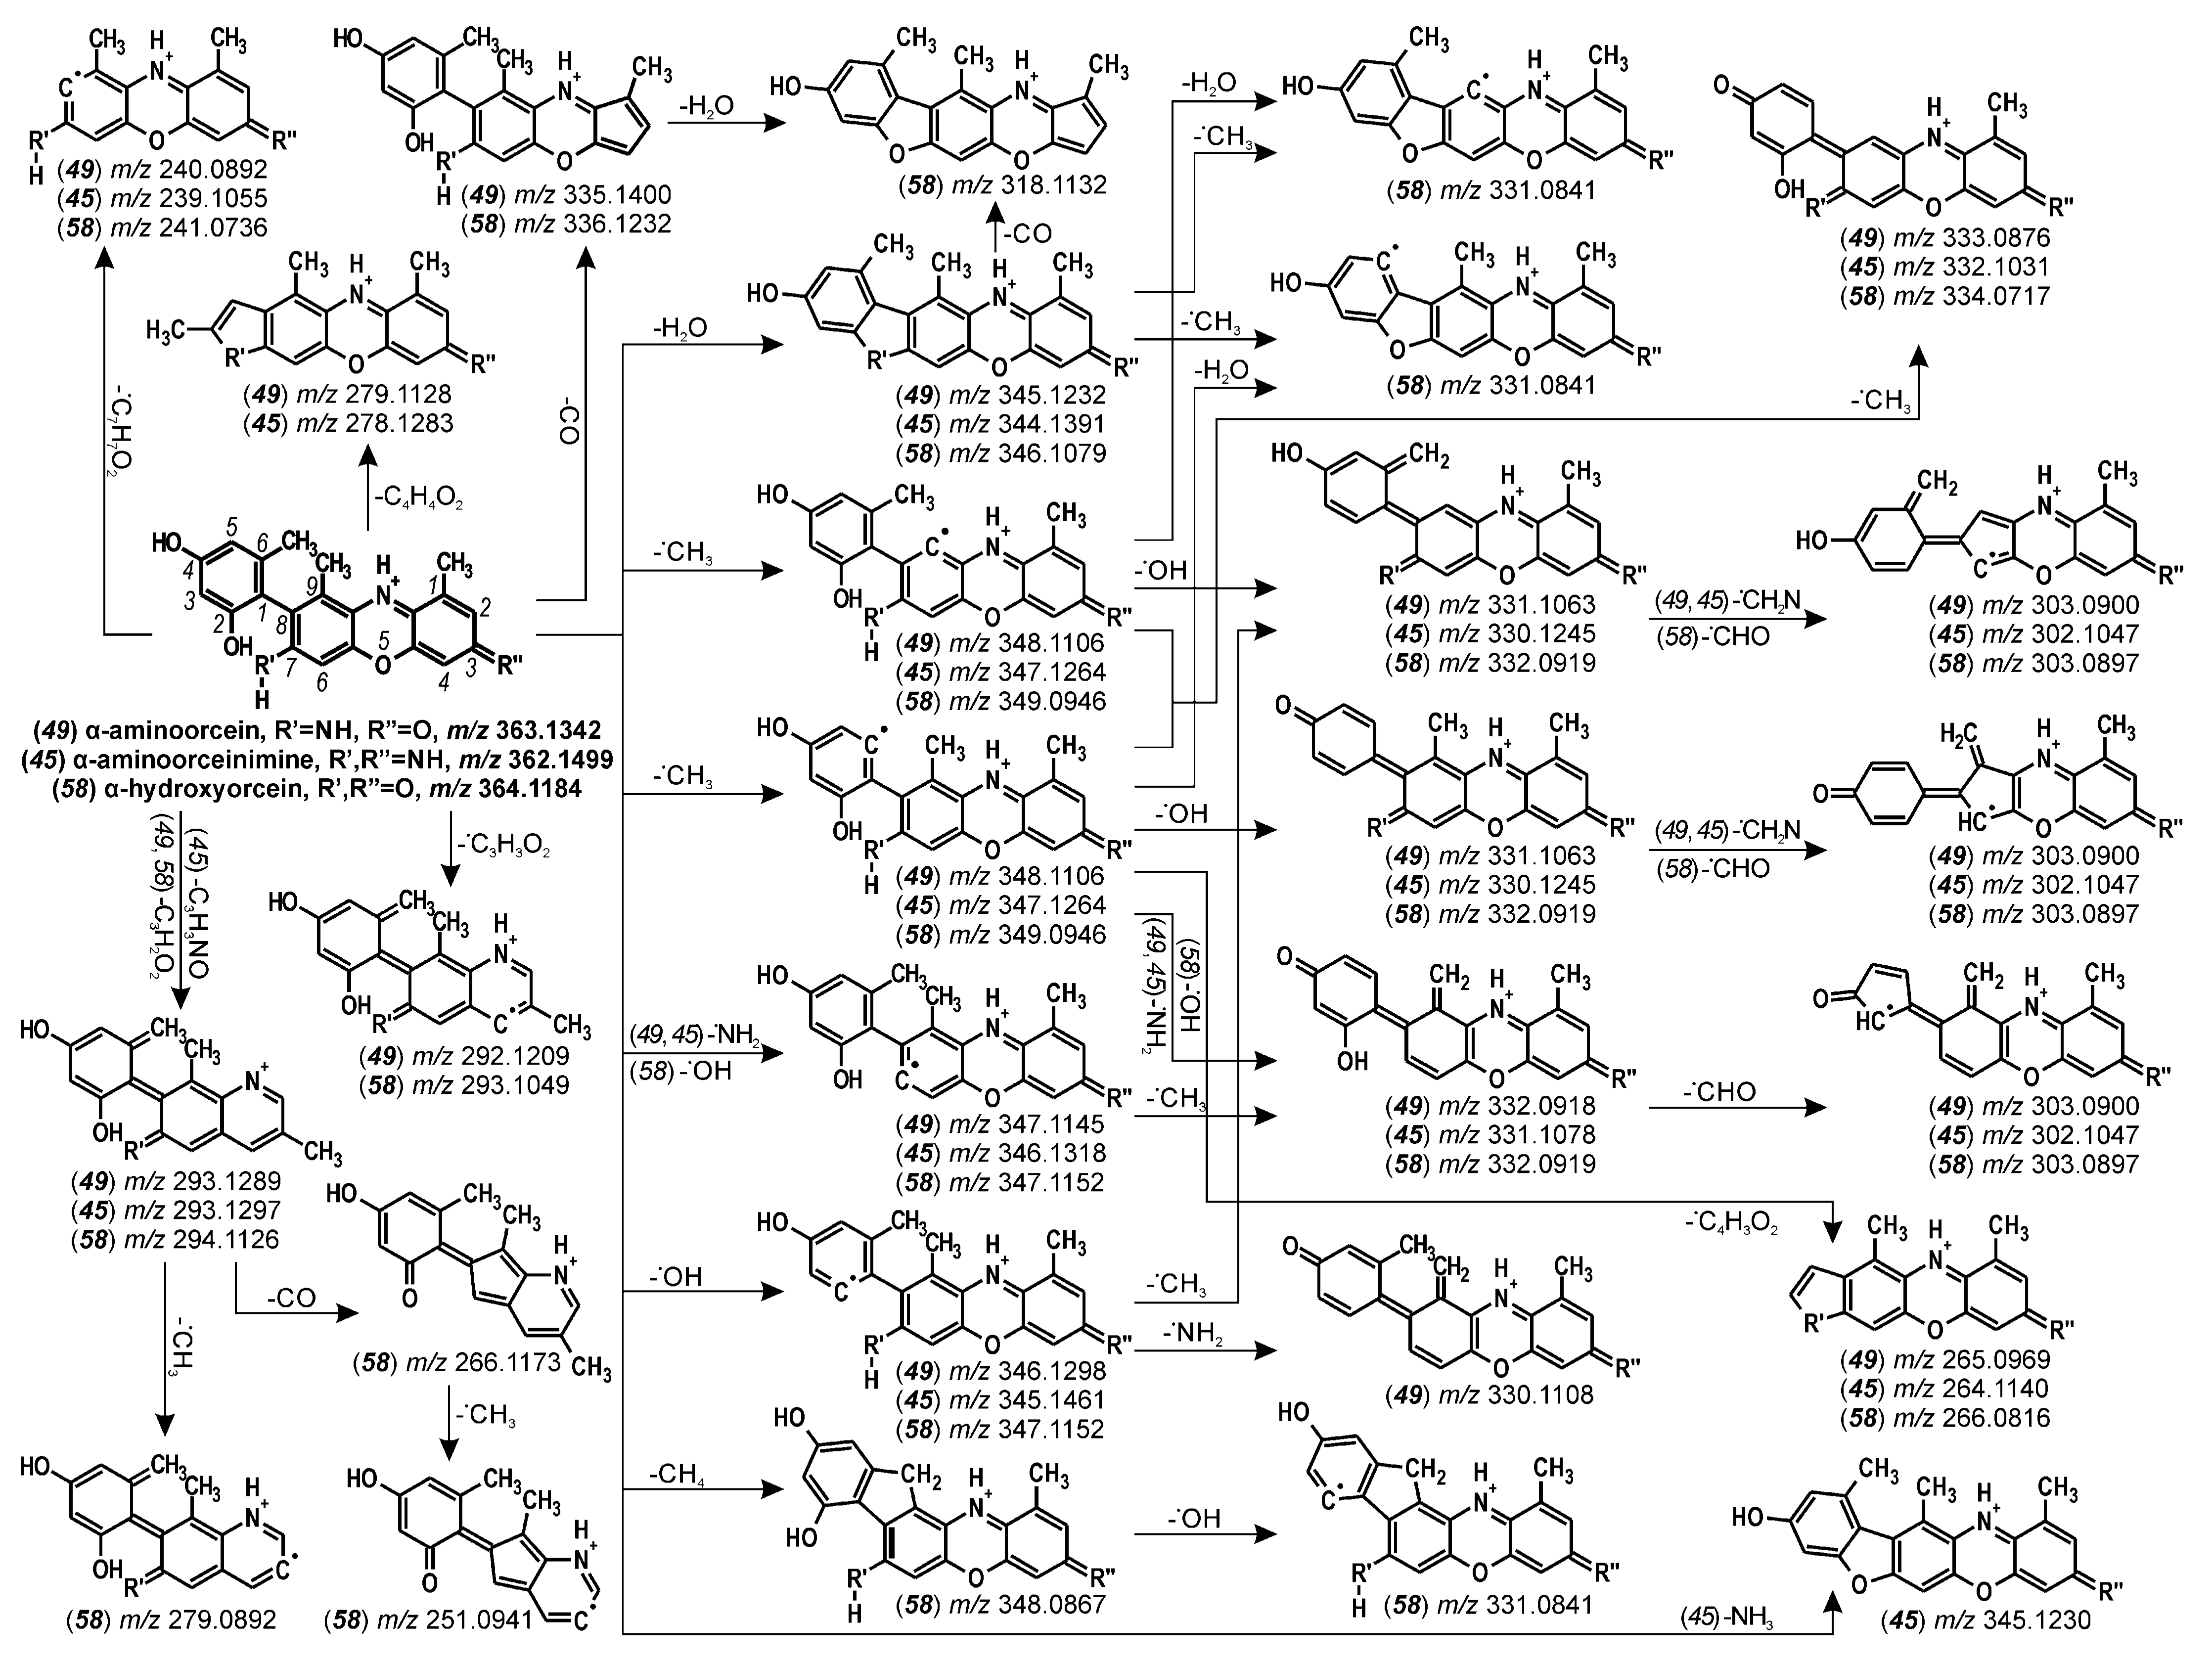
| 45 | α-aminoorceinimine | 21.9 | 362 | 140 | 347 (38), 331 (45), 278 (40) | |
| 46 | β/γ-aminoorceinimine | 22.0 | 484 | 140 | 469 (45), 424 (55), 362 (42) | |
| 47 | β/γ-aminoorcein | 22.3 | 485 | 140 | 470 (42), 415 (40), 362 (42) | |
| 49 | α-aminoorcein | 22.7 | 363 | 140 | 348 (28), 347 (32), 303 (40), 240 (36) | |
| 56 | β/γ-hydroxyorcein | 26.6 | 486 | 140 | 471 (45), 416 (42) | |
| 58 | α-hydroxyorcein | 27.3 | 364 | 140 | 349 (30), 344 (25), 294 (25), 279 (40) | |
| 65 | indigotin * | 28.7 | 263 | 90 | 235 (23), 219 (19), 206 (39), 132 (35), 77 (50) | 291, 620 # |
| 67 | indirubin * | 29.2 | 263 | 170 | 235 (19), 219 (23), 190 (43) | 257, 550 # |
| Compound | tR, min | [M + H]+, m/z | Fragment ion, m/z | Calc. m/z | Formula | Diff, ppm | Abund % |
|---|---|---|---|---|---|---|---|
| β/γ-aminoorcein (32) | 17.2 | 485.1718 | 485.1707 | C28H25N2O6 | −2.20 | 100.0 | |
| 470.1478 | 470.1472 | C27H22N2O6 | −1.24 | 90.3 | |||
| 469.1526 | 469.1520 | C28H23NO6 | −1.36 | 45.4 | |||
| 468.1679 | 468.1680 | C28H24N2O5 | 0.21 | 57.0 | |||
| 467.1615 | 467.1602 | C28H23N2O5 | −2.91 | 16.4 | |||
| 457.1760 | 457.1758 | C27H25N2O5 | −0.51 | 14.1 | |||
| 453.1453 | 453.1445 | C27H21N2O5 | −1.86 | 34.2 | |||
| 425.1242 | 425.1258 | C26H19NO5 | 3.79 | 25.7 | |||
| 415.1653 | 415.1652 | C25H23N2O4 | −0.18 | 69.5 | |||
| 414.1571 | 414.1574 | C25H22N2O4 | 0.82 | 23.8 | |||
| 400.1436 | 400.1418 | C24H20N2O4 | −4.52 | 36.3 | |||
| 399.1367 | 399.1339 | C24H19N2O4 | −6.89 | 26.1 | |||
| 387.1694 | 387.1703 | C24H23N2O3 | 2.26 | 23.9 | |||
| 371.1389 | 371.1390 | C23H19N2O3 | 0.22 | 18.8 | |||
| 362.1262 | 362.1261 | C21H18N2O4 | −0.43 | 26.2 | |||
| 347.1383 | 347.1390 | C21H19N2O3 | 2.17 | 10.9 | |||
| 347.1021 | 347.1026 | C20H15N2O4 | 1.45 | 12.9 | |||
| 334.1303 | 334.1312 | C20H18N2O3 | 2.60 | 10.2 | |||
| 333.1245 | 333.1234 | C20H17N2O3 | −3.35 | 16.6 | |||
| 283.1083 | 283.1077 | C16H15N2O3 | −2.09 | 7.5 | |||
| β/γ-aminoorceinimine (33) | 17.3 | 484.1869 | 484.1867 | C28H26N3O5 | −0.40 | 100.0 | |
| 469.1633 | 469.1632 | C27H23N3O5 | −0.20 | 76.6 | |||
| 468.1669 | 468.1680 | C28H24N2O5 | 2.25 | 73.1 | |||
| 467.1836 | 467.1840 | C28H25N3O4 | 0.78 | 23.4 | |||
| 467.1615 | 467.1602 | C28H23N2O5 | −2.97 | 22.5 | |||
| 466.1789 | 466.1761 | C28H24N3O4 | −5.95 | 14.0 | |||
| 453.1430 | 453.1445 | C27H21N2O5 | 3.27 | 43.9 | |||
| 424.1408 | 424.1418 | C26H20N2O4 | 2.32 | 27.5 | |||
| 415.1658 | 415.1652 | C25H23N2O4 | −1.28 | 46.4 | |||
| 414.1585 | 414.1574 | C25H22N2O4 | −2.63 | 21.0 | |||
| 400.1685 | 400.1656 | C24H22N3O3 | −7.33 | 27.4 | |||
| 387.1724 | 387.1703 | C24H23N2O3 | −5.30 | 19.1 | |||
| 361.1419 | 361.1421 | C21H19N3O3 | 0.63 | 23.2 | |||
| 346.1209 | 346.1186 | C20H16N3O3 | −6.65 | 21.9 | |||
| β/γ-hydroxyorcein (44) | 21.7 | 486.1561 | 486.1547 | C28H24NO7 | −2.86 | 54.2 | |
| 471.1309 | 471.1313 | C27H21NO7 | 0.87 | 100.0 | |||
| 470.1231 | 470.1234 | C27H20NO7 | 0.57 | 16.9 | |||
| 469.1515 | 469.1520 | C28H23NO6 | 1.13 | 59.1 | |||
| 468.1450 | 468.1442 | C28H22NO6 | −1.69 | 20.8 | |||
| 458.1590 | 458.1598 | C27H24NO6 | 1.77 | 16.1 | |||
| 454.1285 | 454.1285 | C27H20NO6 | −0.07 | 35.6 | |||
| 440.1488 | 440.1493 | C27H22NO5 | 1.05 | 13.6 | |||
| 425.1266 | 425.1258 | C26H19NO5 | −1.81 | 37.2 | |||
| 416.1491 | 416.1493 | C25H22NO5 | 0.58 | 63.6 | |||
| 415.1421 | 415.1414 | C25H21NO5 | −1.66 | 30.6 | |||
| 401.1258 | 401.1258 | C24H19NO5 | −0.10 | 37.4 | |||
| 400.1185 | 400.1179 | C24H18NO5 | −1.37 | 23.3 | |||
| 388.1544 | 388.1543 | C24H22NO4 | −0.15 | 40.2 | |||
| 386.1010 | 386.1023 | C23H16NO5 | 3.37 | 12.2 | |||
| 384.1234 | 384.1204 | C21H20O7 | −7.71 | 12.5 | |||
| 373.1311 | 373.1309 | C23H19NO4 | −0.40 | 21.9 | |||
| 372.1236 | 372.1230 | C23H18NO4 | −1.64 | 12.8 | |||
| 363.1113 | 363.1101 | C21H17NO5 | −3.28 | 33.5 | |||
| 348.0864 | 348.0866 | C20H14NO5 | 0.57 | 19.3 | |||
| 346.1429 | 346.1438 | C22H20NO3 | 2.57 | 15.8 | |||
| 334.1078 | 334.1074 | C20H16NO4 | −1.11 | 25.9 | |||
| 293.1053 | 293.1046 | C18H15NO3 | −2.46 | 17.3 | |||
| 264.1032 | 264.1019 | C17H14NO2 | −4.96 | 14.4 | |||
| α-aminoorceinimine (45) | 21.9 | 362.1499 | 362.1499 | C21H20N3O3 | −0.08 | 100.0 | |
| 347.1264 | 347.1264 | C20H17N3O3 | 0.04 | 73.8 | |||
| 346.1318 | 346.1312 | C21H18N2O3 | −1.85 | 47.4 | |||
| 345.1461 | 345.1472 | C21H19N3O2 | 4.01 | 19.2 | |||
| 345.1230 | 345.1234 | C21H17N2O3 | 1.19 | 10.3 | |||
| 344.1391 | 344.1394 | C21H18N3O2 | 0.81 | 17.6 | |||
| 332.1031 | 332.1030 | C19H14N3O3 | −0.42 | 19.7 | |||
| 331.1078 | 331.1077 | C20H15N2O3 | −0.27 | 33.1 | |||
| 330.1245 | 330.1237 | C20H16N3O2 | −2.39 | 38.3 | |||
| 302.1047 | 302.1050 | C19H14N2O2 | 0.93 | 26.3 | |||
| 293.1297 | 293.1284 | C18H17N2O2 | −4.26 | 17.5 | |||
| 278.1283 | 278.1288 | C17H16N3O | 1.62 | 24.0 | |||
| 264.1140 | 264.1131 | C16H14N3O | −3.41 | 12.0 | |||
| 262.1099 | 262.1101 | C17H14N2O | 0.76 | 9.3 | |||
| 239.1055 | 239.1053 | C14H13N3O | −0.80 | 30.4 | |||
| β/γ-aminoorceinimine (46) | 22.0 | 484.1868 | 484.1867 | C28H26N3O5 | −0.28 | 100.0 | |
| 469.1629 | 469.1632 | C27H23N3O5 | 0.60 | 61.5 | |||
| 468.1668 | 468.1680 | C28H24N2O5 | 2.58 | 71.4 | |||
| 467.1783 | 467.1840 | C28H25N3O4 | 12.18 | 17.6 | |||
| 466.1775 | 466.1761 | C28H24N3O4 | −3.05 | 11.1 | |||
| 453.1436 | 453.1445 | C27H21N2O5 | 1.94 | 26.5 | |||
| 452.1613 | 452.1605 | C27H22N3O4 | −1.70 | 25.1 | |||
| 424.1422 | 424.1418 | C26H20N2O4 | −0.94 | 17.8 | |||
| 415.1630 | 415.1652 | C25H23N2O4 | 5.30 | 16.6 | |||
| 400.1664 | 400.1656 | C24H22N3O3 | −2.05 | 12.5 | |||
| 361.1429 | 361.1421 | C21H19N3O3 | −2.10 | 24.1 | |||
| 346.1196 | 346.1186 | C20H16N3O3 | −2.83 | 8.2 | |||
| β/γ-aminoorcein (47) | 22.3 | 485.1721 | 485.1707 | C28H25N2O6 | −2.94 | 100.0 | |
| 470.1473 | 470.1472 | C27H22N2O6 | −0.30 | 86.1 | |||
| 469.1511 | 469.1520 | C28H23NO6 | 1.83 | 35.2 | |||
| 468.1681 | 468.1880 | C28H24N2O5 | −0.21 | 53.5 | |||
| 467.1602 | 467.1602 | C28H23N2O5 | −0.06 | 14.5 | |||
| 457.1762 | 457.1758 | C27H25N2O5 | −0.87 | 15.7 | |||
| 453.1442 | 453.1445 | C27H21N2O5 | 0.73 | 29.4 | |||
| 425.1266 | 425.1258 | C26H19NO5 | −1.79 | 20.7 | |||
| 415.1657 | 415.1652 | C25H23N2O4 | −1.28 | 63.2 | |||
| 414.1575 | 414.1574 | C25H22N2O4 | −0.17 | 21.0 | |||
| 400.1412 | 400.1418 | C24H20N2O4 | 1.50 | 34.6 | |||
| 399.1371 | 399.1339 | C24H19N2O4 | −7.97 | 22.0 | |||
| 387.1697 | 387.1703 | C24H23N2O3 | 1.58 | 28.0 | |||
| 371.1387 | 371.1390 | C23H19N2O3 | 0.86 | 14.9 | |||
| 362.1262 | 362.1261 | C21H18N2O4 | −0.30 | 22.5 | |||
| 347.1375 | 347.1390 | C21H19N2O3 | 4.26 | 7.6 | |||
| 347.1022 | 347.1026 | C20H15N2O4 | 1.24 | 19.5 | |||
| 334.1302 | 334.1312 | C20H18N2O3 | 2.90 | 9.0 | |||
| 333.1238 | 333.1234 | C20H17N2O3 | −1.17 | 12.0 | |||
| 283.1068 | 283.1077 | C16H15N2O3 | 3.21 | 4.4 | |||
| α-aminoorcein (49) | 22.7 | 363.1342 | 363.1339 | C21H19N2O4 | −0.73 | 75.2 | |
| 348.1106 | 348.1105 | C20H16N2O4 | −0.41 | 100.0 | |||
| 347.1145 | 347.1152 | C21H19N2O4 | 2.06 | 58.7 | |||
| 346.1298 | 346.1312 | C21H18N2O3 | 3.93 | 30.1 | |||
| 346.1063 | 346.1074 | C21H16NO4 | 3.01 | 11.0 | |||
| 345.1232 | 345.1234 | C21H17N2O3 | 0.41 | 18.8 | |||
| 335.1400 | 335.1400 | C20H19N2O3 | −2.78 | 2.3 | |||
| 333.0876 | 333.0870 | C19H13N2O4 | −1.81 | 19.1 | |||
| 332.0918 | 332.0917 | C20H14NO4 | −0.21 | 46.7 | |||
| 331.1063 | 331.1077 | C20H15N2O3 | 4.14 | 42.1 | |||
| 330.1108 | 330.1125 | C21H16NO3 | 5.03 | 21.2 | |||
| 303.0900 | 303.0890 | C19H13NO3 | −3.35 | 67.2 | |||
| 293.1289 | 293.1285 | C18H17N2O2 | −1.39 | 4.8 | |||
| 292.1209 | 292.1206 | C18H16N2O2 | −0.83 | 9.5 | |||
| 279.1128 | 279.1128 | C17H15N2O2 | 0.03 | 27.5 | |||
| 265.0969 | 265.0969 | C16H13N2O2 | 0.80 | 7.4 | |||
| 240.0892 | 240.0893 | C14H12N2O2 | 0.43 | 51.9 | |||
| β/γ-hydroxyorcein (56) | 26.6 | 486.1548 | 486.1547 | C28H24NO7 | −0.31 | 40.7 | |
| 471.1310 | 471.1313 | C27H21NO7 | 0.63 | 100.0 | |||
| 469.1517 | 469.1520 | C28H23NO6 | 0.52 | 74.3 | |||
| 468.1438 | 468.1442 | C28H22NO6 | 0.82 | 23.3 | |||
| 458.1594 | 458.1598 | C27H24NO6 | 0.90 | 22.6 | |||
| 454.1285 | 454.1285 | C27H20NO6 | 0.09 | 41.9 | |||
| 440.1501 | 440.1493 | C27H22NO5 | −2.00 | 12.9 | |||
| 425.1246 | 425.1258 | C26H19NO5 | 2.77 | 28.8 | |||
| 416.1487 | 416.1493 | C25H22NO5 | 1.31 | 83.8 | |||
| 401.1259 | 401.1258 | C24H19NO5 | −0.22 | 45.8 | |||
| 400.1187 | 400.1179 | C24H18NO5 | −1.91 | 28.1 | |||
| 388.1543 | 388.1543 | C24H22NO4 | −0.02 | 43.8 | |||
| 384.1189 | 384.1204 | C21H20O7 | 3.72 | 17.1 | |||
| 373.1306 | 373.1309 | C23H19NO4 | 0.75 | 13.7 | |||
| 372.1236 | 372.1230 | C23H18NO4 | −1.45 | 13.5 | |||
| 363.1104 | 363.1101 | C21H17NO5 | −0.87 | 13.8 | |||
| 348.0860 | 348.0866 | C20H14NO5 | 1.95 | 14.0 | |||
| 346.1432 | 346.1438 | C22H20NO3 | 1.67 | 22.0 | |||
| 334.1068 | 334.1074 | C20H16NO4 | 1.79 | 24.1 | |||
| 292.0975 | 292.0968 | C18H14NO3 | −2.17 | 9.5 | |||
| 264.1015 | 264.1019 | C17H14NO2 | 1.72 | 13.9 | |||
| α-hydroxyorcein (58) | 27.3 | 364.1184 | 364.1179 | C21H18NO5 | −1.17 | 30.9 | |
| 349.0946 | 349.0945 | C20H15NO5 | −0.45 | 79.6 | |||
| 348.0867 | 348.0866 | C20H14NO5 | −0.10 | 29.5 | |||
| 347.1152 | 347.1152 | C21H17NO4 | −0.07 | 45.6 | |||
| 346.1079 | 346.1074 | C21H16NO4 | −1.60 | 40.5 | |||
| 336.1232 | 336.1230 | C20H18NO4 | −0.49 | 15.1 | |||
| 334.0717 | 334.0710 | C19H12NO5 | −2.12 | 8.8 | |||
| 332.0919 | 332.0917 | C20H14NO4 | −0.43 | 55.3 | |||
| 331.0841 | 331.0839 | C20H13NO4 | −0.49 | 38.9 | |||
| 318.1132 | 318.1125 | C20H16NO3 | −2.32 | 16.2 | |||
| 303.0897 | 303.0890 | C19H13NO3 | −2.22 | 54.6 | |||
| 294.1126 | 294.1125 | C18H16NO3 | −0.34 | 100.0 | |||
| 293.1049 | 293.1046 | C18H15NO3 | −0.95 | 37.8 | |||
| 279.0892 | 279.0890 | C17H13NO3 | −0.57 | 81.4 | |||
| 266.1173 | 266.1176 | C17H16NO2 | 0.98 | 57.6 | |||
| 266.0816 | 266.0816 | C16H12NO3 | −1.69 | 8.0 | |||
| 251.0938 | 251.0941 | C16H13NO2 | 1.22 | 30.5 | |||
| 250.0868 | 250.0863 | C16H12NO2 | −2.33 | 25.9 | |||
| 241.0736 | 241.0733 | C14H11NO3 | −0.96 | 25.9 | |||
| 226.0862 | 226.0863 | C14H12NO2 | 0.21 | 16.4 | |||
| 212.0706 | 212.0706 | C13H10NO2 | 0.27 | 38.9 |
© 2020 by the authors. Licensee MDPI, Basel, Switzerland. This article is an open access article distributed under the terms and conditions of the Creative Commons Attribution (CC BY) license (http://creativecommons.org/licenses/by/4.0/).
Share and Cite
Lech, K.; Fornal, E. A Mass Spectrometry-Based Approach for Characterization of Red, Blue, and Purple Natural Dyes. Molecules 2020, 25, 3223. https://doi.org/10.3390/molecules25143223
Lech K, Fornal E. A Mass Spectrometry-Based Approach for Characterization of Red, Blue, and Purple Natural Dyes. Molecules. 2020; 25(14):3223. https://doi.org/10.3390/molecules25143223
Chicago/Turabian StyleLech, Katarzyna, and Emilia Fornal. 2020. "A Mass Spectrometry-Based Approach for Characterization of Red, Blue, and Purple Natural Dyes" Molecules 25, no. 14: 3223. https://doi.org/10.3390/molecules25143223
APA StyleLech, K., & Fornal, E. (2020). A Mass Spectrometry-Based Approach for Characterization of Red, Blue, and Purple Natural Dyes. Molecules, 25(14), 3223. https://doi.org/10.3390/molecules25143223