Article

Quasi-Isostructural Co(II) and Ni(II) Complexes with Mefenamato Ligand: Synthesis, Characterization, and Biological Activity

by
Michał Gacki
1,*,
Karolina Kafarska
1,
Anna Pietrzak
1,
Izabela Korona-Głowniak
2 and
Wojciech M. Wolf
1
1
Institute of General and Ecological Chemistry, Faculty of Chemistry, Lodz University of Technology, 116 Zeromskiego Street, 90-924 Lodz, Poland
2
Department of Pharmaceutical Microbiology, Medical University of Lublin, Chodzki 1, 20-093 Lublin, Poland
*
Author to whom correspondence should be addressed.
Molecules 2020, 25(13), 3099; https://doi.org/10.3390/molecules25133099
Submission received: 4 June 2020 / Revised: 27 June 2020 / Accepted: 2 July 2020 / Published: 7 July 2020
(This article belongs to the Special Issue Advances in Coordination Chemistry)

Abstract

:
Three metal complexes of mefenamato ligand 1 were synthesized: [Co2(mef)4(EtOH)2(H2O)4]: 2; [Co(mef)2(MeOH)4]∙2MeOH: 3; and [Ni(mef)2(MeOH)4]∙2MeOH: 4. Their compositions and properties were investigated by elemental analysis (EA), flame atomic absorption spectrometry (FAAS), Fourier-transform infrared spectroscopy (FTIR), and thermogravimetric analysis (TGA). Crystal structures were determined by the single crystal X-ray diffraction technique. Additionally, their antioxidant and antimicrobial activity were established, thus proving good/moderate bioactivity against Gram-positive bacteria and yeasts. In the crystal structure of 2, an apical water molecule is shared between two adjacent cobalt(II) ions, resulting in the formation of a polymeric chain extending along the [100] direction. Meanwhile, structures 3 and 4 have strong intermolecular hydrogen bonds with diverse topologies that yield unique quasi-isostructural arrangements. The packing topology is reflected by the Hirshfeld surface analysis of intermolecular contacts.

1. Introduction

Nonsteroidal anti-inflammatory drugs (NSAIDs) are among the most popular pharmaceuticals that have been used against inflammation, pain, and fever over the years [1]. Their therapeutic effect is mainly based on their ability to inhibit the conversion of the arachidonic acid to prostaglandins [2]. Unfortunately, NSAIDs exhibit acute side effects and may cause dyspepsia, nausea, abdominal pain, constipation, headache, dizziness, and rash [2,3]. Additionally, several NSAIDs can be effectively applied in treatments of colon, lung, and breast cancers [4,5] due to their profound chemopreventive and chemosuppressive effects [6,7,8].
The structural similarity of crystals [9] plays a vital role in understanding the pharmaceutical activity of solid-state drugs. It is often described by the term isostructurality [10] and is profoundly associated with intermolecular interactions and often prompted by symmetry restrictions. A given packing arrangement may tolerate tiny molecular geometry adjustments while keeping the crystals almost isostructural [11,12]. However, certain crystals of coordination compounds which diverse metal ions are characterized by the same chemical constituents may not be classified as entirely isostructural due to subtle differences in their interaction arrangement [13]. That quasi-isostructurality was observed in systems 3 and 4.
Mefenamic acid (2-(2,3-dimethylphenyl)aminobenzoic acid) 1 was discovered by Claude Winder from Parke–Davis in 1961 and successively introduced into the market as an NSAID three years later [14,15]. It belongs to the group of anthranilic acid derivatives also known as fenamates [16,17]. Nowadays, it is widely used as an analgesic and antipyretic agent characterized by mild side-effects and applied in treatments of osteoarthritis, rheumatoid arthritis, and other painful musculoskeletal illnesses [18,19].
Mefenamic acid adopts three distinctive polymorphic forms, denoted as I, II, and III [20,21]. They show diverse solubilities and stabilities [22,23]. Form I is the most stable under ambient conditions, II is stable above 160 °C, and III is the least stable and converts back to I [22]. The crystal structures of I, II, and III were reported in 1976, 2008, and 2012, respectively [22,23,24,25]. Mefenamic acid belongs to Class II of the Biopharmaceutical Classification System [26] and is characterized by a relatively low solubility and high permeability, both of which hamper its clinical use [22]. Its metal complexes may overcome this deficiency. In fact, considerable attention has been paid to transition metal complexes with active drugs [2,27]. Those studies showed that several properties, like solubility, reactivity, and stability, are different than those determined for the ligand or metal alone [28,29]. Metal complexes of fenamates, including those with mefenamic acid, have been recently investigated. Most of them have shown improved biological activities compared to the sole drugs [3,30,31] and revealed interesting antibacterial, antifungal, analgesic, and anti-inflammatory applications.
Additionally, a number of crystal structures of metal–mefenamato complexes have been reported. In particular, a series of Mn(II) [3,32], Co(II) [33], Ni(II) [34], Cu(II) [35,36,37], Zn(II) [38], and Sn(IV) [39] complexes showed that mefenamato ligands may be involved in diverse coordination modes.
The synthesis, spectroscopic properties, and thermal stability of six divalent mefenamato complexes Mn(mef)2∙3H2O 5, Co(mef)2∙2H2O 6, Ni(mef)2∙2H2O 7, Cu(mef)2∙2H2O 8, Zn(mef)2∙2H2O 9, and Cd(mef)2∙2H2O 10 were described by us previously [40]. In this contribution, we report the successful crystallization and crystal structures of three mefenamato complexes: 24 (Scheme 1). Furthermore, the high quality and low temperature structure of 3 was also determined and compared to the already published by Dimiza et al. structure of [Co(mef)2(MeOH)4]∙2MeOH [33]. The latter is characterized by exceptionally high uncertainty ellipsoids of oxygen atoms directly linked to the central cobalt ions. Therefore, we redetermined the structure of 3 through a single crystal X-ray analysis. The high quality data, collected at a temperature T = 100 K, allowed us to define and refine all disordered atoms and provided precise atomic coordinates further used in this work. In addition, the spectral, thermal, antioxidant, and antimicrobial properties of 14 were determined and compared to the series of 510.

2. Results and Discussion

Compounds 2, 3, and 4 are air stable at room temperature. They are highly soluble in polar organic solvents like DMF, DMSO, methanol, and ethanol. Their properties were thoroughly investigated by the FAAS, EA, FTIR, and TGA methods augmented by antimicrobial and antioxidant studies; see Table 1. The crystal structures of 24 were determined by the single crystal X-ray diffraction technique; see Table 2. The crystals of 3 and 4 are isomorphic. The analytical data were in good agreement with crystal structures of all complexes.

2.1. Description of Crystal Structures

2.1.1. Crystal Structure of 2

The molecular structure of complex 2 is presented in Figure 1. It crystallizes in the triclinic space group P 1 ¯ with two symmetrically independent cobalt ions, namely Co1 and Co2, placed in a special positions on inversion centers. Therefore, the single asymmetric unit contains half Co1 and half Co2 ions, two mefenamato moieties, two coordinated waters, and a single coordinated ethanol molecule. Both Co(II) ions are six coordinated, adopt octahedral environments, and share a single apical water O5. This arrangement propagates along the [100] direction, thus leading to a 1-D polymeric structure with a Co1–O5–Co2 repetitive unit (Figure S1). Similar supramolecular motifs were recently identified and published by us [2].
Both mefenamato ligands are monodentate with coordinating carboxylate O1 and O3 atoms placed in equatorial positions of Co1 and Co2, respectively. Ethanol O7, as in Co1, and water O6, as in Co2, complete cobalt coordination spheres. The two 2-((2,3-dimethylphenyl)amino)benzoate moieties adopt twisted conformations. The dihedral angles between phenyl rings are 82.65(16) and 38.55(11)° for the species coordinated to Co1 and Co2, respectively. The apical Co1–O5 and Co2–O5 bonds distances are almost identical (2.1518(15) and 2.1493(15) Å, respectively) and are longer than Co–O bonds placed in equatorial positions (2.0454(15)-2.0973(17) Å).
The presented crystal is stabilized by an extensive network of inter- and intramolecular hydrogen bonds (Table 3). In particular, a strong intramolecular interaction is formed between a sole hydrogen at the coordinating water molecule O6 and the carboxylate O1 of a mefenamato moiety. The hydrogen of the ethanol O7 molecule participates in a hydrogen bond with the carboxylate O3. Moreover, the O5 water molecules are hydrogen donors to bifurcated carboxylate acceptors O2 and O4, and the latter oxygen atoms additionally attract hydrogens of neighboring amine groups N1 and N2A, respectively. The resulting chain motif may be described by the Etter’s symbol C 4 2 ( 9 ) [41,42].

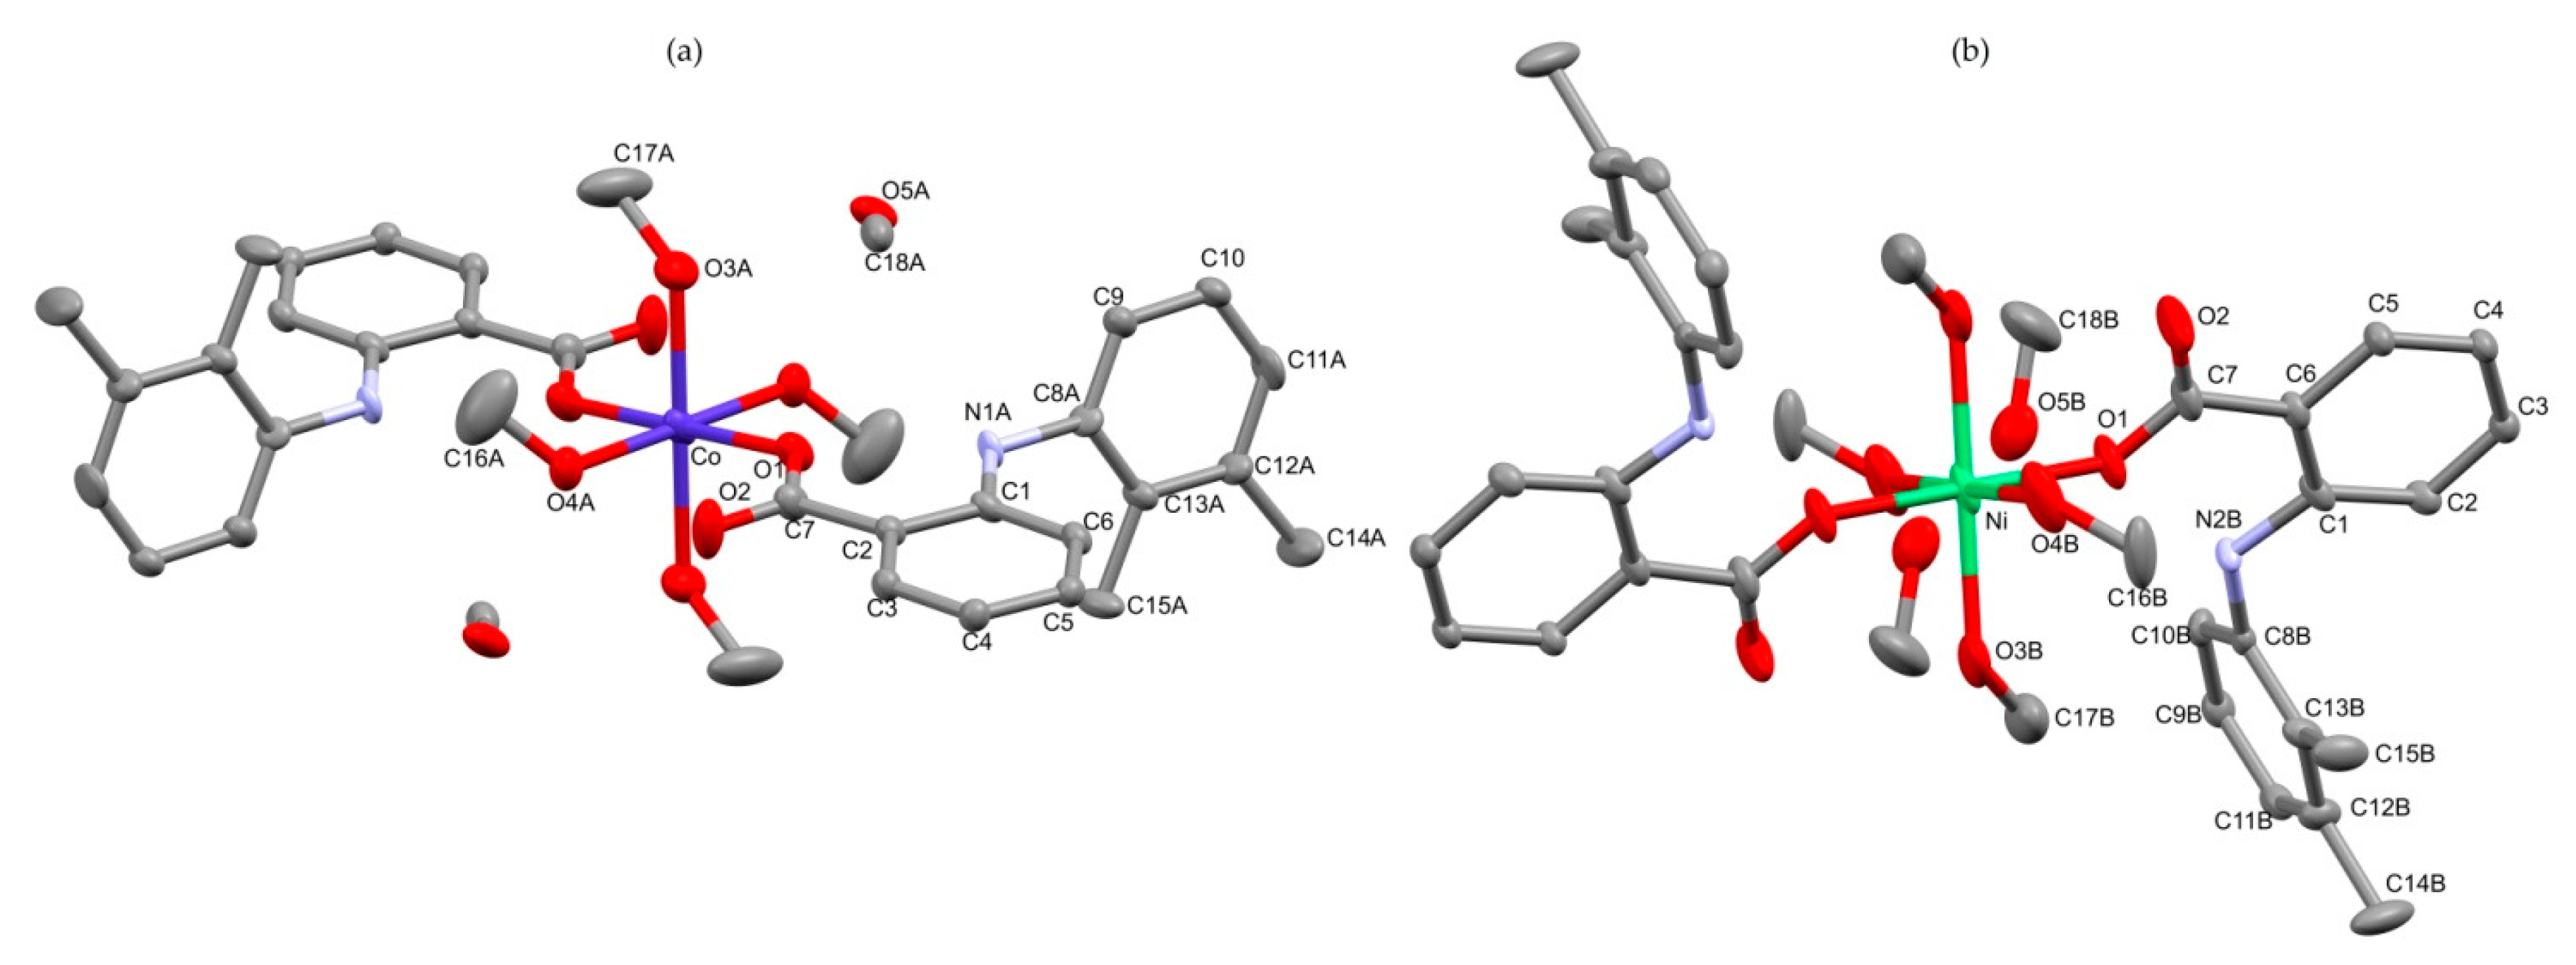
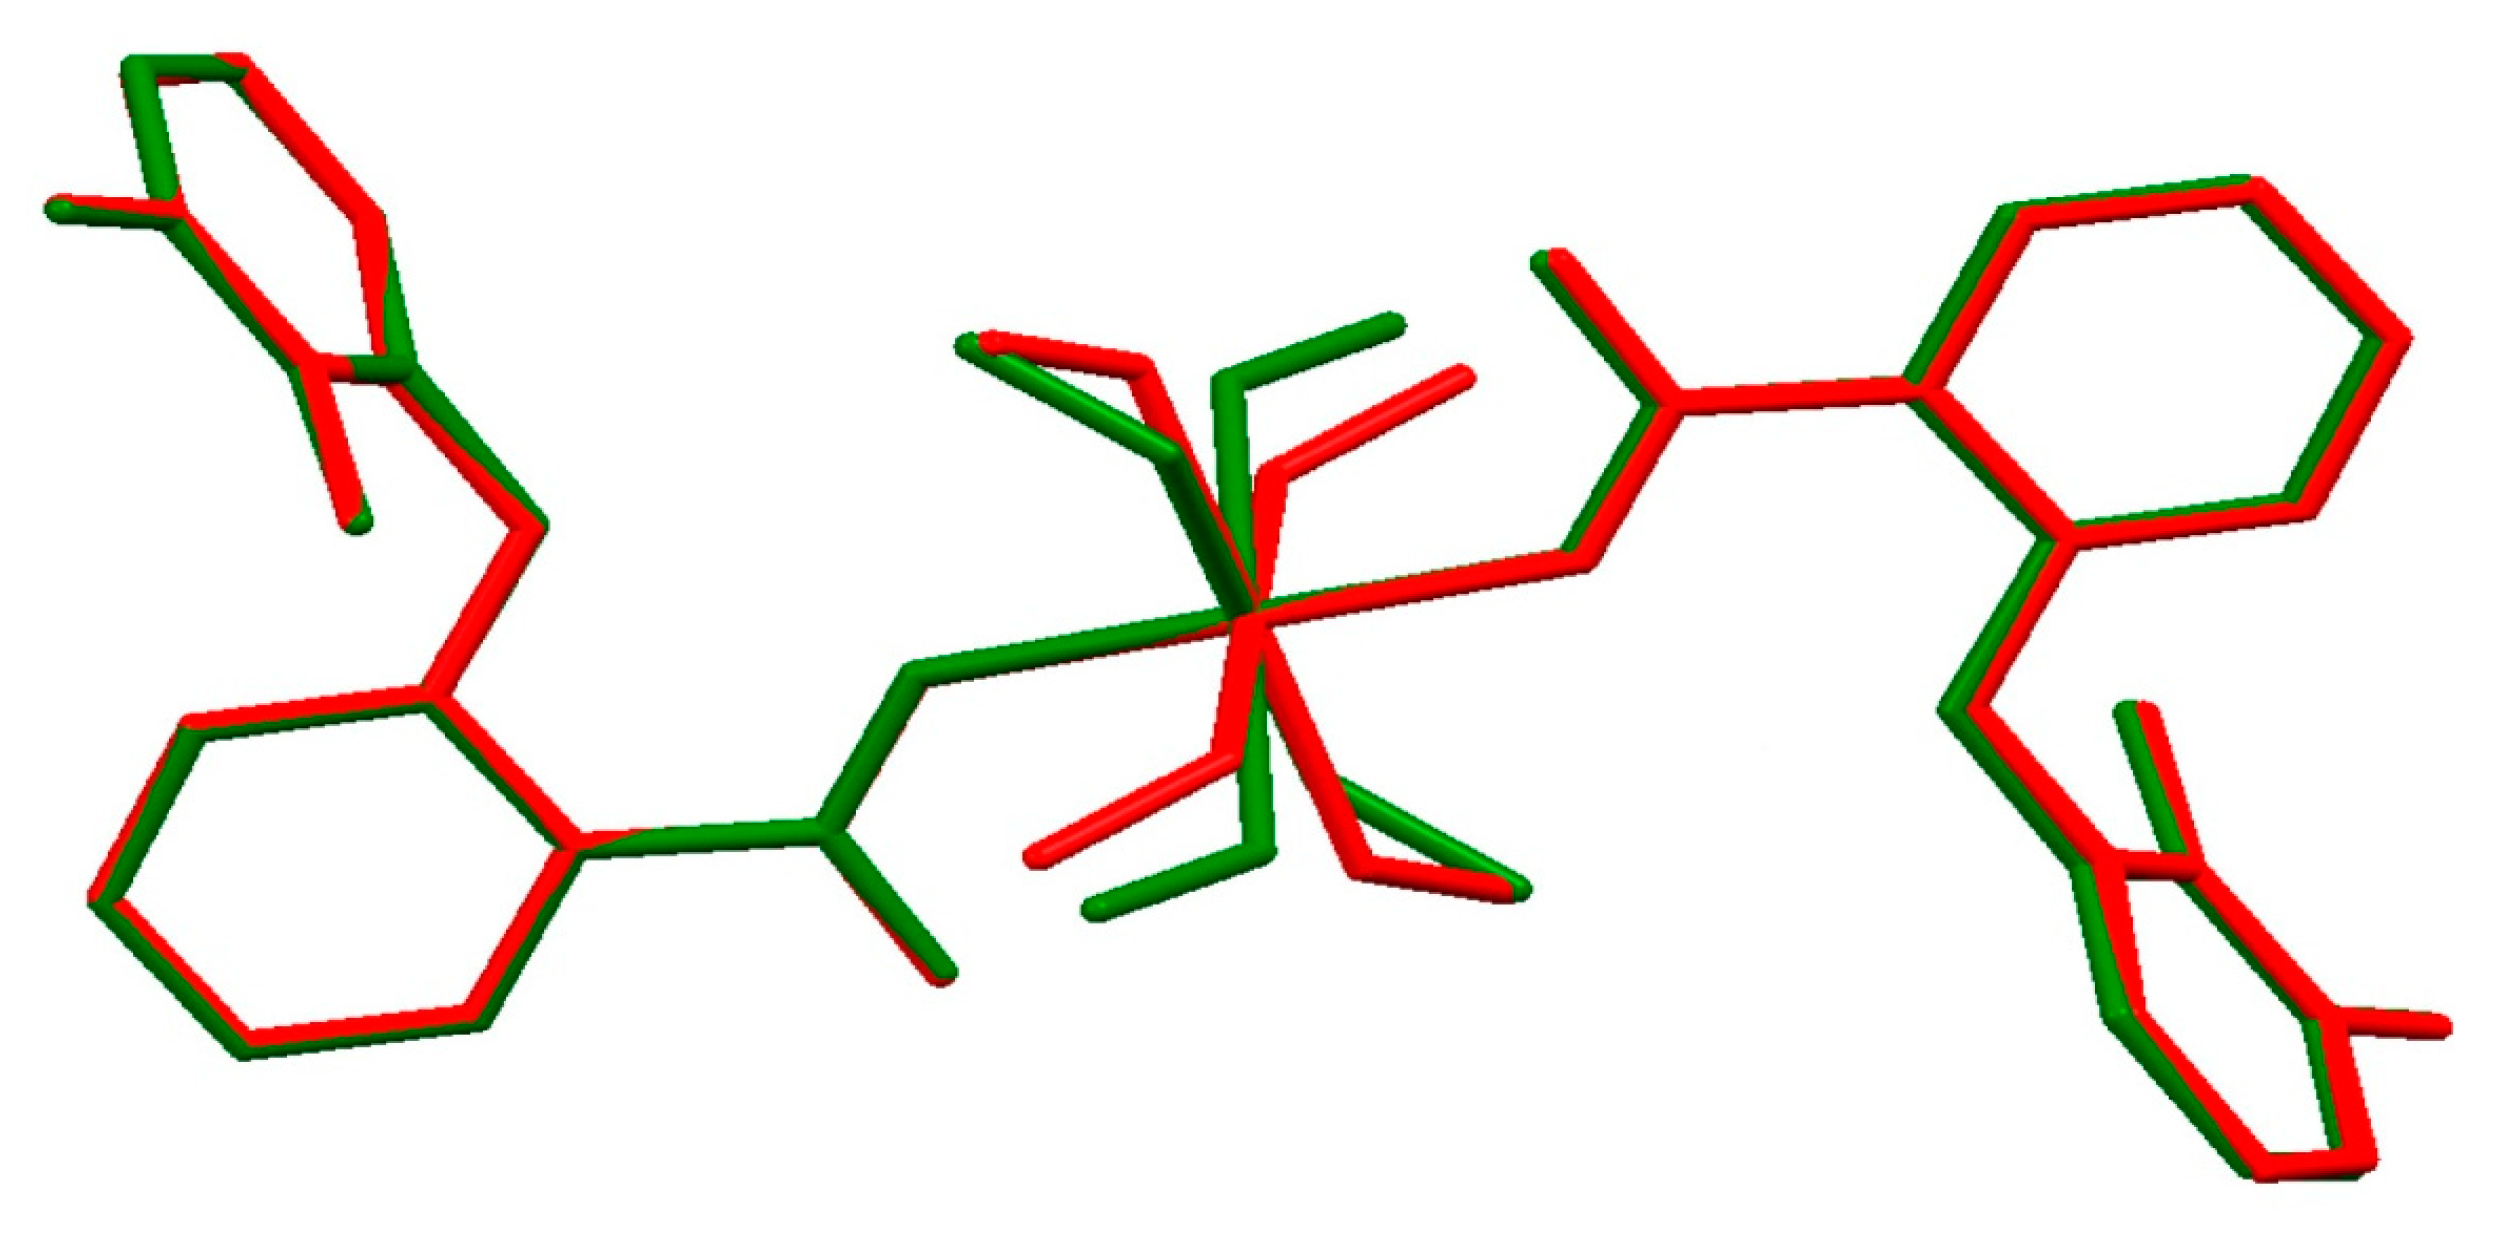
2.1.2. Crystal Structure of 3 and 4

The centrosymmetric, triclinic crystals of 3 and 4 (Figure 2) are quasi-isostructural [43]. Their asymmetric units contain one-half metal ions, a single mefenamato ligand, two coordinated methanol species, and an additional methanol molecule in the outer coordination sphere. The inner coordination spheres of both complexes are quite similar. Octahedral metal ions are placed on inversion centers. They are surrounded by two equatorial mefenamato carboxylate oxygen atoms augmented by two equatorial and two apical methanol molecules. Similarly to 2, the 2-((2,3-dimethylphenyl)amino)benzoate moieties in 3 and 4 adopt twisted conformations with dihedral angles between phenyl rings equal 74.60(3) and 74.38(18)°, respectively. Apical Co–O3A (2.1220(15) Å) and Ni–O3B (2.113(3) Å) bonds involving methanol species are longer than relevant equatorial bonds (Co–O4A and Ni–O4B; 2.0803(13) and 2.051(2) Å, respectively). The equatorial coordination bonds involving the carboxylate O1 atoms of the mefenamato moieties are slightly shorter (2.0556(8) and 2.0207(8) Å for 3 and 4, respectively). A structurally similar complex (Mn(mef)2(MeOH)4) was recently reported by Feng et al. [32]. Following the larger atomic radius of manganese, all bonds within the Mn coordination sphere of this compound are longer than the respective bonds observed in 3 and 4.
The quasi-isostructurality of 3 and 4 is driven by the diverse topologies of the strong hydrogen bonds in both crystals; see Table 4 and Table 5, respectively. The superposition of both structures is presented in Figure 3. In 3, the carboxylate O2 of the mefanamato moiety is involved in hydrogen bonding with the O4 equatorial methanol molecule. The O5 methanol of the outer coordination sphere is connected to the axial O3. A diverse situation is observed in 4, where carboxylate O2 interacts with axial O3, while equatorial O4 is involved in H bonding with O5. The latter is a hydrogen donor for contact with carboxylate O2 in either 3 or 4. The resulting chain may be characterized by motif C 3 3 ( 7 ) (Figure S2). The conformation of mefanamato moieties in all investigated complexes 24 is stabilized by the intramolecular interactions of the amine nitrogen atoms with carbonyl groups.

2.1.3. Crystal Packing Analysis of 2–4

The molecular shapes of structures 24 were visualized as Hirshfeld surfaces (HSs) (Figure 4). In 2, the mer unit of infinite polymeric chain was selected for the HS visualization. Relevant fingerprint plots (FPs) derived from the HSs were generated for each structure to characterize the propensity of these species to form particular intermolecular contacts. Crystal packing arrangements in all structures may be defined by three types of contacts, namely HH, CH, and OH. Additionally, the fingerprint analysis revealed the limited presence of NH contacts, as indicated by their contributions below 1%. Due to the polymeric character of 2, the HH contacts contribution of 63.7% is notably lower than that in 3 and 4. The latter approach 70.2% and 70.4%, respectively. The FPs of all systems feature symmetrical wings that visualize CH contacts and follow the C–Hπ and O–Hπ interactions. The contribution of CH contacts in the crystal packing is visibly higher for polymeric structure 2 (26.2%) than those in 3 and 4 (21.9% and 22.4%, respectively). Similarly, the OH contacts contributions over all structures range from 7.0% to 8.2%. These contacts are depicted as sharp spikes for 2, while for 3 and 4, those spikes are slightly bold. The latter presumable follow the methanol molecule disorder in the crystal structures of 3 and 4. Interestingly, a difference in the intermolecular hydrogen bond topology is also apparent in the OH contact contribution. Structure 3, where axial O3 is a hydrogen donor for the outer O5 methanol, is characterized by an OH contacts contribution of 7.0%. The equatorial position of the relevant hydrogen bond donor in 4 results in an increase of the OH contacts’ contribution to 7.7%.
The fingerprint analysis showed that supramolecular systems of 24 are defined by a relatively similar set of contacts. The most distinguished is a polymeric system in 2. Nonetheless, the quantitative analysis of intermolecular contacts helped to expose the subtle differences in supramolecular assemblies, as observed in the quasi-isostructural systems of 3 and 4.

2.2. Infrared Spectra of 2–4

All complexes exhibit sharp bands in the range of 3290–3305 cm−1 and weak broad absorption bands in the region of 2900–3200 cm−1 associated with the ν(NH) and ν(OH) stretching vibrations, respectively (Figure S3). Additionally, bands at 3610–3630 cm−1 for 3 and 4 are assigned to the ν(OH) stretching vibration of methanol molecules. The characteristic bands originated from carboxylate group appear in the range of 1350–1700 cm−1. In particular, sharp absorption peaks appearing at 1610.3, 1604.5, and 1604.5 cm−1 correspond to νas(COO) and peaks at 1380.8, 1382.8, and 1384.3 cm−1 are assigned to νs(COO) stretching vibrations of carboxylate group for 2, 3, and 4, respectively. The parameter ∆ν=νas(COO) – νs(COO) is larger than that for sodium mefenamate [40], and according to Nakamoto [44], the criteria the coordination mode of carboxylate groups may be described as monodentate.

2.3. Thermal Analysis of 2–4

The TG/DTG/DTA curves of 2, 3, and 4 are summarized in Figure 5. The decomposition pathways are slightly different for each complex. Compound 2 starts to decompose through the concurrent elimination of the ethanol molecule together with two water molecules (mass loss exp. 12.70% and calc. 13.23%) proceeding at the temperature range of 80–250 °C. It is accompanied by endo- and exo-thermic effects on the DTA curve. The next step represents the mass loss (exp. 12.70% and calc. 13.23%) associated with the destruction of two mefenamate ligands at the temperature range of 250–480 °C. The latter leads to the final product Co3O4 (exp. 12.93% and calc. 12.57%). The corresponding two endo-thermic and one exo-thermic effects were also identified and are shown on the DTA curve.
The thermal decomposition of 3 and 4 begins with the release of methanol molecules. In 3, it proceeds in one step, while two distinguished steps were identified for 4. The weight loss of the former (exp. 26.04% and calc. 26.27%) at 60–260 °C is consistent with the elimination of six methanol molecules altogether. In 4, two methanol molecules are lost at the temperature range of 100–180 °C (exp. 9.87% and calc. 8.76%), while further four molecules are released at 180–430 °C (exp. 18.13% and calc. 17.52%). The DTA curves exhibit characteristic exo-effects related to those steps. In 4, both symmetry-related O5 methanols from the outer coordination sphere form weaker hydrogen bonds with the carbonyl O2 than the relevant molecules in 3 (Table 4 and Table 5, respectively). Presumably, the former facilitates a two-step methanol elimination with premature O5 release, as observed in 4.
Further heating leads to the destruction of both mefenamato moieties in a single step. The experimental weight losses were 62.89% (calc. 62.76%) and 61.77% (calc. 63.51%) for 3 and 4, respectively. The corresponding exo- and endo-thermal effects are visible on relevant DTA curves. The final products of thermal decompositions are Co3O4 for 3 and NiO for 4. Their experimental residual masses (Co3O4: 11.07%; NiO: 10.28%) were close to calculated values (Co3O4: 10.97%; NiO: 10.21%).

2.4. Antioxidant and Antimicrobial Activities

The antibacterial, antifungal, and antioxidant activities were determined for complexes 24 and, additionally, 510 published by us [40]. The above three activities were also analyzed, for the mefenamic acid 1 taken as a reference.
The investigated complexes exhibited visible RSAs (i.e., higher than that of 1), with those of 5, 4, 2, and 8 being the highest. The final antioxidant activities are in the order of 5 > 4 > 2 > 8 > 3 > 7 > 9 > 10 > 6 (Figure 6). Similar results were reported by Altun and Suözer [45], who pointed out that the electron withdrawing effect of the metal(II) ion facilitates the release of hydrogen, which further reduces the DPPH radical.
The results of the antibacterial and antifungal activities are presented in Table 6. Vancomycin (Van) and nystatin (Nys) were used as the standard drugs. Notably, the tested derivatives showed no bioactivity against Gram-negative bacteria (E. coli ATCC 25922, S. Typhimurium ATCC 14028, K. pneumoniae ATCC 13883, P. aeruginosa ATCC 9027, and P. mirabilis ATCC 12453) with minimal inhibition concentrations (MIC) (MIC 500 – >1000 mg/L). The MIC values for Gram-positive reference bacteria indicated the good (MIC 26–125 mg/L) or moderate (MIC 126–500 mg/L) anti-staphylococcal (S. aureus ATCC 25923 and S. epidermidis ATCC 12228), anti-micrococcal (M. luteus ATCC 10240), and anti-streptococcal (S. pyogenes ATCC 19615, S. pneumonia ATCC 49619, and S. mutans ATCC 25175) activity of the tested compounds [46]. The antibacterial efficiency of the tested derivatives was in the order of 10 > 3 > 2 > 6 > 4 > 9 > 7 > 5 > 8 > 1. The antifungal bioactivity (C. albicans ATCC 2091, C. glabrata ATCC 90030, and C. parapsilosis ATCC 22019) of the tested compounds was mild or moderate, with that of 10 being the highest.

3. Experimental

3.1. Preparation of Complexes and Crystallization

Compounds 2, 3, and 4 were synthesized by the dissolution of mefenamic acid (1 mmol) in 50 mL of a freshly precipitated aqueous-ethanol solution (1:1) of NaOH (0.02 mol·L−1). Further, sodium mefenamate was heated up to 60 °C and slowly added to an aqueous solution of metal chlorides (0.5 mol in 25 mL). The reaction mixture was kept at 60 °C for 2 hours. After several days, the polycrystalline powders were isolated by filtration, washed with a hot water, and dried in air [40].
Single crystals of the 2, 3, and 4 complexes suitable for X-ray structure analysis were obtained at room temperature by slow evaporation from the aqueous/ethanol (1:2 v/v) solution for 2 and from a pure methanol for 3 and 4. Good quality crystals appeared after two weeks.

3.2. Materials and Methods

Mefenamic acid was purchased from Sigma-Aldrich and used without further purification. Methanol, ethanol, and DPPH (2,2-diphenyl-1-picrylhydrazyl) were purchased from Lab-Scan, and other chemicals were from POCh—Gliwice, Poland. All reagents were chemically pure.
The chemical compositions of 24 were determined by the elemental analysis (EA) and flame atomic absorption spectrometry (FAAS). Initially, samples (20 mg) were mineralized by the Anton Paar Multiwave 3000 closed microwave system; a mixture of concentrated HNO3 and HCl (6:1, v/v) was applied. Metals concentration were measured by the FAAS with the GBC Scientific Equipment 932 Plus spectrometer. Hydrogen, carbon, and nitrogen contents were measured with the Vario EL III Elemental Analyzer.
The infrared spectra of 24 were recorded with the Thermo Scientific Nicolet 6700 FTIR spectrometer equipped with liquid nitrogen-cooled MCT (mercury cadmium telluride—HgCdTe) detector. Samples were prepared as KBr pellets and measured over the range of 4000–400 cm−1.
The thermal stability and decomposition pathways of 24 were studied by thermogravimetric techniques. All complexes were measured with a Netzsch TG 209 apparatus. Samples (10 mg) were heated (in ceramic crucibles) up to 1000 °C at a heating rate 10 °C min−1 in an air atmosphere.
The single-crystal X-ray diffraction experiments of 24 were performed on a Rigaku XtaLAB Synergy Dualflex Pilatus 300K diffractometer. Measurements were conducted using PhotonJet microfocus X-ray source CuKα (λ = 1.54184 Å) for 2, while MoKα (λ = 0.71073 Å) radiation was used for 3 and 4. Crystals were kept at 100.0(1) K during data collection. The data were integrated using the CrysAlisPro software [47]. All structures were solved using the intrinsic phasing method in ShelXT [48] and refined by the full matrix least squares minimization on F2 with the ShelXL [49] refinement package. The structure of 2 was refined as a two-component twin with a twin scale factor of 0.458(1). The structures of 24 were notably affected by static disorder, with the mefenamato fragments being disordered over two positions. Relevant occupancy factors were refined to 0.52(3):0.48(3) in 2, 0.678(3):0.322(3) in 3, and 0.527(1):0.473(1) in 4. In 3, coordinated and non-coordinated methanol molecules were also disordered over two orientations with occupancy factors refined to 0.678(3):0.322(3) and 0.61(2):0.39(2), respectively Similarly, in 4, methanol molecules were refined over 2 positions, thus resulting in an occupancy factor of 0.591(3):0.409(3). In all structures, the sums of occupancies of relevant sites were set equal to 1 and refined using free variables. The PART instruction was applied to exclude bonding between equivalent disordered atoms. The anisotropic displacement parameters of neighboring disordered atoms were restrained using the SIMU and RIGU procedures in ShelXL. In 2 and 4, a few disordered atoms were additionally fixed with the EADP instruction. The geometries of disordered fragments were restrained using the DFIX and SADI commands, while O–H and N–H hydrogen atoms were located in difference Fourier maps, C–H hydrogens were generated geometrically using the HFIX command, and a riding model was applied for the refinement. Molecular plots and packing diagrams were drawn using Mercury [50]. Geometry parameters were computed with PLATON [51].
The CIF file for 24 is available from the Cambridge Crystallographic Data Centre (CCDC) (deposition numbers CCDC: 1989350, 1989353, and 1989354, respectively). Hirshfeld surfaces (HSs) were generated using the CrystalExplorer17 program. Molecular geometries were the same as in crystal structures. For molecular fragments where crystallographic disorder was identified, the major components were only considered. The distances from the HS to the nearest atom interior and exterior to the surface (di and de, respectively) were calculated and plotted as scattergrams [52]. A quantitative decomposition analysis of atom-to-surface contacts was calculated as a percentage of the points in the Hirshfeld surface with di and de for specific atom pairs.
The radical scavenging activities (RSAs) of 110 were evaluated by measuring scavenging ability of the DPPH free radical. The solutions were prepared as following: 0.5 mL methanolic solutions of the complexes (0.04, 0.06, 0.08, and 0.1 mol/L) were mixed with the DPPH methanolic solution (60 μM and 0.5 mL) in the dark. The samples were incubated at 25 °C for 30 min in the dark to reach equilibrium before the measurement. The radical scavenging ability of compounds was calculated using the equation: I% = (1 − As/A0) × 100, where A0 is the absorbance of the sample at 0 min and AS is the absorbance of the sample at 30 min. The RSA experiment was repeated in triplicate. The average values were noted.
The antibacterial and antifungal activities were screened for 110 via the micro-dilution broth method according to the European Committee on Antimicrobial Susceptibility Testing (EUCAST) using a Mueller–Hinton broth and a Mueller–Hinton broth with 5% lysed sheep blood for the growth of non-fastidious and fastidious bacteria, respectively, or RPMI with MOPS for the growth of fungi. The minimal inhibitory concentrations (MIC) of the tested derivatives were evaluated for the panel of the reference microorganisms from the American Type Culture Collection (ATCC), including Gram-negative bacteria (Escherichia coli ATCC 25922, Salmonella Typhimurium ATCC14028, Klebsiella pneumoniae ATCC 13883, Pseudomonas aeruginosa ATCC 9027, and Proteus mirabilis ATCC 12453), Gram-positive bacteria (Staphylococcus aureus ATCC 25923, Staphylococcus epidermidis ATCC 12228, Micrococcus luteus ATCC 10240, Enterococcus faecalis ATCC 29212 Bacillus subtilis ATCC 6633, Bacillus cereus ATCC 10876, Streptococcus pyogenes ATCC 19615, Streptococcus pneumoniae ATCC 49619, and Streptococcus mutans ATCC 25175), and fungi (Candida albicans ATCC 10231, Candida parapsilosis ATCC 22019, and Candida glabrata ATCC 90030).
The complexes dissolved in DMSO were first diluted to the concentration of 1000 mg/L in an appropriate broth medium recommended for bacteria or yeasts. Then, using the same media, serial two-fold dilutions were made in order to obtain final concentrations of the tested derivatives ranged from 1.95 to 1000 mg/L. The sterile 96-well polystyrene microtitrate plates (Nunc, Denmark) were prepared by dispensing 200 µL of the appropriate dilution of the tested derivatives in broth medium per well. The inocula were prepared with fresh microbial cultures in sterile 0.85% NaCl to match the turbidity of 0.5 McFarland standard, and 2 μL were added to wells to obtain a final density of 1.5 × 10⁶ CFU/mL for bacteria and 5 × 10⁴ CFU/mL for yeasts; CFU—colony forming units. After incubation (bacterial strains—35 °C for 24 h; yeast strains—30 °C for 48 h), the MICs were visually assessed as the lowest concentration of the extracts showing the complete growth inhibition of the reference microbial strains. An appropriate DMSO control (at a final concentration of 10%), a positive control (containing inoculum without the tested derivatives), and a negative control (containing the tested derivatives without inoculum) were included on each microplate. Minimal bactericidal concentration (MBC) or minimal fungicidal concentration (MFC) was determined by subculturing 5 μL of the microbial culture from each well that showed growth inhibition, from the last positive one and from the growth control onto the recommended agar plates. The plates were incubated at 35 °C for 24 h, and the MBC/MFC was defined as the lowest concentration of the extracts without the growth of microorganisms. Each experiment was repeated in triplicate. The highest MIC value was noted [53].

4. Conclusions

In summary, three metal complexes of cobalt and nickel with mefenamato ligand were characterized by X-ray structure analysis combined with elemental and thermal analyses that were further augmented by spectroscopic and biological activity studies. The structure of 3 and 4 are stabilized by strong intermolecular hydrogen bonds of diverse topologies, thus yielding quasi-isostructural arrangements. Their crystal packing formation is reflected by the Hirshfeld surface analysis of intermolecular contacts. The latter shows subtle differences in the OH contacts contributions, which are closely related to diverse hydrogen bonds topologies and thermal decomposition patterns, as observed in 3 and 4. In particular, the higher contribution of OH contacts prompts a single step of methanol molecule elimination. On the contrary, a two-stage elimination can be observed in 4.
The antibacterial, antifungal, and antioxidant activities were determined for 24 and additionally for six complexes with mefenamic acid, namely 510, the syntheses of which were recently published by us. All investigated complexes showed an antioxidant activity higher than that of mefenamic acid. The most promising antioxidant scavengers were 5 and 4, with maximum actions of 42.0% and 38.2%, respectively. Additionally, the tested compounds exhibited moderate to strong activity against Gram-positive rods. Compounds 10, 3, 2, and 6 were the most promising antibacterial agents. However, only 10 exhibited a significant antifungal bioactivity.

Supplementary Materials

The supplementary material includes: Polymeric chain running along the [100] axis in 2 (Figure S1); Fragment of the intermolecular chain along [100] stabilized by hydrogen bonds, as in 3(a) and 4(b) (Figure S2); FTIR spectra of 24 (Figure S3). Bond distances for 2, 3, and 4 (Tables S1, S4, and S7, respectively); Bond angles for 2, 3, and 4 (Tables S2, S5 and S8, respectively); Torsion angles for 2, 3 and 4 (Tables S3, S6 and S9, respectively).

Author Contributions

Conceptualization, K.K., M.G. and W.M.W.; Methodology, A.P., I.K.-G., K.K. and M.G.; Validation, A.P., I.K.-G., K.K., M.G. and W.M.W.; Formal analysis, M.G. and W.M.W.; Investigation, A.P., I.K.-G., K.K., M.G. and W.M.W.; Writing—original draft preparation, M.G.; Writing—review and editing, K.K., M.G. and W.M.W.; Visualization, A.P. and M.G.; Supervision, K.K. and W.M.W. All authors have read and agreed to the published version of the manuscript.

Funding

This research received no external funding.

Conflicts of Interest

The authors declare that they have no conflicts of interest.

References

  1. Krawczyk, M.S.; Majerz, I. The Na-O Bond In sodium fenamate. Acta Cryst. 2019, B75, 766–774. [Google Scholar] [CrossRef]
  2. Gacki, M.; Kafarska, K.; Wolf, W.M. A supramolecular polymeric chain in the cobalt(II) complex with diclofenac: Synthesis, crystal structure, spectroscopic, thermal and antioxidant activity. J. Coord. Chem. 2019, 72, 3481–3494. [Google Scholar] [CrossRef]
  3. Tarushi, A.; Geromuchalos, G.D.; Lafazanis, K.; Raptopoulou, C.P.; Psycharis, V.; Lalioti, L.; Pantazaki, A.A.; Kessissoglou, D.P.; Tangoulis, V.; Psomas, G. A step-ladder manganese(III) metallacrown hosting mefenamic acid and a manganese(II)–mefanamato complex: Synthesis, characterization and cytotoxicactivity. N. J. Chem. 2018, 42, 6955–6976. [Google Scholar] [CrossRef]
  4. De Groot, D.J.A.; de Vries, E.G.E.; Groen, H.J.M.; de Jong, S. Non-steroidal anti-inflammatory drugs to potentiate chemotherapy effects: From lab to clinic. Crit. Rev. Oncol. Hematol. 2007, 61, 52–59. [Google Scholar] [CrossRef]
  5. Orido, T.; Fujino, H.; Hasegawa, Y.; Toyomura, K.; Kawashima, T.; Murayama, T. Indomethacin Decreases Arachidonic Acid Uptake in HCA-7 Human Colon Cancer Cells. J. Pharmacol. Sci. 2008, 108, 389–392. [Google Scholar] [CrossRef] [Green Version]
  6. Altay, A.; Caglar, S.; Ceglar, B.; Sahin, O. Synthesis, structural, thermal elucidation and in vitro anticancer activity of novel silver(I) complex with non-steroidal anti-inflammatory drugs diclofenac and mefenamic acid including picoline derivatives. Polyhedron 2018, 151, 160–170. [Google Scholar] [CrossRef]
  7. Herendeen, J.M.; Lindley, C. Use of NSAIDs for the chemoprevention of colorectal cancer. Ann. Pharmacother. 2003, 37, 1664–1674. [Google Scholar] [CrossRef]
  8. Rao, C.V.; Reddy, B.S. NSAIDs and chemoprevention. Curr. Cancer Drug Targets 2004, 4, 29–42. [Google Scholar] [CrossRef] [Green Version]
  9. Bernstein, J. Polymorphism in Molecular Crystals; Oxford University Press: Oxford, UK, 2002. [Google Scholar]
  10. Salbego, P.R.S.; Bender, C.R.; Orlando, T.; Moraes, G.A.; Copetti, J.P.P.; Weimer, G.H.; Bonacorso, H.G.; Zanatta, N.; Hoerner, M.; Martins, M.A.P. Supramolecular similarity in polymorphs: Use of similarity indices (Ix). ACS Omega 2019, 4, 9697–9709. [Google Scholar] [CrossRef] [Green Version]
  11. Resnati, G.; Boldyreva, E.; Bombicz, P.; Kawano, M. Supramolecular interactions in the solid state. IUCrJ 2015, 2, 675–690. [Google Scholar] [CrossRef] [Green Version]
  12. Ranjan, S.; Devarapalli, R.; Kundu, S.; Saha, S.; Deolka, S.; Vangala, V.R.; Reddy, C.M. Isomorphism: ‘molecular similarity of crystal structure similarity’ in multicompponent forms of analgesic drugs tolfenamic and mefenamic acid. IUCrJ 2020, 7, 173–183. [Google Scholar] [CrossRef] [PubMed] [Green Version]
  13. Bombicz, P. The way from isostructurality to polymorphism. Where are the borders? The role of supramolecular interactions and crystal symmetries. Crystallogr. Rev. 2017, 23, 118–151. [Google Scholar] [CrossRef]
  14. Scherrer, R.A.; Arbor, A. Anthranilic Acid Derivatives. U.S. Patent 3138636, 23 June 1960. [Google Scholar]
  15. Whitehouse, M.W. Drugs to treat inflammation: A historical introduction. Curr. Med. Chem. 2005, 12, 2931–2942. [Google Scholar] [CrossRef] [PubMed]
  16. Smolková, R.; Smolko, L.; Zeleňák, V.; Kuchárc, J.; Gyepes, R.; Talian, I.; Sabo, J.; Biščáková, Z.; Rabajdová, M. Impact of the central atom on human genomic DNA and human serum albumin binding properties in analogous Zn(II) and Cd(II) complexes with mefenamic acid. J. Mol. Struct. 2019, 1188, 42–50. [Google Scholar] [CrossRef]
  17. Adam, A.; Schrimpl, L.; Schmidt, P.C. Some physicochemical properties of mefenamic acid. Drug Dev. Ind. Pharm. 2000, 26, 477–487. [Google Scholar] [CrossRef]
  18. Batool, S.S.; Gilani, S.R.; Zainab, S.S.; Tahir, M.N.; Harrison, W.T.A.; Syed, Q.; Mazhar, S. Synthesis and structural characterization of a monomeric mixed ligand copper(II) complex involving N, N,N’,N’-tetramethylethylenediamine and mefenamate. J. Struct. Chem. 2019, 60, 1156–1165. [Google Scholar] [CrossRef]
  19. Joo, Y.; Kim, H.-S.; Woo, R.-S.; Hyoung Park, H.; Shin, K.-Y.; Lee, J.-P.; Chang, K.-A.; Kim, S.; Suh, Y.-H. Mefenamic acid shows neuroprotective effects and improves cognitive impairment in in vitro and in vivo alzheimer’s disease models. Mol. Pharmacol. 2006, 69, 76–84. [Google Scholar] [CrossRef] [Green Version]
  20. SeethaLekshmi, S.; Guru Row, T.N. Conformational polymorphism in a non-steroidal anti-inflammatory drug, mefenamic acid. Cryst. Growth Des. 2012, 12, 4283–4289. [Google Scholar] [CrossRef]
  21. Abbas, N.; Oswald, I.D.H.; Pulham, C.R. Accessong mefenamic acid form II through high-pressure recrystallisation. Pharmaceutics 2017, 9, 16. [Google Scholar] [CrossRef] [Green Version]
  22. Aguiar, A.J.; Zelmer, J.E. Dissolution behavior of polymorphs of chloramphenicol palmitate and mefenamic acid. J. Pharm. Sci. 1969, 58, 983–987. [Google Scholar] [CrossRef]
  23. Romero, S.; Escalera, B.; Bustamante, P. Solubility behavior of polymorphs I and II of mefenamic acid in solvent mixtures. Int. J. Pharm. 1999, 178, 193–202. [Google Scholar] [CrossRef]
  24. McConnell, J.; Company, F.Z. N-(2,3-xylyl) anthranilic acid, C15H15NO2. Mefenamic acid. Cryst. Struct. Commun. 1976, 5, 861–864. [Google Scholar]
  25. Lee, E.H.; Byrn, S.R.; Carvajal, M.T. Additive-induced metastable single crystal of mefenamic acid. Pharm. Res. 2006, 23, 2375–2380. [Google Scholar] [CrossRef] [PubMed]
  26. Amidon, G.L.; Lennernas, H.; Shah, V.P.; Crison, J.R.A. A theoretical basis for a bio-pharmaceutical drug classification: The correlation of in vitro drug product dissolution and in vivo bioavailability. Pharm. Res. 1995, 12, 413–420. [Google Scholar] [CrossRef] [Green Version]
  27. Reiss, A.; Cioatera, N.; Chifiriuc, M.C.; Munteanu, G.; Ganescu, A.; Dabuleanu, I.; Avram, G.; Spinu, I.C.; Rotaru, P.J. New biologically active mixed-ligand Co(II) and Ni(II) complexes of enrofloxacin. Therm. Anal. Calorim. 2018, 134, 527–541. [Google Scholar] [CrossRef]
  28. Mewis, R.; Archibald, S.J. Biomedical applications of macrocyclic ligand complexes. Coord. Chem. Rev. 2010, 254, 1686–1712. [Google Scholar] [CrossRef]
  29. Badea, M.; Pătraşcu, F.; Cerc Korošec, R.; Bukovec, P.; Raita, M.; Chifiriuc, M.C.; Măruţescu, L.; Bleotu, C.; Velescu, B.; Marinescu, D.; et al. Thermal, spectral, magnetic and biologic characterization of new Ni(II), Cu(II) and Zn(II) complexes with a hexaazamacrocyclic ligand bearing ketopyridine moieties. J. Therm. Anal. Calorim. 2014, 118, 1183–1193. [Google Scholar] [CrossRef]
  30. Kovala-Demertzi, D.; Staninska, M.; Garcia-Santos, I.; Castineiras, A.; Demertzis, M.A. Synthesis, crystal structures and spectroscopy of meclofenamic acid and its metal complexes with manganese(II), copper(II), zinc(II) and cadmium(II). Antiproliferative and superoxide dismutase activity. J. Inorg. Biochem. 2011, 105, 1187–1195. [Google Scholar] [CrossRef]
  31. Kovala-Demertzi, D.; Dokorou, V.; Primikiri, A.; Vargas, R.; Silvestru, C.; Russo, U.; Demertzisa, M.A. Organotin meclofenamic complexes: Synthesis, crystal structures and antiproliferative activity of the first complexes of meclofenamic acid—Novel anti-tuberculosis agents. J. Inorg. Biochem. 2009, 103, 738–744. [Google Scholar] [CrossRef]
  32. Feng, J.; Du, X.; Liu, H.; Sui, X.; Zhang, C.; Tang, Y.; Zhang, J. Manganese-mefenamic acid complexes exhibit high lipoxygenase inhibitory activity. Dalton Trans. 2014, 43, 10930–10939. [Google Scholar] [CrossRef]
  33. Dimiza, F.; Papadopoulos, A.N.; Tangoulis, V.; Psycharis, V.; Raptopoulou, C.P.; Kessissoglou, D.P.; Psomas, G. Biological evaluation of non-steroidal anti-inflammatory drugs-cobalt(ii) complexes. Dalton Trans. 2010, 39, 4517–4528. [Google Scholar] [CrossRef] [PubMed]
  34. Tottaa, X.; Papadopoulou, A.A.; Hatzidimitriou, A.G.; Papadopoulos, A.; Psomas, G. Synthesis, structure and biological activity of nickel(II) complexes with mefenamato and nitrogen-donor ligands. J. Inorg. Biochem. 2015, 145, 79–93. [Google Scholar] [CrossRef]
  35. Facchin, G.; Torre, M.H.; Kremer, E.; Piro, O.E.; Baran, E.J. Crystal structure and spectroscopic behaviour of a binuclear copper(II) complex of mefenamic acid and dimethylsulfoxide. Z. Nat. 1998, B53, 871–874. [Google Scholar] [CrossRef]
  36. Sharma, R.P.; Kumar, S.; Venugopalan, P.; Ferretti, V.; Tarushi, A.; Psomas, G.; Witwicki, M. New copper(ii) complexes of the anti-inflammatory drug mefenamic acid: A concerted study including synthesis, physicochemical characterization and their biological evaluation. RSC Adv. 2016, 6, 88546–88558. [Google Scholar] [CrossRef]
  37. Dimiza, F.; Fountoulaki, S.; Papadopoulos, A.N.; Kontogiorgis, C.A.; Tangoulis, V.; Raptopoulou, C.P.; Psycharis, V.; Terzis, A.; Kessissoglou, A.P.; Psomas, G. Non-steroidal antiinflammatory drug–copper(ii) complexes: Structure and biological perspectives. Dalton Trans. 2011, 40, 8555–8568. [Google Scholar] [CrossRef] [PubMed]
  38. Tarushi, A.; Karaflou, Z.; Kljun, J.; Turel, I.; Psomas, G.; Papadopoulos, A.N.; Kessissoglou, D.P. Antioxidant capacity and DNA-interaction studies of zinc complexes with a non-steroidal anti-inflammatory drug, mefenamic acid. J. Inorg. Biochem. 2013, 128, 85–96. [Google Scholar] [CrossRef]
  39. Dokorou, V.; Ciunik, Z.; Russo, U.; Kovala-Demertzi, D. Synthesis, crystal structures and spectroscopic studies of diorganotin derivatives with mefenamic acid. Crystal and molecular structures of 1,2:3,4-di-μ2-2-[(2,3-dimethylphenyl)amino]-benzoato-O,O-1,3-bis-2-[(-[(2,3-dimethylphenyl)amino]benzoato-O-1,2,4:2,3,4-di-μ3-oxo-tetrakis[di-methyltin(IV)] and 1,2:3,4-di-μ2-2-[(-[(-[(2,3-dimethylphenyl)amino]-benzoato-O,O-1,3-bis-2-[(-[(-[(2,3-dimethylphenyl)amino]benzoato-O-1,2,4:2,3,4-di-μ3-oxo-tetrakis[di-n-butyltin(IV)]. J. Organomet. Chem. 2001, 630, 205–214. [Google Scholar]
  40. Kafarska, K.; Gacki, M.; Wolf, W.M. Synthesis, spectroscopic, and thermal investigations of metal complexes with mefenamic acid. J. Chem. 2017, 2017, 1–7. [Google Scholar] [CrossRef] [Green Version]
  41. Bernstein, J.; Davis, R.; Shimoni, L.; Chang, N.-L. Patterns in hydrogen bonding: Functionality and graph set analysis in crystals. Angew. Chem. Int. Ed. 1995, 34, 1555–1573. [Google Scholar] [CrossRef]
  42. Etter, M.C. Encoding and decoding hydrogen-bond patterns of organic compounds. Acc. Chem. Res. 1990, 23, 120–126. [Google Scholar] [CrossRef]
  43. Dey, D.; Thomas, S.P.; Spackman, M.A.; Chopra, D. ‘Quasi-isostructural polymorphism’ in molecular crystals: Inputs from interaction hierarchy and energy frameworks. Chem. Commun. 2016, 52, 2141–2144. [Google Scholar] [CrossRef] [PubMed] [Green Version]
  44. Nakamoto, K. Infrared and Raman Spectra of Inorganic and Coordination Compounds; John Wiley & Sons, Inc.: New York, NY, USA, 2009. [Google Scholar]
  45. Altun, O.; Suözer, M. Synthesis, spectral analysis, stability contants, antioxidant and biological activities of Co(II), Ni(II) and Cu(II) mixed ligand complexes of nicotinamide, theophylline and thiocyanate. J. Mol. Struct. 2017, 1149, 307–314. [Google Scholar] [CrossRef]
  46. O’Donnell, F.; Smyth, T.J.P.; Ramachandran, V.N.; Smyth, W.F. A study of the antimicrobial activity of selected synthetic and naturally occurring quinolines. Int. J. Antimicrob. Agents 2009, 35, 30–38. [Google Scholar] [CrossRef] [PubMed] [Green Version]
  47. CrysAlis Pro; 1.171.39.33c; Rigaku Oxford Diffraction: Tokyo, Japan, 2017.
  48. Sheldrick, G.M. SHELXT-Integrated space-group and crystal-structure determination. Acta Crystallogr. Sect. C Struct. Chem. 2015, 71, 3–8. [Google Scholar] [CrossRef] [PubMed]
  49. HüBschle, C.B.; Sheldrick, G.M.; Dittrich, B. ShelXle: A Qt graphical user interface for SHELXL. J. Appl. Cryst. 2011, 44, 1281–1284. [Google Scholar] [CrossRef] [PubMed] [Green Version]
  50. Macrae, C.F.; Bruno, I.J.; Chisholm, J.A.; Edgington, P.R.; Mccabe, P.; Pidcock, E.; Rodriguez-Monge, L.; Taylor, R.; Van De Streek, J.; Wood, P.A. Mercury: Visualization and analysis of crystal structures. J. Appl. Cryst. 2008, 41, 466–470. [Google Scholar] [CrossRef]
  51. Spek, A.L. Structure validation in chemical crystallography. Acta Crystallogr. Sect. D Biol. Crystallogr. 2009, 65, 148–155. [Google Scholar] [CrossRef]
  52. McKinnon, J.J.; Jayatilaka, D.; Spackman, M.A. Towards quantitative analysis of intermolecular interactions with Hirshfeld surfaces. Chem. Commun. 2007, 37, 3814–3816. [Google Scholar] [CrossRef]
  53. Żesławska, E.; Korona-Głowniak, I.; Szczesio, M.; Olczak, A.; Żylewska, A.; Tejchman, W.; Malm, A. Structural analysis and antimicrobial activity of 2[1H]-pyrimidinethione/selenone derivatives. J. Mol. Struct. 2017, 1142, 261–266. [Google Scholar] [CrossRef]
Sample Availability: Not available.
Scheme 1. Structural schemes of 14.
Molecules 25 03099 sch001
Figure 1. The crystal structure of 2. Hydrogen atoms are omitted for clarity. Displacement ellipsoids are drawn at the 50% probability level. Only the asymmetric unit is labeled, and the major component of disordered atoms are display for clarity.
Molecules 25 03099 g001
Figure 2. Molecular structures of 3(a) and 4(b). Hydrogen atoms are omitted for clarity. Displacement ellipsoids are drawn at the 50% probability level. Only asymmetric units are labeled.
Molecules 25 03099 g002
Figure 3. Superposition of structures 3 (red) and 4 (green). Hydrogen atoms and methanol O5 molecules in the outer coordination sphere are omitted for clarity.
Molecules 25 03099 g003
Figure 4. (a) Hirshfeld surfaces generated for the mer unit of 2 and the single molecules of 3 and 4. (b) Fingerprint plots generated for respective moieties. Labels indicate regions of specific interatomic interactions. (c) The percentage contributions to the Hirshfeld surface areas for intermolecular contacts.
Molecules 25 03099 g004
Figure 5. Thermoanalytical curves for 2 (a), 3 (b), and 4 (c). TG is plotted in green, DTG is in blue, while DTA is in red.
Molecules 25 03099 g005
Figure 6. The radical scavenging activities for all complexes. Mefenamic acid (pale purple) is given as a reference.
Molecules 25 03099 g006
Table 1. Analytical data for 24.
No.CompoundsEmpirical FormulaColorFormula Weight (g/mol)Elemental Analysis, Found (calc.) (%)
CHNM *
2[Co2(mef)4(EtOH)2(H2O)4]C64H74Co2N4O14pale pink1241.1662.21
(61.93)
5.87
(6.01)
4.87
(4.51)
9.96
(9.50)
3[Co(mef)2(MeOH)4]∙2MeOHC36H52CoN2O10pink731.7259.88
(59.09)
7.02
(7.16)
3.27
(3.83)
8.78
(8.05)
4[Ni(mef)2(MeOH)4]∙2MeOHC36H52NiN2O10pale green731.5059.58
(59.11)
7.61
(7.17)
3.97
(3.83)
8.48
(8.02)
* M represents Co in 2 and 3 or Ni in 4.
Table 2. Crystal data and structure refinement parameters for 24.
234
T (K)100.0100100
Crystal systemtriclinictriclinictriclinic
Space groupP 1 ¯ P 1 ¯ P 1 ¯
a (Å)7.80610(10)7.6291(2)7.6176(2)
b (Å)13.0847(4)7.8052(2)7.8118(4)
c (Å)15.7219(5)15.7376(3)15.7014(3)
α (°)105.091(3)89.971(2)89.966(3)
β (°)97.760(2)80.7510(10)80.276(2)
γ (°)97.208(3)87.376(3)87.349(3)
V3)1514.45(7)923.95(4)919.91(6)
Z211
ρcalc (g/cm3)1.3631.3151.320
F(000)654389390
RadiationCuKα (λ = 1.54184)MoKα (λ = 0.71073)MoKα (λ = 0.71073)
2θ range (°)5.914–148.9625.224–61.0125.432–63.01
Reflections collected69876420145789
Independent reflections613456226094
Goodness-of-Fit (GOF)1.0501.0891.044
R [I ≥ 2σ (I)]0.03880.03470.0368
wR2 [I ≥ 2σ (I)]0.10270.09410.0953
Table 3. Hydrogen bond geometry in 2 (Å,°).
D-HAD-HHADAD-HA
O6-H6AO1 a0.83(2)1.85(2)2.672(2)170(3)
O7-H6O30.83(3)1.84(3)2.670(2)174(3)
O5-H5BO20.85(2)1.74(2)2.560(2)161(2)
O5-H5AO4 b0.835(18)1.723(19)2.541(2)166(2)
N1-H1O20.90(3)1.87(3)2.661(3)145(3)
N2A-H2AO40.84(6)1.94(5)2.58(2)132(6)
Symmetry codes: (a) −1+x, y, z; (b) 1−x, 1−y, −z.
Table 4. Hydrogen bond geometry in 3 (Å,°).
D-HAD-HHADAD-HA
N1A-H1AO10.813(18)1.95(2)2.552(5)130(2)
O3A-H3AO5A0.72(3)2.13(3)2.835(5)168(3)
O4A-H4AO20.92(3)1.72(3)2.6045(16)162(3)
O5B-H5BO2 a0.82(6)2.04(6)2.676(11)134(5)
Symmetry codes: (a) −1+x, y, z.
Table 5. Hydrogen bond geometry in 4 (Å,°).
D-HAD-HHADAD-HA
N2B-H2BO10.83(2)1.83(3)2.521(6)133(4)
O3A-H3AO2 a0.84(2)1.772(19)2.5989(17)166(3)
O4A-H4AO5A0.84(3)1.86(3)2.663(5)161(4)
O5A-H5AO2 b0.83(7)2.12(7)2.732(6)131(8)
Symmetry codes: (a) 1-x, 1-y, 1-z; (b) -1+x, y, z.
Table 6. The antibacterial and antifungal activities.
BacteriaMIC (mg/L)
12345678910Van
S. aureus ATCC 25923100012512512525012512525012562.50.98
S. epidermidis ATCC 12228>100025025025050025025025012562.50.98
M. luteus ATCC 1024062.512562.512525062.512562.51253.90.12
E. faecalis ATCC 29212>10001000>10005001000500500100050015.61.95
B. subtilis ATCC 663362.512562.51252501251251251257.80.24
B. cereus ATCC 1087662.562.562.512512562.512562.562.562.50.98
S, pyogenes ATCC 1961512512562.562.525031.312512525031.30.24
S. pneumoniae ATCC 4961912562.562.562.525031.31251251257.80.24
S. mutans ATCC 25175500125125250>10001255025025015.60.98
YeastsMIC (mg/L)
12345678910Nys
C. albicans ATCC 1022311000100010001000500100025010005002500.48
C. parapsilosis ATCC 22019100010001000100050050025050050015.60.24
C. glabrata ATCC 9003010005005001000250500500100010001250.24

