Article

Characteristic Metabolic Changes of the Crust from Dry-Aged Beef Using 2D NMR Spectroscopy

1
Department of Agricultural Biotechnology, Center for Food and Bioconvergence, and Research Institute of Agriculture and Life Science, Seoul National University, Seoul 08826, Korea
2
National Center for Inter-University Research Facilities, Seoul National University, Seoul 08826, Korea
3
Institute of Green Bio Science and Technology, Seoul National University, Pyeongchang 25354, Korea
*
Authors to whom correspondence should be addressed.
Molecules 2020, 25(13), 3087; https://doi.org/10.3390/molecules25133087
Submission received: 9 June 2020 / Revised: 1 July 2020 / Accepted: 2 July 2020 / Published: 7 July 2020
(This article belongs to the Special Issue NMR-Based Metabolomics)

Abstract

:
Two-dimensional quantitative nuclear magnetic resonance (2D qNMR)-based metabolomics was performed to understand characteristic metabolic profiles in different aging regimes (crust from dry-aged beef, inner edible flesh of dry-aged beef, and wet-aged beef striploin) over 4 weeks. Samples were extracted using 0.6 M perchlorate to acquire polar metabolites. Partial least squares-discriminant analysis showed a good cumulative explained variation (R2 = 0.967) and predictive ability (Q2 = 0.935). Metabolites of crust and aged beef (dry- and wet-aged beef) were separated in the first week and showed a completely different aspect in the second week via NMR-based multivariable analyses. Moreover, NMR-based multivariable analyses could be used to distinguish the method, degree, and doneness of beef aging. Among them, the crust showed more unique metabolic changes that accelerated proteolysis (total free amino acids and biogenic amines) and inosine 5′-monophosphate depletion than dry-aged beef and generated specific microbial catabolites (3-indoxyl sulfate) and γ-aminobutyric acid (GABA), while asparagine, glutamine, tryptophan, and glucose in the crust were maintained or decreased. Compared to the crust, dry-aged beef showed similar patterns of biogenic amines, as well as bioactive compounds and GABA, without a decrease in free amino acids and glucose. Based on these results, the crust allows the inner dry-aged beef to be aged similarly to wet-aged beef without microbial effects. Thus, 2D qNMR-based metabolomic techniques could provide complementary information about biochemical factors for beef aging.

1. Introduction

Meat aging is a series of biological and physiochemical transitions from muscle to meat after slaughter that causes proteolysis and enhances meat tenderness and palatability [1,2]. These changes could be used to improve meat quality under controlled environments, such as temperature, relative humidity, aging period, and the aging method by packaging conditions [3]. The major aging methods are divided into dry and wet aging. Meat for wet aging is vacuum-packed, while meat for dry aging is exposed to air without packaging [4]. Dry-aged meat is known to generate concentrated flavors (beefy and roasted) after aging, while wet-aged meat is known to induce sour and bloody/metallic flavors [4,5,6].
Dry-aged meat is commonly produced in aerobic conditions, and its surface is dried rapidly [7]. The dried meat surface is called the crust. Significant water loss occurs in both the crust and internal meat during dry aging [3]. In general, the crust is trimmed-off and considered inedible because of not only hardness and dryness but a high concentration of microorganisms, such as mold and yeast [4,8,9]. Trimming and water losses of dry-aged meat are directly related to economic loss, even if it can create value-added meat after aging [10]. Lee et al. [3]. suggested that the microorganisms on the surface of dry-aged beef might be the primary reason for the differences between wet- and dry-aged beef, and the composition of the microorganisms may have a pivotal role in the production of characteristic flavors and textures [8]. Therefore, it could be hypothesized that these environmental differences may affect the metabolic changes of the crust and edible portion of dry-aged beef, followed by characteristic sensory properties.
For a quality assessment of beef products, chemometric analyses are required to measure various metabolites, such as free amino acids, peptides, nucleotides, sugars, lipids, and aromatic compounds [11]. Among various chemometric analyses, nuclear magnetic resonance (NMR) spectroscopy and/or chromatography-based mass spectroscopy have been widely used for elucidating metabolic profiles from various biological samples together with multivariable analyses [12]. Between them, NMR can provide intact chemical information without derivatization [13]. Several NMR studies combined with multivariable analyses have been reported on the metabolic profiles of during beef aging [14,15]. However, to our knowledge, there are no studies reported about metabolic changes in the crust of beef during the aging period.
Therefore, a two-dimensional quantitative NMR (2D qNMR) analysis was performed to understand characteristic metabolic changes in the crust, dry-aged, and wet-aged beef striploin after aging for 4 weeks.

2. Results and Discussion

The differences among dry- and wet-aged beef and the crust over 4 weeks of aging were investigated using 2D NMR-based metabolomics. For the comparison of polar metabolites in meat samples, perchloric acid extraction was performed [13]. Based on the 2D NMR spectra, metabolites were qualified and quantified for multivariable analyses.

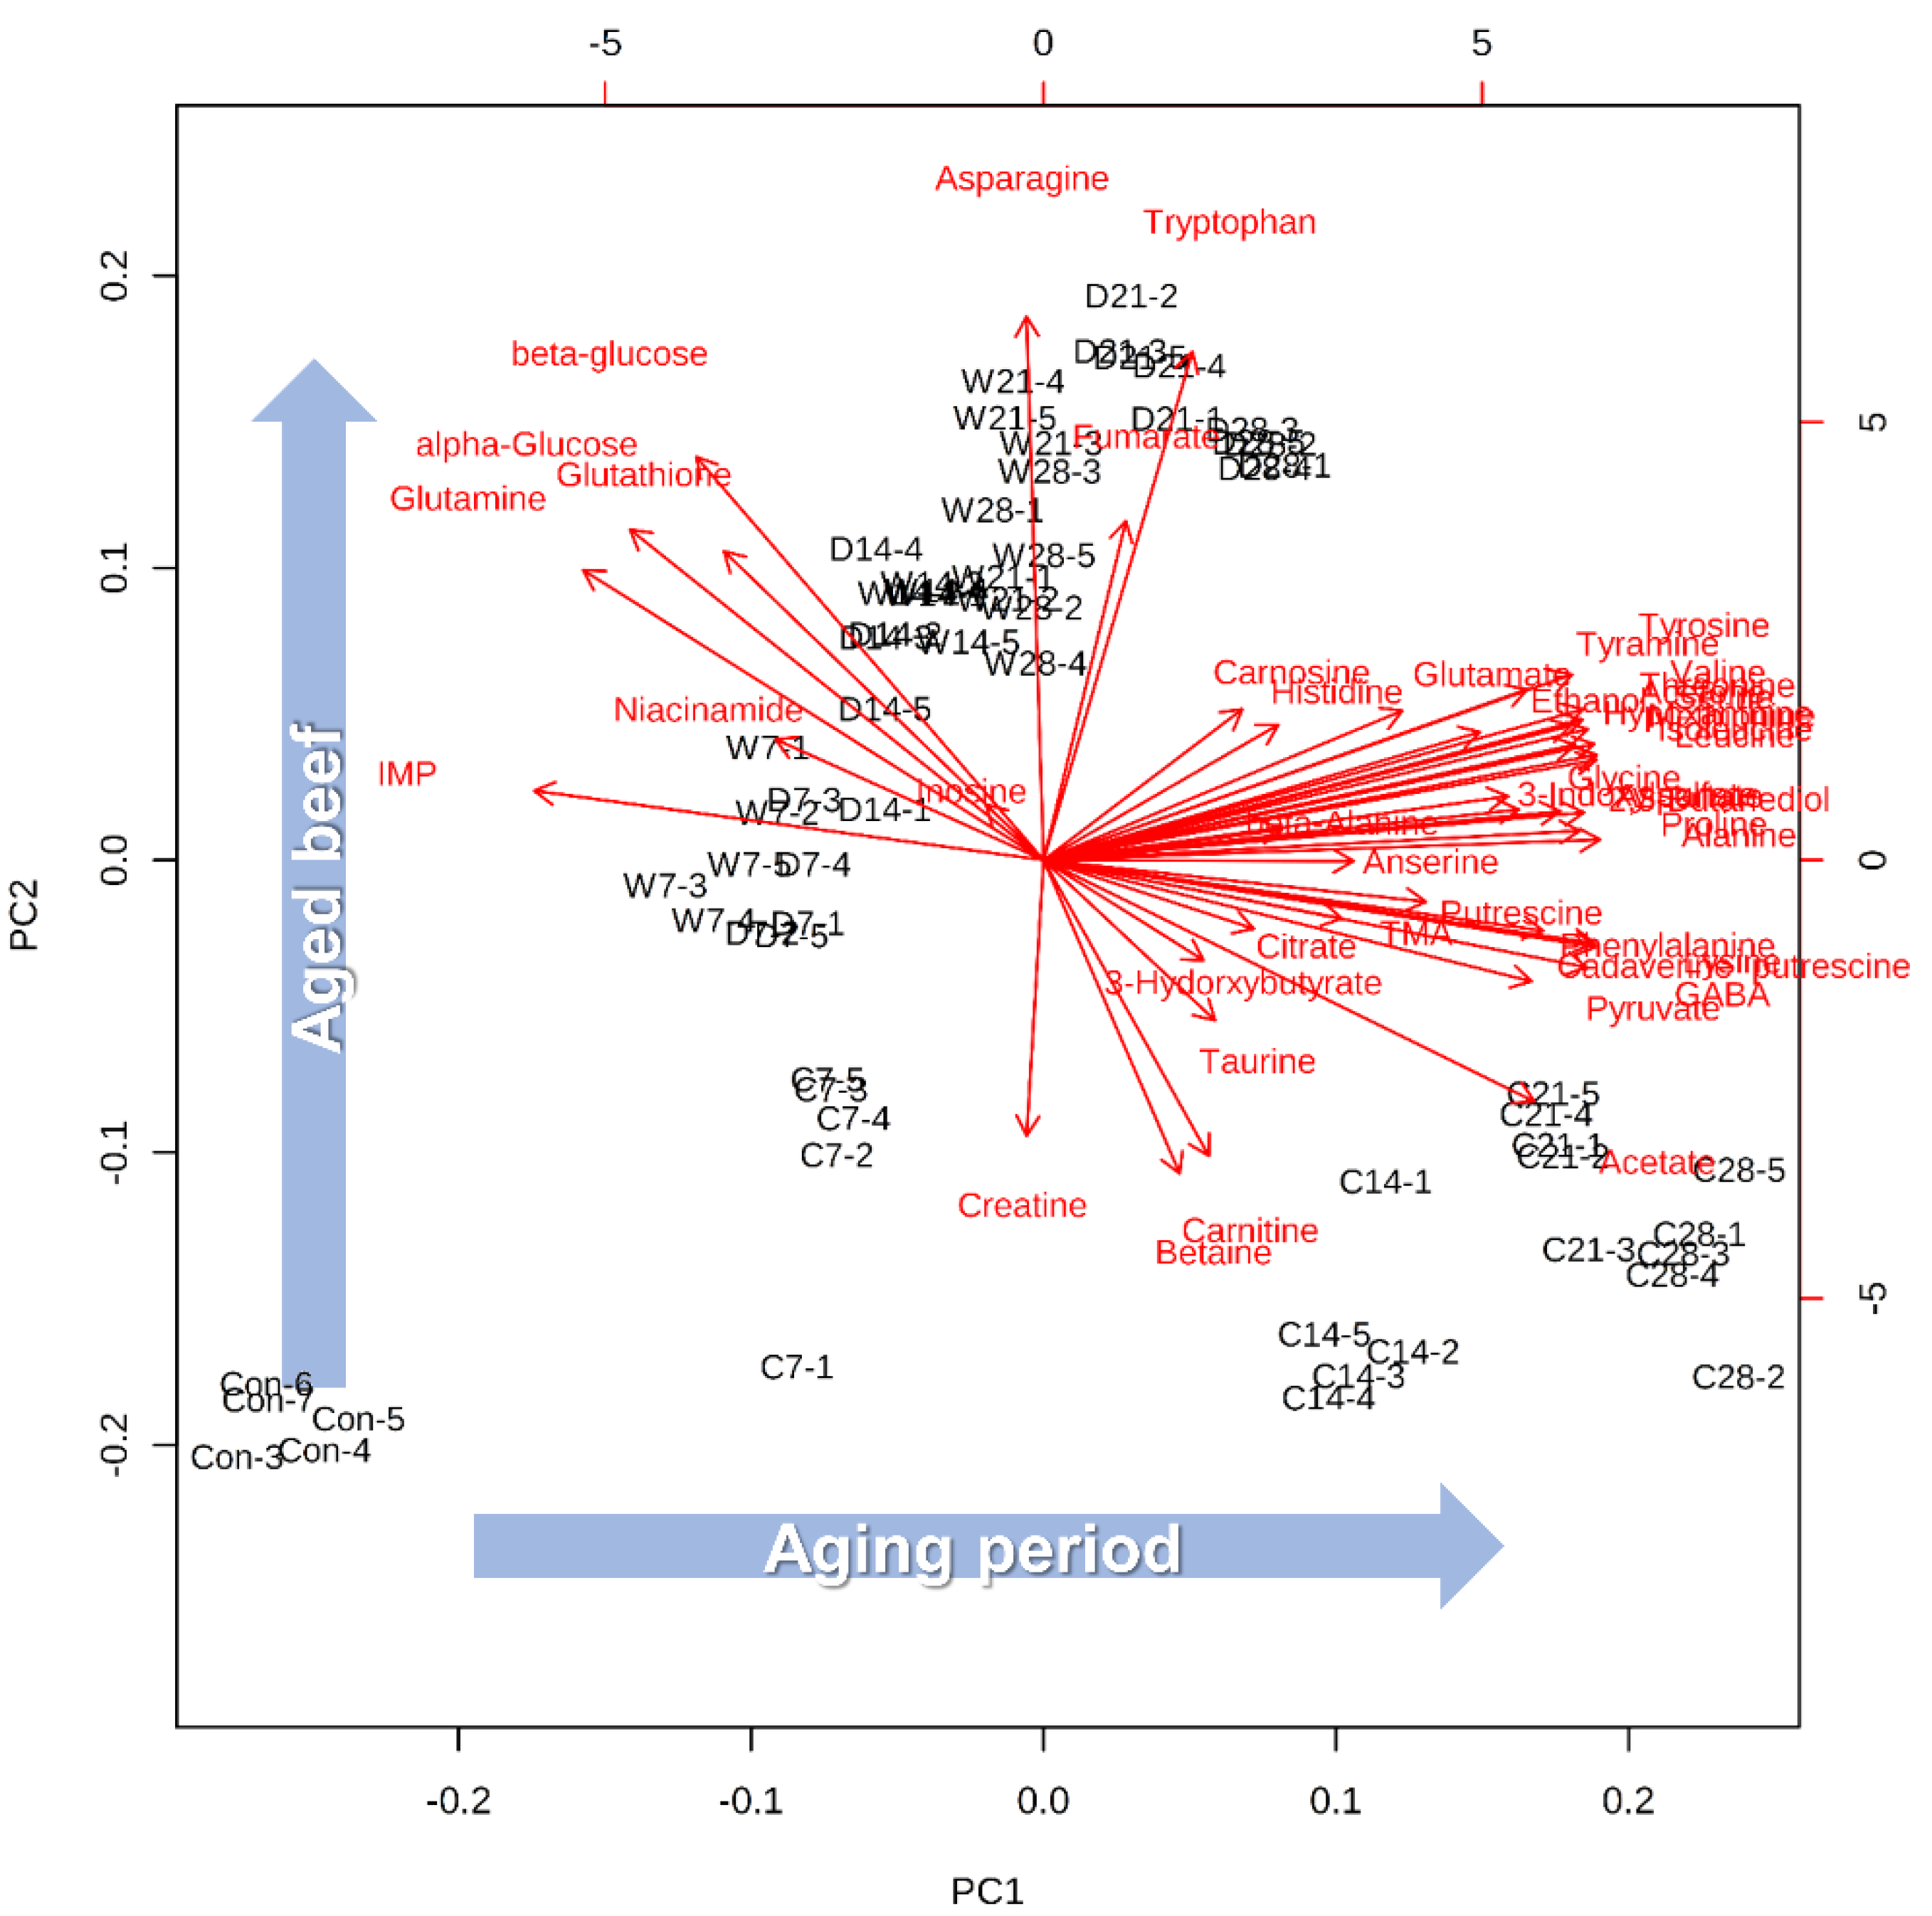
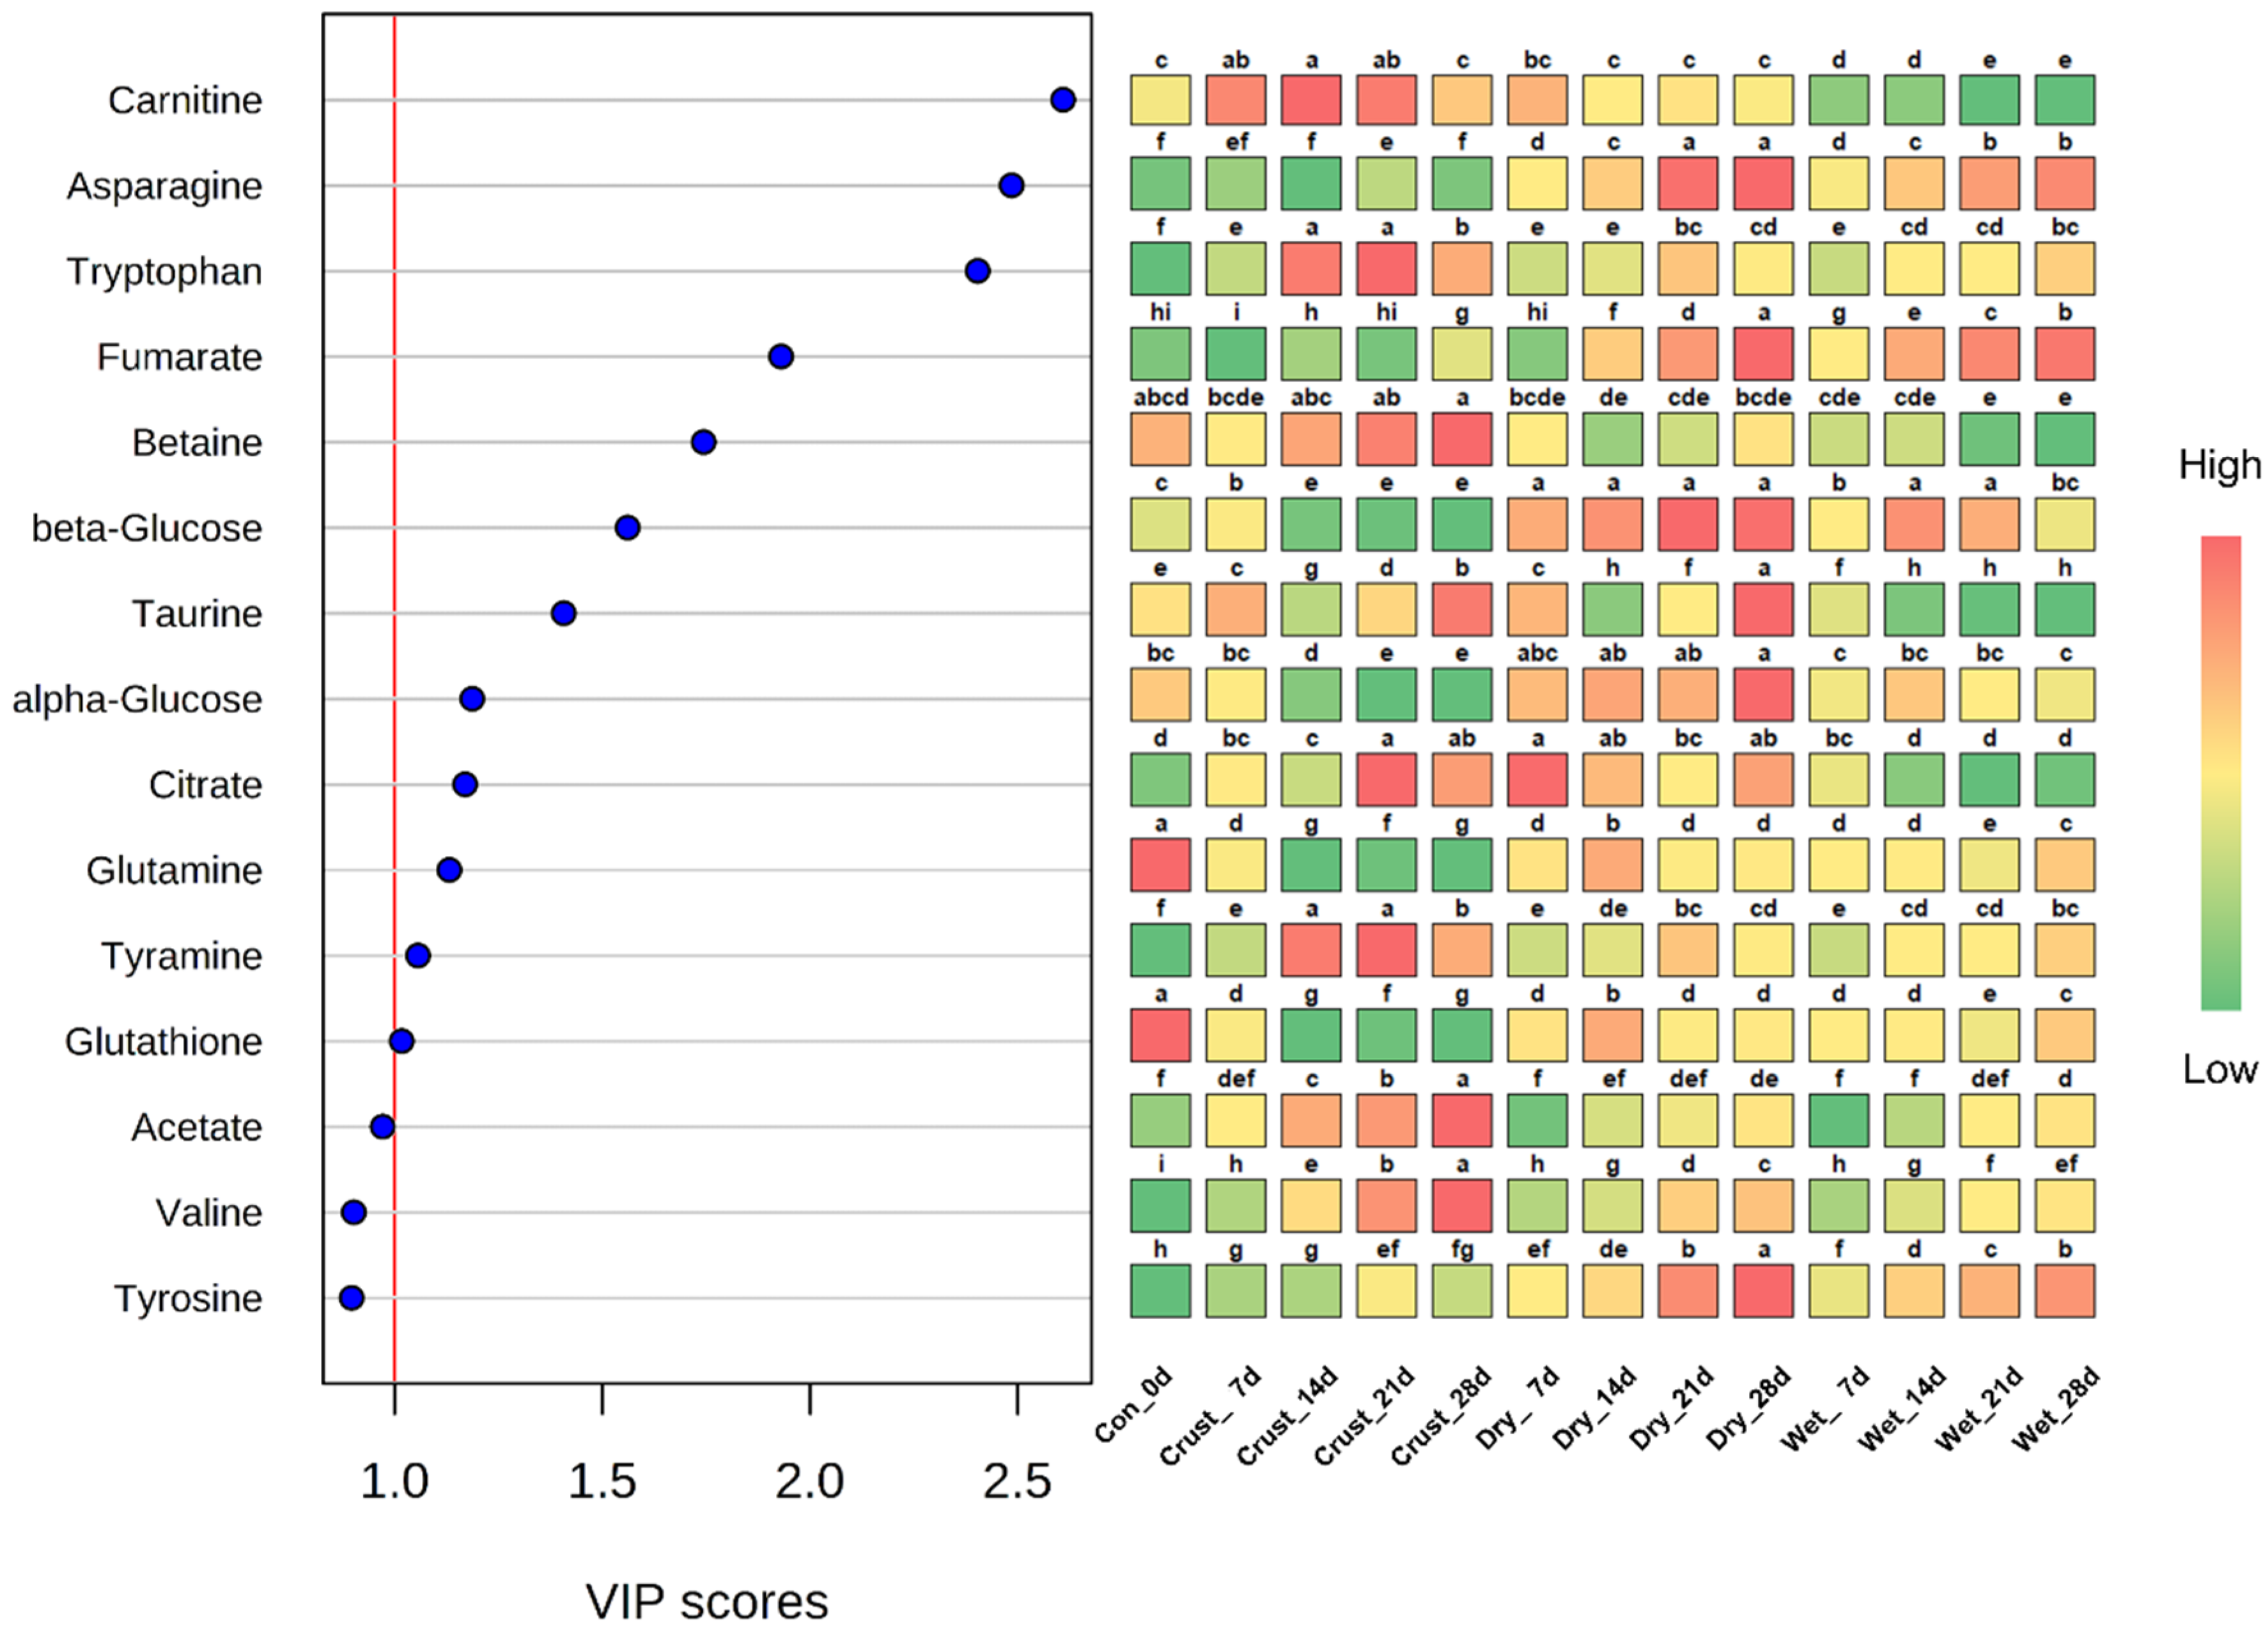
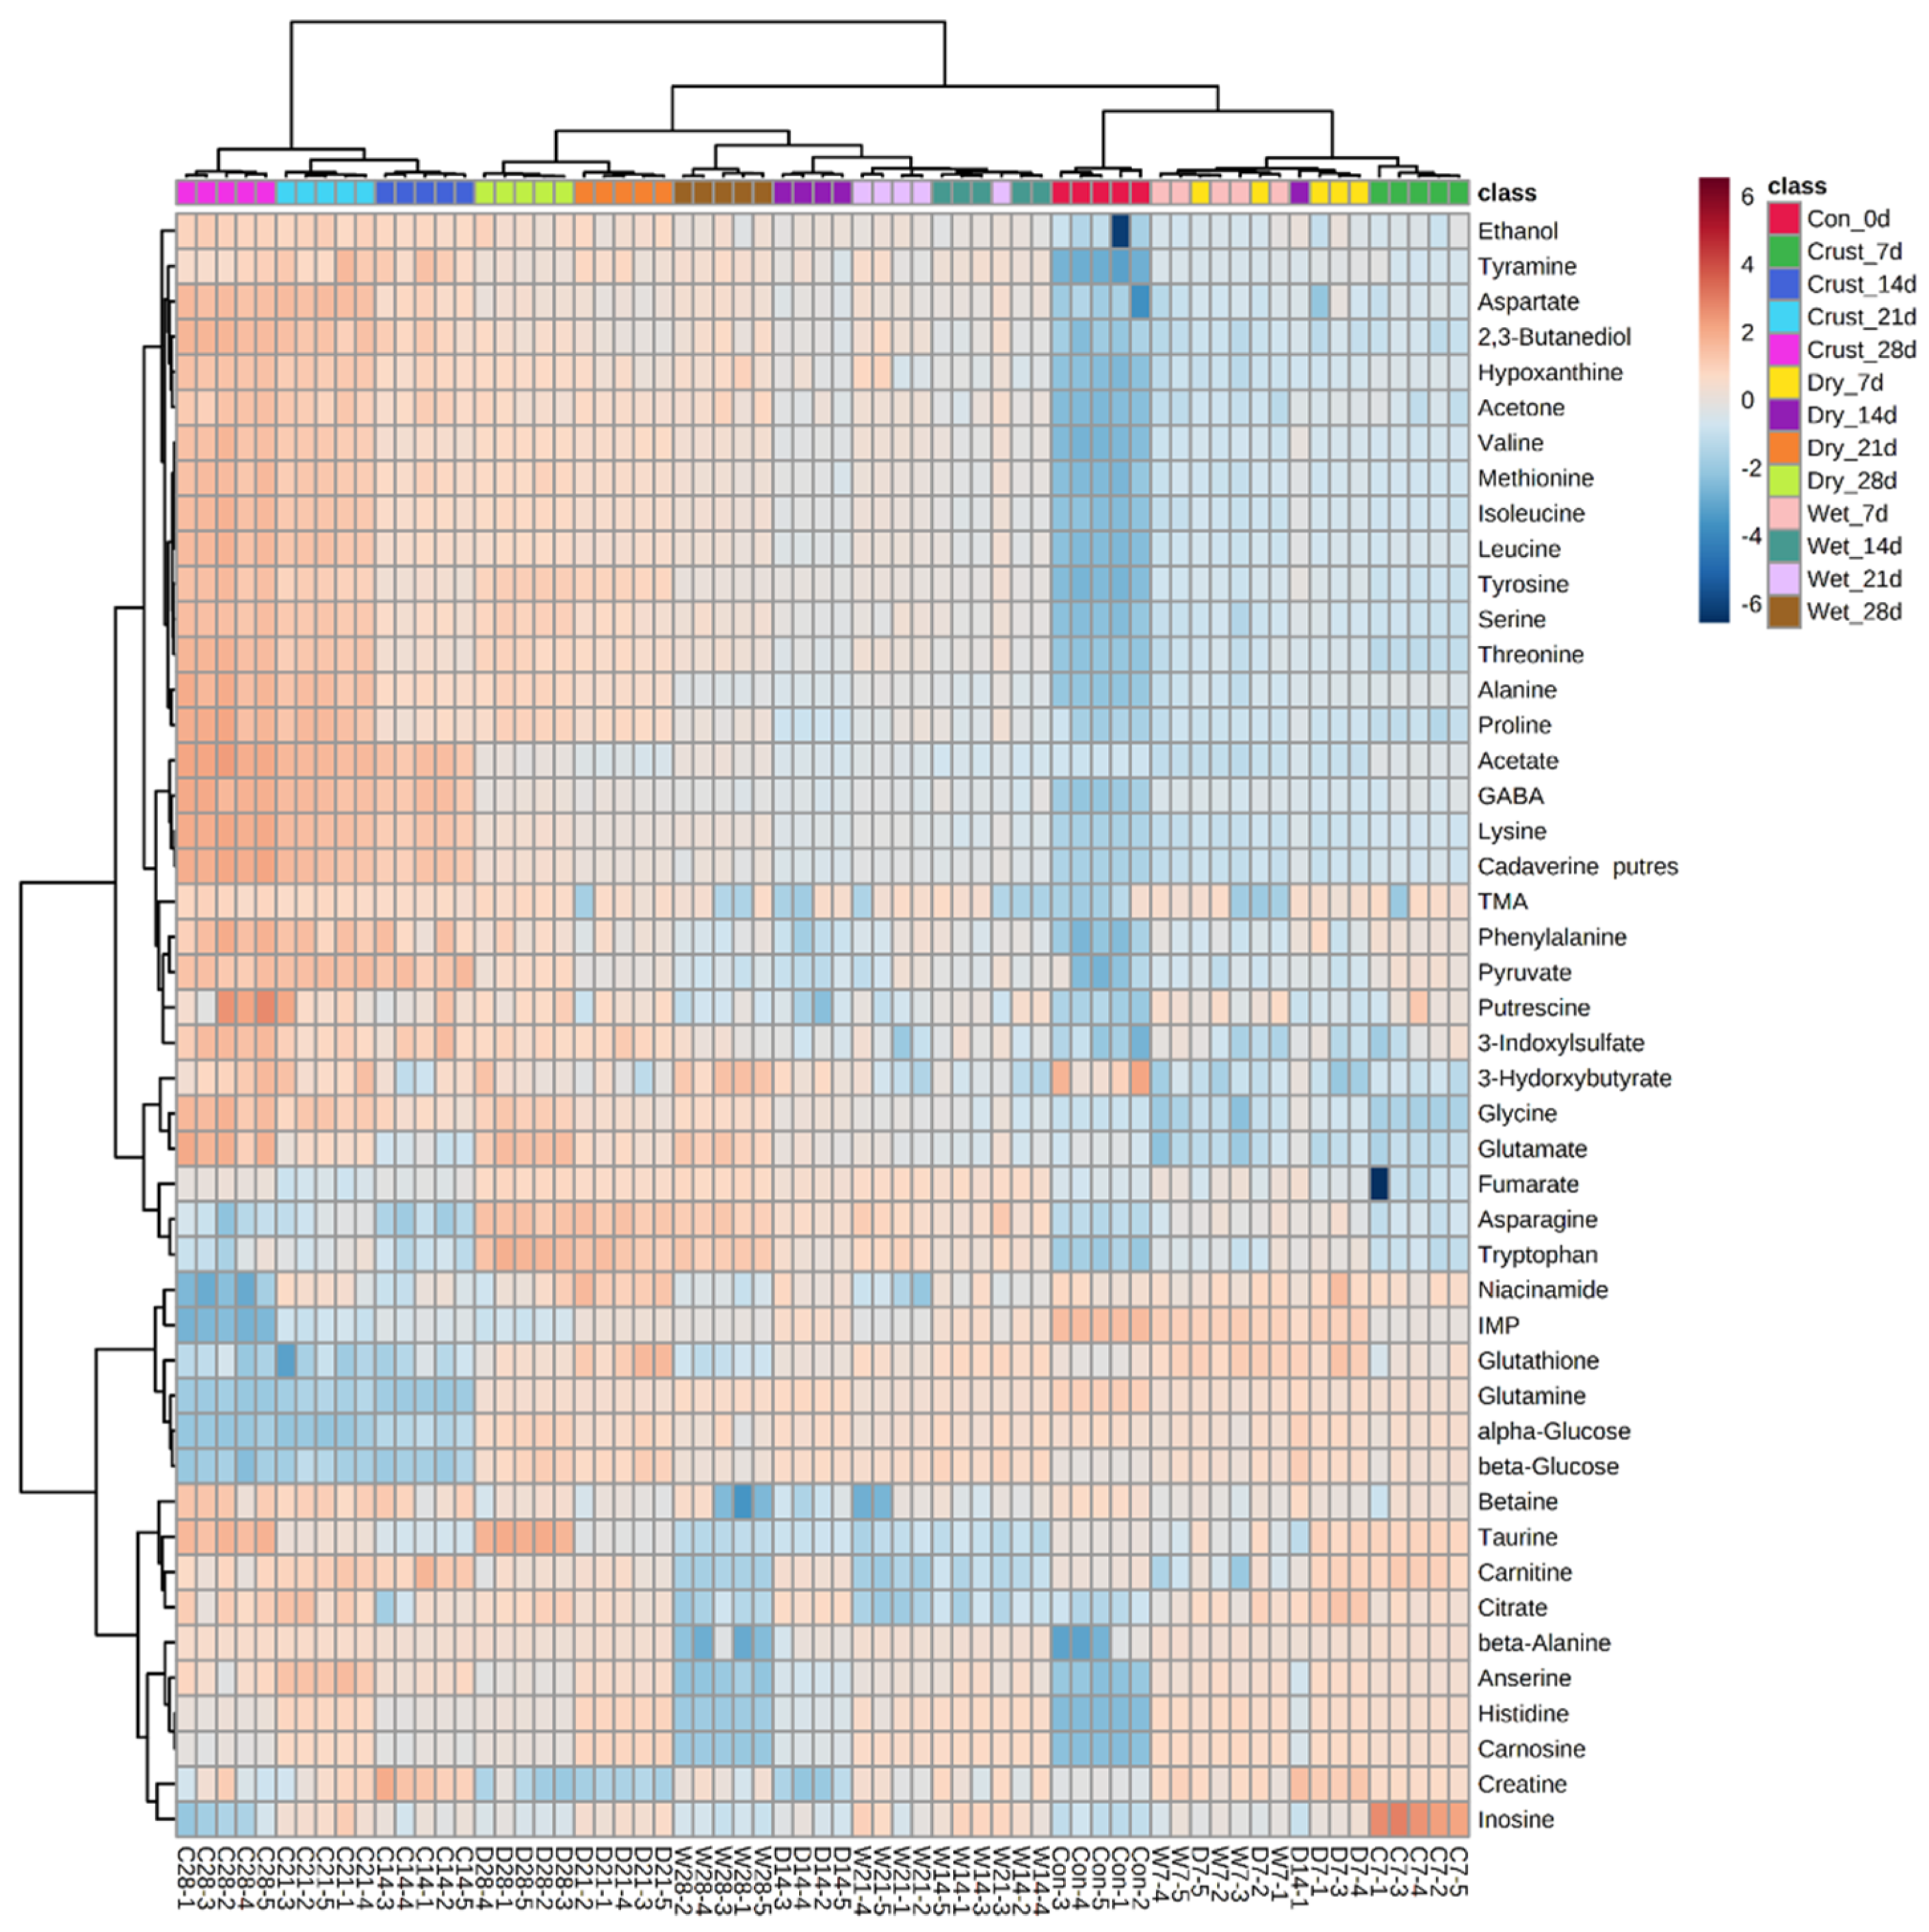
2.1. Multivariable Analyses

Overall metabolic differences were determined using principal components analysis (PCA) based on the peak intensities from 1H-13C hetero single nuclear coherence (HSQC) NMR spectra (Figure 1). PCA is usually used to discriminate differences of samples composed of multivariable datasets via variance maximization and dimension reduction [16]. As seen in Figure 1, each meat sample was separated clearly by the aging period, along with PC1 (54.5%). Among all groups, the crust was more strongly correlated with PC1 than the others (wet- and dry-aged beef). However, the crust was not correlated with PC2 (12.5%) during the aging period, while dry- and wet-aged beef correlated with PC2 depending on the aging period. Dry- and wet-aged beef showed a similar appearance in the PCA. However, dry-aged beef was better-differentiated by PC1 than wet-aged beef. Wet-aged beef was hard to be distinguished between 21 and 28 days. Along with the PC2, dry- and wet-aged beef exhibited a linear correlation until 21 days, and then the correlation decreased by 28 days of the aging period.
The loading plots of variables, which visualize variables, can be used for understanding metabolic patterns easily [17]. Most of the metabolites were associated with PC1 and were composed of most free amino acids, biogenic amines, and bioactive compounds, except for some free amino acids (asparagine, tryptophan, and glutamine), inosine 5′-monophosphate (IMP), α- and β-glucose, and glutathione (Figure 1). The proportional increase in free amino acids and their derivatives (biogenic amines and bioactive compounds), depending on the aging period, was a well-known result of the aged meat [18]. Biogenic amines such as cadaverine, putrescine, tyramine, and trimethylamine (TMA) commonly increased depending on the aging period, and these compounds are usually considered indicators of freshness in meat samples [19,20]. Moreover, not only IMP and α- and β-glucose are recognized as freshness indicators, but also these metabolites play an important role in meat flavor development during the cooking process [3,21]. In addition to PCA, partial least squares-discriminant analysis (PLS-DA) was performed to separate between groups of observations (R2 = 0.967, Q2 = 0.935). PLS-DA, which is called the supervised method, is similar to PCA, but it can discriminate differences based on each group [16]. In this study, PLS-DA showed a good cumulative explained variation (R2) and predictive ability (Q2), which meant that the different aging methods and their aging period were clearly distinguished based on the polar metabolic characteristics.
PLS-DA score plots showed similar appearances compared to PCA (Figure S1). Since PCA is considered an indicator of the practical reliability of PLS-DA, a similar appearance can explain that the data are clearly distinguished [16]. In PLS-DA, variables can be measured by scores, which are called variable importance in projection (VIP). The overall average of VIP scores is 1, and the metabolites above 1 contribute to the formation of the PLS-DA model [22]. Based on the VIP scores, twelve metabolites (>1 score) are presented in Figure 2. Three metabolites—carnitine, asparagine, and tryptophan—were the most characteristic variables to separate the groups, and these compounds were highly correlated in PC2 of PCA. Asparagine and tryptophan had a positive correlation with PC2, but carnitine had a negative correlation (Figure 1). Along with PCA, the positive correlation was related to the aged beef groups (dry- and wet-aged beef), and the negative correlation was related to the crust. The appearances of the metabolites could be the best way to distinguish between the aging method (dry- and wet-aged beef) and between the edible portion of aged beef and crust. Two other metabolites—fumarate and betaine—were also related to aged beef groups and crust, respectively. Other high VIP score metabolites were related to aged beef (β-glucose, α-glucose, glutamine, and glutathione) and crust (taurine, citrate, and tyramine).
A hierarchical clustering heatmap analysis was performed for the classification between different observations (Figure 3). This method arranges the groups based on the similarity of the datasets and can be easily recognized using a dendrogram and heatmap [23]. As seen in the dendrogram, the greatest differences were shown between the crust and the other groups after the second week. The differences were clearly expressed in the PCA (Figure 1). These noticeable differences in the crust could be attributed to water evaporation and microbial effects [3,8,24]. Among the aged beef, most groups were well clustered by group except for some regions where the first week of dry- and wet-aged beef and the second week of dry-aged beef were mixed and the second and third weeks of wet-aged beef were mixed. Based on the results, the metabolic characteristics were clearly differentiated in the crust and dry-aged beef in the second week. In a previous study, similar results were reported that the unique flavor of dry-aged beef needs to age at least 2 weeks [3].

2.2. Metabolic Characteristics

2.2.1. Proteolysis

Regardless of the treatment, total free amino acids were significantly increased, depending on the aging period (Table 1). The increase in amino acids and biogenic amines is generally proportional to the aging period [18]. Free amino acids are directly related to meat taste and/or contribute to flavor formation during cooking [3,25,26]. Total free amino acids were highest in the crust, then dry-aged, and finally wet-aged beef. In the first week of aging, total free amino acids did not differ significantly between the crust and dry-aged beef, while wet-aged beef was lower than the others (p < 0.05). The total free amino acids of the crust began to increase significantly after the second week of aging. The increase in free amino acids in the crust may be due to steady water evaporation during dry aging and accelerated proteolysis by microorganisms [3].
In dry aging, tryptophan in the crust increased in the third week and decreased in the fourth week. Unlike dry-aged beef, glutamine in the crust rapidly decreased during the first 2 weeks (p < 0.05). The increase in total free amino acid and the decrease in tryptophan and glutamine are closely related to proteolysis and catabolism of microorganisms, respectively [27,28]. Asparagine and glutamine could be degraded during storage via deamination when it is contaminated by microorganisms [27]. Moreover, tryptophan in the crust increased slightly during aging, but the rate of increase was lower than dry- or wet-aged beef, while 3-indoxyl sulfate steadily increased significantly from the second and third weeks in the crust and dry-aged beef, respectively (p < 0.05; Figure 3). However, in wet-aged beef, 3-indoxyl sulfate did not differ significantly after the first week. Tryptophan can be degraded into 3-indoxyl sulfate, which was reported as uremic toxin, provisionally related to glomerular sclerosis, tubulointerstitial fibrosis, oxidative stress in endothelial cells, and vascular endothelial cell dysfunction by microorganisms [28].
Biogenic amines showed similar trends to free amino acids (Figure 1 and Figure 3). Not only free amino acids increased, but also biogenic amines such as cadaverine, putrescine, tyramine, and TMA commonly increased depending on the aging period, and these compounds are also usually considered as indicators of freshness in meat samples [18,19]. Biogenic amines increased in the crust and dry-aged beef in the second and third weeks, respectively. As described above, PC1 scores of cadaverine, putrescine, tyramine, and TMA were 0.20, 0.14, 0.17, and 0.11, while PC2 scores were −0.06, −0.03, 0.13, and −0.04, respectively. Except for tyramine, biogenic amines could be used for the identification of crust.

2.2.2. Bioactive Compounds

Anserine in the crust increased up to the third week and decreased during the fourth week, while that in wet-aged beef increased rapidly in the second week and decreased during the aging period (p < 0.05; Table 2). Anserine in dry-aged beef tends to increase and decrease significantly every two weeks of aging. Carnosine showed the same pattern as anserine in the crust and dry-aged beef, but in the case of wet-aged beef, it tended to increase significantly during the first week of aging and then decrease as the aging period increased. The changes of anserine and carnosine during the aging period and the tendency of histidine and β-alanine were consistent (Figure 4). Histidine can be used as a carbon source with glucose during microbial energy metabolism [29]. Compared to β-alanine, histidine concentration is closely related to histidyl dipeptides concentration [30]. The changes in fluctuated histidyl dipeptides could be affected by changing the major strain during the aging period in which initial bacteria increased during the first two weeks and did not change greatly in a later period, while lactic acid bacteria, yeast, and mold increased steadily [31]. Anserine and carnosine are histidyl dipeptides containing β-alanine, which has similar bioactivities, such as a buffering effect and antioxidant activity, to histidyl dipeptides, chelate metal ions, or scavenge free radicals [32]. Moreover, histidyl peptides are associated with anti-aging, antiglycation, neurotransmitter functions, and the alleviation of diseases, such as Alzheimer’s disease, cataracts, diabetes, and ischemia [33]. Carnosine also contributes to the umami taste in meat [34]. Regardless of treatment groups, anserine and carnosine decreased in the fourth week (p < 0.05). However, Fu et al. [18] reported that the bioactivities of wet-aged beef increased proportionally by aging period.
Carnitine is associated with fatty acid-related energy-generating processes, enhancing the utilization of fatty acids, and facilitating the removal of accumulated fatty acids from mitochondria. Thus, it could be advantageous for human health and help with weight loss [35]. Carnitine in the crust steadily increased up to the third week and then decreased (p < 0.05). Carnitine in dry- and wet-aged beef increased up to the first week and remained stable, while that in wet-aged beef decreased during the first week of aging and then remained stable (p < 0.05). Carnitine can be synthesized from lysine and methionine [36]. The decrease in carnitine during aging might contribute to the elevation of TMA by microorganisms, and it could be increased at the terminal stage of dry aging [3,37]. Creatine increased in the first week in all groups. Creatine increased until the second week and decreased in the third week in the crust (p < 0.05). In dry-aged beef, creatine decreased in the second week. On the other hand, wet-aged beef maintained creatine during the aging period. Creatine is related to muscle energy metabolism and provides energy during exercise [38]. Phosphocreatine rapidly converts to creatine postmortem [39].

2.2.3. Nucleotides

The major nucleotides (IMP, inosine, and hypoxanthine) of beef samples are presented in Table 3. Most of ATP in muscles at postmortem is dephosphorylated into AMP and is then converted to IMP, which contributes to an umami taste and imparts flavor to the meat. IMP is converted to inosine and then to hypoxanthine, which contributes to the bitter taste [34]. Regardless of the aging method, the IMP contents gradually decreased, while the hypoxanthine contents increased as aging length increased (p < 0.05). Similarly, IMP contents in the crust rapidly decreased in the first week of aging and were significantly lower than those in the dry- and wet-aged beef during the aging period.
Dry- and wet-aged beef had no differences at the first 2-weeks in the IMP contents. However, the IMP contents of dry-aged beef were higher in the third week and decreased significantly in the fourth week compared to those of wet-aged beef (p < 0.05). A similar trend has been observed in previous studies [3,40]. This decrease in dry-aged beef could be associated with enzymes related to the degradation of IMP [3]. IMP was mainly produced at the initial postmortem and degraded during the aging period [34]. Yamaguchi [41] reported that a certain ratio of IMP and glutamic acids showed a strong synergistic effect on the umami taste. However, this lower IMP of dry-aged beef compared to wet-aged beef in the fourth week did not cause a difference in the umami taste of dry-aged beef in this study. In the crust, inosine increased in the first week and decreased in the fourth week of aging, and hypoxanthine was proportional during the aging period regardless of aging methods. As described above, the PC1 scores of IMP, inosine, and hypoxanthine were −0.18, −0.02, and 0.19, while the PC2 scores were 0.05, 0.04, and 0.09, respectively (Figure 1). Nucleotides are used as freshness indicators, called the k-index (%) and biogenic amines index, that develop during proteolysis [20]. Based on the nucleotides, the crust rapidly decreased in freshness compared to dry- and wet-aged beef.

2.3. Unique Metabolic Characteristics of the Crust during Aging

The crust showed a higher concentration of citrate, pyruvate, ethanol, acetone, 2,3-butanediol acetate, and 3-hydroxybutyrate, while both α-glucose and β-glucose were lower than in dry- and wet-aged beef (p < 0.05; Figure 3). The increased compounds during aging are catabolites of microorganisms through glucose metabolism with glucose as substrates [42]. Along with the decrease in glucose, fumarate also decreased, while citrate increased. Therefore, it is shown that microorganisms grown on the outer surface of beef (crust) during aging may play a vital role, affect metabolic changes inside the meat, and significantly influence final meat qualities [8,24,43]. Moreover, it is found that γ-aminobutyric acid (GABA) increased on the crust from the second week of aging and increased on the dry-aged beef at the fourth week of aging compared to wet-aged beef (p < 0.05). GABA is usually produced during the fermentation of yeast and fungi [44] and is known to have functional effects, such as lowering blood pressure [45]. Previous results demonstrated that the degradation of myofibrillar proteins is not only achieved by endogenous proteolytic enzymes but also by exogenous microbial proteolytic action during the dry aging process [3,8,44].
Despite the beneficial effect, harmful compounds such as biogenic amines and 3-indoxyl sulfate can also be generated in the crust during dry aging (Figure 3). The amounts of glucose, glutamine, asparagine, tryptophan, and fumarate were higher in dry- and wet-aged beef than those in the crust during the second week of aging. This difference could be explained by the fact that both dry- and wet-aged beef were less influenced by microorganisms as yeast and mold cannot penetrate the crust itself [46]. On the contrary, Peromingo et al. [47] suggested fungal secondary metabolites on the surface of dry-cured meat diffused into the meat. Moreover, a previous study reported that mold and yeast growth on the surface of dry-aged beef and their composition (ratio) directly affected meat sensory properties [8].

3. Materials and Methods

3.1. Sample Preparation and the Aging Process

A total of 60 striploins (longissimus lumborum) from both sides of 30 different beef carcasses (21-month-old Holstein steers, quality grade 3) were obtained at 48 h postmortem from a local slaughterhouse and transferred to the meat processing plant (Seoul, Korea). The striploin from the same sides of different carcasses were randomly arranged in each dry- and wet-aged group (Control was randomly selected additionally). Before the aging process, the wet-aged group was vacuum-packaged (HFV-600 L, Hankook Fujee Co., Ltd., Hwaseong, Korea) with a low-density polyethylene/nylon bag (oxygen permeability of 22.5 mL/m2/24 h atm at 60% relative humidity (RH)/25 °C and water vapor permeability of 4.7 g/m2/24 h at 100% RH/25 °C). Twenty beef samples were randomly selected for both groups and aged for 7, 14, 21, and 28 days under different conditions. Considering the terminal weight loss of dry-aged beef, 1 kg of striploins was aged on a wire rack with the fat surface facing down at 4 °C, 75% RH, and 2.5 m/s airflow velocity. Wet-aged samples (500 g of striploins) was aged at 4 °C after vacuum-packaging. At the sampling stage, the crust of the dry-aged beef was trimmed off approximately 1 cm from the external surface of each dry-aged meat. The crust, dry-, and wet-aged beef samples were vacuum-packaged (HFV-600 L, Hankook Fujee Co., Ltd., Hwaseong, Korea) and stored at −70 °C until the analyses.

3.2. Sample Extraction

Frozen beef samples were thawed at 4 °C for 24 h before analysis. Thawed beef samples (5 g) were homogenized at 1720× g for 30 s (T25 basic, Ika Co., KG, Staufen, Germany) with 0.6 M perchloric acid. The homogenate was centrifuged (Continent 512R, Hanil Co., Ltd., Incheon, Korea) at 3086× g for 15 min. The supernatant was transferred to a new test tube and neutralized with potassium hydroxide. Neutralized extracts were centrifuged again under the same conditions. After centrifugation, each supernatant was filtered using filter paper (Whatman No. 1, Whatman PLC., Middlesex, UK) and lyophilized (Freezer dryer 18, Labco Corp., Kansas City, MO, USA). The lyophilized extracts were stored at −70 °C until NMR analysis.

3.3. NMR Experiments

One-dimensional (1D) 1H NMR and 1H-13C HSQC were recorded in deuterium oxide (heavy water; D2O) at 298 K on a Bruker 850 MHz cryo-NMR spectrometer (Bruker Biospin GmbH, Rheinstetten, Germany). One-dimensional 1H NMR was performed applying a modified standard zg30 (recycle delay of 1 s) pulse sequence provided by default in Topspin 3.6.2 (Bruker Biospin GmbH, Rheinstetten, Germany), with the lock on the deuterium resonance. The 1D 1H NMR experiment was performed with 64k data points and a sweep width of 17,006.803 Hz with 128 scans. The 1H-13C HSQC experiment was performed as follows: 2k data points in the t2 domain and 512 increments in the t1 with 8 scans; spectral widths of 11 ppm for the f2 dimension and 180 ppm for the f1 dimension; and coupling constant values of 145 Hz were employed to set delay durations for short-range correlations, respectively. 1H-13C HSQC spectra were also used for qualification. The chemical shifts (δ) were referenced to the 3-(trimethylsilyl)propionic-2,2,3,3-d4 acid (TSP) resonance. Baseline correction was performed manually.

3.4. Multivariable Analysis

The dataset [65 (samples) × 46 (metabolites) matrix] of the acquired integral data of each metabolite from 1H-13C HSQC was collected using AMIX (Analysis of MIXtures software v3.9, Bruker Biospin GmbH, Rheinstetten, Germany). The data were analyzed using one-way ANOVA with Tukey’s post hoc test where p < 0.05 was considered to be significant. PCA biplot, VIP scores of PLS-DA, and heatmap analysis were performed using MetaboAnalyst 4.0 (www.metaboanalyst.ca) according to Xia and Wishart [48]. Prior to the analysis, samples were log-transformed and auto-scaled. Heatmap analysis was evaluated using Euclidean distance and ward cluster algorithm.

3.5. Quantification of Metabolites

Peaks of the metabolites were identified based on the standard compounds and biological magnetic resonance bank (BMRB; bmrb.wisc.edu). Quantification (totally 46 metabolites) was calculated based on the 1H-13C HSQC spectra using AMIX (Bruker Biospin GmbH, Rheinstetten, Germany; Figure S2). Prior to quantification, 1D 1H NMR spectra were acquired and processed according to Kim et al. [13] to quantify 24 metabolites using an internal standard of 1 mM TSP. Calibration curves were made with the peak intensities from 1H-13C HSQC (Figure S3).

3.6. Statistical Analysis

Statistical analysis was performed using the procedure of the general linear model for the comparison of quantified metabolites. Significant differences among mean values were determined by Student–Neuman–Keul’s multiple range test using SAS software (SAS 9.4, SAS Institute Inc., Cary, NC, USA) with a confidence level of p < 0.05. All the experimental procedures were conducted in quintuplicate.

4. Conclusions

Based on this study, the metabolic appearance of crust, dry-, and wet-aged beef were separated from the first week and showed a completely different aspect from the second week, as shown by NMR-based multivariable analyses. Moreover, NMR-based multivariable analyses could be used for distinguishing the aging degree. Among them, the crust exhibited unique metabolic changes that accelerated proteolysis (total free amino acids and biogenic amines) and IMP depletion than in dry-aged beef, and generated specific microbial catabolites (3-indoxyl sulfate) and GABA, while asparagine, glutamine, tryptophan, and glucose were maintained or decreased. Compared to the crust, dry-aged beef showed similar patterns of biogenic amines and bioactive compounds and GABA without a decrease in free of amino acids and glucose. Based on these results, the crust allows the inner dry-aged beef to be aged similarly to wet-aged beef. Moreover, the metabolic changes of the crust could affect the metabolites of dry-aged beef. However, understanding how external conditions affect dry-aged beef is necessary to produce high value-added beef products.

Supplementary Materials

The following are available online, Figure S1: Partial least square-discriminant analysis (PLS-DA) cross validation from quantified metabolites of beef aged by different method and crust. Validation was evaluated (a) overall groups, (b) dry- and wet-aged beef, (c) crust and dry-aged beef, and (d) crust and wet-aged beef, Figure S2: Representative 1H-13C hetero nuclear single quantum coherence (HSQC) NMR spectrum from 28 day-aged crust of dry aging extracts acquired using a 850 MHz cryo-NMR spectrometer and metabolites list of pattern integration for 2D qNMR analysis, Figure S3: Standard curves of quantification from 1H-13C hetero nuclear single quantum coherence (HSQC) based on the 1D 1H quantitative NMR using a 850 MHz cryo-NMR spectrometer.

Author Contributions

Conceptualization, H.C.K. and C.J.; Methodology, H.C.K. and C.J.; Software, H.C.K. and Y.-J.K.; Validation, H.C.K.; Formal Analysis, H.C.K.; Investigation, K.H.B., and H.J.L.; Resources, H.J.L. and C.J.; Data Curation, H.C.K.; Writing—Original Draft Preparation, H.C.K. and D.-G.Y.; Writing—Review and Editing, D.-G.Y. and C.J.; Visualization, H.C.K.; Supervision, C.J.; Project Administration, C.J.; Funding Acquisition, C.J. All authors have read and agreed to the published version of the manuscript.

Funding

Korea Institute of Planning and Evaluation for Technology in Food, Agriculture, Forestry and Fisheries: No. 316048.

Acknowledgments

This study was supported by “High Value-added Food Technology Development Program (No. 316048),” Korea Institute of Planning and Evaluation for Technology in Food, Agriculture, Forestry and Fisheries.

Conflicts of Interest

The authors declare no conflict of interest.

References

  1. Koohmaraie, M. Muscle proteinases and meat aging. Meat Sci. 1994, 36, 93–104. [Google Scholar] [CrossRef]
  2. Dashdorj, D.; Tripathi, V.K.; Kim, J.-H.; Kim, Y.; Hwang, I. Dry aging of beef; Review. J. Anim. Sci. Technol. 2016, 58, 20. [Google Scholar] [CrossRef] [PubMed] [Green Version]
  3. Lee, H.J.; Choe, J.; Kim, M.; Kim, H.C.; Yoon, J.W.; Oh, S.W.; Jo, C. Role of moisture evaporation in the taste attributes of dry- and wet-aged beef determined by chemical and electronic tongue analyses. Meat Sci. 2019, 151, 82–88. [Google Scholar] [CrossRef] [PubMed]
  4. Smith, R.; Nicholson, K.; Nicholson, J.; Harris, K.; Miller, R.; Griffin, D.; Savell, J.W. Dry versus wet aging of beef: Retail cutting yields and consumer palatability evaluations of steaks from US Choice and US Select short loins. Meat Sci. 2008, 79, 631–639. [Google Scholar] [CrossRef]
  5. Oh, J.; Lee, H.J.; Kim, H.C.; Kim, H.-J.; Yun, Y.G.; Kim, K.T.; Choi, Y.I.; Jo, C. The effects of dry or wet aging on the quality of the longissimus muscle from 4-year-old Hanwoo cows and 28-month-old Hanwoo steers. Anim. Prod. Sci. 2018, 58, 2344. [Google Scholar] [CrossRef]
  6. Perry, N. Dry aging beef. Int. J. Gastron. Food Sci. 2012, 1, 78–80. [Google Scholar] [CrossRef] [Green Version]
  7. Dikeman, M.E.; Obuz, E.; Gök, V.; Akkaya, L.; Stroda, S. Effects of dry, vacuum, and special bag aging; USDA quality grade; and end-point temperature on yields and eating quality of beef Longissimus lumborum steaks. Meat Sci. 2013, 94, 228–233. [Google Scholar] [CrossRef]
  8. Lee, H.J.; Yoon, J.W.; Kim, M.; Oh, H.; Yoon, Y.; Jo, C. Changes in microbial composition on the crust by different air flow velocities and their effect on sensory properties of dry-aged beef. Meat Sci. 2019, 153, 152–158. [Google Scholar] [CrossRef]
  9. Ryu, S.; Park, M.R.; Maburutse, B.E.; Lee, W.J.; Park, D.-J.; Cho, S.; Hwang, I.; Oh, S.; Kim, Y. Diversity and characteristics of the meat microbiological community on dry aged beef. J. Microbiol. Biotechnol. 2018, 28, 105–108. [Google Scholar] [CrossRef] [Green Version]
  10. Khan, M.I.; Jung, S.; Nam, K.C.; Jo, C. Postmortem Aging of Beef with a Special Reference to the Dry Aging. Food Sci. Anim. Resour. 2016, 36, 159–169. [Google Scholar] [CrossRef] [Green Version]
  11. Koutsidis, G.; Elmore, J.S.; Concha, M.J.O.; Campo, M.M.; Wood, J.; Mottram, D.S. Water-soluble precursors of beef flavour. Part II: Effect of post-mortem conditioning. Meat Sci. 2008, 79, 270–277. [Google Scholar] [CrossRef] [PubMed]
  12. Simmler, C.; Napolitano, J.G.; McAlpine, J.B.; Chen, S.-N.; Pauli, G.F. Universal quantitative NMR analysis of complex natural samples. Curr. Opin. Biotechnol. 2013, 25, 51–59. [Google Scholar] [CrossRef] [PubMed]
  13. Kim, H.C.; Ko, Y.-J.; Kim, M.; Choe, J.; Yong, H.I.; Jo, C. Optimization of 1D 1H Quantitative NMR (Nuclear Magnetic Resonance) Conditions for Polar Metabolites in Meat. Food Sci. Anim. Resour. 2019, 39, 1–12. [Google Scholar] [CrossRef] [PubMed] [Green Version]
  14. Castejón, D.; Garcia-Segura, J.M.; Escudero, R.; Herrera, A.; Cambero, M. Metabolomics of meat exudate: Its potential to evaluate beef meat conservation and aging. Anal. Chim. Acta 2015, 901, 1–11. [Google Scholar] [CrossRef]
  15. Graham, S.F.; Farrell, D.; Kennedy, T.; Gordon, A.; Farmer, L.; Elliott, C.; Moss, B. Comparing GC–MS, HPLC and 1H NMR analysis of beef longissimus dorsi tissue extracts to determine the effect of suspension technique and ageing. Food Chem. 2012, 134, 1633–1639. [Google Scholar] [CrossRef]
  16. Worley, B.; Powers, R. Multivariate Analysis in Metabolomics. Curr. Metab. 2012, 1, 92–107. [Google Scholar] [CrossRef]
  17. Ergon, R. Informative PLS score-loading plots for process understanding and monitoring. J. Process. Control. 2004, 14, 889–897. [Google Scholar] [CrossRef]
  18. Fu, Y.; Young, J.F.; Therkildsen, M. Bioactive peptides in beef: Endogenous generation through postmortem aging. Meat Sci. 2017, 123, 134–142. [Google Scholar] [CrossRef]
  19. Galgano, F.; Favati, F.; Bonadio, M.; Lorusso, V.; Romano, P. Role of biogenic amines as index of freshness in beef meat packed with different biopolymeric materials. Food Res. Int. 2009, 42, 1147–1152. [Google Scholar] [CrossRef]
  20. Shumilina, E.; Slizyte, R.; Mozuraityte, R.; Dykyy, A.; Stein, T.A.; Dikiy, A. Quality changes of salmon by-products during storage: Assessment and quantification by NMR. Food Chem. 2016, 211, 803–811. [Google Scholar] [CrossRef] [Green Version]
  21. Byun, J.-S.; Min, J.S.; Kim, I.S.; Kim, J.-W.; Chung, M.S.; Lee, M. Comparison of indicators of microbial quality of meat during aerobic cold storage. J. Food Prot. 2003, 66, 1733–1737. [Google Scholar] [CrossRef] [PubMed]
  22. Galindo-Prieto, B.; Eriksson, L.; Trygg, J. Variable influence on projection (VIP) for orthogonal projections to latent structures (OPLS). J. Chemom. 2014, 28, 623–632. [Google Scholar] [CrossRef]
  23. Škuta, C.; Bartunek, P.; Svozil, D. InCHlib—Interactive cluster heatmap for web applications. J. Cheminform. 2014, 6, 645. [Google Scholar] [CrossRef] [Green Version]
  24. Casal, M.; Paiva, S.; Queirós, O.; Soares-Silva, I.; Silva, I.J.S. Transport of carboxylic acids in yeasts. FEMS Microbiol. Rev. 2008, 32, 974–994. [Google Scholar] [CrossRef] [Green Version]
  25. Jayasena, D.D.; Jung, S.; Kim, H.-J.; Yong, H.I.; Nam, K.C.; Jo, C. Taste-active compound levels in Korean native chicken meat: The effects of bird age and the cooking process. Poult. Sci. 2015, 94, 1964–1972. [Google Scholar] [CrossRef] [PubMed]
  26. Mottram, N.S. Flavour formation in meat and meat products: A review. Food Chem. 1998, 62, 415–424. [Google Scholar] [CrossRef]
  27. Vermeulen, N.P.; Gänzle, M.G.; Vogel, R.F. Glutamine deamidation by cereal-associated lactic acid bacteria. J. Appl. Microbiol. 2007, 103, 1197–1205. [Google Scholar] [CrossRef]
  28. Roager, H.M.; Licht, T.R. Microbial tryptophan catabolites in health and disease. Nat. Commun. 2018, 9, 3294. [Google Scholar] [CrossRef] [Green Version]
  29. Stouthamer, A.; Bettenhaussen, C. Utilization of energy for growth and maintenance in continuous and batch cultures of microorganisms. Biochim. Biophys. Acta Bioenerg. 1973, 301, 53–70. [Google Scholar] [CrossRef]
  30. Mei, L.; Cromwell, G.; Crum, A.; Decker, E.A. Influence of dietary β-alanine and histidine on the oxidative stability of pork. Meat Sci. 1998, 49, 55–64. [Google Scholar] [CrossRef]
  31. Hulankova, R.; Kameník, J.; Saláková, A.; Závodský, D.; Borilova, G. The effect of dry aging on instrumental, chemical and microbiological parameters of organic beef loin muscle. LWT-Food Sci. Technol. 2018, 89, 559–565. [Google Scholar] [CrossRef]
  32. Chan, K.M.; Decker, E.A.; Feustman, C. Endogenous skeletal muscle antioxidants. Crit. Rev. Food Sci. Nutr. 1994, 34, 403–426. [Google Scholar] [CrossRef] [PubMed]
  33. Jung, S.; Bae, Y.S.; Kim, H.-J.; Jayasena, D.D.; Lee, J.-H.; Park, H.-B.; Heo, K.N.; Jo, C. Carnosine, anserine, creatine, and inosine 5′-monophosphate contents in breast and thigh meats from 5 lines of Korean native chicken. Poult. Sci. 2013, 92, 3275–3282. [Google Scholar] [CrossRef]
  34. Dashdorj, D.; Amna, T.; Hwang, I. Influence of specific taste-active components on meat flavor as affected by intrinsic and extrinsic factors: An overview. Eur. Food Res. Technol. 2015, 241, 157–171. [Google Scholar] [CrossRef]
  35. Rebouche, C.J. Carnitine function and requirements during the life cycle. FASEB J. 1992, 6, 3379–3386. [Google Scholar] [CrossRef]
  36. Jung, S.; Bae, Y.S.; Yong, H.I.; Lee, H.J.; Seo, D.W.; Park, H.B.; Lee, J.-H.; Jo, C. Proximate composition, and L-carnitine and betaine contents in meat from Korean indigenous chicken. Asian-Australas. J. Anim. Sci. 2015, 28, 1760–1766. [Google Scholar] [CrossRef] [Green Version]
  37. Falony, G.; Vieira-Silva, S.; Raes, J. Microbiology meets big fata: The case of gut microbiota–derived trimethylamine. Annu. Rev. Microbiol. 2015, 69, 305–321. [Google Scholar] [CrossRef] [PubMed]
  38. Jayasena, D.D.; Jung, S.; Kim, S.H.; Kim, H.-J.; Alahakoon, A.U.; Lee, J.-H.; Jo, C. Endogenous functional compounds in Korean native chicken meat are dependent on sex, thermal processing and meat cut. J. Sci. Food Agric. 2014, 95, 771–775. [Google Scholar] [CrossRef] [PubMed]
  39. Harris, R.; Lowe, J.; Warnes, K.; Orme, C. The concentration of creatine in meat, offal and commercial dog food. Res. Vet. Sci. 1997, 62, 58–62. [Google Scholar] [CrossRef]
  40. Kim, Y.H.B.; Kemp, R.; Samuelsson, L.M. Effects of dry-aging on meat quality attributes and metabolite profiles of beef loins. Meat Sci. 2016, 111, 168–176. [Google Scholar] [CrossRef]
  41. Yamaguchi, S. The synergistic taste effect of monosodium glutamate and disodium 5′-inosinate. J. Food Sci. 1967, 32, 473–478. [Google Scholar] [CrossRef]
  42. Sauer, M.; Porro, D.; Mattanovich, D.; Branduardi, P. Microbial production of organic acids: Expanding the markets. Trends Biotechnol. 2008, 26, 100–108. [Google Scholar] [CrossRef] [PubMed]
  43. Oh, J.; Lee, H.J.; Yoon, J.W.; Choe, J.; Jo, C. Electrical resistance and mold distribution on beef surface as indicators of dry aging. J. Food Process Eng. 2019, 42, e13122. [Google Scholar] [CrossRef]
  44. Kumar, S.; Punekar, N.S. The metabolism of 4-aminobutyrate (GABA) in fungi. Mycol. Res. 1997, 101, 403–409. [Google Scholar] [CrossRef]
  45. Inoue, K.; Shirai, T.; Ochiai, H.; Kasao, M.; Hayakawa, K.; Kimura, M.; Sansawa, H. Blood-pressure-lowering effect of a novel fermented milk containing γ-aminobutyric acid (GABA) in mild hypertensives. Eur. J. Clin. Nutr. 2003, 57, 490–495. [Google Scholar] [CrossRef] [Green Version]
  46. Lee, H.J.; Choe, J.-H.; Kim, K.T.; Oh, J.; Lee, D.G.; Kwon, K.M.; Choi, Y.I.; Jo, C. Analysis of low-marbled Hanwoo cow meat aged with different dry-aging methods. Asian-Australas. J. Anim. Sci. 2017, 30, 1733–1738. [Google Scholar] [CrossRef]
  47. Peromingo, B.; Sulyok, M.; Lemmens, M.; Rodríguez, A.; Rodríguez, M. Diffusion of mycotoxins and secondary metabolites in dry-cured meat products. Food Control 2019, 101, 144–150. [Google Scholar] [CrossRef]
  48. Xia, J.; Wishart, D.S. MetPA: A web-based metabolomics tool for pathway analysis and visualization. Bioinformatics 2010, 26, 2342–2344. [Google Scholar] [CrossRef] [Green Version]
Sample Availability: Samples of the compounds are not available from the authors.
Figure 1. Principal components analysis (PCA) biplot (score plots and loadings of variable) from quantified metabolites of beef aged by different methods and crust. GABA, γ-aminobutyric acid; TMA, trimethylamine; IMP, inosine 5′-monophosphate.
Molecules 25 03087 g001
Figure 2. Variable importance in projection (VIP) scores of partial least squares-discriminant analysis (PLS-DA) from the extracts of crust, dry-aged, and wet-aged beef. The colored boxes on the right indicate the relative concentrations of the corresponding metabolites (red, high; yellow, intermediate; green, low). a–i Letters different in the same row indicate a significant difference (p < 0.05).
Molecules 25 03087 g002
Figure 3. Heatmap analysis based on the quantified metabolites from crust, dry-aged, and wet-aged beef using 2D NMR (heteronuclear single quantum coherence, HSQC) on 850 MHz cryo-NMR spectrometer. GABA, γ-aminobutyric acid; TMA, trimethylamine; IMP, inosine 5′-monophosphate.
Molecules 25 03087 g003
Figure 4. Peak intensities of (a) histidine and (b) β-alanine from different aged beef striploin (longissimus lumborum) using 1H-13C HSQC on 850 MHz cryo-NMR spectrometer. a–g Different letters in the same row indicate a significant difference (p < 0.05). n.d., not detected.
Molecules 25 03087 g004
Table 1. Free amino acids contents (mg/100 g) from different aged beef striploin (longissimus lumborum) using 1H-13C HSQC on 850 MHz cryo-NMR spectrometer.
ContentsAging MethodAging PeriodSEM 1
07142128
AlanineCrust15.95 e27.26 d,x37.91 c,x47.19 b,x52.95 a,x0.852
Dry15.95 d26.25 c,x26.52 c,y36.35 b,y39.93 a,y0.264
Wet15.95 d23.30 c,y27.35 b,y27.92 b,z29.42 a,z0.312
SEM 20.3590.3390.5170.980
AsparagineCrust3.79 b4.69 ab,y3.30 b,y5.49 a,z3.95 b,z0.363
Dry3.79 d7.07 c,x8.63 b,x13.23 a,x13.59 a,x0.388
Wet3.79 d6.94 c,x9.30 b,x11.02 a,y11.96 a,y0.481
SEM 20.4480.4450.5180.428
Aspartic acidCrust1.39 d4.11 c13.37 b,x25.22 a,x25.15 a,x0.699
Dry1.39 d3.77 c5.71 b,y7.87 a,y9.14 a,y0.585
Wet1.39 d3.54 c7.80 b,y8.66 ab,y9.82 a,y0.462
SEM 20.6540.5890.6300.625
Glutamic acidCrust6.74 e27.25 d,x67.31 a,x62.59 b,x56.80 c,x0.844
Dry6.74 e12.88 d,y18.53 c,y23.25 b,y30.44 a,z0.489
Wet6.74 e11.95 d,y17.84 c,y24.92 b,y35.83 a,y0.855
SEM 20.3690.9341.0130.865
GlutamineCrust49.09 a34.14 b6.10 d,z8.12 c,z6.07 d,z0.553
Dry49.09 a36.12 c42.98 b,x34.71 c,x35.46 c,y0.688
Wet49.09 a35.05 c35.21 c,y32.16 d,y39.22 b,x0.781
SEM 20.8280.3270.3810.567
GlycineCrust25.09 d21.16 e,y35.55 c,x40.28 b,x44.72 a,x0.761
Dry25.09 d25.83 d,x31.83 c,y34.15 b,y39.66 a,y0.450
Wet25.09 c21.65 d,y28.46 b,z30.40 b,z36.09 a,z0.702
SEM 20.8320.7020.6640.700
IsoleucineCrust3.77 e10.08 d,x21.79 c,x30.62 b,x37.25 a,x0.616
Dry3.77 e10.69 d,x13.58 c,y20.80 b,y23.60 a,y0.188
Wet3.77 e9.07 d,y13.93 c,y16.78 b,z18.32 a,z0.290
SEM 20.2280.3960.2530.736
LeucineCrust7.21 e17.79 d,x31.11 c,x43.72 b,x50.38 a,x0.821
Dry7.21 e17.76 d,x20.58 c,z30.07 b,y32.42 a,y0.301
Wet7.21 d15.83 c,y22.63 b,y25.70 a,z26.83 a,z0.519
SEM 20.2570.5690.5800.989
MethionineCrust4.43 e12.34 d,y18.68 c,x23.50 b,x27.08 a,x0.408
Dry4.43 c13.77 b,x14.56 b,z21.61 a,y21.67 a,y0.344
Wet4.43 d12.41 c,y16.51 b,y18.48 a,z16.75 b,z0.283
SEM 20.2850.3640.4300.416
ProlineCrust8.56 d9.89 d,y16.97 c,x23.66 b,x27.18 a,x0.627
Dry8.56 d10.72 c,x11.23 c,z17.98 b,y19.30 a,y0.375
Wet8.56 d10.58 c,x12.89 b,y14.11 ab,z14.65 a,z0.435
SEM 20.1880.3530.4910.683
SerineCrust6.61 e9.92 d,y18.18 c,x24.04 b,x27.00 a,x0.481
Dry6.61 e11.73 d,x14.58 c,y19.93 b,y22.07 a,y0.155
Wet6.61 e10.19 d,y14.55 c,y16.32 b,z17.92 a,z0.322
SEM 20.3580.3210.3090.511
TaurineCrust45.68 d56.38 b,x39.30 e,x48.02 c,x67.42 a,y0.620
Dry45.68 c55.03 b,x36.44 e,y43.50 d,y71.26 a,x0.692
Wet45.68 a41.56 b,y34.27 c,y34.26 c,z33.98 c,z0.883
SEM 20.6980.9110.6890.930
TryptophanCrust3.91 c5.26 b,y5.29 b,y6.78 a,z5.76 b,z0.343
Dry3.91 d6.86 c,x7.71 c,x10.92 b,x12.39 a,x0.303
Wet3.91 e6.45 d,x8.04 c,x9.32 b,y10.54 a,y0.232
SEM 20.3470.2200.2740.414
ValineCrust3.18 e9.56 d,x17.94 c,x26.14 b,x30.92 a,x0.582
Dry3.17 e9.88 d,x12.51 c,y19.48 b,y20.76 a,y0.256
Wet3.37 e8.99 d,y13.34 c,y16.06 b,z16.90 a,z0.263
SEM20.1090.3880.3480.702
Total free amino acidsCrust200.89 e280.30 d,x386.52 c,x478.71 b,x533.85 a,x6.282
Dry200.89 e279.48 d,x301.81 c,y383.80 b,y446.23 a,y2.958
Wet200.89 e246.77 d,y300.74 c,y330.32 b,z360.88 a,z3.759
SEM 23.8844.2784.0847.102
1, 2 Standard error of the means 1 (n = 25), 2 (n = 15). a–e Different letters in the same row indicate a significant difference (p < 0.05). x–z Different letters in the same column indicate a significant difference (p < 0.05).
Table 2. Bioactive compounds (mg/100 g) from different aged beef striploin (longissimus lumborum) using 1H-13C HSQC on 850 MHz cryo-NMR spectrometer.
ContentsAging MethodAging Period
(Day)
SEM 1
07142128
AnserineCrust19.93 c90.26 b,y95.08 b,x147.98 a,x96.89 b,x0.852
Dry19.93 d100.21 a,x53.12 c,y98.30 a,y72.07 b,y0.264
Wet19.93 c92.04 a,y91.40 a,x78.30 b,z22.72 c,z0.312
SEM 22.4383.9323.1935.267
BetaineCrust15.36 ab14.78 b16.34 ab,x17.15 ab,x17.67 a,x0.363
Dry15.36 a14.76 ab13.58 b,y14.19 ab,y14.98 ab,xy0.388
Wet15.3614.1514.18 y13.08 y12.93 y0.481
SEM 20.3020.6370.5460.873
CarnitineCrust39.61 c44.95 ab,x46.01 a,x45.35 ab,x42.70 b,x0.699
Dry39.61 b43.41 a,x41.44 ab,y41.76 ab,y41.24 ab,x0.585
Wet39.61 a34.97 b,y34.87 b,z32.52 b,z32.47 b,y0.462
SEM 20.8660.6420.4510.650
CarnosineCrust33.97 d418.83 b,z256.24 c,y498.79 a,y260.74 c,y0.844
Dry33.97 e471.15 b,y205.82 d,z546.28 a,x297.89 c,x0.489
Wet33.97 e499.34 a,x476.09 b,x455.32 c,z53.02 d,z0.855
SEM 25.9086.0055.2215.655
Creatine/PhosphocreatineCrust182.13 c215.28 b,y239.46 a,x205.85 bc,x192.74 b,c0.553
Dry182.13 b227.47 a,x167.30 b,y150.83 b,y157.55 b,y0.688
Wet182.13 b211.49 a,y200.98 ab,xy202.34 ab,x197.01 ab,x0.781
SEM 23.80612.9836.4969.142
1, 2 Standard error of the means 1 (n = 25), 2 (n = 15). a–e Different letters in the same row indicate a significant difference (p < 0.05). x–z Different letters in the same column indicate a significant difference (p < 0.05).
Table 3. Nucleotide contents (mg/100 g) from different aged beef striploin (longissimus lumborum) using 1H-13C HSQC on 850 MHz cryo-NMR spectrometer.
ContentsAging MethodAging Period
(Day)
SEM 1
07142128
IMPCrust135.21 a57.42 b,y46.52 c,y36.54 d,z10.22 e,z1.104
Dry135.21 a99.78 b,x80.49 c,x66.71 d,x38.29 e,y1.291
Wet135.21 a102.60 b,x75.64 c,x56.68 d,y53.05 d,x1.330
SEM 21.1541.6121.0940.953
InosineCrust16.04 d27.48 a,x18.58 c,y20.48 b14.93 d,y0.476
Dry16.04 d18.79 b,y17.59 c,y20.17 a17.74 c,x0.287
Wet16.04 c18.50 b,y20.24 a,x20.03 a16.81 c,x0.476
SEM 20.4080.4230.5890.400
HypoxanthineCrust12.54 e25.45 d,x37.67 c,x43.53 b,x46.64 a,x0.540
Dry12.54 e22.72 d.y27.64 c,y33.51 b,y37.36 a,y0.880
Wet12.54 d21.15 c,z26.90 b,y32.18 a,y36.04 a,y1.415
SEM 20.5021.0060.2530.765
1, 2 Standard error of the means 1 (n = 25), 2 (n = 15). a–e Different letters in the same row indicate a significant difference (p < 0.05). x–z Different letters in the same column indicate a significant difference (p < 0.05).

