Application of Ion Mobility Spectrometry for Permeability Studies of Organic Substances through Polymeric Materials


Abstract
1. Introduction
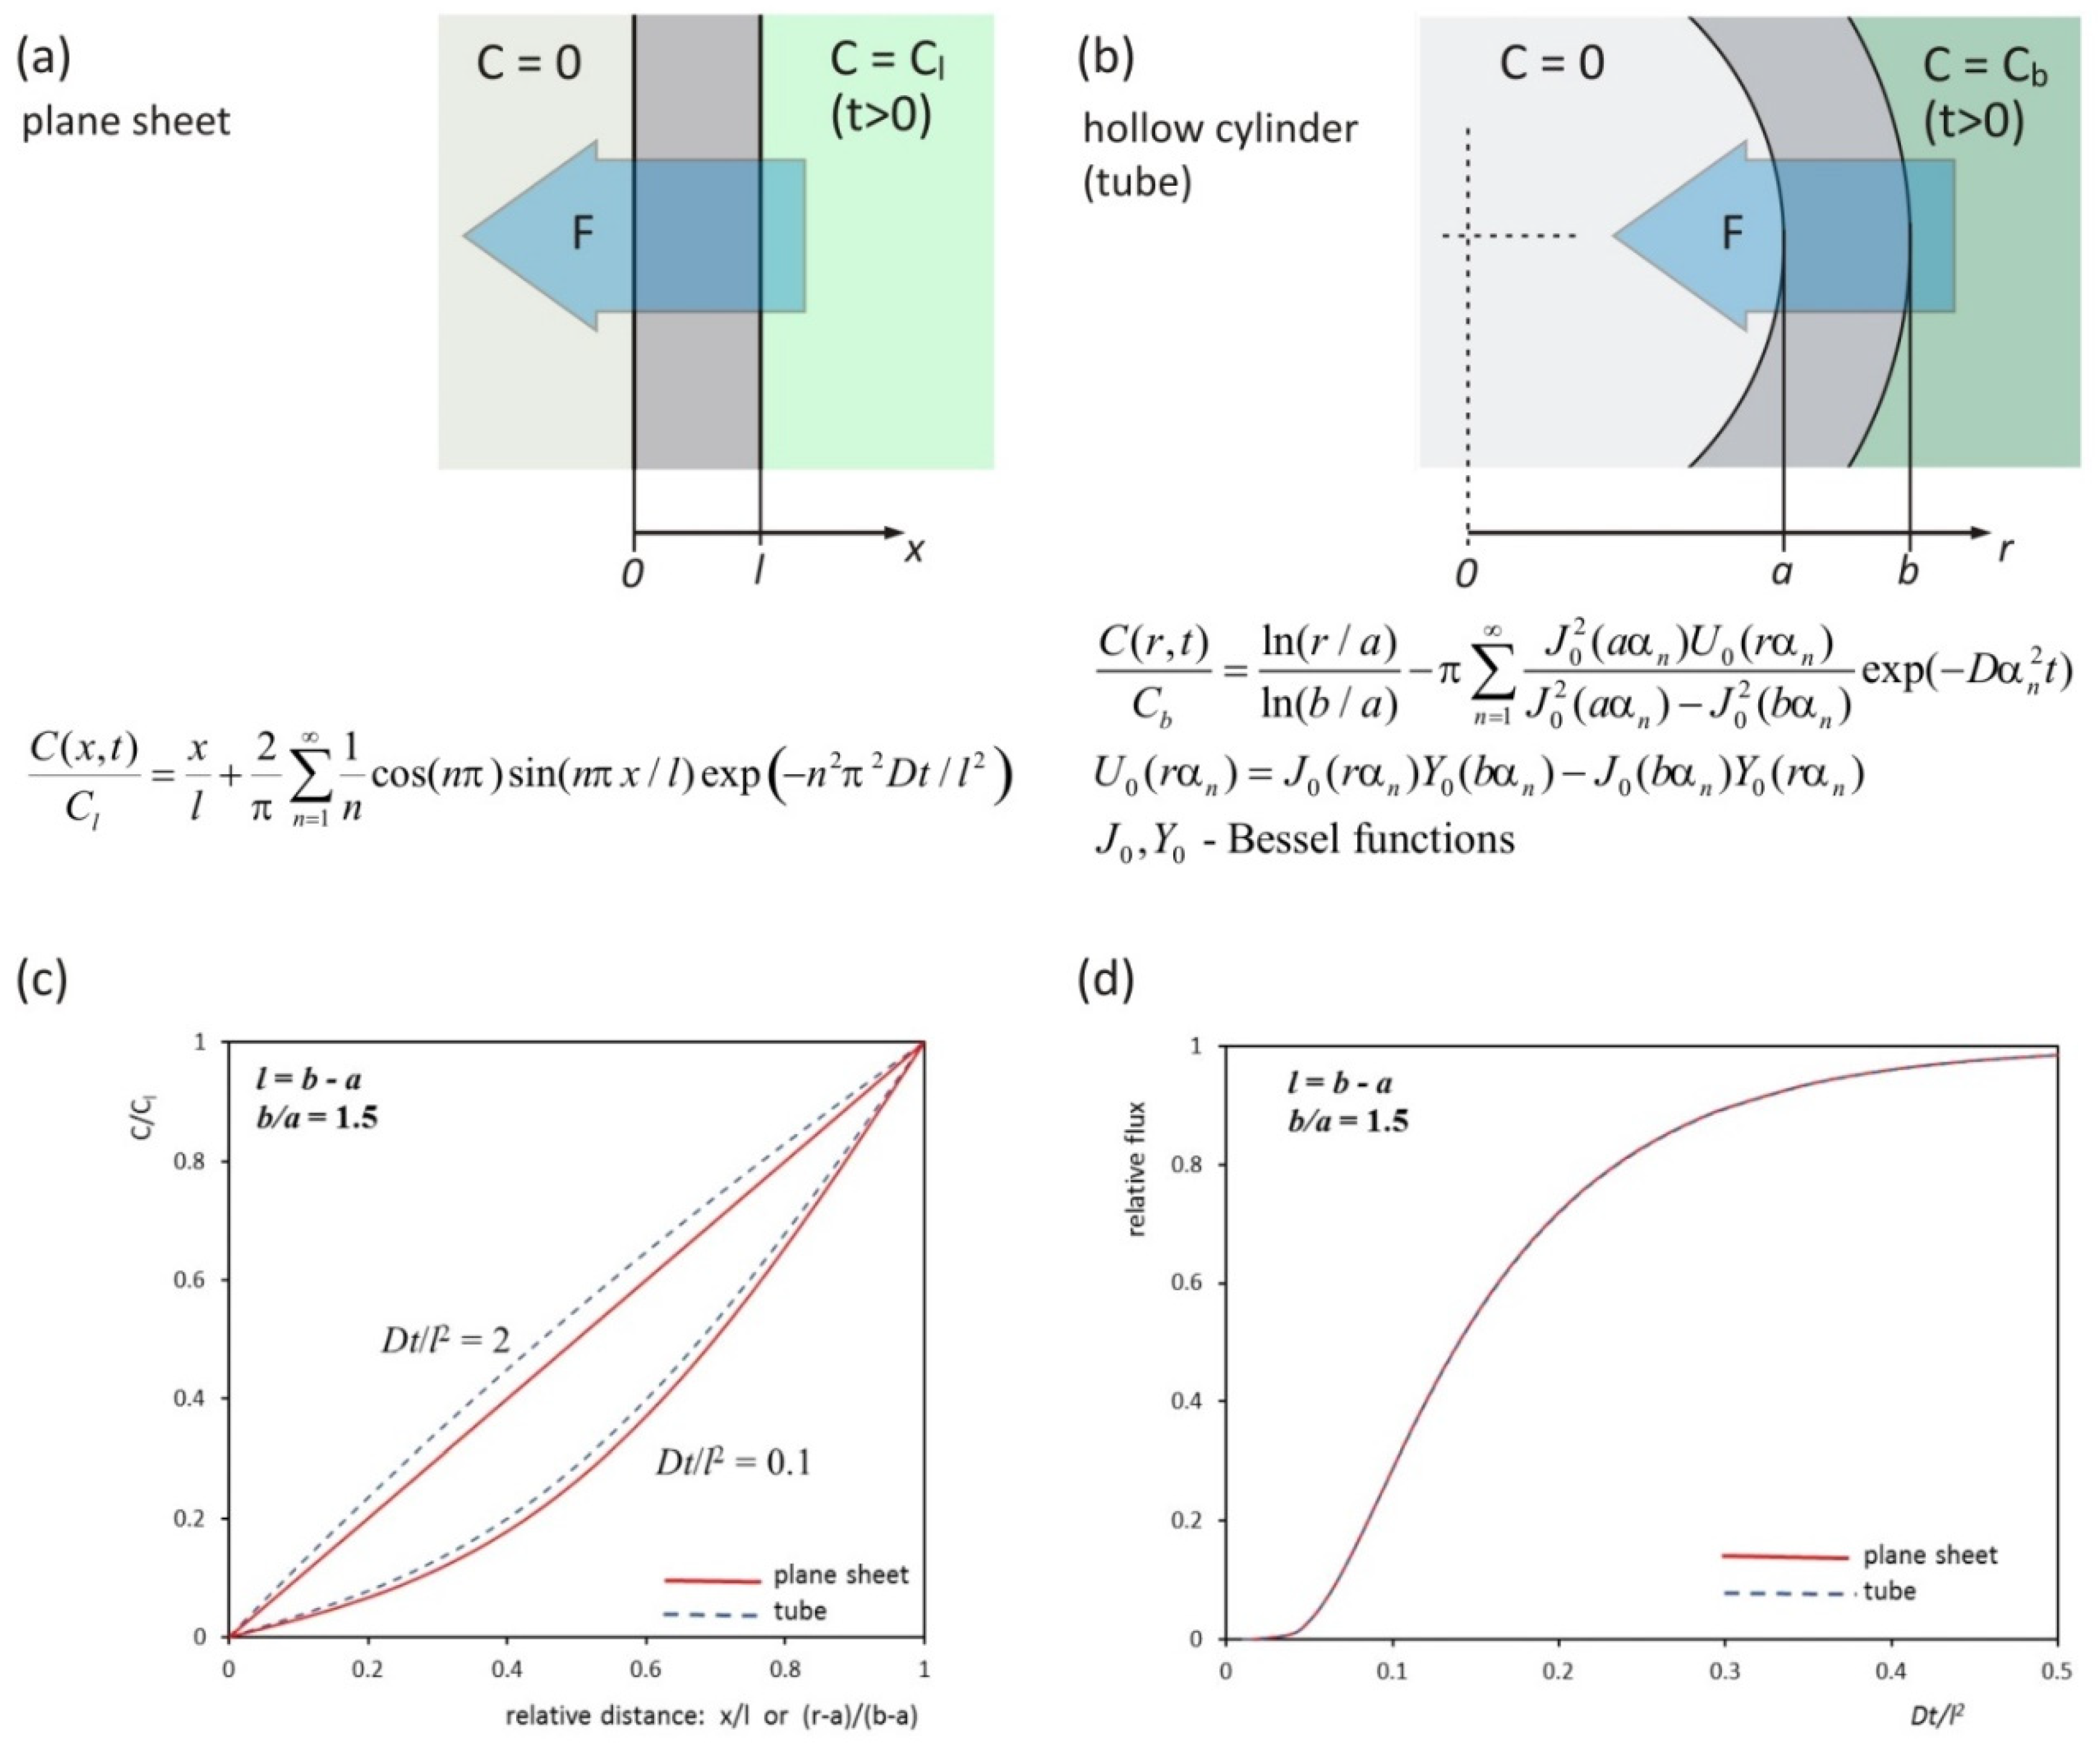
2. Theory
3. Materials and Methods
3.1. Chemicals
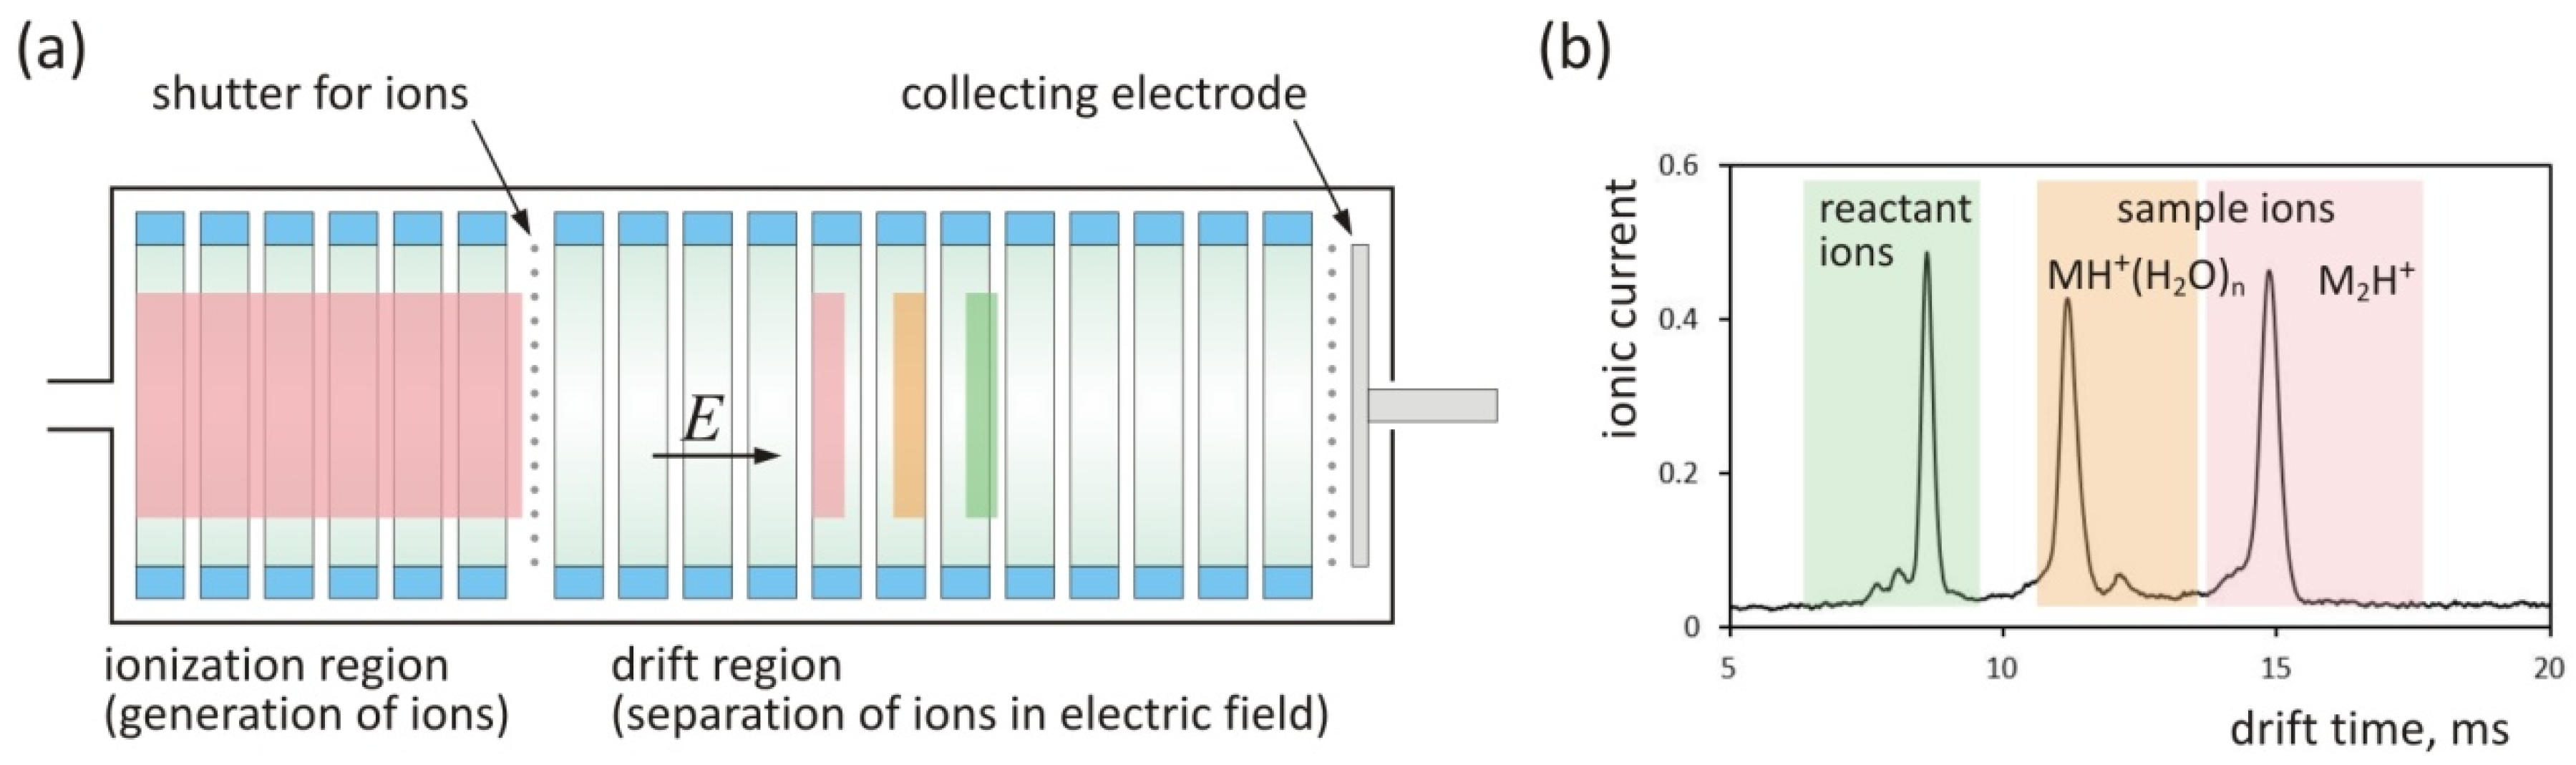
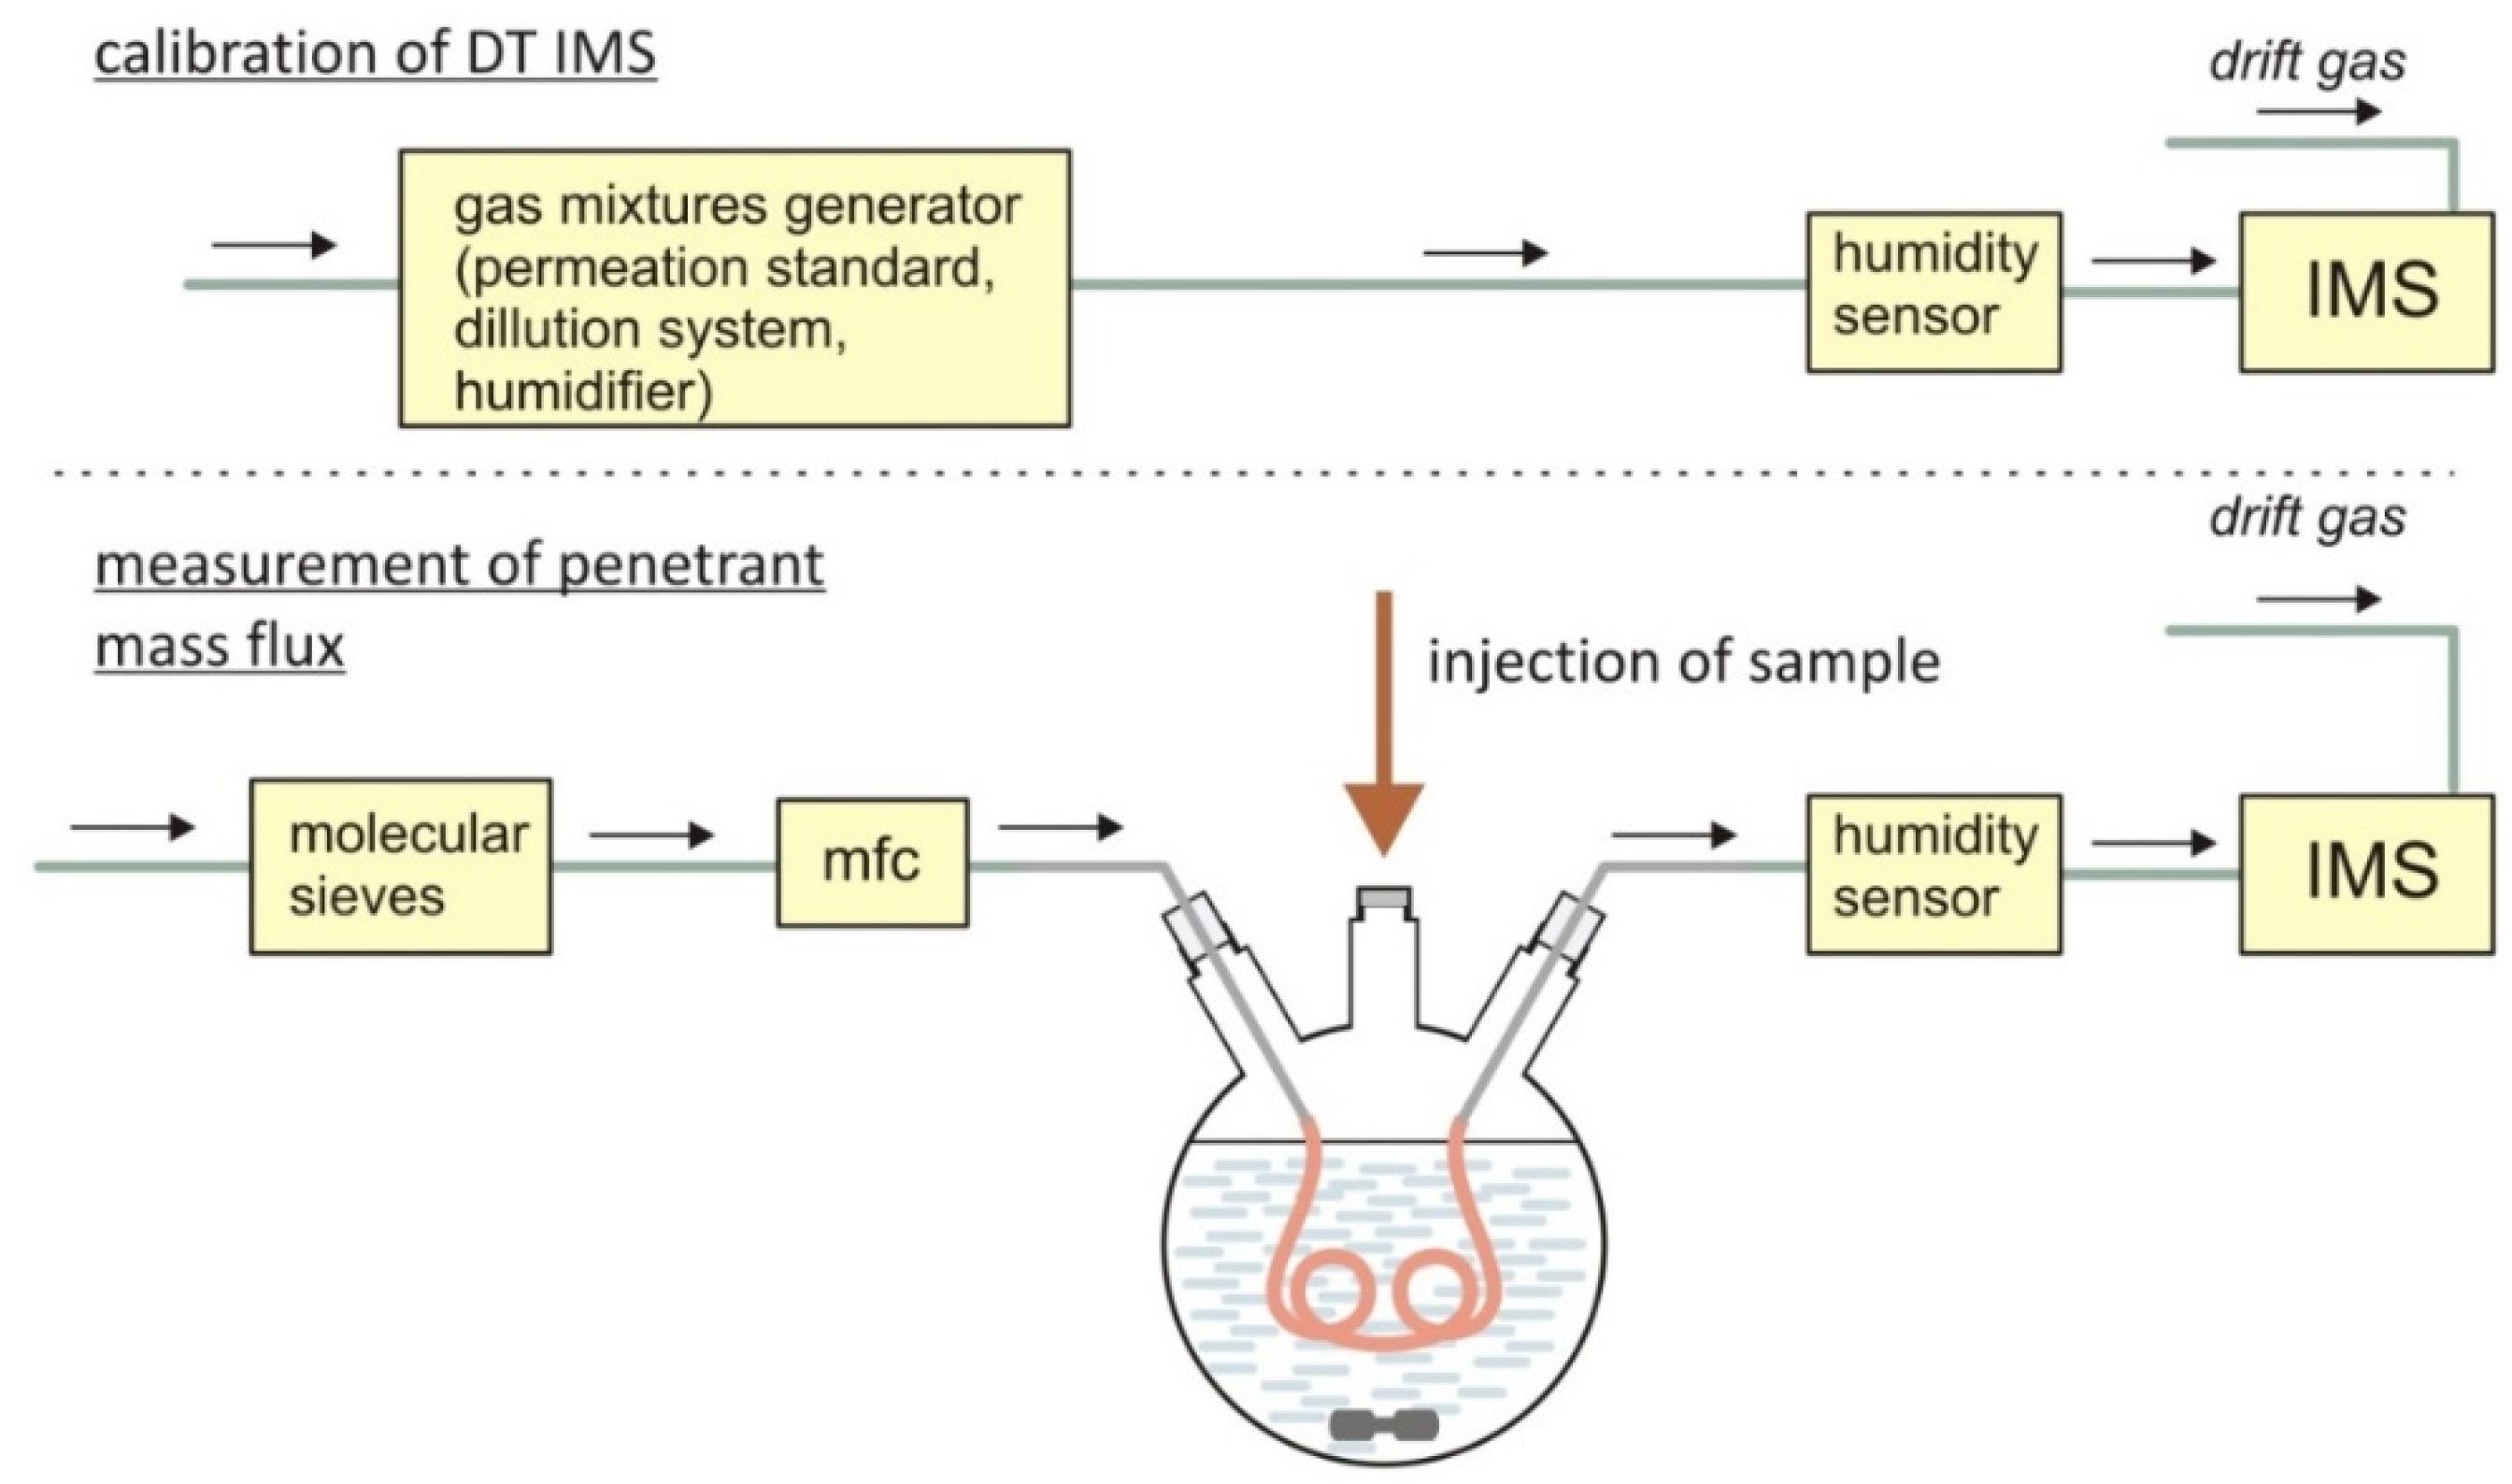
3.2. Instrumental
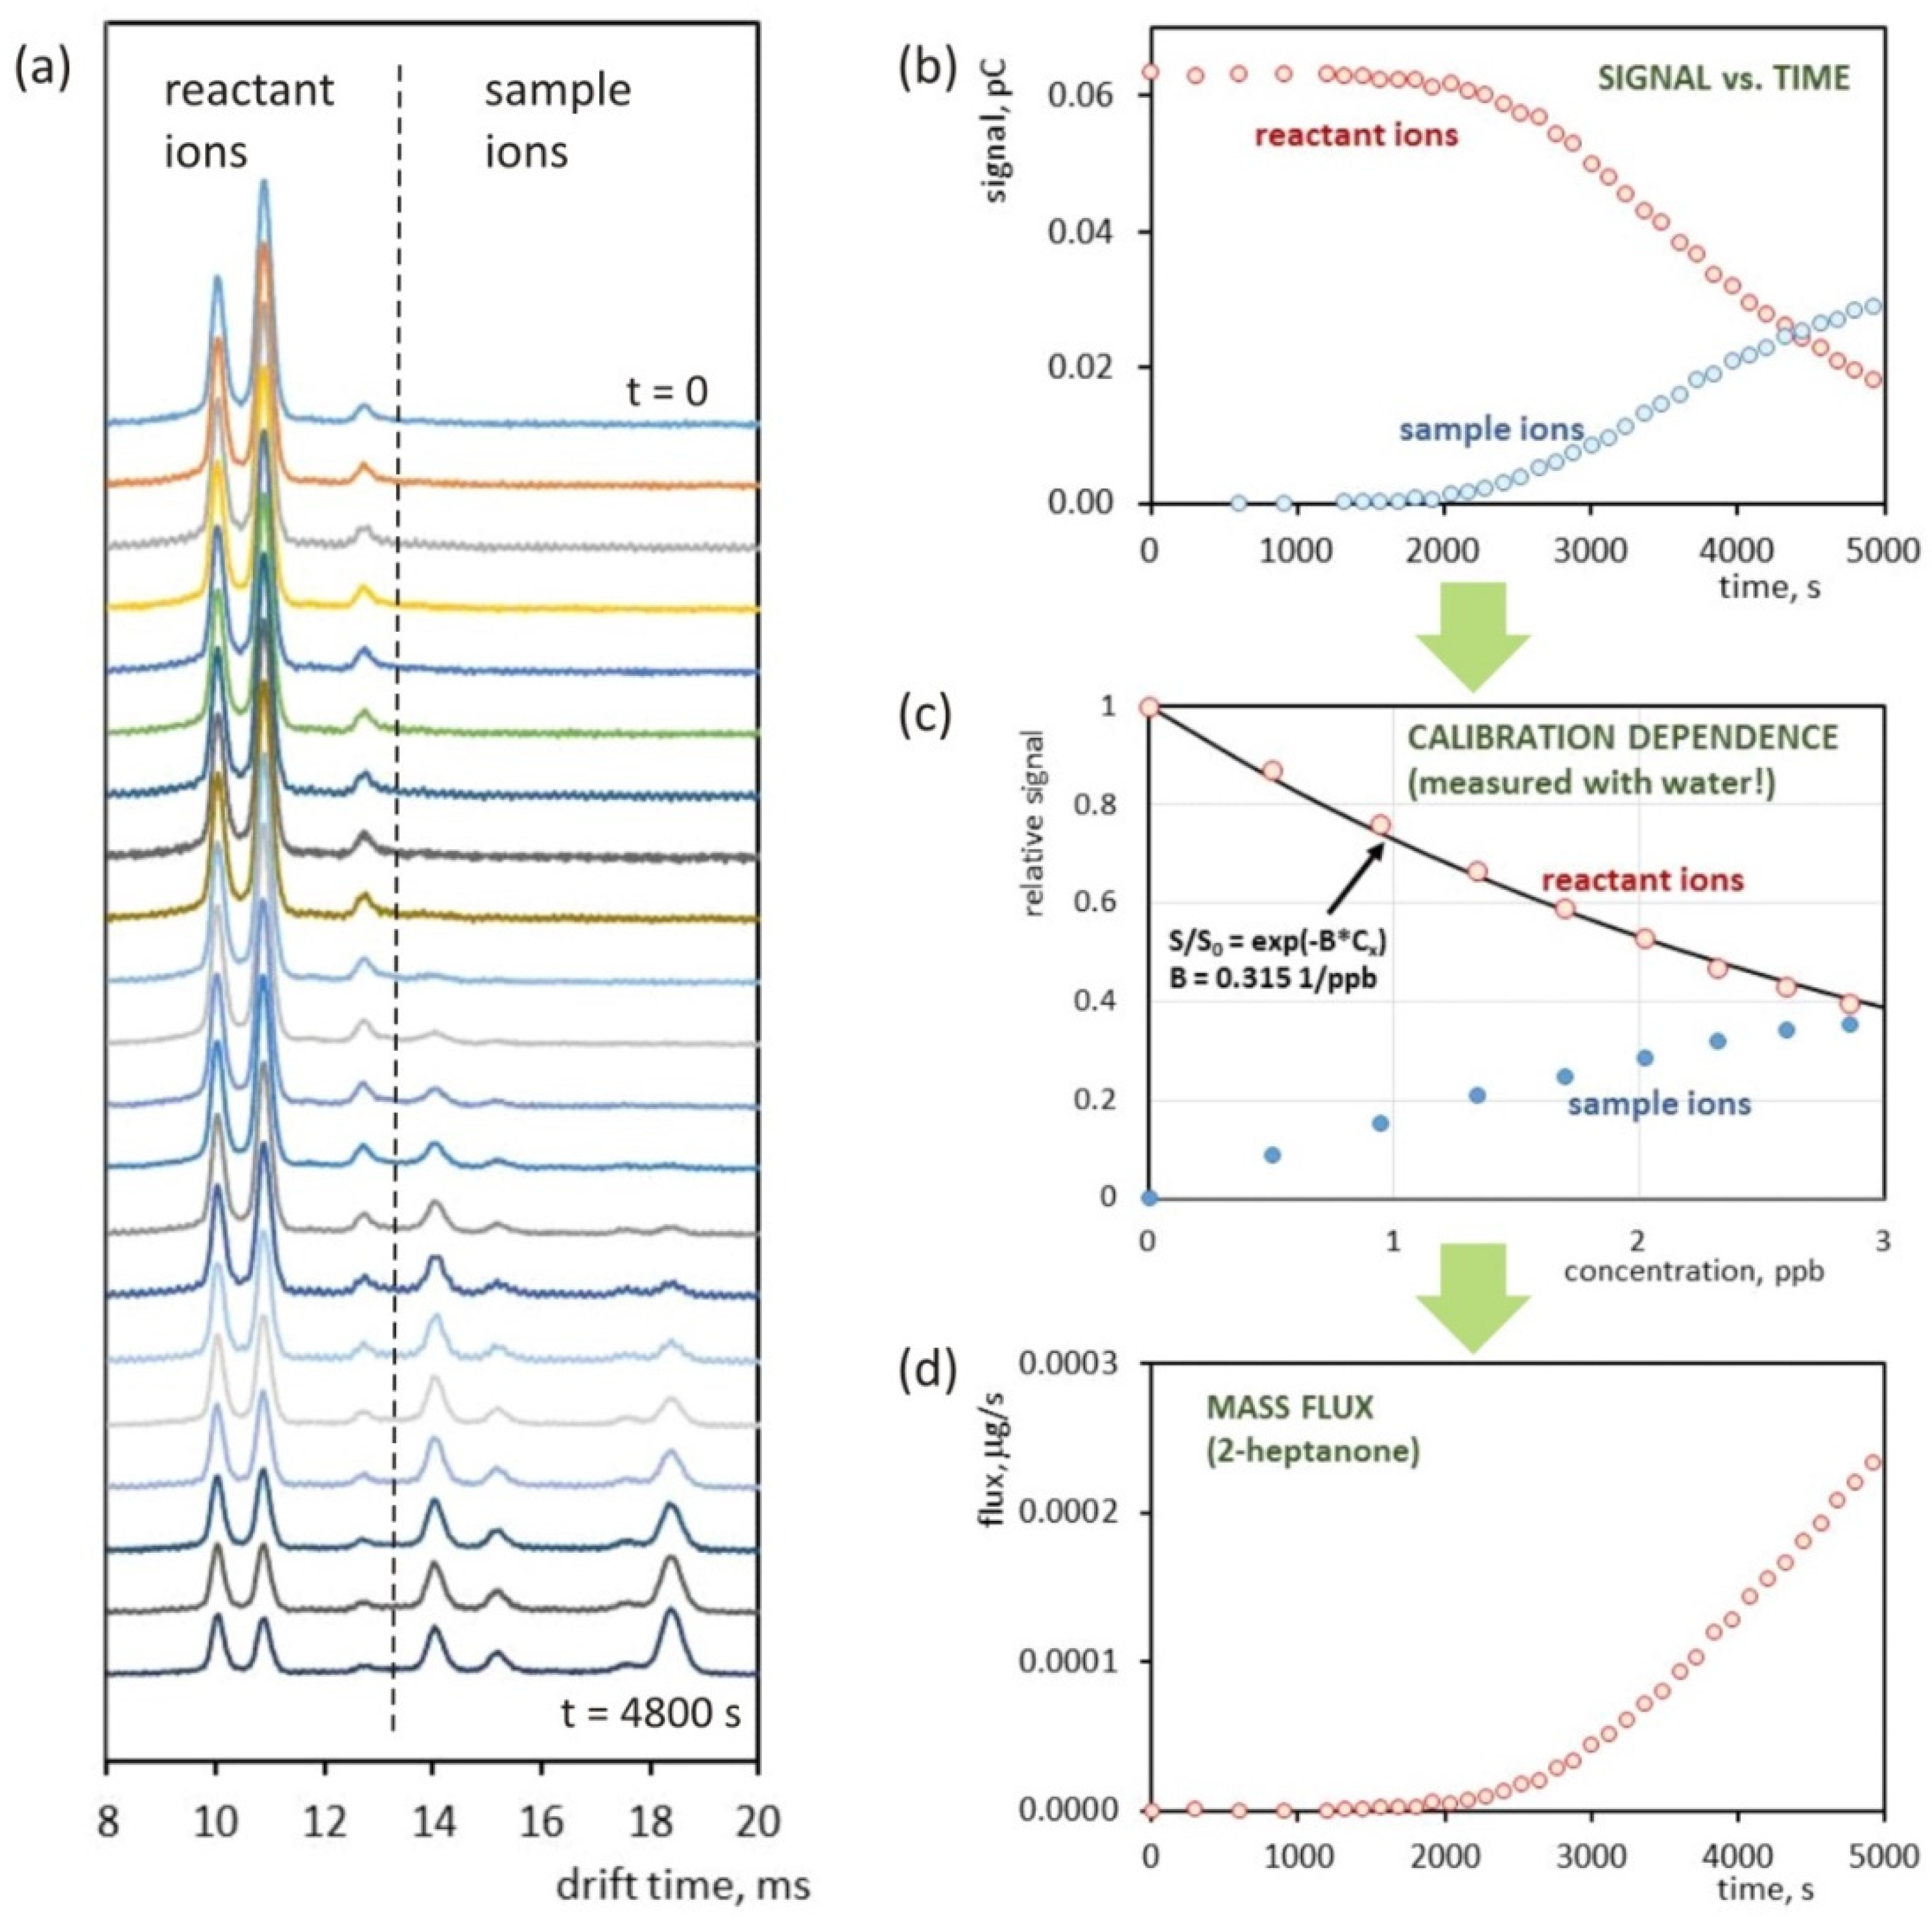
4. Results
5. Conclusions
Author Contributions
Funding
Acknowledgments
Conflicts of Interest
References
- Golan, A.; Kleper, M.H. Membrane-Based Air Separation. AIChE Symp. Ser. 1986, 250, 35–47. [Google Scholar]
- Chen, X.Y.; Vinh-thang, H.; Ramirez, A.A.; Rodrigue, D.; Kaliaguine, S. Membrane gas separation technologies for biogas upgrading. RSC Adv. 2015, 5, 24399–24448. [Google Scholar] [CrossRef]
- Gugliuzza, A.; Iulianelli, A.; Basile, A. Membranes for hydrocarbon fuel processing and separation. In Advanced Membrane Science and Technology for Sustainable Energy and Environmental Applications; Basile, A., Nunes, P., Eds.; Woodhead Publishing: Cambridge, UK, 2011; pp. 295–338. [Google Scholar]
- Ottaviani, G.; Martel, S.; Carrupt, P.A. Parallel artificial membrane permeability assay: A new membrane for the fast prediction of passive human skin permeability. J. Med. Chem. 2006, 4, 3948–3954. [Google Scholar] [CrossRef] [PubMed]
- Fischbach, M.; Terzic, J.; Laugel, V.; Escande, B.; Dangelser, C.; Helmstetter, A. Measurement of hydrostatic intraperitoneal pressure: A useful tool for the improvement of dialysis dose prescription. Pediatr. Nephrol. 2003, 18, 976–980. [Google Scholar] [CrossRef] [PubMed]
- Sandahl, M.; Mathiasson, L.; Jonsson, J.A. Determination of thiophanate-methyl and its metabolites at trace level in spiked natural water using the supported liquid membrane extraction and the microporous membrane liquid-liquid extraction techniques combined on-line with high-performance liquid chromatography. J. Chromatogr. A 2000, 893, 123–131. [Google Scholar] [PubMed]
- Jonsson, J.A. Liquid membrane techniques. In Comprehensive Analytical Chemistry; Pawliszyn, J., Ed.; Elsevier Science: Amsterdam, The Netherlands, 2002; Volume 37, pp. 503–530. [Google Scholar]
- Baker, R.W. Membranes for vapor/gas separations. Membr. Technol. Res. Inc. 2001, 1–25. Available online: http://citeseerx.ist.psu.edu/viewdoc/download?doi=10.1.1.566.6052&rep=rep1&type=pdf (accessed on 3 February 2020).
- Alentiev, A.Y.; Yampolskii, Y.P. Free volume model and tradeoff relations of gas permeability and selectivity in glassy polymers. J. Membr. Sci. 2000, 165, 201–216. [Google Scholar] [CrossRef]
- Javaid, A. Membranes for solubility-based gas separation applications. Chem. Eng. J. 2005, 112, 219–226. [Google Scholar] [CrossRef]
- Ismail, A.F.; Khulbe, K.C.; Matsuura, T. Gas Separation Membranes: Polymeric and Inorganic; Springer International Publishing: Basel, Switzerland, 2015. [Google Scholar]
- Biasetto, L.; Colombo, P.; Innocentini, M.D.M.; Mullens, S. Gas permeability of microcellular ceramic foams. Ind. Eng. Chem. Res. 2007, 46, 3366–3372. [Google Scholar] [CrossRef]
- Catalano, J.; Baschetti, M.G.; De Angelis, M.G.; Sarti, G.C.; Sanguineti, A.; Fossati, P. Gas and water vapor permeation in a short-side-chain PFSI membrane. Desalination 2009, 240, 341–346. [Google Scholar] [CrossRef]
- Tremblay, P.; Savard, M.M.; Vermette, J.; Paquin, R. Gas permeability, diffusivity and solubility of nitrogen, helium, methane, carbon dioxide and formaldehyde in dense polymeric membranes using a new on-line permeation apparatus. J. Membr. Sci. 2006, 282, 245–256. [Google Scholar] [CrossRef]
- Tan, S.; Fu, Q.; Scofield, J.M.P.; Kim, J.; Gurr, P.A.; Ladewig, K.; Blencowe, A.; Qiao, G.G. Cyclodextrin-based supramolecular polymeric nanoparticles for next generation gas separation membranes. J. Mater. Chem. A 2015, 3, 14876–14886. [Google Scholar] [CrossRef]
- Guo, Z.; Lee, L.J.; Tomasko, D.L. CO2 permeability of polystyrene nanocomposites and nanocomposite foams. Ind. Eng. Chem. Res. 2008, 47, 9636–9643. [Google Scholar] [CrossRef]
- Aleid, S.M.; AL Saikhan, M.S. Effect of Permeable Modified Atmosphere Packaging on Quality and Shelf Life of Fresh ®Khenaizy Dates Stored at Low Temperature. J. Food Nutr. Res. 2017, 5, 503–509. [Google Scholar]
- Friedmann, G.; Sperry, P.; Brossas, J. Polarographic method for the determination of the permeability coefficient of polymers towards oxygen dissolved in water. J. Membr. Sci. 1992, 6, 93–100. [Google Scholar] [CrossRef]
- Yom, C.K.; Kim, B.S.; Lee, J.M. Precise on-line measurements of permeation transients through dense polymeric membranes using a new permeation apparatus. J. Membr. Sci. 1999, 161, 55–66. [Google Scholar] [CrossRef]
- Yeom, C.K.; Lee, J.M.; Hong, Y.T.; Choi, K.Y.; Kim, S.C. Analysis of permeation transients of pure gases through dense polymeric membranes measured by a new permeation apparatus. J. Membr. Sci. 2000, 166, 71–83. [Google Scholar] [CrossRef]
- Hauser, B.; Popp, P.; Kleine-Benne, E. Membrane-assisted solvent extraction of triazines and other semi-volatile contaminants directly coupled to large-volume injection-gas chromatography- mass spectrometric detection. J. Chromatogr. A 2002, 963, 27–36. [Google Scholar] [CrossRef]
- Hauser, B.; Popp, P. Membrane-assisted solvent extraction of organochlorine compounds in combination with large-volume injection/gas chromatography-electron capture detection. J. Sep. Sci. 2001, 24, 551–560. [Google Scholar] [CrossRef]
- Schellin, M.; Popp, P. Membrane-assisted solvent extraction of polychlorinated biphenyls in river water and other matrices combined with large volume injection-gas chromatography-mass spectrometric detection. J. Chromatogr. A 2003, 1020, 153–160. [Google Scholar] [CrossRef]
- Melcher, R.G.; Morabito, P.L. Membrane/gas chromatographic system for automated extraction and determination of trace organics in aqueous samples. Anal. Chem. 1990, 62, 2183–2188. [Google Scholar] [CrossRef]
- Knutsson, M.; Nilv’e, G.; Mathiasson, L.; Jonsson, J.A. Supported liquid membranes for sampling and sample preparation of pesticides in water. J. Chromatogr. A 1996, 754, 197–205. [Google Scholar] [CrossRef]
- Megersa, N.; Jonsson, J.A. Trace enrichment and sample preparation of alkylthio-s-triazine herbicides in environmental waters using a supported liquid membrane technique in combination with high-performance liquid chromatography. Analyst 1998, 123, 225–231. [Google Scholar] [CrossRef]
- Shen, Y.; Jonsson, J.A.; Mathiasson, L. On-line microporous membrane liquid-liquid extraction for sample pretreatment combined with capillary gas chromatography applied to local anaes-thetics in blood plasma. Anal. Chem. 1998, 70, 946–953. [Google Scholar] [CrossRef]
- Eiceman, G.A.; Karpas, Z. Ion Mobility Spectrometry, 2nd ed.; CRC Press: Boca Raton, FL, USA, 2005. [Google Scholar]
- Sorribes-Soriano, A.; de la Guardia, M.; Esteve-Turrillas, F.A.; Armenta, S. Trace analysis by ion mobility spectrometry: From conventional to smart sample preconcentration methods. A review. Anal. Chim. Acta 2018, 1026, 37–50. [Google Scholar] [CrossRef]
- Budzyńska, E.; Sielemann, S.; Puton, J.; Surminski, A.L.R.M. Analysis of e-liquids for electronic cigarettes using GC-IMS/MS with headspace sampling. Talanta 2020, 209, 120594. [Google Scholar] [CrossRef]
- Yanini, A.; Esteve-Turrillas, F.A.; de la Guardia, M.; Armenta, S. Ion mobility spectrometry and high resolution mass-spectrometry as methodologies for rapid identification of the last generation of new psychoactive substances. J. Chromatogr. A 2018, 1574, 91–100. [Google Scholar] [CrossRef] [PubMed]
- Kou, D.; San Juan, A.; Mitra, S. Gas injection membrane extraction for fast on-line analysis using GC detection. Anal. Chem. 2001, 73, 5462–5467. [Google Scholar] [CrossRef]
- Borsdorf, H.; Rammler, A. Continuous on-line determination of methyl tert -butyl ether in water samples using ion mobility spectrometry. J. Chromatogr. A 2005, 1072, 45–54. [Google Scholar] [CrossRef]
- Du, Y.; Zhang, W.; Whitten, W.; Li, H.; Watson, D.B.; Xu, J. Membrane-Extraction Ion Mobility Spectrometry for in Situ Detection of Chlorinated Hydrocarbons in Water. Anal. Chem. 2010, 82, 4089–4096. [Google Scholar] [CrossRef]
- Arce, L.; Valcárcel, M. Membrane Set up Combined with Photoionization-Ion Mobility Spectrometer to Improve Analytical Performance and Avoid Humidity Interference on the Determination of Aromatics in Gaseous Samples. J. Chromatogr. A 2016, 1431, 55–63. [Google Scholar]
- Holopainen, S.; Nousiainen, M. Determination of Fuel Ethers in Water by Membrane Extraction Ion Mobility Spectrometry. Talanta 2013, 106, 448–453. [Google Scholar] [CrossRef] [PubMed]
- Holopainen, S.; Nousiainen, M.; Anttalainen, O.; Sillanpa, M.E.T. Sample-Extraction Methods for Ion-Mobility Spectrometry in Water Analysis. Trac. Trends Anal. Chem. 2012, 37, 124–134. [Google Scholar] [CrossRef]
- Higgins, B.; Simonson, D.; McGill, R.A.; Nguyen, V.; Stepnowski, J.; Pai, R.; Stepnowski, S.; Rake, M. Functionalized sorbent membranes for use with ion mobility spectrometry. In Proceedings of the 2008 IEEE Conference on Technologies for Homeland Security, Waltham, MA, USA, 12–13 May 2008; pp. 139–143. [Google Scholar]
- Casandra, A.; Ismadiji, S.; Noskov, B.A.; Liggieri, L.; Lin, S.-Y. A study on the method of short-time approximation—Criteria for applicability. Int. J. Heat Mass Trans. 2015, 90, 752–760. [Google Scholar] [CrossRef]
- Crank, J. The Mathematics of Diffusion, 2nd ed.; Oxford University Press: Oxford, UK, 1975. [Google Scholar]
- Huang, I.; Yen, S. Diffusion in hollow cylinders for some boundary conditions. Mater. Chem. Phys. 2002, 74, 289–299. [Google Scholar] [CrossRef]
- Karimi, M. Diffusion in polymer solids and solutions. In Mass Transfer in Chemical Engineering Processes; Markos, J., Ed.; InTech: Rijeka, Croatia, 2011; pp. 17–40. [Google Scholar]
- Borsdorf, H.; Fiedler, P.; Mayer, T. The effect of humidity on gas sensing with ion mobility spectrometry. Sens. Actuators B Chem. 2015, 218, 184–190. [Google Scholar] [CrossRef]
- Mäkinen, M.; Sillanpää, M.; Viitanen, A.; Knap, A.; Mäkelä, J.M.; Puton, J. The effect of humidity on sensitivity of amine detection in ion mobility spectrometry. Talanta 2011, 84, 116–121. [Google Scholar] [CrossRef] [PubMed]
- Thiyagarajan, R.; Ravi, S.; Bhattacharya, P.K. Pervaporation of methyl–ethyl ketone and water mixture: Determination of concentration profile. Desalination 2011, 277, 178–186. [Google Scholar] [CrossRef]
Sample Availability: Samples of the compounds are not available from the authors. |


| Diffusion Coefficient | Permeability | |
|---|---|---|
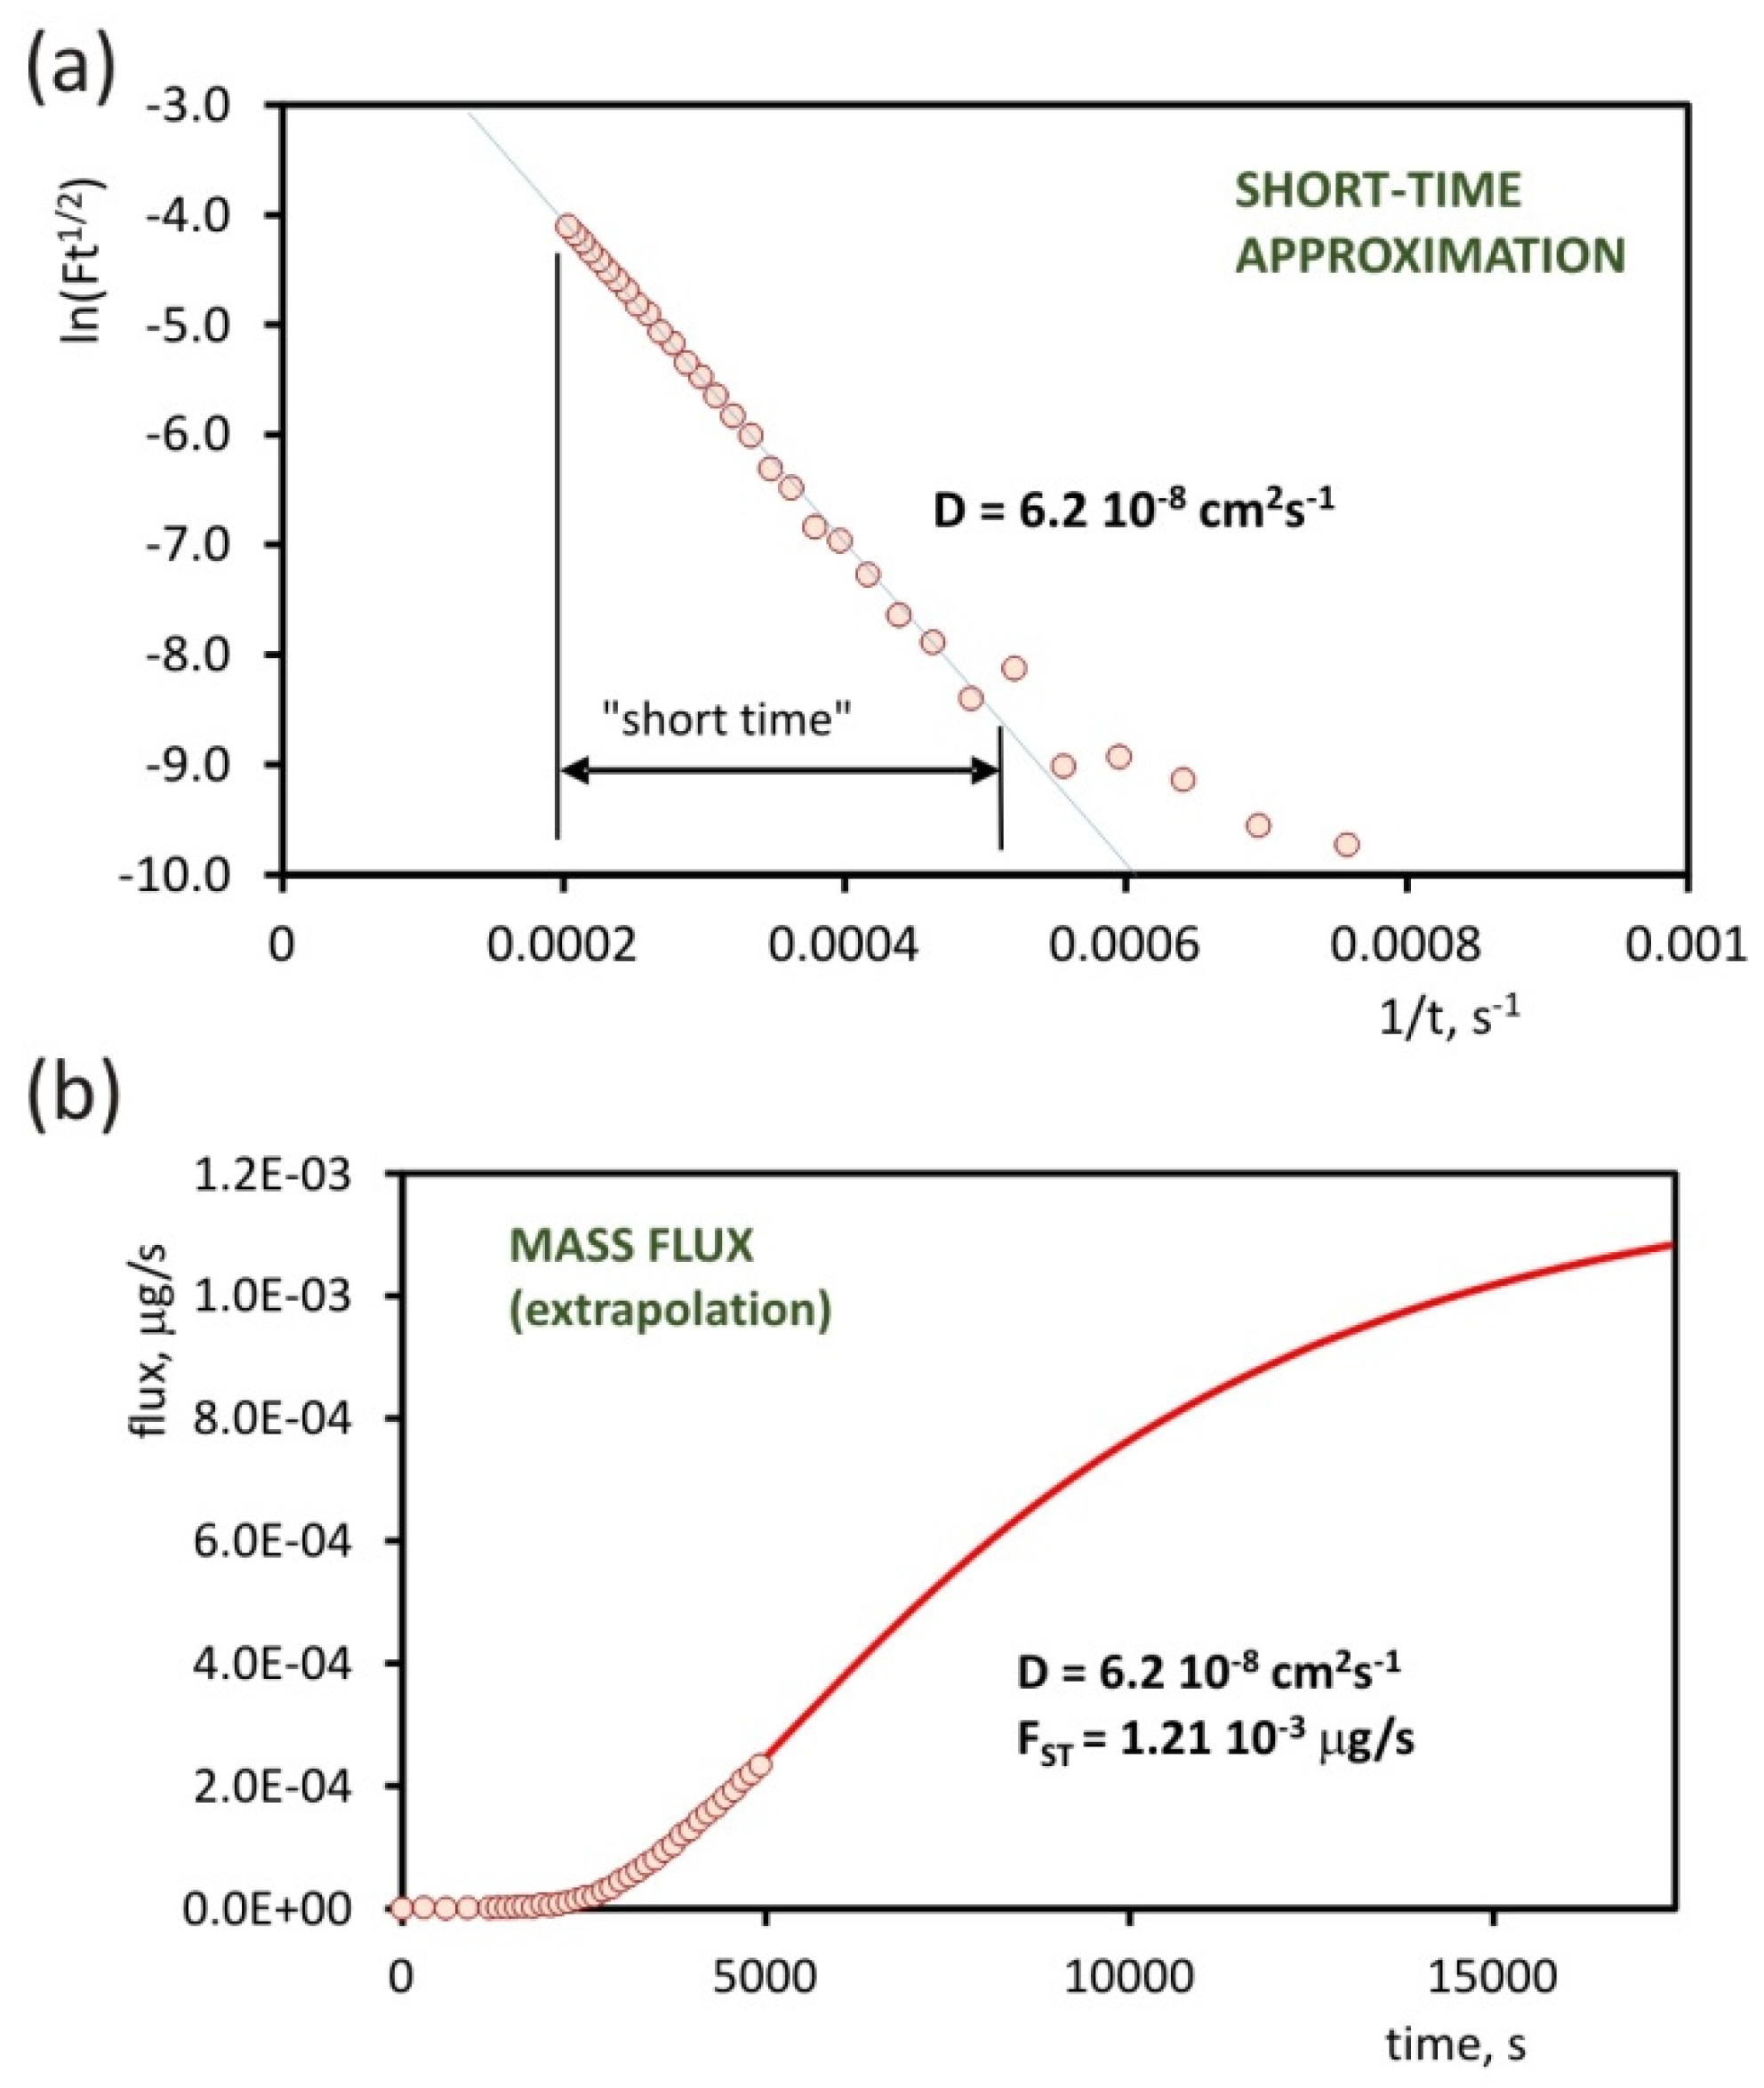
| 2-heptanone | 6.2 × 10⁻⁸ cm2s−1 | 2.0 × 10⁻⁷ cm2s−1 |
| DMMP (dimethyl methylphosphonate) | 3.1 × 10⁻⁸ cm2s−1 | 4.9 × 10⁻⁸ cm2s−1 |
| water | >1.4 × 10⁻⁶ cm2s−1 | 4.3 × 10⁻⁹ cm2s−1 |
© 2020 by the authors. Licensee MDPI, Basel, Switzerland. This article is an open access article distributed under the terms and conditions of the Creative Commons Attribution (CC BY) license (http://creativecommons.org/licenses/by/4.0/).
Share and Cite
Wiśnik-Sawka, M.; Budzyńska, E.; Puton, J. Application of Ion Mobility Spectrometry for Permeability Studies of Organic Substances through Polymeric Materials. Molecules 2020, 25, 2983. https://doi.org/10.3390/molecules25132983
Wiśnik-Sawka M, Budzyńska E, Puton J. Application of Ion Mobility Spectrometry for Permeability Studies of Organic Substances through Polymeric Materials. Molecules. 2020; 25(13):2983. https://doi.org/10.3390/molecules25132983
Chicago/Turabian StyleWiśnik-Sawka, Monika, Edyta Budzyńska, and Jarosław Puton. 2020. "Application of Ion Mobility Spectrometry for Permeability Studies of Organic Substances through Polymeric Materials" Molecules 25, no. 13: 2983. https://doi.org/10.3390/molecules25132983
APA StyleWiśnik-Sawka, M., Budzyńska, E., & Puton, J. (2020). Application of Ion Mobility Spectrometry for Permeability Studies of Organic Substances through Polymeric Materials. Molecules, 25(13), 2983. https://doi.org/10.3390/molecules25132983