Article

Gold Nanoparticles as Colorimetric Sensors for the Detection of DNA Bases and Related Compounds

Departamento de Química, Facultad de Ciencias, Campus A Zapateira, Universidade A Coruña, 15008 La Coruña, Spain
Molecules 2020, 25(12), 2890; https://doi.org/10.3390/molecules25122890
Submission received: 29 May 2020 / Revised: 16 June 2020 / Accepted: 22 June 2020 / Published: 23 June 2020
(This article belongs to the Section Nanochemistry)

Abstract

:
Results regarding interaction of colloidal gold solutions with nucleobases, including uracil (U), as well as its sulfur derivatives, 2-thiouracil (2TU) and 4-thiouracil (4TU), cytosine (C), adenine (A), and guanine (G), as well as urea and thiourea (TU), are reported. Anionic stabilized citrate gold nanoparticles (AuNPs) were synthesized by reducing the tetrachloroaurate (III) trihydrate with trisodium citrate. The surface plasmon resonance (SPR) band was used in the characterization of synthesized AuNPs, as well as transmission electron microscope (TEM) imaging, which was used in the characterization of dispersed and aggregated gold nanoparticles. Interactions of nucleobases with the gold surface was analyzed by following the plasmon absorbance band red shift of the AuNPs. The sulfur-containing compounds adsorbed to the nanoparticle surfaces by chemisorption-type interactions; with TU and 4TU, the process is accompanied by a sudden change in color; in contrast, 2TU forms stable functionalized gold nanoparticles. Urea and U do not adsorb to nanoparticle surfaces, but the other heterocyclic bases containing nitrogen interact effectively with the gold surface, causing the assembly of nanoparticles, even though the interparticle self-aggregation process was slower than that mediated by either TU or 4TU. The method is efficient in the colorimetric detection of nucleobases and derivatives at concentration levels on the order of 1 µM.

Graphical Abstract

1. Introduction

Interactions between DNA nucleobases and noble metallic surfaces are important for the exploitation of the biological reactivity used in biosensor development, nanoparticle-assisted cancer treatment, and DNA microarray optimization [1,2,3]. In recent years, colorimetric assays based on gold nanoparticles (AuNPs) have emerged as a promising new method due to their unique and size-dependent optical, electrical, and catalytic properties [4,5,6,7,8]. AuNPs exhibit a visible surface plasmon resonance (SPR) band, which gives them a singular red color in aqueous solution [9,10,11,12,13].
Compared to planar gold, dispersed AuNPs possess the advantage of maintaining a “clean” surface for a long time, larger surface area, and allow for faster reaction rates. Gold colloids are prepared and stored in aqueous solution, and, although the surface adsorbs certain compounds, such as citrate, which is used in the most common synthesis procedure to stabilized the gold clusters, these adsorbed ligands can be easily displaced by many other species with high reactivity towards gold. For example, thiol-containing molecules spontaneously attach to the gold nanoparticles’ surfaces through the formation of –S–Au bonds [14,15,16,17,18,19,20,21].
The properties of AuNPs are characterized not only by the properties of the metal cluster core, but also by those of the organic molecules that constitute the monolayer and contribute to cluster stabilization. In this sense, the plasmon frequency is sensitive not only to the nature of the capped gold molecules that determines its microenvironment, but also to the size of nanoparticles (NPs) [22]. Upon reduction of the interparticle distance, the SPR band can couple, and red-shift in the absorption spectrum is observed. Surface modifications of gold NPs using functionalized capping molecules has been exploited in the development of new diagnostic tools for biological compounds. DNA bases are the fundamental constituents of nucleic acids containing nitrogen found within nucleotides. The nucleic acids are the most studied biomolecules for capping gold NPs, and have been used with different goals that include the colorimetric detection of duplex and triplex DNA-binding molecules [2,6], DNA methylation as an early sign of tumor cells [6], or in gold nanoparticle-assisted cancer treatment [7,8].
The optical absorption spectrum of well-dispersed gold nanoparticles is widely used in colorimetric methods because, firstly, gold hydrosols have extremely high extinction coefficients, and thus very small concentrations (at the nM scale) are enough for visual observation, and secondly, upon aggregation of AuNPs, the color change is easily detected.
In this study, we explore the interactions of dispersed gold hydrosols with the nucleobases uracil (U), cytosine (C), guanine (G), and adenine (A) along with other compounds of similar structure, such as urea, thiourea (TU), 2-thiouracil (2TU), and 4-thiouracil (4TU), see Scheme 1.
These compounds have different protonation and deprotonation sites. A considerable amount of work has been done in identifying these sites [23,24,25,26,27,28], in addition to the systematic studies examining the protomeric tautomerism of these heterocyclic compounds in their neutral and ionic forms [29,30]. Briefly, the pKa values of the protonated forms (pKa1) of urea, thiourea, and uracil are reported as 0.05; −0.90, and <0.5, respectively [24]. In line with the increased acidity of sulfur derivatives, the pKa1 values of 2TU and 4TU should be appreciably lower than that of uracil (no data were found). The pKa1 values for protonated cytosine, adenine, and guanine are, respectively, equal to 4.4, 4.1, and 3.3 [26,27,28]. Monoanion formation in the deprotonation of the neutral form of any of the compounds in Scheme 1 is not possible in acid media, that is, the ionization pKa > 7 [25,28,29,30,31]. In line with these literature data, under the experimental conditions of the present investigation, the bases of Scheme 1 are neutral or cationic species.

2. Results and Discussion

None of the compounds studied in this work absorbs in the visible region of the electromagnetic spectrum. Below 400 nm, aqueous solutions of urea or TU are transparent in the concentration range used in this work. The spectral characteristics of the compounds shown in Scheme 1 are listed in Table 1 (Figure S1 of Supplementary Information shows the spectra). The absorption band of uracil at 259 nm remains unchanged in acetic acid (1.74 mM). The substitution of an exocyclic oxygen atom by a sulfur atom in 2TU or 4TU shifts to the red the maximum wavelength absorption; thus, 2TU shows two prominent absorption peaks due to π→π* transitions, while 4TU exhibits a strong absorption band representing π→π* transition and a weaker one at shorter wavelength, 242 nm, and no changes have been observed in mild acid medium. By contrast, the spectrum of cytosine changes from neutral to mild acid medium, and two clear isosbestic points were drawn attributed to the protonation at N(3) site since the pKa1 is around 4.4. In neutral medium, adenine shows a broad band at 261 nm that, in 10.4 mM of acetic acid, λmax shifts to 263 nm, which is consistent with protonation at N(1)H+ whose equilibrium step has a pKa1 = 4.1 [27,28]. Guanine solutions were prepared from the hydrochloric salt; either in neutral or in 10.4 mM acetic acid–water solution, the spectrum shows two absorption bands, that suggest the coexistence of two tautomers. In this respect, the free energy in solution of the two tautomers with the hydrogen bound to N(7) or N(9) differs only by 1 kcal/mol and their populations are very similar [27].

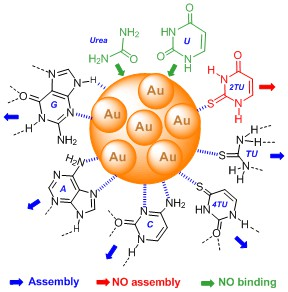
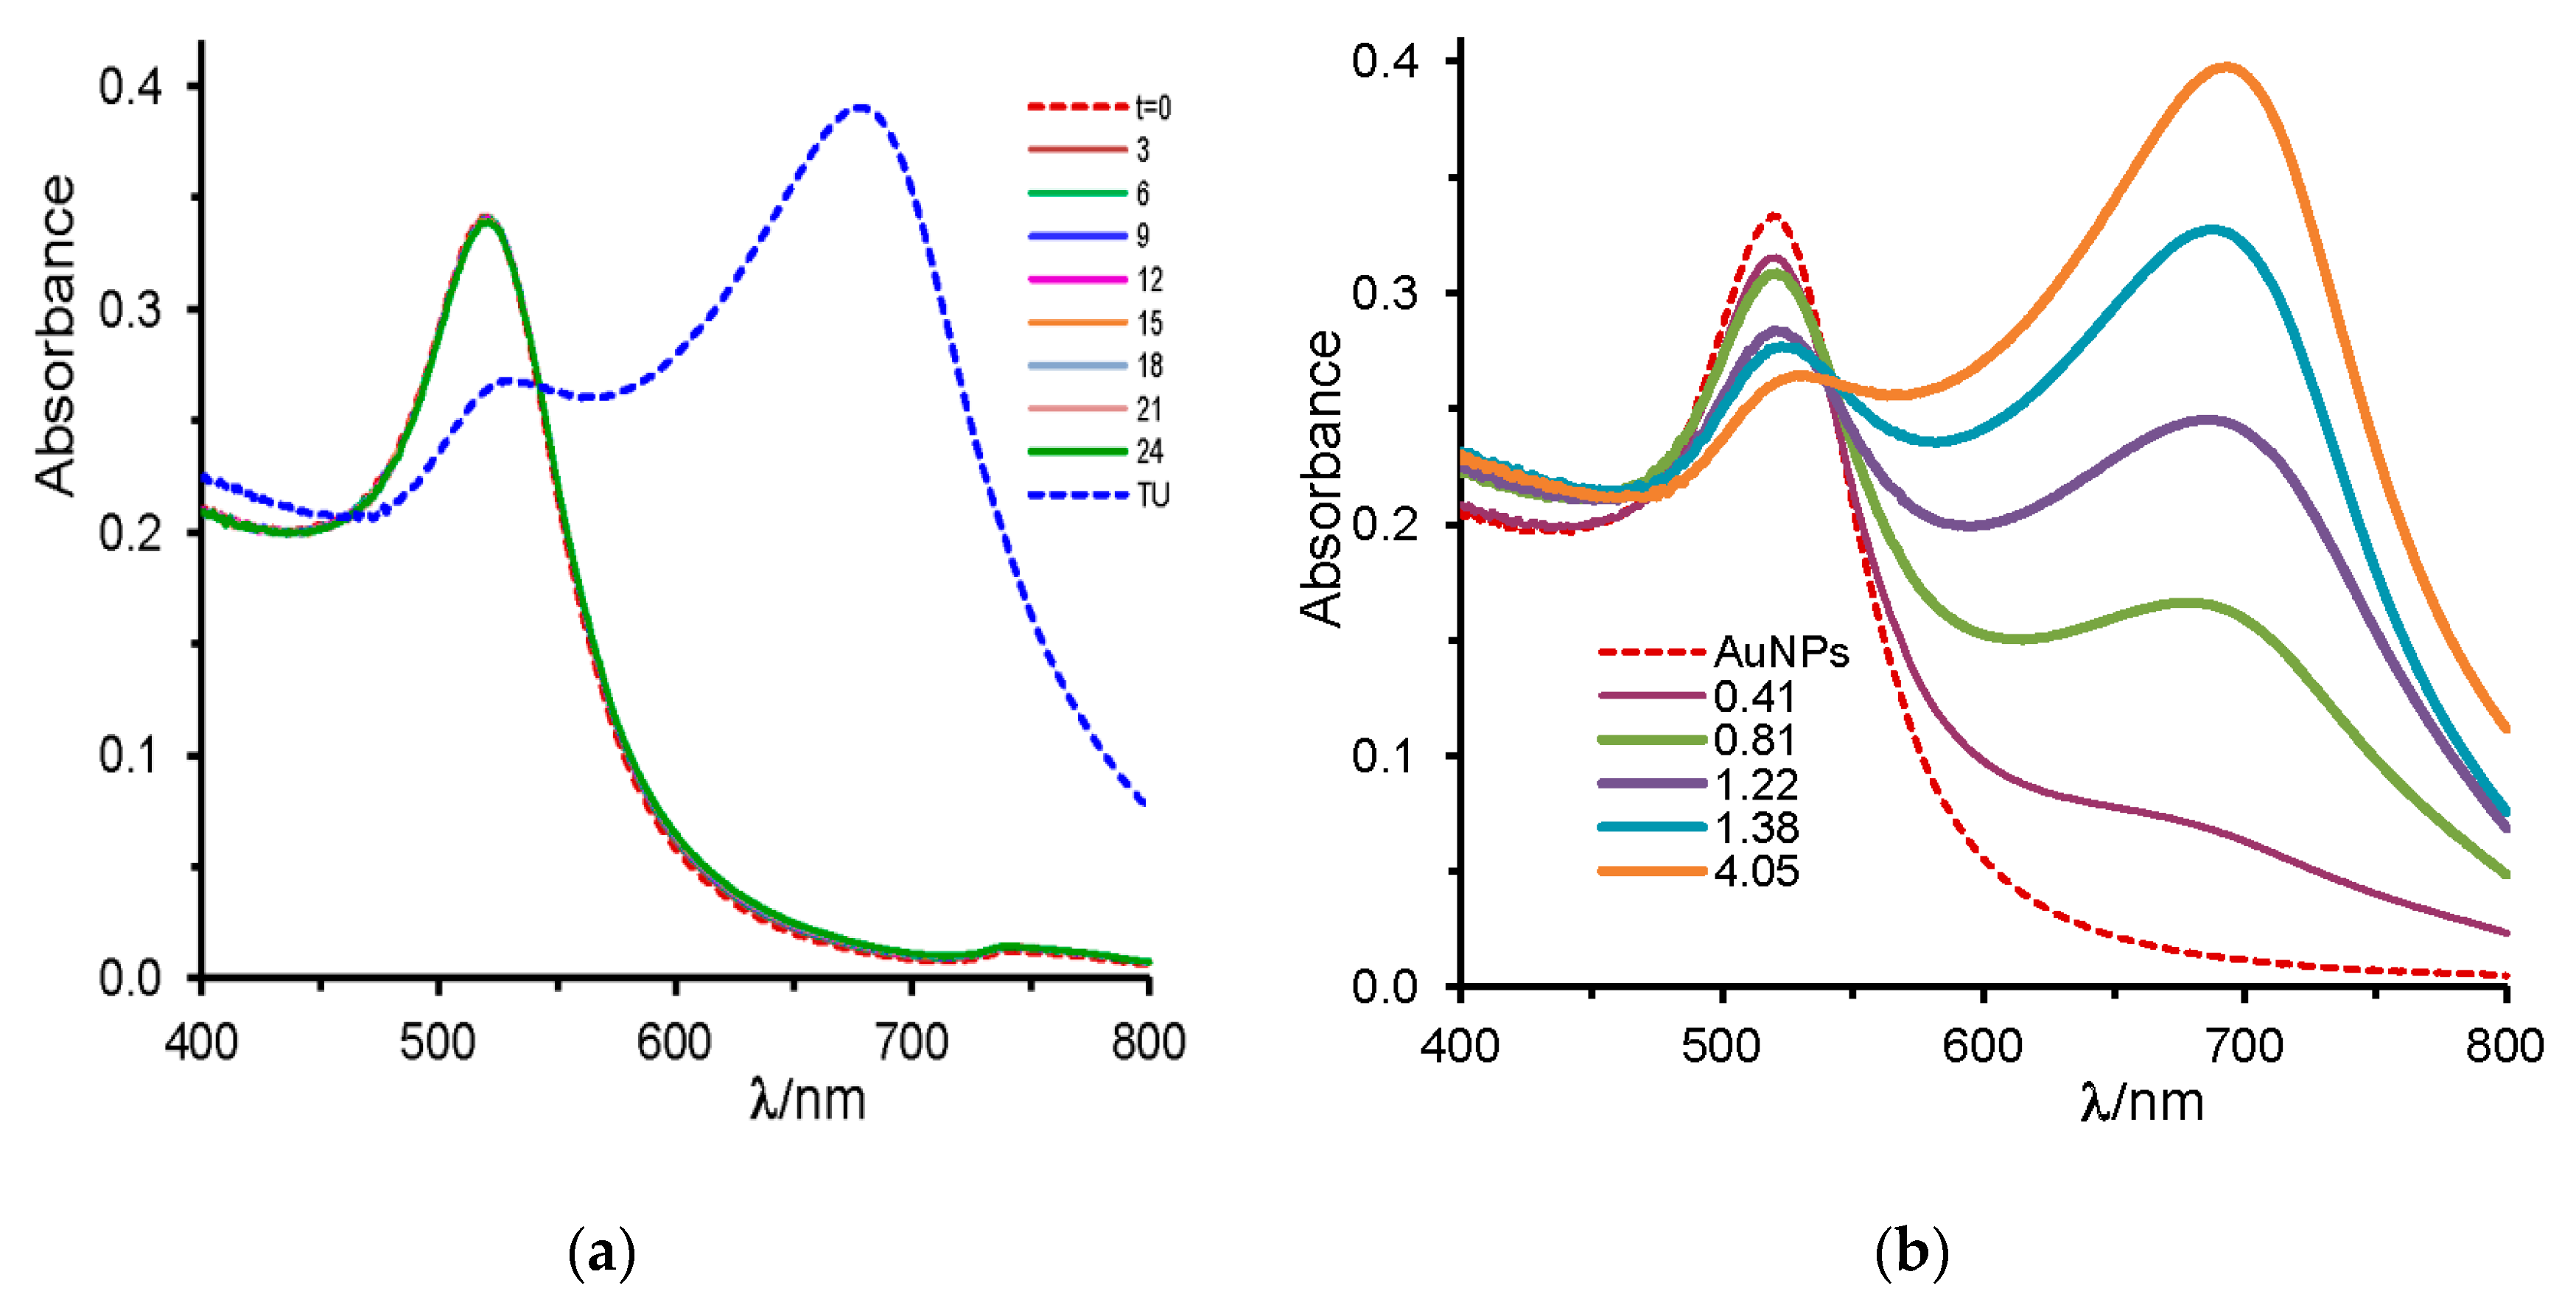
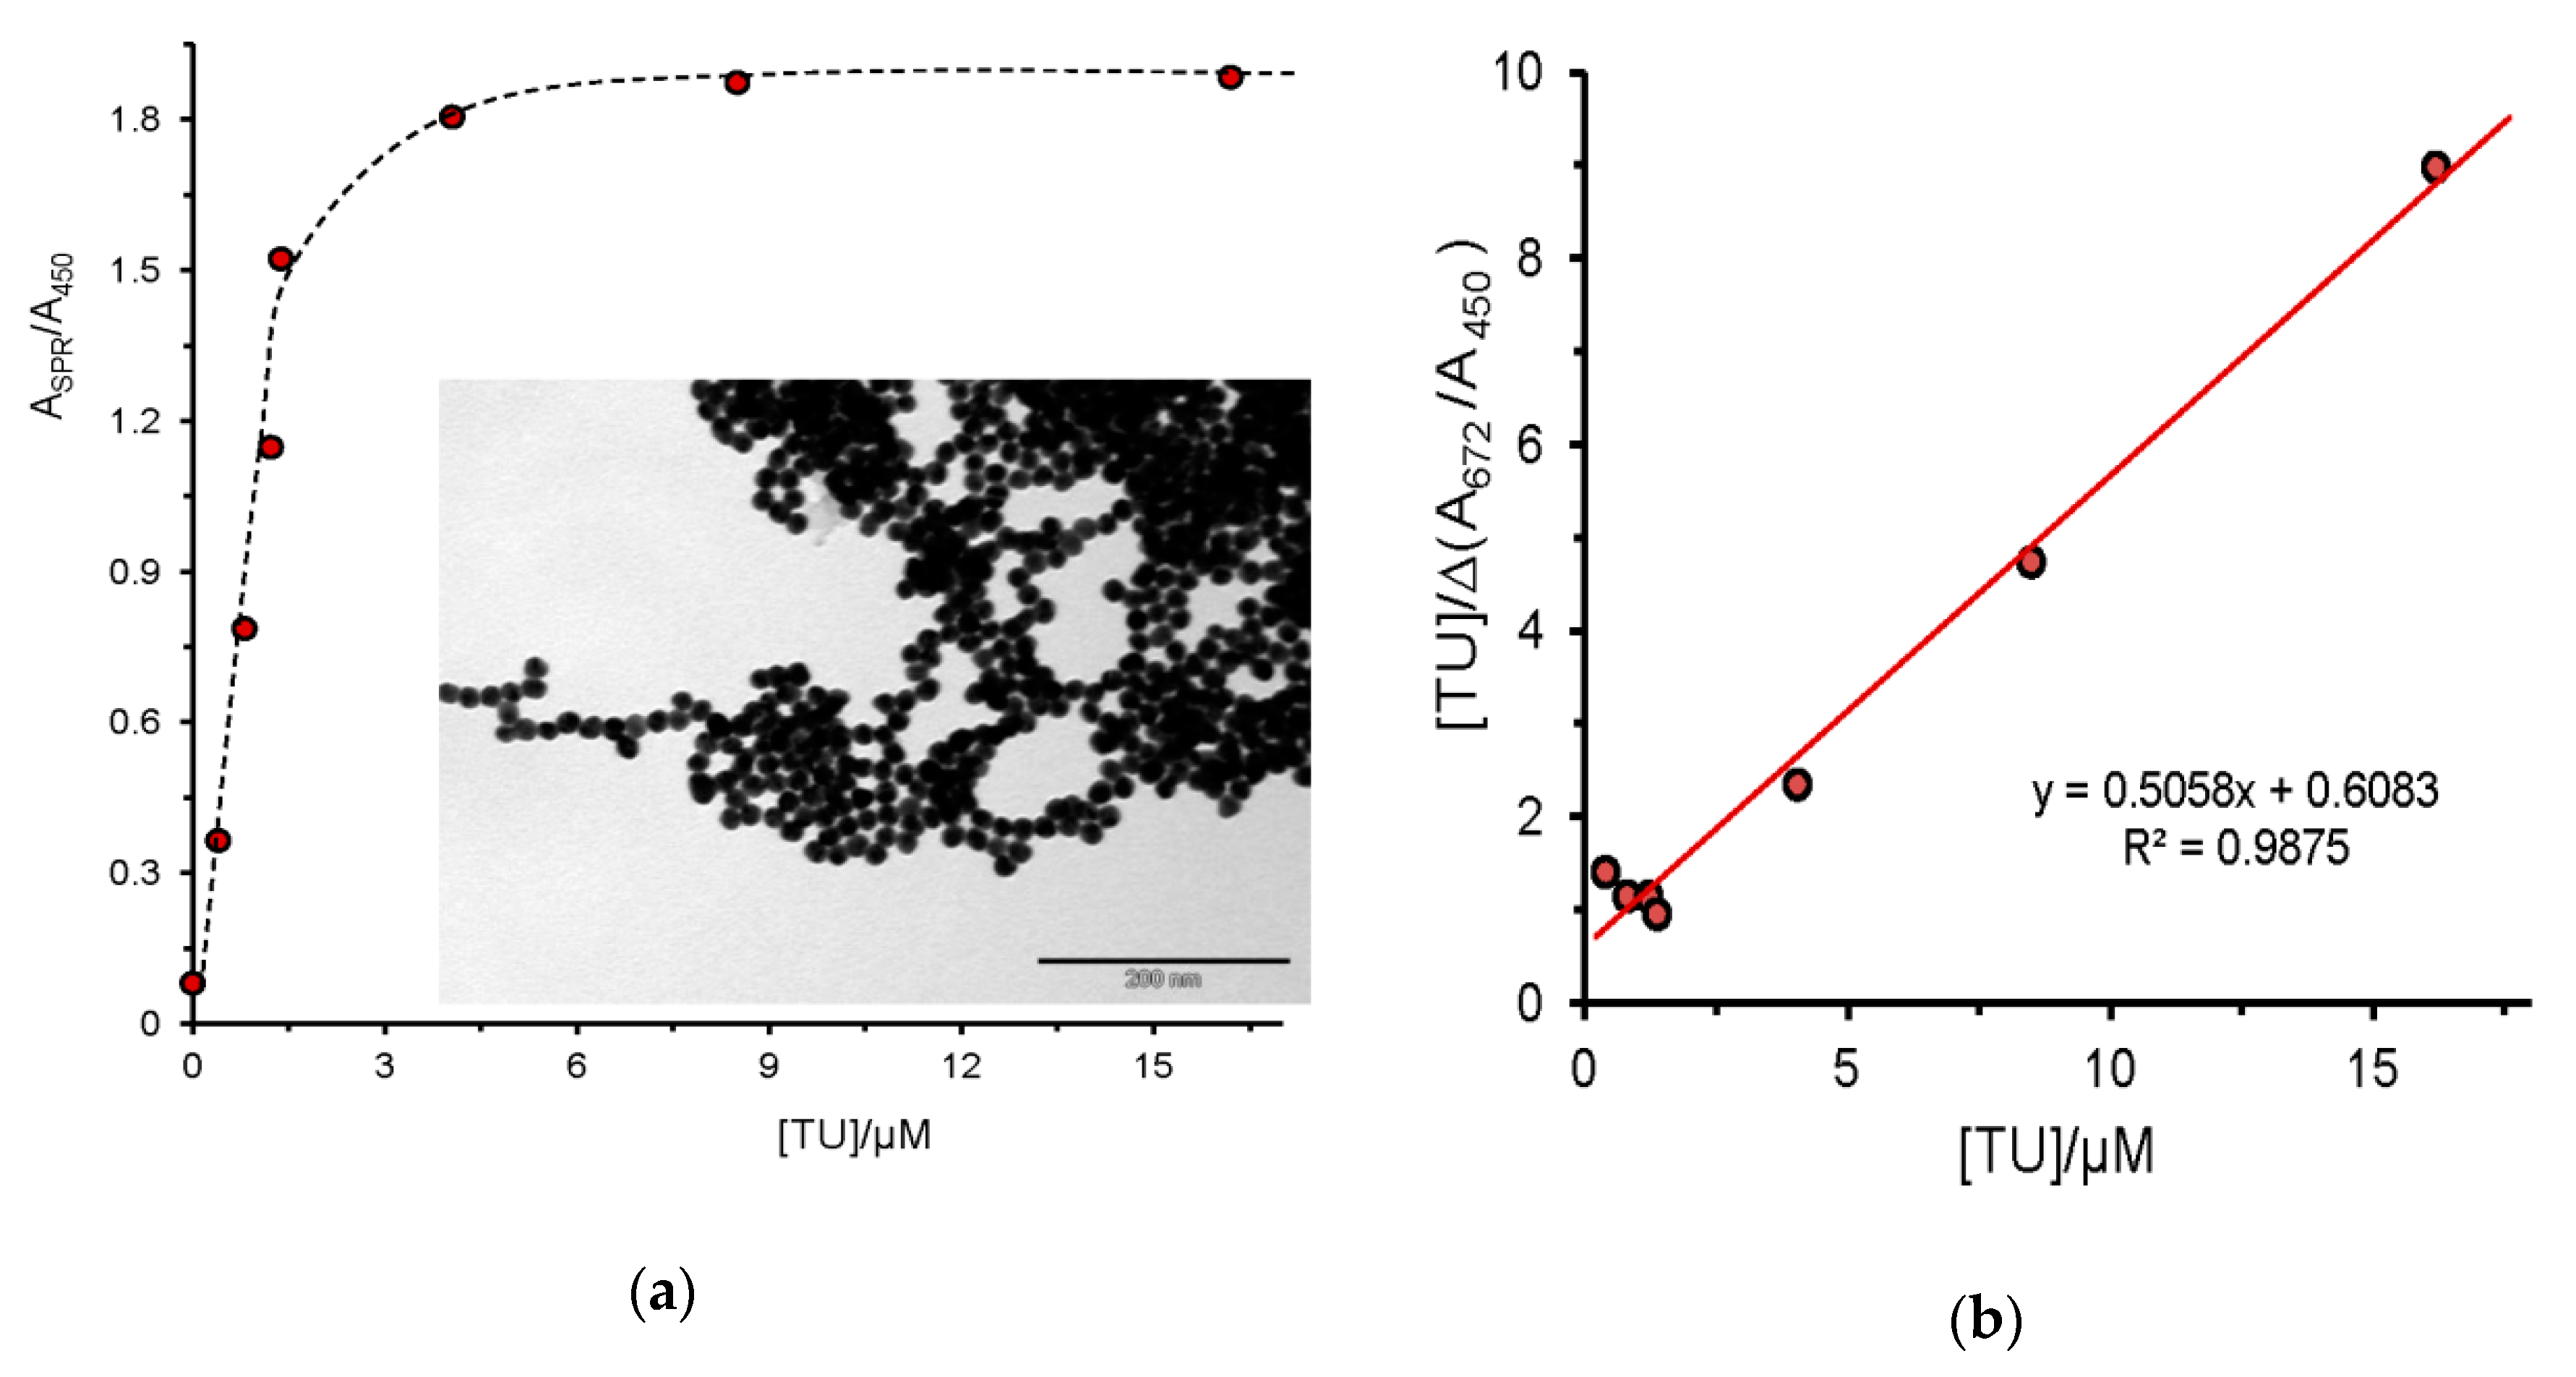
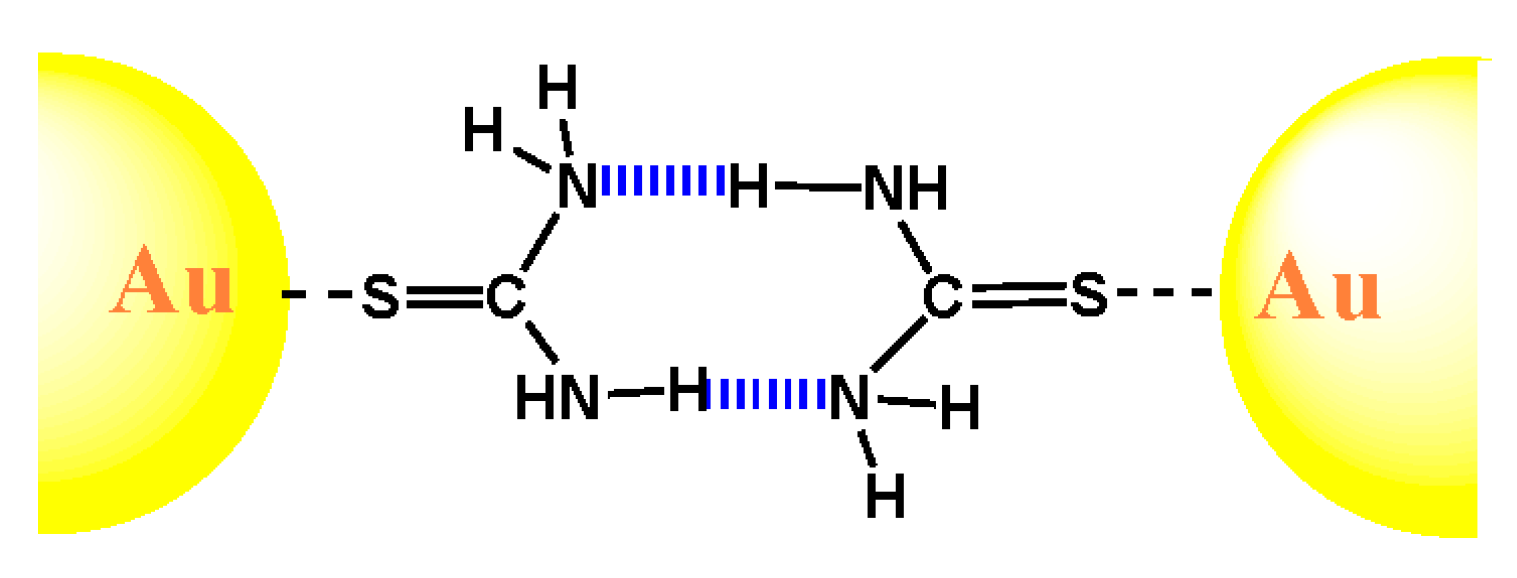
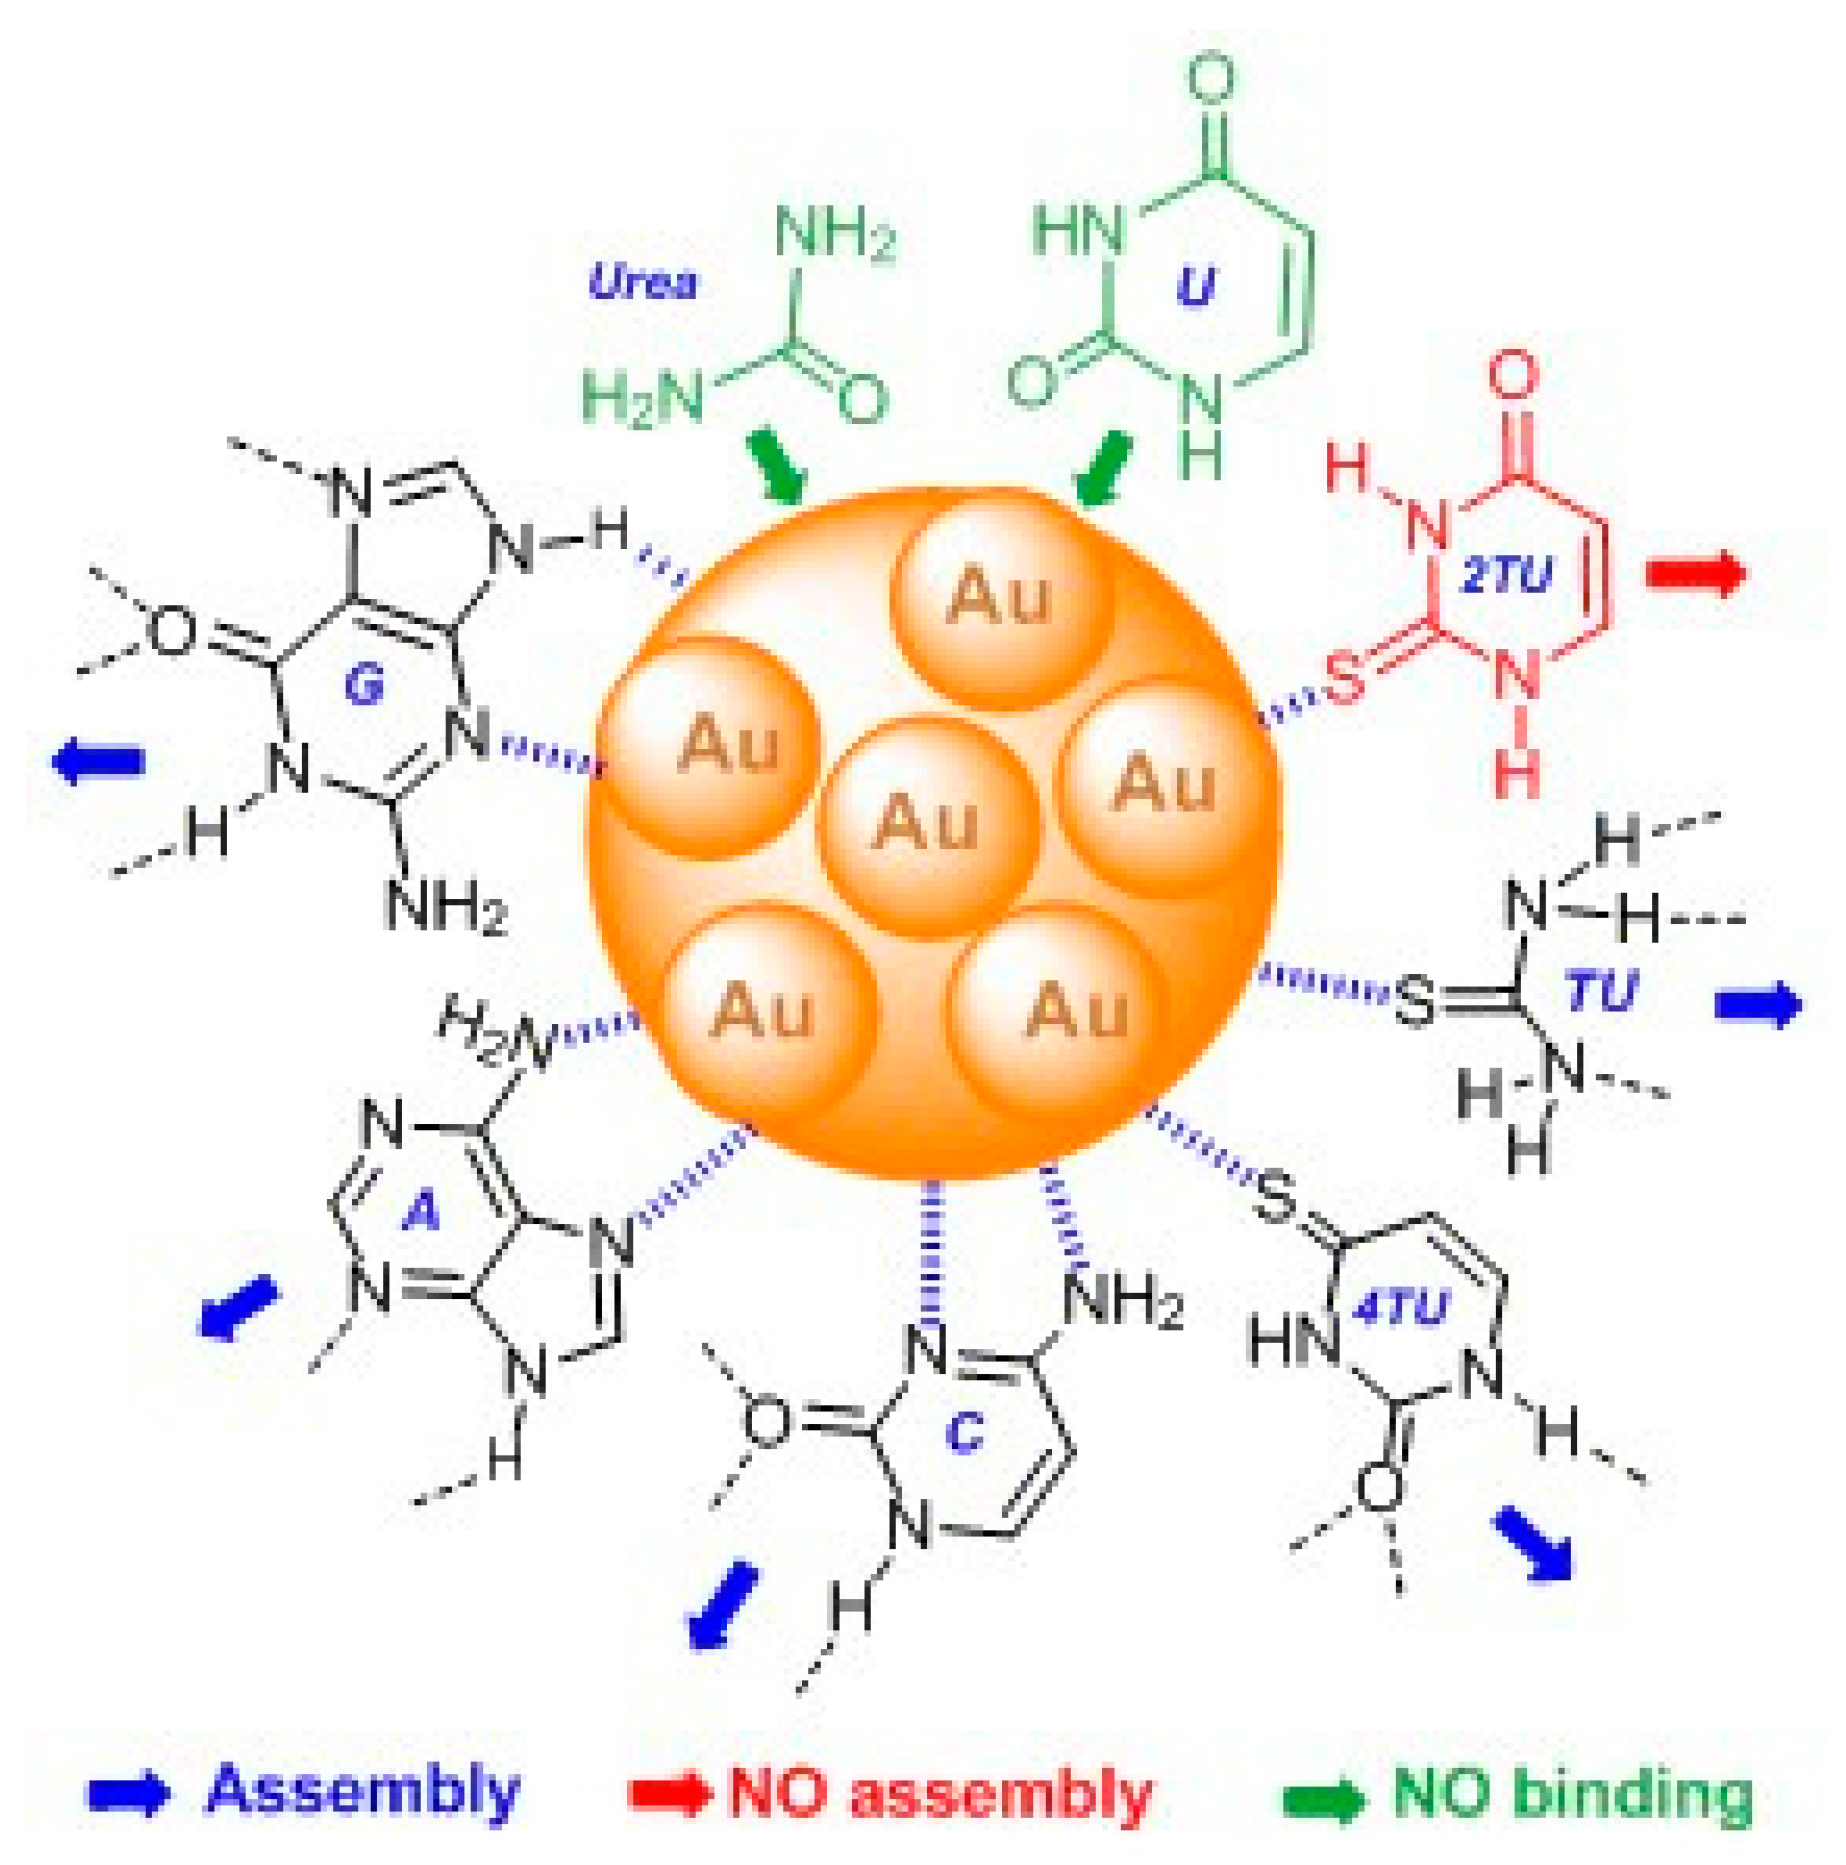
2.1. Urea and Thiourea

Addition of urea at concentration 2.5 mM to a colloidal gold solution does not induce any change on its UV–Vis spectrum, neither in neutral nor in 10 mM acetic acid (Figure 1a); the presence of 0.10 mM Mn+2 ions (MnCl2) do not affect the spectrum. By contrast, the addition of a low thiourea concentration shifts the SPR band of gold hydrosol to 680 nm, and the solution color immediately changes from red to blue. The dashed blue curve on Figure 1a was recorded just after the addition of thiourea to the urea–AuNPs mixture, and the same effect was observed in the absence or urea (Figure 1b). TU adsorbs to the gold surface by displacing the weakly adsorbed citrate molecules and promotes the aggregation of NPs. This observation evidences that the adsorption of urea over the gold surface is negligible.
A [TU] = 0.4 µM suffices to change the AuNPs spectrum; the effect increases with the TU concentration, Figure 1b. The plot of the absorbance ratio measured at 672 and 450 nm shows a strong increase with saturation level attained at approximately 4.0 µM, Figure 2a, when there are an average number of 5100 molecules of TU per nanoparticle. Taking into account the available surface of an AuNP of diameter 15.7 nm and the van der Waals radii of sulfur atoms (rvdw = 0.18 nm), one estimates near 70% coverage of gold surface by TU molecules, which can be considered as a dense packing in a monolayer. On the other hand, the small change observed at the lowest [TU] resulted strongly increased in the presence of acetic acid (see Figure S2 of SI).
In order to quantify the interaction between thiourea (TU) and AuNPs, the modified Benesi–Hildebrand equation (double reciprocal plot or the Hanes plot in enzyme kinetics) [32] in the form of Equation (1) has been used, where Re and Ro are the absorbance ratios (A672/A450) measured at the equilibrium (AuNPs/TU) and in the absence of TU, respectively. The equation works under the experimental conditions of [TU] >> [AuNPs]. Figure 2b shows the corresponding linear plot. From the fit, the average value of Kb was (8.3 ± 0.4) × 105 M−1, which corresponds to an apparent free energy value of TU chemisorption of ∆G° = −33.8 kJ·mol−1; in addition, the slope of the corresponding plot yields a value of Re = 1.977, which agrees with the experimental value. It is important to note that the λmax shift due to the presence of TU is due to two inherent processes, thiourea adsorption over the gold surface and nanoparticles aggregation; then, the obtained binding free energy corresponds to the sum of both closely related processes and, consequently, one must refer to apparent free energy.
AuNPs + TU   K b   TU · NPs   ;   [ TU ] R e R o = 1 R e ( [ TU ] + 1 K b )
The large red-shift of the SPR band induced by TU is due to AuNPs assembly, as it is shown in the corresponding TEM microgram of the insert of Figure 2a. The sulfur of TU tends to really bind to the surface of colloidal gold particles via chemisorption-type interactions; at the same time, the amine groups of TU molecule from one NP can form H-bonds with the same group of an adjacent NP. Thus, the H-bonding network can act as cross-linking agent for pairs of TU-coated AuNPs, thereby inducing their aggregation. Scheme 2 illustrates the process.

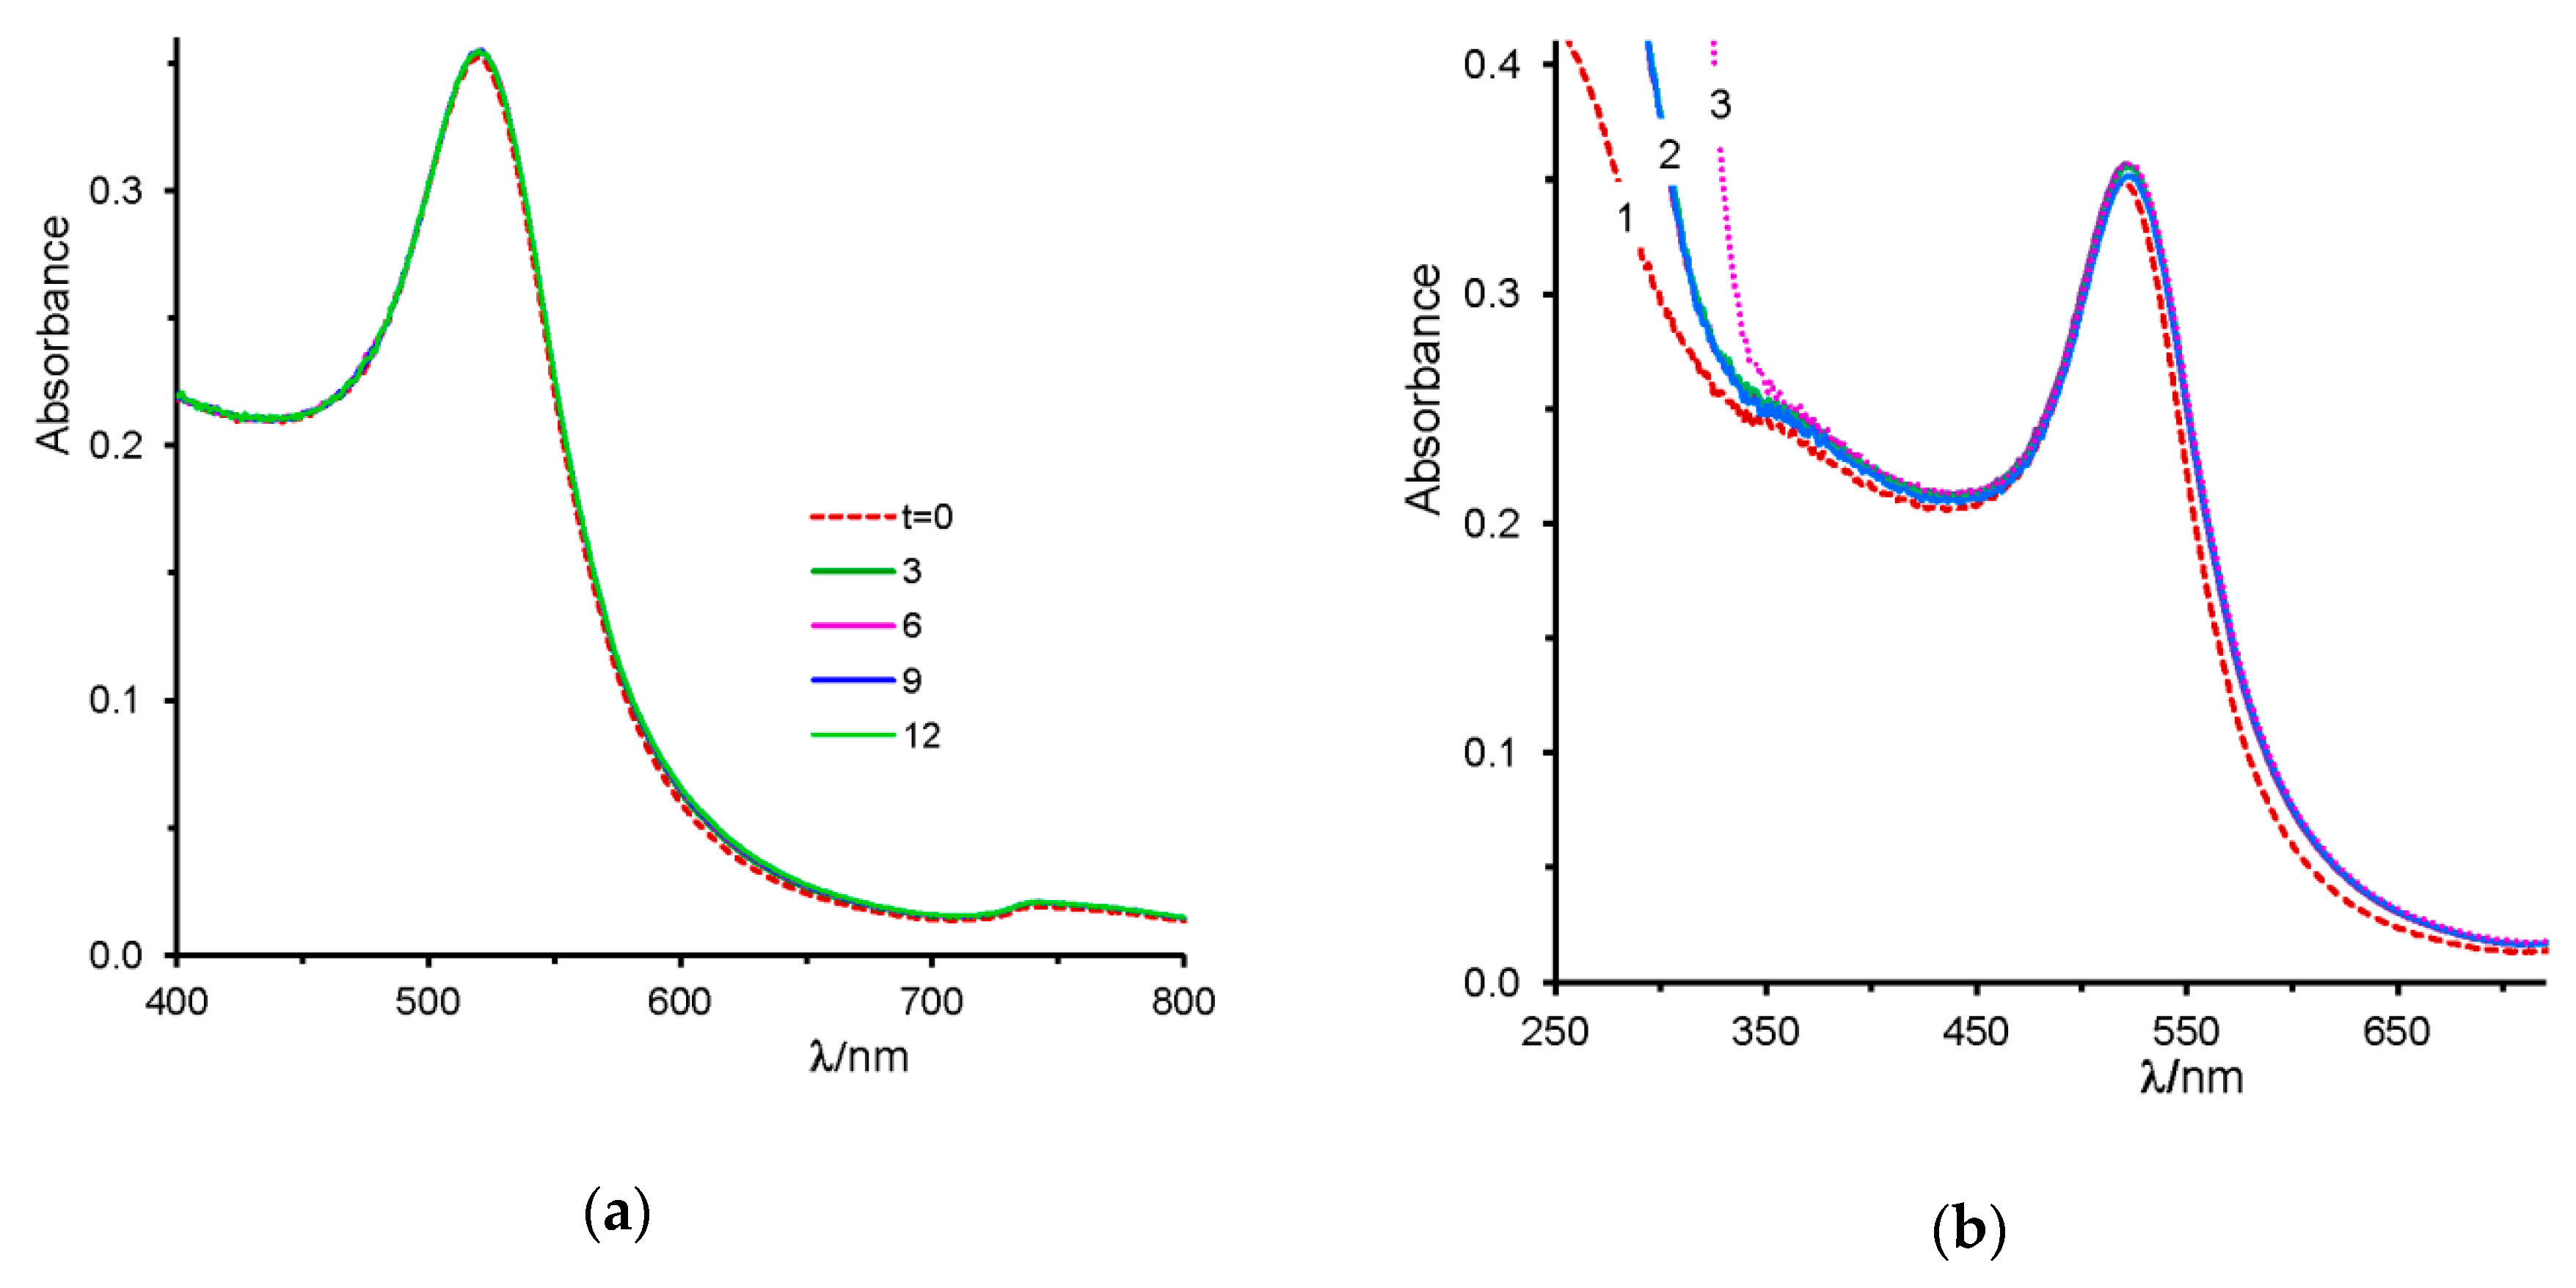
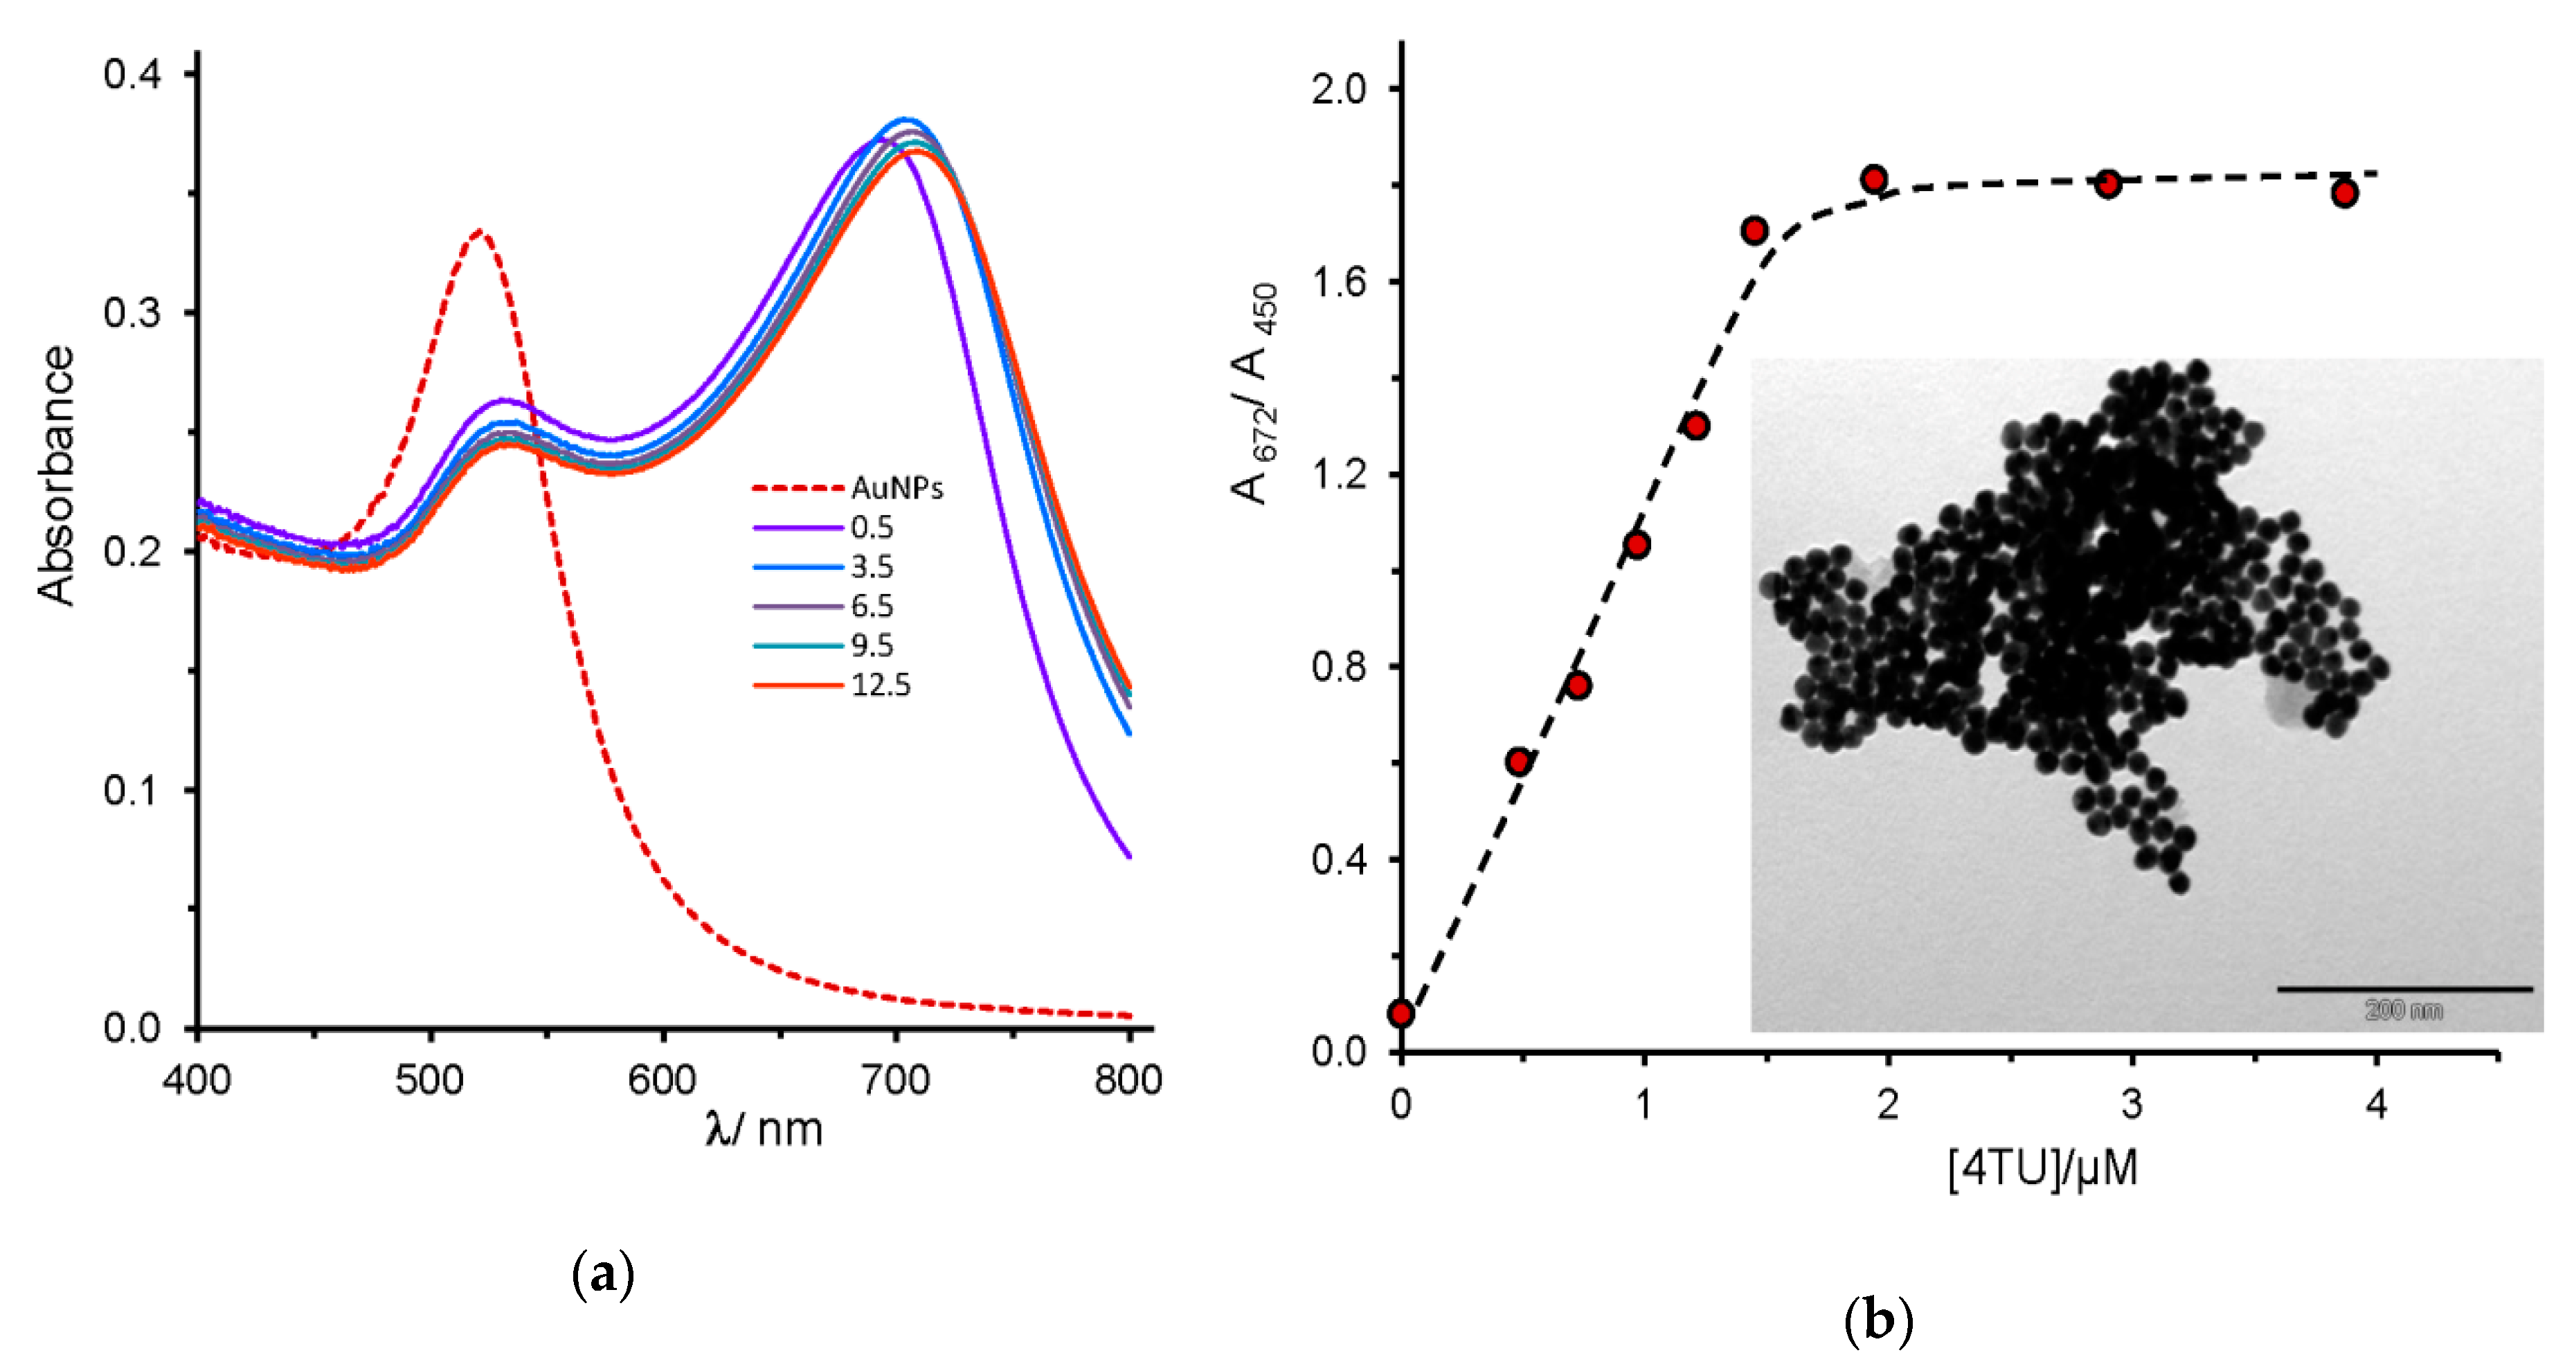
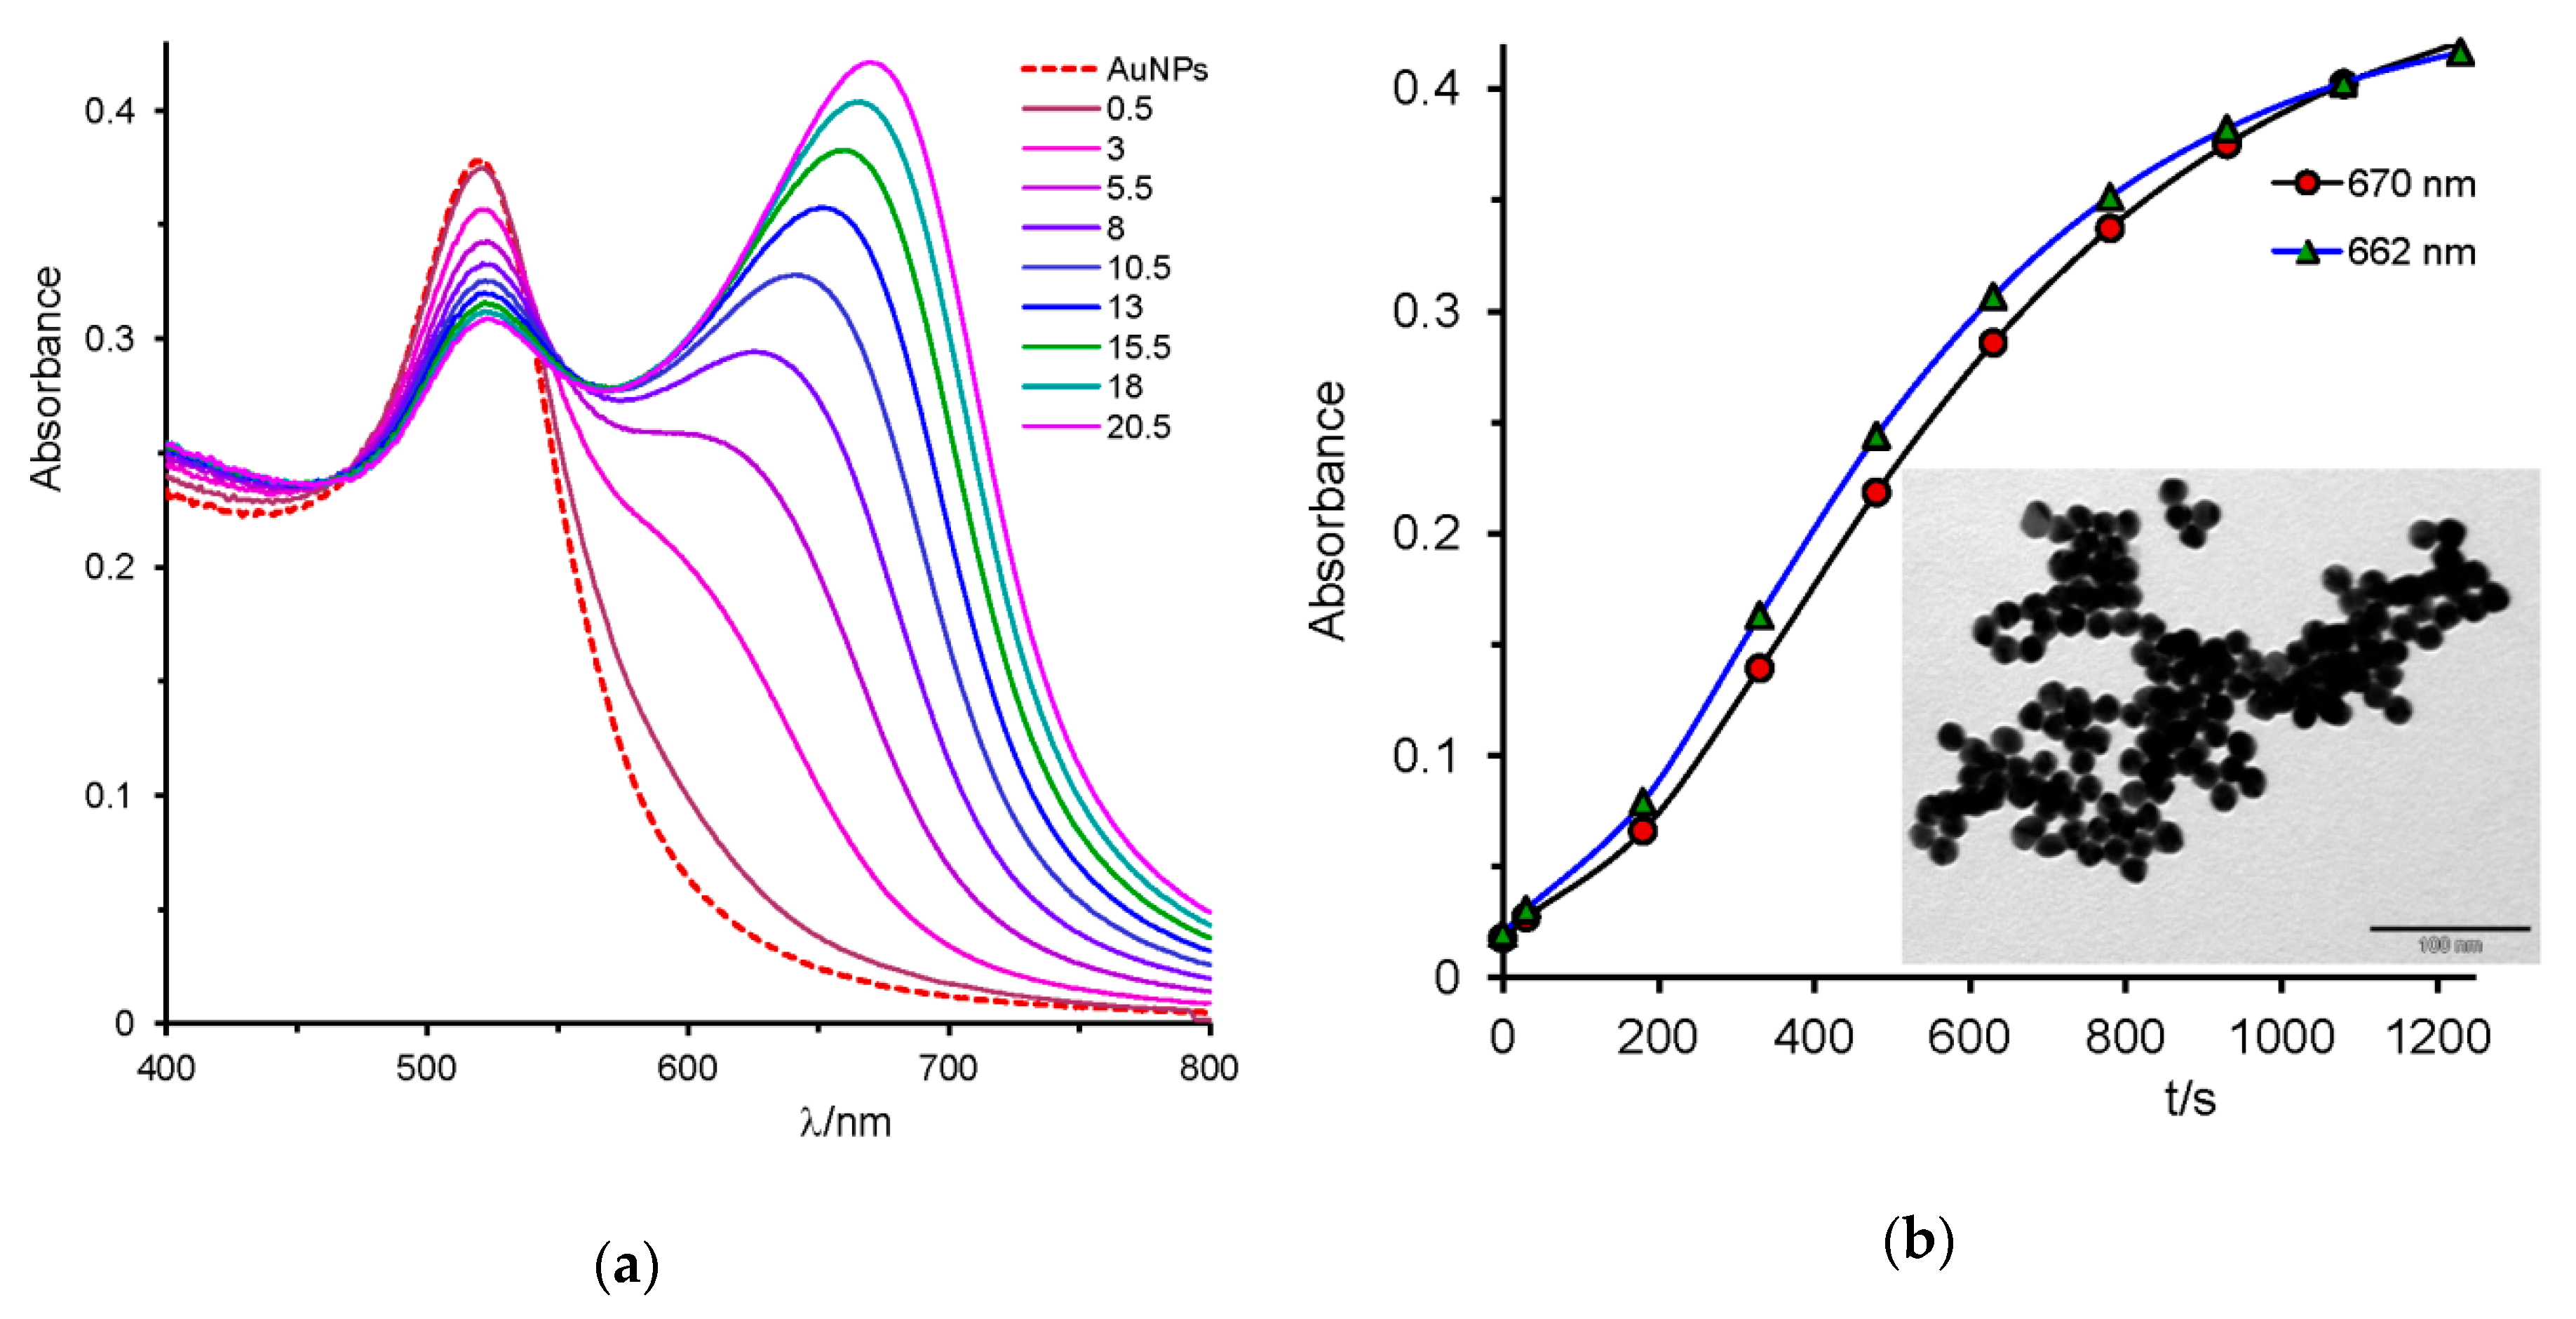
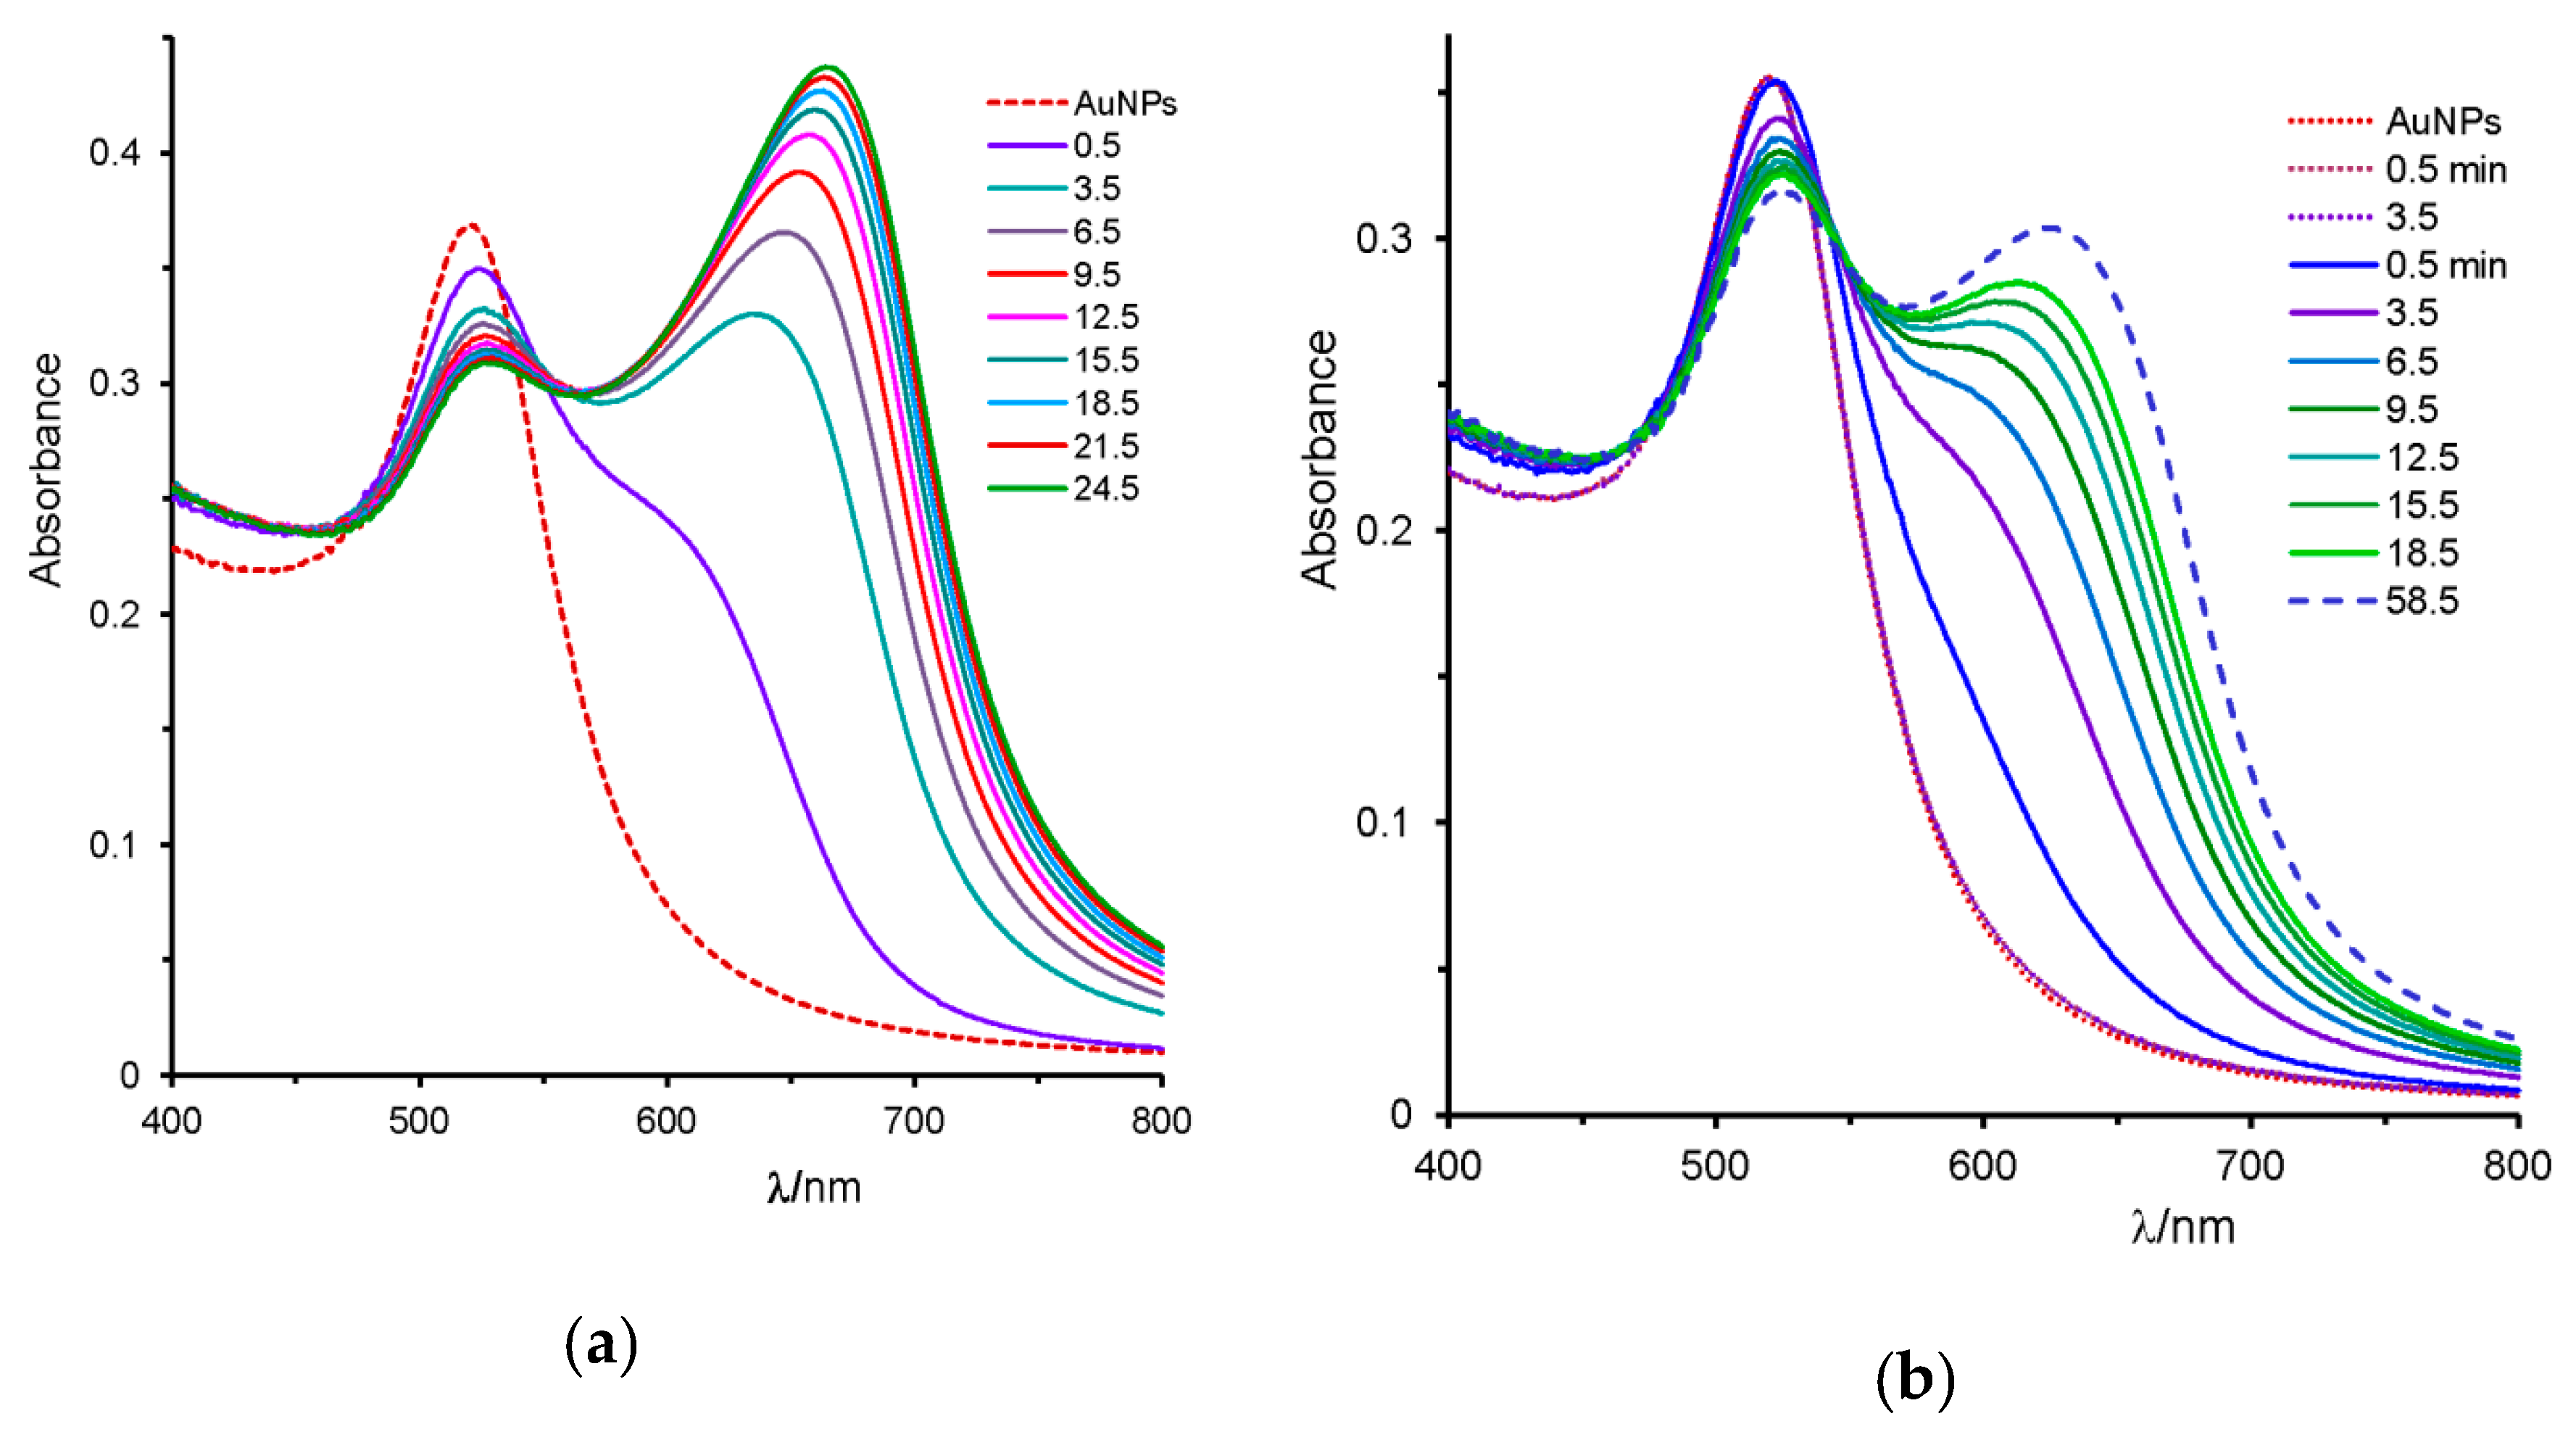
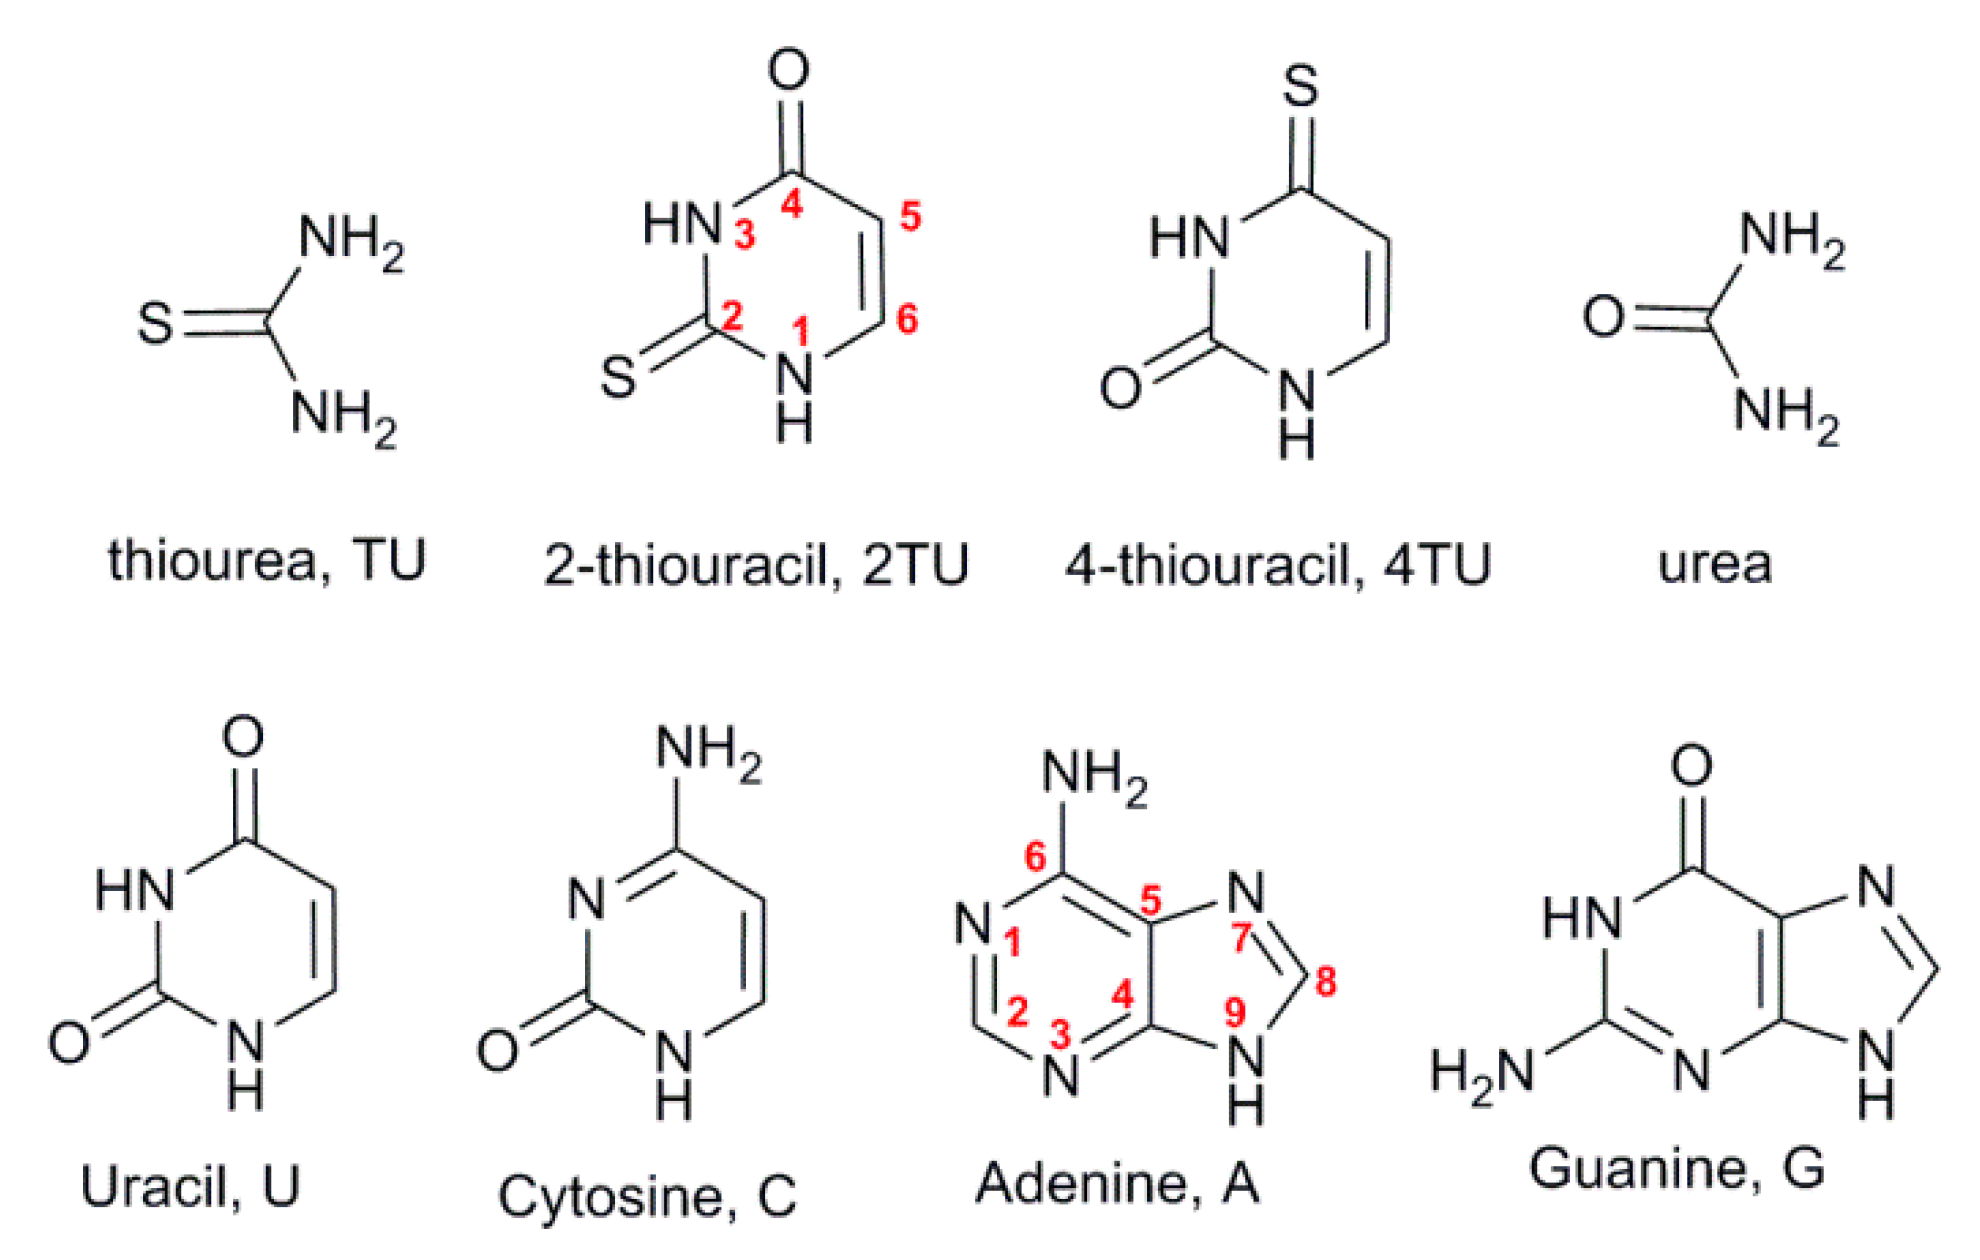
2.2. Uracil, 2-Thiouracil, and 4-Thiouracil

Figure 3a,b shows the spectra of gold nanoparticle dispersions in the presence of uracil and 2-thiouracil, respectively. The spectrum in the presence of 2TU was recorded at two concentration values, 9.34 and 156 µM, and no color change was observed, that is, the colloidal solution is stable over a wide range concentration of either U or 2TU. However, noticeable differences can clearly be appreciated: the λmax = 520 nm of the SPR band observed with uracil shifts to 523 nm in the presence of 2TU, which evidences the formation of sTable 2TU-capped gold nanoparticles. We have synthesized 2TU-functionalized AuNPs following a similar procedure to that of citrate capped gold nanoparticles, and recently these AuNPs were used in the colorimetric detection of uric acid [33]. Additional evidences in favor of the formation of 2TU-functionalized gold NPs are given in the next section.
By contrast, in the presence of 25.3 µM 4-thiouracil, the intensity of the plasmon resonance band at 520 nm suddenly decreases, and a new plasmon band at ~700 nm appears, see Figure 4a, indicating the assembly of gold nanoparticles. The SPR band red-shift was completed in less than 4 min, and subsequently starts to decrease slowly due the precipitation of NPs. The insert of Figure 4b shows the TEM image of AuNPs assembly promoted by 4TU. Like it has been observed with thiourea, increasing amounts of 4-thiouracil accelerates the NPs assembly process, as well as the extension of aggregation. Figure 4b displays the variation of the ratio of absorbance readings at 672 and 450 nm as a function of 4TU concentration. The saturation level was obtained at approximately 2 µM 4TU when the [AuNPs] = 0.845 nM, which means an average number of 2300 molecules of 4TU per nanoparticle. The theoretical maximum number of 4TU molecules attached to a nanoparticle can be estimated from the optimized structure of the 4TU molecule (see Figure S3 of SI), and its cross-section in contact with the surface of a nanoparticle. We assume the NP surface is equal to that of a sphere of diameter 15.7 nm, i.e., 770 nm2. The cross-section area of 4TU, considered as an ellipsoid, was estimated as being 0.15 nm2; then, from these figures, the theoretical full surface coverage of a nanoparticle requires 5250 molecules of 4TU. Therefore, the degree of surface coverage is estimated as 44%, which should be considered as a submonolayer.
Following the same approach as with thiourea, the fit process of the absorbance ratio values (A672/A450), determined as a function of 4TU concentration, to Equation (1) gives an average value of the binding constant of 4TU over the gold surface Kb = (11.1 ± 1.5) × 105 M−1, that is, comparable to the binding constant obtained for thiourea, a fact that indicates the same binding mode as S atoms to the gold surface, Scheme 2.
The aggregation of gold NPs due to the interparticle interaction mediated by 4TU can be stopped when 2TU is added to the sample mixture. By contrast, when 25.3 µM of 4-thiouracil (added volume 30 µL) is poured into 0.97 mL of AuNPs aqueous solution, that is, 93.9 µM in 2-thiouracil, the aggregation of AuNPs does not occur (Figure S4a). In the same manner, when 0.30 mL of 2.60 nM AuNPs is poured into 0.70 mL of an aqueous solution, that is, 93.4 μM in each compound (2-thiouracil and 4-thiouracil), the assembly of AuNPs was not observed (Figure S4b). These observations suggest that 4TU molecules adsorbed on the gold surface are not displaced by 2TU molecules, but the binding of 2TU to the gold surface is stronger than that of 4TU. The binding mode of the –C=S group, suggested in Scheme 3, clarifies the absence of AuNPs aggregation.

2.3. Cytosine, Adenine, and Guanine

These DNA bases do not have sulfur atoms; nevertheless, all the three bases mediate assembly of gold nanoparticles at micromolar concentration. The process of interparticle interactions is slower than that induced by the sulfur-containing compounds, such as thiourea or 4-thiouracil.
Cytosine is the uracil derivative in which the exocyclic oxygen is replaced by a primary amine group. As we have indicated in the previous section, we have not observed the aggregation of AuNPs mediated by uracil under different experimental conditions. On the contrary, cytosine strongly interacts with AuNPs. Figure 5a shows the evolution of the SPR band of AuNPs in the presence of 11.3 µM cytosine; the optical intensity at 520 nm slightly decreases, whereas a new plasmon band at higher wavelength increased exponentially with time. The corresponding absorbance readings at 662 or 670 nm are plotted in Figure 5b as a function of time. Good first-order kinetics were observed (the first two points taken in the absence of cytosine and at 20 s after the addition of cytosine were not included). The rate constant for the assembly process was determined as k = (2.0 ± 0.1) × 10−3 s−1 at [C] = 11.3 µM and k = (1.90 ± 0.04) × 10−3 s−1 at [C] = 5.75 µM; nevertheless, the millimolar cytosine concentration causes reactions too fast to follow by conventional methods. The presence of small quantities of acetic acid accelerates the assembly process, e.g., k = (3.75 ± 0.02) × 10−3 s−1 at [C] = 9.5 µM and [acetic acid] = 4.2 mM. In mild acid medium, cytosine may be protonated on N(3) to yield the corresponding cation (pKa1 = 4.4), which favors the interaction with the negatively charged citrate-capped gold nanoparticles.
Given that the only difference between uracil and cytosine is the amine group in the latter, this group must adsorb to the gold surface. We assumed a binding mode of the type shown in Scheme 3, where both the amine group and the N(3) are bonded to gold surface, in agreement with FTIR results by Borse et al. [8], according to them, the change of the stretching bonds C(4)–NH2 and C(4)–N(3) of cytosine are the most affected by the presence of AuNPs. Ab initio calculations, supported by spectroscopic experiments, point to metal surface adsorption via –NH2, where the N atom shows sp3 hybridization [34].
On the other hand, the presence of cytosine does not induce the aggregation of 2-thiouracil-capped gold nanoparticles; in fact, addition of 34 µM cytosine into the AuNPs solution containing 63 µM 2TU does not induce any observable effect; no spectral signature for aggregated nanoparticles was observed, and higher cytosine concentration behaves equally. However, with the addition of both nucleobases (cytosine and 2-thiouracil) in the reverse order, the aggregation process was firstly induced by cytosine and then was stopped after the addition of 2TU, but it was not reverted. This observation supports the proposed binding mode; otherwise, the NPs assembly should be reverted by 2TU if one takes into account the stronger Au–S bond than that of –N–Au, but perhaps weaker than two –N–Au bonds.
Finally, Figure 6a,b shows the representative spectra monitoring the evolution of the SPR band of gold nanoparticles upon the addition of either 1.55 µM adenine or 8.4 µM guanine, respectively. The surface plasmon resonance band of gold NPs shifts to longer wavelengths due to the aggregation of AuNPs, with maxima at 663 or 620 nm in the presence of adenine or guanine, respectively. The H-bonding interactions between the DNA bases adsorbed to the gold surface of adjacent nanoparticles and possible π−π and hydrophobic interactions can essentially decrease the interparticle distance and induce color change due to aggregation. The rate of the nanoparticle assembly process increases with the nucleobase concentration; the presence of a small concentration of either acetic acid or Mn+2 ions, under conditions of stable AuNPs, accelerates the process [21]. The increase of adenine concentration favors interparticle interactions and the aggregation process is faster (Figure S5a). The process follows first-order kinetics, with the rate constant determined for [A] = 1.55 µM as k = (2.60 ± 0.03) × 10−3 s−1, whereas with [A] = 38.8 µM, it increases to k = (5.75 ± 0.01) × 10−3 s−1, and in mild acid medium of 1.6 mM acetic acid, the process is too fast to monitor by conventional techniques.
We assumed that adenine adsorbs to the gold surface by chemisorption-type interactions through C(6)–NH2 and –N(7), i.e., by amine group and N–imidazole interactions. This orientation leaves both the N(3) and N(9)H facing outward from the nanoparticle surface, which can act as bridging linkers between one NP and another due to strong H-bonding interactions. The effect of acetic acid can be understood by considering the protonation of adenine (N(1)H+ of pKa1 ~ 4.1); the resulting cationic substrate interacts faster with the negatively charged citrate monolayer that stabilizes nanoparticles.
However, the orientation of the base adsorbed to the gold surface is still under debate; in fact, different modes with the base ring perpendicular to the metal surface, parallel, or tilted have been proposed, which can be combined with different sites of interaction; e.g., for C, N(3) nitrogen as well as the keto oxygen -C(2)=O and N(3) nitrogen, exclusively, have been proposed. [34,35,36,37].
In the same manner, the process of AuNPs aggregation mediated by guanine follows first order kinetics (Figure S5b), with rate constants equal to k = (0.385 ± 0.002) × 10−3 s−1 at [G] = 5.6 µM; k = (0.680 ± 0.006) × 10−3 s−1 at [G] = 8.4 µM, and k = (1.670 ± 0.004) × 10−3 s−1 at [G] = 8.4 µM and [Mn+2] = 0.046 mM. Clearly, guanine is much less effective than adenine or cytosine. This fact would suggest the interaction with gold surface in the mode represented by Scheme 3. This explains the efficiency of low [G] and the slower aggregation rate, because of the less feasibility of H-bonding network.
Table 2 summarizes all the observed effects upon the addition of nucleobases to a colloidal gold solution, either individually or in pairs of bases.

3. Materials and Methods

3.1. Materials

All the chemicals were of the maximum available purity and were used without further purification. Hydrogen tetrachloroaurate(III) trihydrate (HAuCl4 × 3H2O) and trisodium citrate (Na3C6H5O7·2H2O) were purchased from Alfa Aesar (Germany); uracil, cytosine, adenine, guanine, 2-thiouracil, and 4-thiouracil were Sigma products, and urea and thiourea were supplied by Merck (Madrid, Spain). The water used in all solutions was firstly deionized and subsequently distilled twice (the first distillation was over potassium permanganate).

3.2. Synthesis of AuNPs

Gold nanoparticles were prepared by reduction of 0.28 mM HAuCl4 with 1.12 mM of trisodium citrate during 20 min. Briefly 1.5 mL of a trisodium citrate solution was mixed with 50 mL of aqueous solution of hydrogen tetrachloroaurate at boiling temperature under vigorous stirring. Initially the mixture turns faintly blue, then suddenly changes into a wine-red color, indicating the formation of monodispersed citrated-capped gold nanoparticles. The transmission electron microscope (TEM) image shows that the gold NPs are nearly monodispersed and spherical in shape, with very few of triangular shape. The average size was d = 15.7 ± 1.3 nm (Figure S6). The SPR band was centered at 520 nm (A520 = 1.12 and A450 = 0.665), and the nanoparticles concentration resulted [NPs] = 2.60 nM.

3.3. Methods

UV–Visible spectra were recorded with a Kontron-Uvikon double beam spectrophotometer fitted with thermostated multicell holder. Spectra were collected over the range 200 to 800 nm using quartz cells of 1.4 mL volume. Stock solutions of the nucleobases were prepared in water. An aliquot of each of these solutions was added to the gold colloidal solution to give a total volume of 1 mL. In a typical experiment, 0.30 mL of the previously prepared AuNPs was diluted with water and the required volume of the solution base (urea, thiourea, uracil, etc.) to reach a final concentration of 0.78 nM (the citrate concentration was lower than 0.34 mM). At this concentration of NPs, the colloidal solution shows an absorption band at 520 nm (A ~ 0.35) due to SPR, which is the result of the collective oscillation of the conduction electrons across the NP as a consequence of the resonant excitation by the photons of the incident radiation.
In studying the kinetics of the evolution of the SPR band, the absorbance (A) versus time (t) were recorded and fit to the first-order integrated rate equation, A = A − (A − A0exp (−k × t). The non-linear regression analysis of A-t data gives k, A0, and A as optimizable parameters, with k being the first order rate constant and A, A0, and A, the absorbance values at times t, zero, and at the end of the reaction. All experiments were conducted at 25 °C.
The pH was measured with a Crison 2001 pH meter equipped with a GK2401B combined glass electrode and calibrated using commercial buffers of pH 4.01, 7.02, and 9.26 (Crison, Barcelona, Spain).
Transmission electron microscopy (TEM) was carried out using a JEOL JEM 1010 electron microscope operating at an acceleration voltage of 100 kV and equipped with a Mega View III camera controlled with Analysis software. Samples of TEM analysis were prepared by placing drops of gold colloidal solutions onto a carbon-coated copper grid sample holder, followed by evaporation in air at room temperature. The reported TEM images are representative on the entire grid sample.

4. Conclusions

A nonselective method for detection of nucleobases and derivatives using AuNPs was reported. The simplicity, rapidity, and high sensitivity are remarkable advantages against the classical methods, which require long manipulating time. Urea and uracil do not induce any effect in the spectral response of the AuNPs solution. The spectral signature observed with 2-thiouracil indicates the formation of sTable 2TU-capped gold nanoparticles. Contrarily, the color of the gold colloidal solution instantaneously changes from red to blue in the presence of micromolar concentrations of thiourea, 4-thiouracil, cytosine, adenine, or guanine. These bases promote the aggregation of AuNPs because of the interparticle interaction by H-bonding between the bases adsorbed to gold surface of adjacent nanoparticles. The aggregation process follows first-order kinetics and is accelerated in mild acid medium or in the presence of small amounts of manganese ions. Nevertheless, dispersed 2TU-capped gold nanoparticles are completely stable even in the presence of the other bases studied in this work. The results can be extended to applications in the field of DNA nanotechnology.

Supplementary Materials

The following are available online, Figures S1–S6, showing the spectra in aqueous neutral or acid media of nucleobases, the effect of either acetic-acid or Mn+2 ions in AuNPs self-assembly rate, as well as the effect of nucleobase concentration, and the histogram of NPs size distribution.

Author Contributions

Conceptualization; methodology; software; validation; formal analysis; investigation; resources; data curation; writing—original draft preparation; writing—review and editing; visualization; supervision; project administration; funding acquisition, E.I. All authors have read and agreed to the published version of the manuscript.

Funding

This research received no external funding.

Acknowledgments

The authors acknowledge support from Ministerio de Economía y Competitividad (Spain) through project CTQ2015-71238-R (MINECO/FEDER).

Conflicts of Interest

The authors declare no conflict of interest.

References

  1. Liu, B.; Liu, J. Interface-driven hybrid materials based on DNA-functionalized gold nanoparticles. Matter 2019, 1, 825–847. [Google Scholar] [CrossRef] [Green Version]
  2. Carnerero, J.M.; Jimenez-Ruiz, A.; Castilli, P.M.; Prado-Gotor, R. Covalent and non-covalent DNA-gold nanoparticle interactions: New avenues of research. ChemPhysChem 2017, 18, 17–33. [Google Scholar] [CrossRef] [PubMed]
  3. Montané, X.; Bajek, A.; Roszkowski, K.; Montornés, J.M.; Giamberini, M.; Roszkowski, S.; Kowalczyk, O.; Garcia-Valls, R.; Tylkowski, B. Encapsulation for Cancer Therapy. Molecules 2020, 25, 1605. [Google Scholar] [CrossRef] [PubMed] [Green Version]
  4. Jans, H.; Huo, Q. Gold nanoparticle-enabled biological and chemical detection analysis. Chem. Soc. Rev. 2012, 41, 2849–2866. [Google Scholar] [CrossRef] [PubMed]
  5. Saka, K.; Agasti, S.S.; Kim, C.; Li, X.; Rotello, V.M. Gold nanoparticles in chemical and biological sensing. Chem. Rev. 2012, 112, 2739–2779. [Google Scholar]
  6. Liu, J. Adsorption of DNA onto gold nanoparticles and grapheme oxide: Surface science and applications. Phys. Chem. Chem. Phys. 2012, 14, 10485–10496. [Google Scholar] [CrossRef] [PubMed] [Green Version]
  7. Yetisgin, A.A.; Cetinel, S.; Zuvin, M.; Kosar, A.; Kutlu, O. Therapeutic nanoparticles and their targeted delivery applications. Molecules 2020, 25, 2193. [Google Scholar] [CrossRef]
  8. Borse, S.; Joshi, S.; Khan, A. Enhanced in vitro cytotoxicity and cellular uptake of DNA bases functionalized gold nanoparticles in HeLa cell lines. RSC Adv. 2015, 5, 13402–13410. [Google Scholar] [CrossRef]
  9. Turkevich, J.; Stevenson, P.C.; Hillier, J. A study of the nucleation and growth processes in the synthesis of colloidal gold. Discuss. Faraday Soc. 1951, 11, 55–75. [Google Scholar] [CrossRef]
  10. Frens, G. Controlled nucleation for the regulation of the particle size in monodisperse gold suspensions. Discuss. Faraday Soc. 1951, 11, 55–75. [Google Scholar] [CrossRef]
  11. Kinling, J.; Maier, M.; Okenve, B.; Kotaidis, V.; Ballot, H.; Plech, A. Turkevich method for gold nanoparticle synthesis revisited. J. Phys. Chem. B 2006, 110, 15700–15707. [Google Scholar] [CrossRef] [PubMed]
  12. Kelly, K.; Coronado, E.; Zhao, L.; Schatz, G.C. The optical properties of metal nanoparticles: The influence of size, shape, and dielectric environment. J. Phys. Chem. B 2003, 107, 668–677. [Google Scholar] [CrossRef]
  13. Wiley, B.J.; Im, S.H.; Li, Z.-Y.; McLellan, J.; Siekkinen, A.R.; Xia, Y. Maneuvering the surface plasmon resonance of silver nanostructures through shape-controlled synthesis. J. Phys. Chem. B 2006, 110, 15666–15675. [Google Scholar] [CrossRef] [PubMed]
  14. Lim, I.-I.S.; Ip, W.; Crew, E.; Njoki, P.M.; Mott, D.; Zhong, C.-J.; Pan, Y.; Zhou, Z. Homocysteine-mediated reactivity and assembly of gold nanoparticles. Langmuir 2007, 23, 826–833. [Google Scholar] [CrossRef]
  15. Zhang, F.X.; Han, I.; Israel, I.B.; Daras, J.G.; Maye, M.M.; Ly, N.K.; Zhong, C.-J. Colorimetric detection of thiol-containing amino acids using gold nanoparticles. Analyst 2002, 127, 462–465. [Google Scholar] [CrossRef]
  16. Li, L.; Li, B. Sensitive colorimetric detection of cysteine using gold nanoparticles as colorimetric probes. Analyst 2009, 134, 1361–1365. [Google Scholar] [CrossRef]
  17. Hu, B.; Cao, X.; Zhang, P. Selective colorimetric detection of glutathione based on quasi-stable gold nanoparticles assembly. New J. Chem. 2013, 37, 3853–3856. [Google Scholar] [CrossRef]
  18. Basu, S.; Panigrahi, S.; Praharaj, S.; Ghosh, S.K.; Pande, S.; Jana, S.; Pal, T. Dipole–dipole plasmon interactions in self-assembly of gold organosol induced by glutathione. New J. Chem. 2006, 30, 1333–1339. [Google Scholar] [CrossRef]
  19. Filbrun, S.L.; Driskell, J.D. A fluorescence-based method to directly quantify antibodies immobilized on gold nanoparticles. Analyst 2016, 141, 3851–3857. [Google Scholar] [CrossRef]
  20. Zakaria, H.M.; Shah, A.; Konieczny, M.; Hoffmann, J.A.; Nijdam, A.J.; Reeves, M.E. Small molecule- and amino acid-induced aggregation of gold nanoparticles. Langmuir 2013, 29, 7661–7673. [Google Scholar] [CrossRef]
  21. Iglesias, E.; Prado-Gotor, R. Interaction of gold nanoparticles mediated by captopril and S-nitrosocaptopril: The effect of manganese ions in mild acid medium. Phys. Chem. Chem. Phys. 2015, 17, 644–654. [Google Scholar] [CrossRef] [PubMed]
  22. Cobley, C.M.; Chen, J.; Cho, E.C.; Wang, L.V.; Xia, Y. Gold nanostructures: A class of multifunctional materials for biomedical applications. Chem. Soc. Rev. 2011, 40, 44–56. [Google Scholar] [CrossRef] [PubMed] [Green Version]
  23. Izatt, R.M.; Christensen, J.J.; Rytting, J.H. Sizes and thermodynamic quantities associated with proton and metal ions interaction with ribonucleic acid, deoxyribonucleic acid, and their constituent bases, nucleosides, and nucleotides. Chem. Rev. 1971, 71, 439–481. [Google Scholar] [CrossRef] [PubMed]
  24. Stewart, R. Strengths or neutral organic bases. In The Proton: Applications to Organic Chemistry; Academic Press: Orlando, FL, USA, 1985; pp. 87–145. [Google Scholar]
  25. Shugar, D.; Fox, J.J. Absoption spectra and structures of 2-thiouracil derivatives as a function of pH. Bull. Soc. Chim. Belg. 1952, 61, 293–309. [Google Scholar] [CrossRef]
  26. Verdolino, V.; Cammi, R.; Munk, B.H.; Schlegel, H.B. Calculation of pKa values of nucleobases and the guanine oxidation products guanidinohydantoin and spiroiminodihydantoin using density functional theory and a polarizable continuum model. J. Phys. Chem. B 2008, 112, 16860–16873. [Google Scholar] [CrossRef]
  27. Jang, Y.H.; Goddard, W.A.; Noyes, K.T.; Sowers, L.C.; Hwang, S.; Chung, D.S. pKa Values of guanine in water: Density functional theory calculations combined with Poisson-Boltzmann continuum solvation model. J. Phys. Chem. B 2003, 107, 344–357. [Google Scholar] [CrossRef]
  28. Close, D.M. Calculated pKa’s of DNA base radical ions. J. Phys. Chem. A 2013, 117, 473–480. [Google Scholar] [CrossRef]
  29. Les, A.; Adamowicz, L. Tautomerism of 2- and 4-thiouracil. Ab initio theoretical study. J. Am. Chem. Soc. 1990, 112, 1504–1509. [Google Scholar] [CrossRef]
  30. Psoda, A.; Kazimierczuk, Z.; Shugar, D. Structure and tautomerism of the neutral and monoanionic forms of 4-thiouracil derivatives. J. Am. Chem. Soc. 1974, 96, 6832–6839. [Google Scholar] [CrossRef]
  31. Jang, Y.H.; Sowers, L.C.; Çagin, T.; Goddard, W.A. First principles calculations of pKa values for 5-substituted uracils. J. Phys. Chem. A 2001, 105, 274–280. [Google Scholar] [CrossRef]
  32. Connors, K.A. Binding constants. In Binding Constants. The Measurement of Molecular Complex Stability; John Wiley & Sons: Hoboken, NJ, USA, 1987; pp. 21–101. [Google Scholar]
  33. Bera, R.K.; Anoop, A.; Raj, C.R. Enzyme-free colorimetric assay of serum uric acid. Chem. Commun. 2011, 47, 11498–11500. [Google Scholar] [CrossRef] [PubMed]
  34. Chen, Q.; Frankel, D.J.; Richardson, N.V. Self-assembly of adenide on Cu(110) surfaces. Langmuir 2002, 18, 3219–3225. [Google Scholar] [CrossRef]
  35. Giese, B.; McNaughton, D. Surface-enhanced raman spectroscopic and density functional theory study of adenine adsorption to silver surfaces. J. Phys. Chem. B 2002, 106, 101–112. [Google Scholar] [CrossRef]
  36. Jang, N.H. The coordination chemistry of DNA nucleosides on gold nanoparticles as a probe by SERS. Bull. Koream Chem. Soc. 2002, 23, 1790–1800. [Google Scholar]
  37. Camafeita, L.E.; Sánchez-Cortés, S.; García-Ramos, J.V. SERS of guanine and its alkyl derivatives on gold sols. J. Raman Spectrosc. 1996, 27, 533–537. [Google Scholar] [CrossRef]
Scheme 1. Molecular structures of the studied compounds.
Molecules 25 02890 sch001
Figure 1. (a) Visible spectrum of 0.78 nM gold nanoparticles (AuNPs; dashed red line), and in the presence of 2.4 mM urea recorded at 3 min intervals over a 24 min period; the dashed blue line shows the spectra after adding 30 µL of thiourea solution to get [TU] = 8.1 µM; (b) effect of TU concentration (see insert: [TU] = 0.41; 0.81; 1.22; 1.38, and 4.05 μM) on the surface plasmon resonance (SPR) band of AuNPs.
Molecules 25 02890 g001
Figure 2. (a) Variation of the ratio of absorbance readings at 672 nm and 450 nm as a function of [TU], the insert shows the TEM image of AuNPs in the presence of 8.4 μM thiourea at 200 nm scale; (b) modified Benesi–Hildebrand plot for the absorbance ratio measured at A672/A450 as a function of TU concentration ([TU] = 0.4 to 16 μM).
Molecules 25 02890 g002
Scheme 2. Cartoon to illustrate the TU binding mode to a gold surface and H-bonding interactions between two adjacent nanoparticles.
Molecules 25 02890 sch002
Figure 3. Spectrum of AuNPs solution (dashed line) in the presence of (a) 0.196 mM uracil recorded over 12 min at 3 min intervals, and of (b) 9.34 µM 2-thiouracil (curve 2 repeated for six cycles at 3.5 min intervals) and 156 µM (curve 3, which matches curve 2 above 450 nm).
Molecules 25 02890 g003
Figure 4. (a) Spectrum of AuNPs dispersion (dashed line) in the presence of 25.3 µM 4-thiouracil, recorded over 12.5 min at 3 min intervals; (b) ratio of the absorbance readings at 672 and 450 nm as a function of [4TU]; dashed line to guide the eye; the insert shows the typical TEM image of 4TU-mediated assembly of AuNPs.
Molecules 25 02890 g004
Figure 5. (a) Evolution of the SPR band of gold nanoparticles in the presence of 11.3 µM cytosine recorded over 20.5 min at 2.5 min intervals (dashed spectrum is only NPs); (b) plot of the absorbance readings at (●) 670 nm and (▲) 662 nm as a function of time; the insert shown a TEM image of gold nanoparticles assembly mediated by cytosine.
Molecules 25 02890 g005
Figure 6. Evolution spectra of the SPR band of AuNPs in the presence of (a) 1.55 µM adenine recorded over 24.5 min at 3 min intervals; (dashed curve) only nanoparticles (NPs); (b) dotted curves correspond to AuNPs in the absence and in the presence of [Mn+2] = 0.046 mM after 3.5 min; solid curves were recorded at 3 min intervals after adding 8.4 µM guanine hydrochloride; and dashed curves are 40 min after the latter.
Molecules 25 02890 g006
Scheme 3. Schematic representation of the binding modes of the studied DNA bases and related compounds: Black structures represent the bases that mediate AuNPs aggregation; the red compound coats the gold surface, but does not induce aggregation, and green compounds neither bind to the gold surface nor induce NPs assembly.
Molecules 25 02890 sch003
Table 1. UV–Vis spectral characteristics of the bases dissolved in water and values of the pKa corresponding to the protonated base, BaseH +   Base + H + ,   K a 1 .
Base (a)λ1/nmƐ1/mol−1dm3s−1λ2/nmƐ2/mol−1dm3s−1pKa1
urea------------ 0.05
thiourea (TU)------------−0.90
uracil (U)259 8150------<0.5
2-thiouracil (2TU)21217,00027014,000---
4-thiouracil (4TU)242 410032819,000---
cytosine (C)268 (neutral) 7050275 (acid) (b) 9750 4.4
adenine (A)26113,200263 (acid) (c)12,900 4.1
guanine (G)246 6300276 4600 3.3
(a) the concentration of the base varies between 42 µM (4TU) and 77.6 µM (A), see Figure S1; (b) acetic acid 1.74 mM; (c)10 mM acetic acid.
Table 2. Observed effect upon addition of base 1 at the concentration value in parentheses, and subsequently base 2, on an aqueous colloidal gold solution.
Base 1 (c/μM)Base 2 (c/μM)λmax (SPR band)/nmColorEffect
urea (2500)---520red
thiourea, TU (0.4 to 8.1)---670blue+
urea (2500)thiourea, TU (8.1)670blue+
uracil, U (196)---520red
2-thiouracil, 2TU (9.34)---523redfunctionalized
4-thiouracil, 4TU (25.3)---672blue+
2TU (94)4TU (94)523red
2TU (94) + 4TU (94)AuNPs addition523redfunctionalized
cytosine, C (11.3)---670blue+
2TU (63)C (34)523red
C (34)2TU (63)red-shift--stopped
adenine, A (1.55)---663blue+
guanine, G (8.4)---620blue+

