Article

Screening of Phosphodiesterase-5 Inhibitors and Their Analogs in Dietary Supplements by Liquid Chromatography–Hybrid Ion Trap–Time of Flight Mass Spectrometry

1
Department of Pharmaceutical Analysis, College of Pharmacy, Chung-Ang University, 84 Heukseok-ro, Dongjak-gu, Seoul 06974, Korea
2
Biocomplete Co., Ltd., 272 Digital-ro, Guro-gu, Seoul 08389, Korea
3
Bioanalysis and Pharmacokinetics Study Group, Korea Institute of Toxicology, 141 Gajeong-ro, Yuseong-gu, Daejeon 34114, Korea
4
Agro-Livestock and Fishery Products Division, Busan Regional Korea Food and Drug Administration, 222 Geoje-daero, Yunje-gu, Busan 47537, Korea
5
Department of Food Science and Human Nutrition, Citrus Research and Education Center, University of Florida, 700 Experiment Station Rd, Lake Alfred, FL 33850, USA
6
Forensic Toxicology Division, National Forensic Service, 10 Ipchoon-ro, Wonju, Gangwon-do 26460, Korea
*
Author to whom correspondence should be addressed.
These authors contributed equally to this work.
Molecules 2020, 25(12), 2734; https://doi.org/10.3390/molecules25122734
Submission received: 22 May 2020 / Revised: 9 June 2020 / Accepted: 9 June 2020 / Published: 12 June 2020
(This article belongs to the Section Analytical Chemistry)

Abstract

:
An accurate and reliable method based on ion trap–time of flight mass spectrometry (IT–TOF MS) was developed for screening phosphodiesterase-5 inhibitors, including sildenafil, vardenafil, and tadalafil, and their analogs in dietary supplements. Various parameters affecting liquid chromatographic separation and IT–TOF detection were investigated, and the optimal conditions were determined. The separation was achieved on a reversed-phase column under gradient elution using acetonitrile and water containing 0.2% acetic acid at a flow rate of 0.2 mL/min. The chromatographic eluents were directly ionized in the IT–TOF system equipped with an electrospray ion source operating in the positive ion mode. The proposed screening method was validated by assessing its linearity, precision, and accuracy. Sequential tandem MS was conducted to obtain structural information of the references, and the fragmentation mechanism of each reference was proposed for providing spectral insight for newly synthesized analogs. Structural information, including accurate masses of both parent and fragment ions, was incorporated into the MSn spectral library. The developed method was successfully applied for screening adulterated dietary supplement samples.

1. Introduction

Penile erection is started from the sexual stimulation which causes the release of nitric oxide (NO) from nerves and cells in the penis. The released NO diffuses into the cells and activates guanylyl cyclase synthesizing cyclic GMP (cGMP). cGMPs, an intra-cellular second messenger, cause the smooth muscle of corpus cavernosum to relax, which in turn promotes inflow of blood, and ultimately, compression of the spongy corpus cavernosum tissue. This compression results in penile erection [1]. Phosphodiesterase type 5 (PDE-5) is a primary hydrolytic enzyme that is localized mainly in the human corpus cavernosum tissue. It plays a major biological role in the hydrolysis of cyclic guanosine monophosphate (cGMP) to 5′-GMP. PDE-5 inhibitors such as sildenafil (Viagra, Pfizer, New York, NY, USA), vardenafil (Levitra, Bayer, Leverkusen, Germany), tadalafil (Cialis, Elli Lilly, Indianapolis, IN, USA), mirodenafil (Mvix, SK Life Science, Seongnam, Republic of Korea), and udenafil (Zydena, Dong-A Pharmaceutical, Seoul, Republic of Korea) compete with cGMP for the catalytic sites composed of 16 helices and 16 loops at the C-terminal end (amino acid residues:535–860) [2] of the PDE-5 enzyme and retard the enzymatic hydrolysis of cGMP in the corpus cavernosum, which eventually leads to penile erection [1]. Thus, PDE-5 inhibitors are used for the treatment of erectile dysfunction (ED).
Patients over the age of 40 suffering from chronic diseases such as hypertension, ischemic heart disease, depression, diabetes, and atherosclerosis commonly complain of ED as a complication [1]. However, the drugs for the treatment of these chronic diseases, such as nitroglycerin, doxazosin, and terazosin, interact negatively with PDE-5 inhibitors [3]. This negative aspect of synthetic PDE-5 inhibitors has triggered the development of herbal alternatives. Thus, herbal therapies have successfully captured the market because most people believe that they are safe from adverse effects, and they can be purchased without any prescription [3,4,5]. However, taking advantage of the recognition that natural products are safe, illegally adding synthetic PDE-5 inhibitors and their analogs to herbal dietary supplements or making counterfeit drugs began to be distributed [6,7,8,9,10,11,12]. Since the detection of the first sildenafil analog, homosildenafil, in dietary supplements, the number of analogs has steadily increased owing to various structural modifications of the original drugs [5,6].
As the structure of these analogs is similar to that of the original drugs, their pharmacological effects are similar to those of the final developed drugs except for their potency, side effects, and toxicity. Therefore, the adulterated analogs in dietary supplements may pose significant pharmacological and toxicological risks such as headaches, dyspepsia, myalgia, flushing, dizziness, and abnormal vision [5,13]. For example, hongdenafil analogs cause visual disturbances even in low doses because hongdenafil lacks PDE-5/PDE-6 selectivity [5,14,15]. In addition, aminotadalafil has a reactive hydrazone group that permanently inhibits the enzymes [5,14]. Therefore, undeclared PDE-5 inhibitors and their analogs in dietary supplements threaten public health.
The analytical methods for determining undeclared PDE-5 inhibitors and their analogs in dietary supplements need to be developed for public health safety and regulation. In this regard, various spectrometric and chromatographic methods have been adopted to analyze the illegally added drugs in complex matrices [3,4,5,9,16,17,18,19,20,21,22,23,24,25,26,27,28,29]. High-performance liquid chromatography with diode array detection (HPLC–DAD) and liquid chromatography with mass spectrometry (LC–MS) have been previously used to detect PDE-5 inhibitors and their analogs [3,5,7,8,9,10,16,17,20,21,22,23,24,25,26,27,28,29,30,31,32,33,34]. When the standards of PDE-5 inhibitors and their analogs are available, HPLC with a UV spectrometer is a simple method for quantitative analysis [11]. In HPLC–DAD, the analytes can be identified by comparing the UV spectra of the reference compounds and analytes of interest [3,10,17,33]. In this context, MS has attracted considerable interest for both qualitative and quantitative analysis. Particularly in quantitative analysis, multiple reaction monitoring (MRM) in triple quadrupole mass spectrometry (QqQ MS) shows unique selectivity with high sensitivity. Thus, QqQ MS is usually used to detect analytes in complex matrices using MRM with a unique ion transition of the analytes [16,20,22,32]. Although DAD provides the UV spectra of certain compounds identified in a given chromatogram, there are no authentic UV spectra of newly synthesized PDE-5 inhibitors. Further, QqQ MS can only be used for the quantitative analysis of known compounds and not for screening purposes. Therefore, other spectroscopic methods such as high-resolution mass spectrometry (HRMS) based on Fourier transform ion cyclotron resonance (FT-ICR) [31], time of flight (TOF) [24,25,28,29,33], orbitrap [8,12,26,27], and nuclear magnetic resonance spectrometry [4,6,7,9,30,34,35,36,37,38] must be applied to clarify the structure of the analytes. In particular, hybrid ion trap (IT)–HRMS, including IT–TOF and Orbitraps (LTQ–Orbitrap and Orbitrap Fusions), is one of the most effective tools for screening and identification of unknown compounds owing to its high-resolution and multistage tandem MS (MSn) ability. The MSn ability of the IT–HRMS provides more structural information than does QqQ MS by sequential trapping and fragmentation of the precursor ion, and accurate masses of both parent and fragment ions can be obtained by HRMS for further conversion into elemental composition.
In this study, we developed a screening method for adulterated PDE-5 inhibitors and their analogs in dietary supplements by using HPLC coupled to IT–TOF MS. The HPLC separation conditions such as mobile phase and gradient, and MS parameters were optimized for the best chromatographic resolution and for obtaining tandem MS spectra with rich information about the parent and fragment ions. In addition, a spectral library for 38 PDE-5 inhibitors and their analogs was built using the high-resolution tandem MS spectra obtained in this study. The developed method was applied to dietary supplements that were adulterated with PDE-5 inhibitors and their analogs. We could successfully identify the illegally fortified PDE-5 inhibitors using the spectral library.

2. Results and Discussion

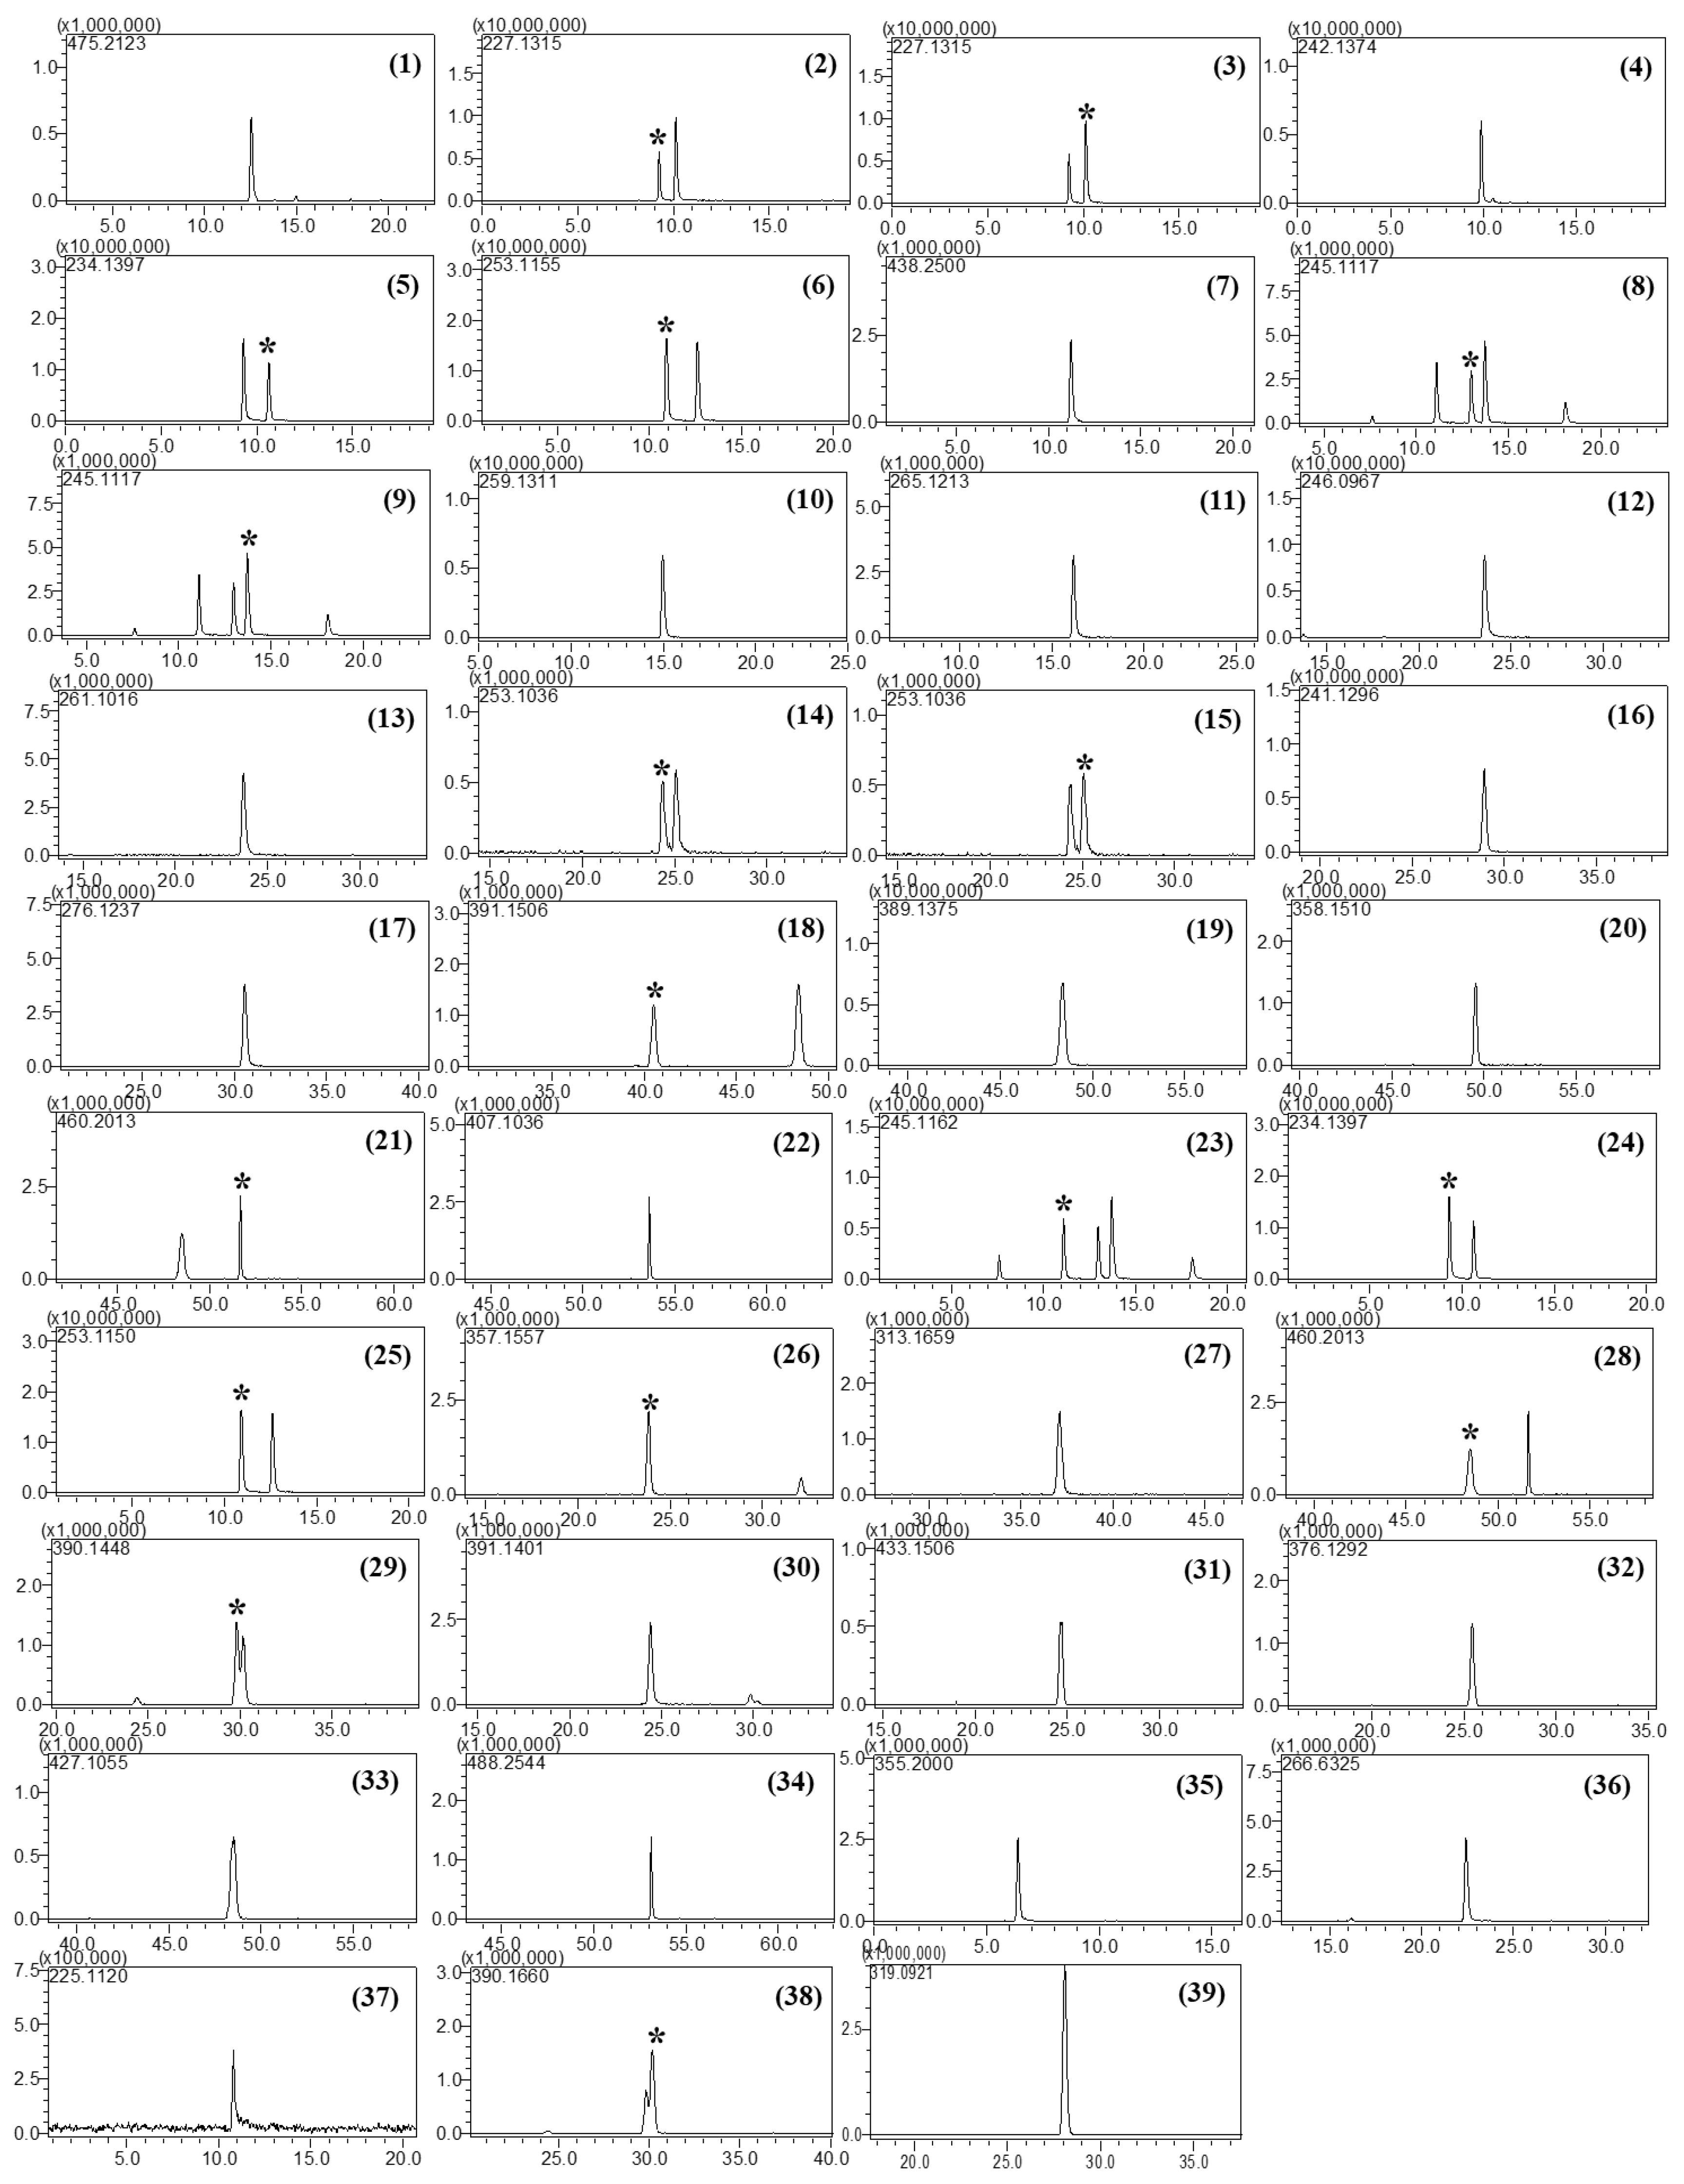
2.1. HPLC–MS Method Development

As the selected precursor ions for MSn analysis are isolated and undergo collision-induced dissociation (CID) in IT MS, wherein the analysis is performed at the unit mass resolution, chromatographic separation is prerequisite for the simultaneous qualification of isobaric compounds. In this study, different stationary phases were tested to optimize the separation of isobaric compounds from mixtures of 38 standards of PDE-5 inhibitors and their analogs. The separation of isobaric compounds among three different stationary phases was compared. The Capcell PAK C18 column showed the best chromatographic separation performance and was hence selected for LC–MS analysis.
Various mobile phase additives, including formic acid, acetic acid, ammonium formate, and ammonium acetate, were investigated for the separation of isobaric compounds. Although formic acid, ammonium formate, and ammonium acetate showed better separation than acetic acid, they negatively affected the MS sensitivity. Sensitivity, which is mainly affected by the ionization conditions, is imperative for the identification of unknown compounds in MSn analysis. Thus, acetic acid was chosen as the mobile phase additive to improve the MS sensitivity. Between two different concentrations (0.1% and 0.2%) of acetic acid, 0.2% acetic acid gave better separation efficiency. Considering the ionization efficiency and chromatographic separation of isobaric compounds, acetic acid at a concentration of 0.2% (v/v) was selected as the mobile phase additive.
Furthermore, the column temperature was a critical factor that affected the separation of isobaric compounds in this study. Five different temperatures (30, 35, 40, 45, and 50 °C) were tested, and the best separation was achieved at 50 °C. No attempt was made to increase the column temperature above 50 °C as doing so could damage the column. Although some compounds such as tadalafil and xanthoanthrafil did not show baseline separation under the given chromatographic conditions, they could be distinguished by their accurate masses. Accordingly, a temperature of 50 °C was selected for LC–MS analysis. The retention times and mass errors of all analytes are listed in Table 1, and the extracted ion chromatograms are depicted in Figure 1.

2.2. Method Validation
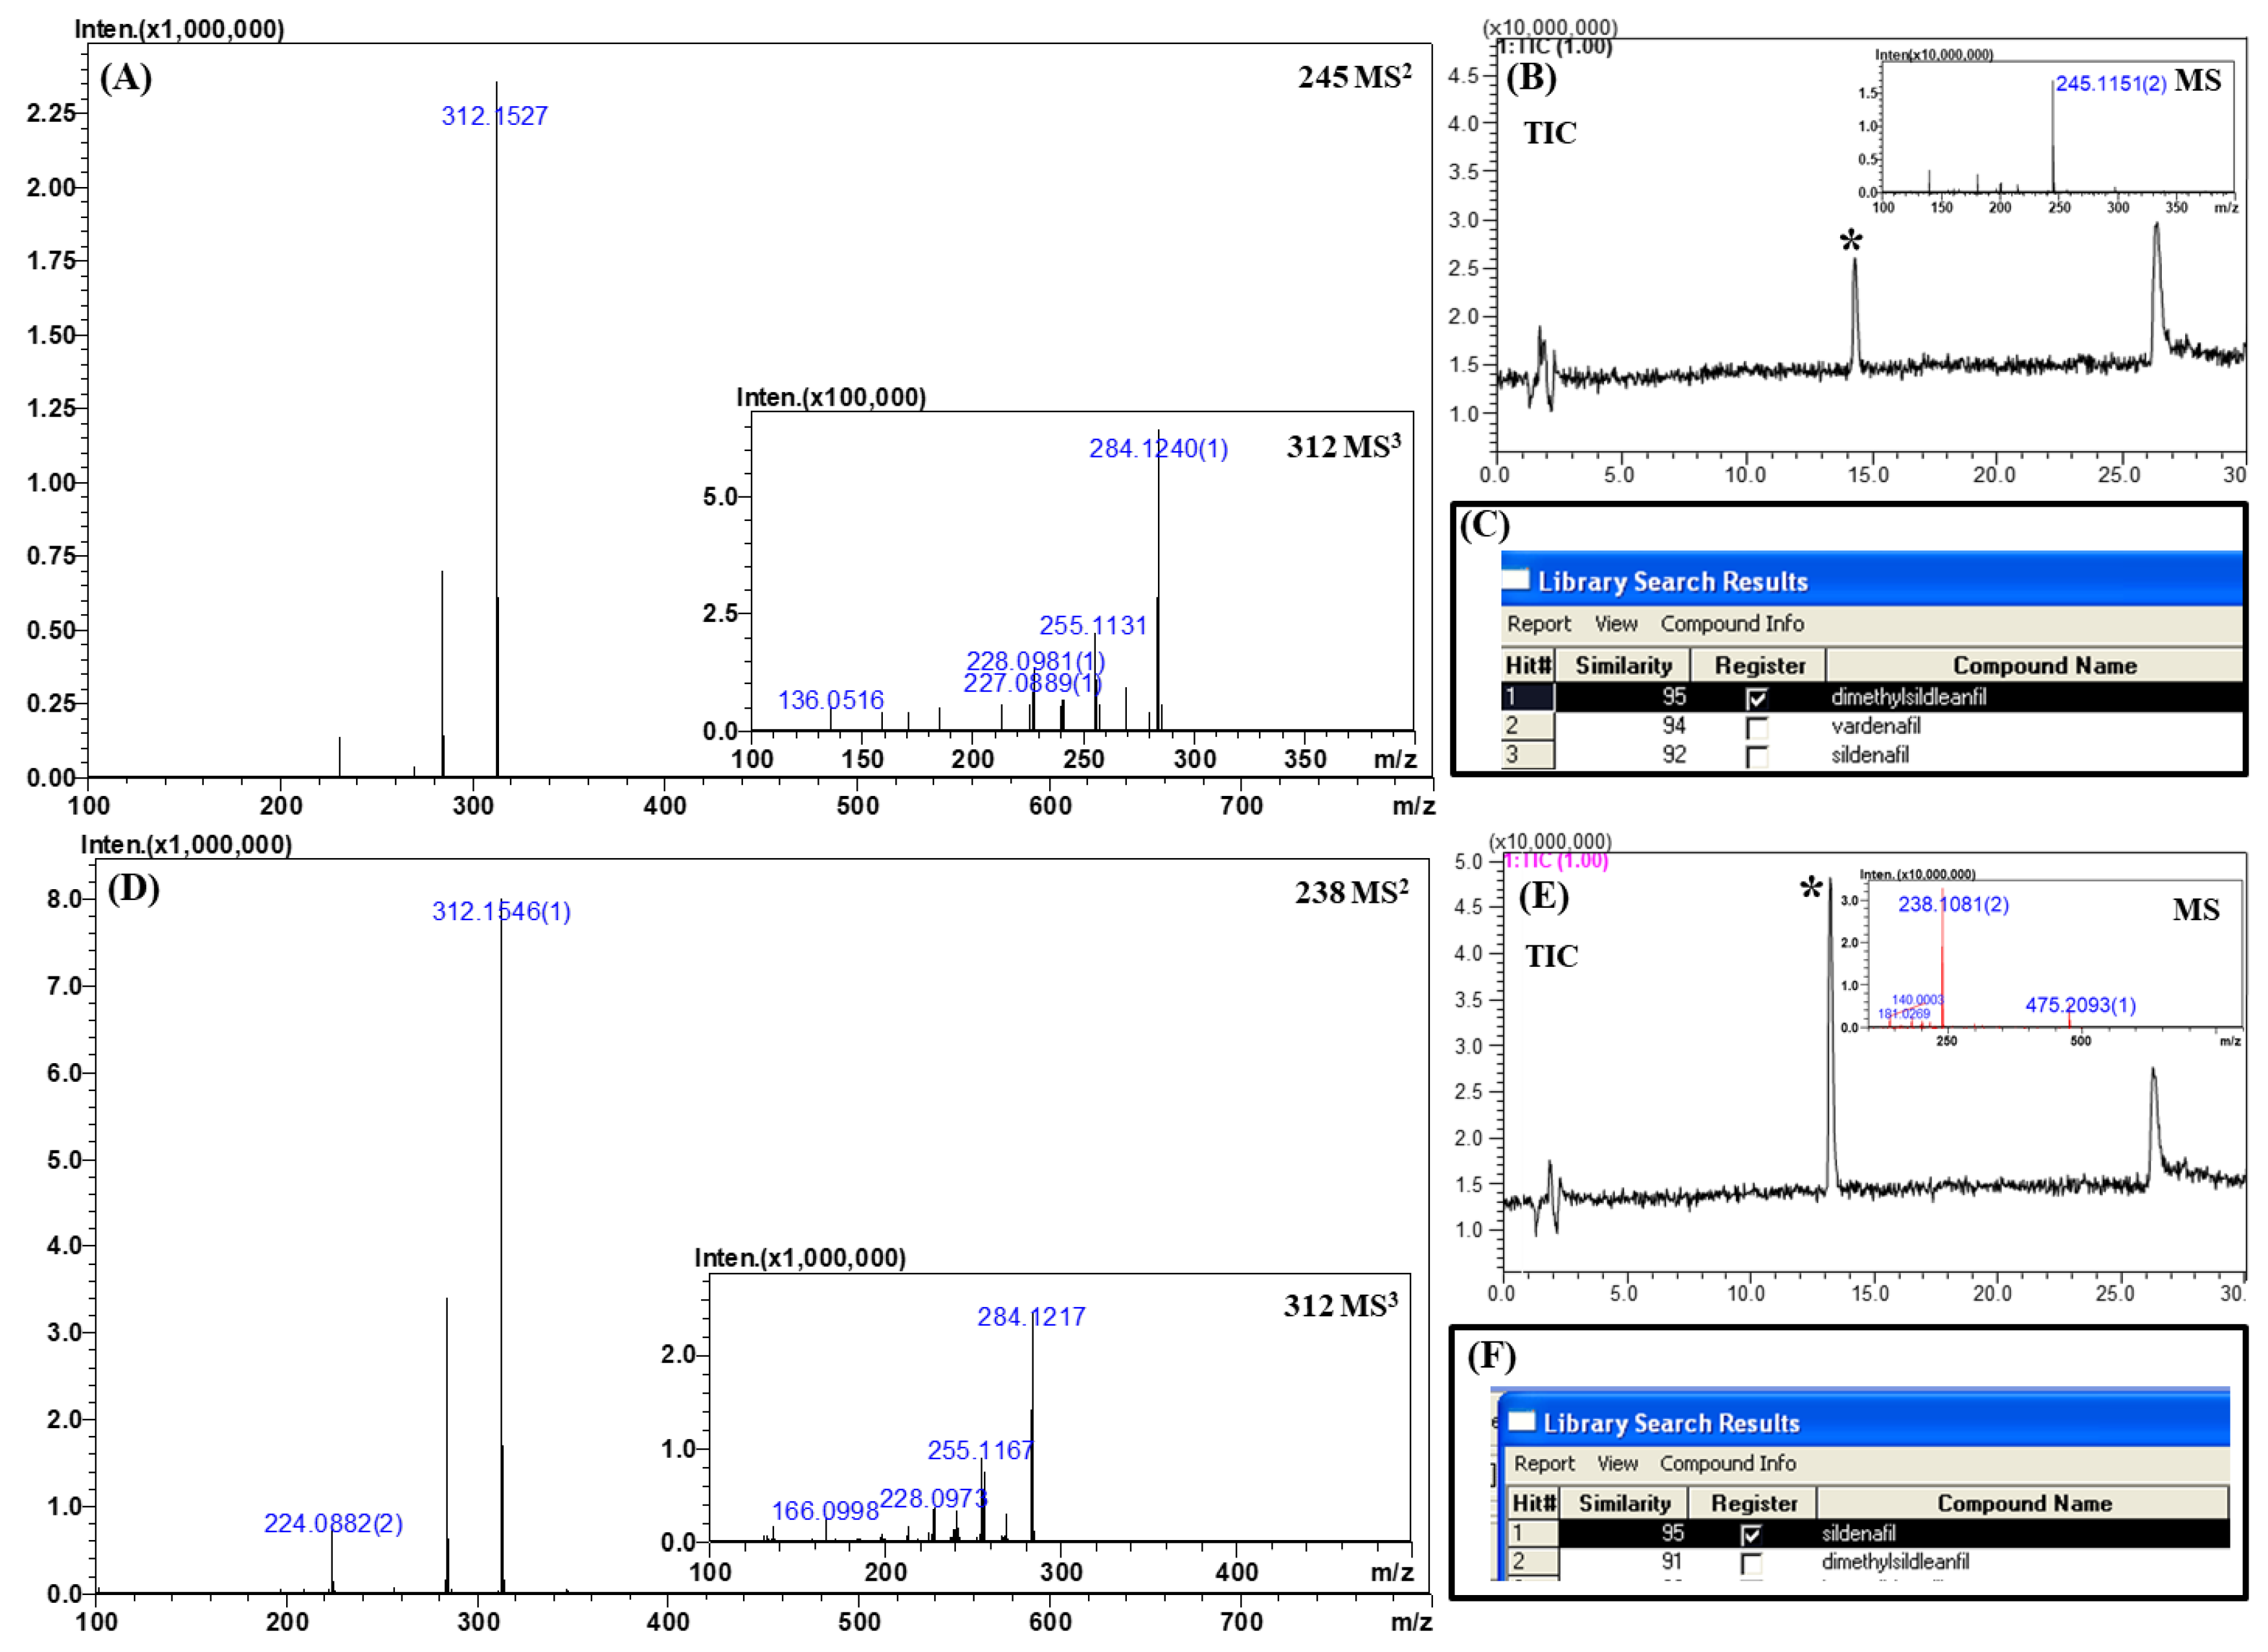
As the main purpose of this study was qualitative analysis, validation was limited to verification of the method. Nevertheless, quantitative analysis was required in some cases. To improve the quantitative precision and accuracy of our analytical method, phenolphthalein was used as an internal standard (IS).
At a higher concentration, saturation of the IT occurred, and loss of linearity and mass spectral distortion were observed owing to the space charge effect in the IT-type MS [39]. Thus, linearity was estimated over a narrow range. Each calibration curve was constructed with six different concentrations of the 38 PDE-5 inhibitors and their analogs through linear regression analysis. All compounds showed appropriate linearity (R2 > 0.99) over the estimated concentration ranges (Table 2).
The precision of the method was evaluated in terms of intra- and inter-day precision, estimated by testing a mixed standard solution in five replicates in a day and by repeating the test on five consecutive days. The QC samples were consisted with three different concentrations: Low concentration (L): the lowest concentration in the calibration curve; Medium concentration (M): about 1.67 times higher concentration than low concentration; High concentration (H): the highest concentration in the calibration curve. The intra- and inter-day precision of the 38 PDE-5 inhibitors and their analogs ranged from 0.6% to 9.2% and from 1.2% to 10.5%, respectively. The corresponding intra- and inter-day accuracy ranged from 86.7% to 112.0% and from 89.7% to 105.7%. Based on the results for the validation parameters, this method was demonstrated to be reproducible and reliable for the tested concentration range (Table 3).
The reproducibility of the accurate mass measurement of the analytes was evaluated by testing a mixed standard solution in six replicates. The accurate masses, the mass errors to theoretical mass, and standard deviation (SD) values are listed in Table 4. The reproducibility of accurate mass measurement ranged from 0.42 to 5.47 as SD, and the mass errors to theoretical mass were less than 10 ppm. As the average mass of carbon varies between 12.0107 and 12.0111 due to variations in the natural abundance of 13C, the mass accuracy was limited to 10 ppm [40]. Because the fluctuation of the flight tube temperature could affect the flight distance of the analytes and eventually increase or decrease the mass errors, the temperature of the flight tube in the TOF mass analyzer was kept at 40 °C to maintain the mass accuracy [41]. In addition, the TOF analyzer was calibrated before the analysis using sodium trifluoroacetate solution in accordance with the in-house standard operating procedure.

2.3. MSn Analysis

For identification, a tandem MS analysis should be performed for both references and the analytes of interests as it allows for a clear comparison of their spectra. To construct the spectral library, the reference spectra should contain as many fragment ions as possible because they can be used as queries. Therefore, optimization of the collision energy is important to build the spectral library. At low collision energy (<150% of the relative collision energy), the tandem MS spectra contained only a limited number of fragment ions, such as the dehydrated (“parent ion—18 Da”) form of the parent ion. At the relative collision energy of 150%, there were more fragment ions as compared to those formed at a lower collision energy without loss of information of the parent ions. Accordingly, the applied relative collision energy was set to 150%. In addition, as some compounds did not produce identifiable fragment ions in MS2 analysis, MS3 analysis was performed to obtain more fragment ions for more efficient identification and for effectively building the spectral library. The mass errors, elemental compositions, and accurate masses of the precursors and fragment ions are listed in Table 4 and Table S1. The MSn spectra and proposed fragmentation mechanisms are depicted in Figure 2, Figure 3, Figure 4 and Figure 5 and Figures S1–S15.

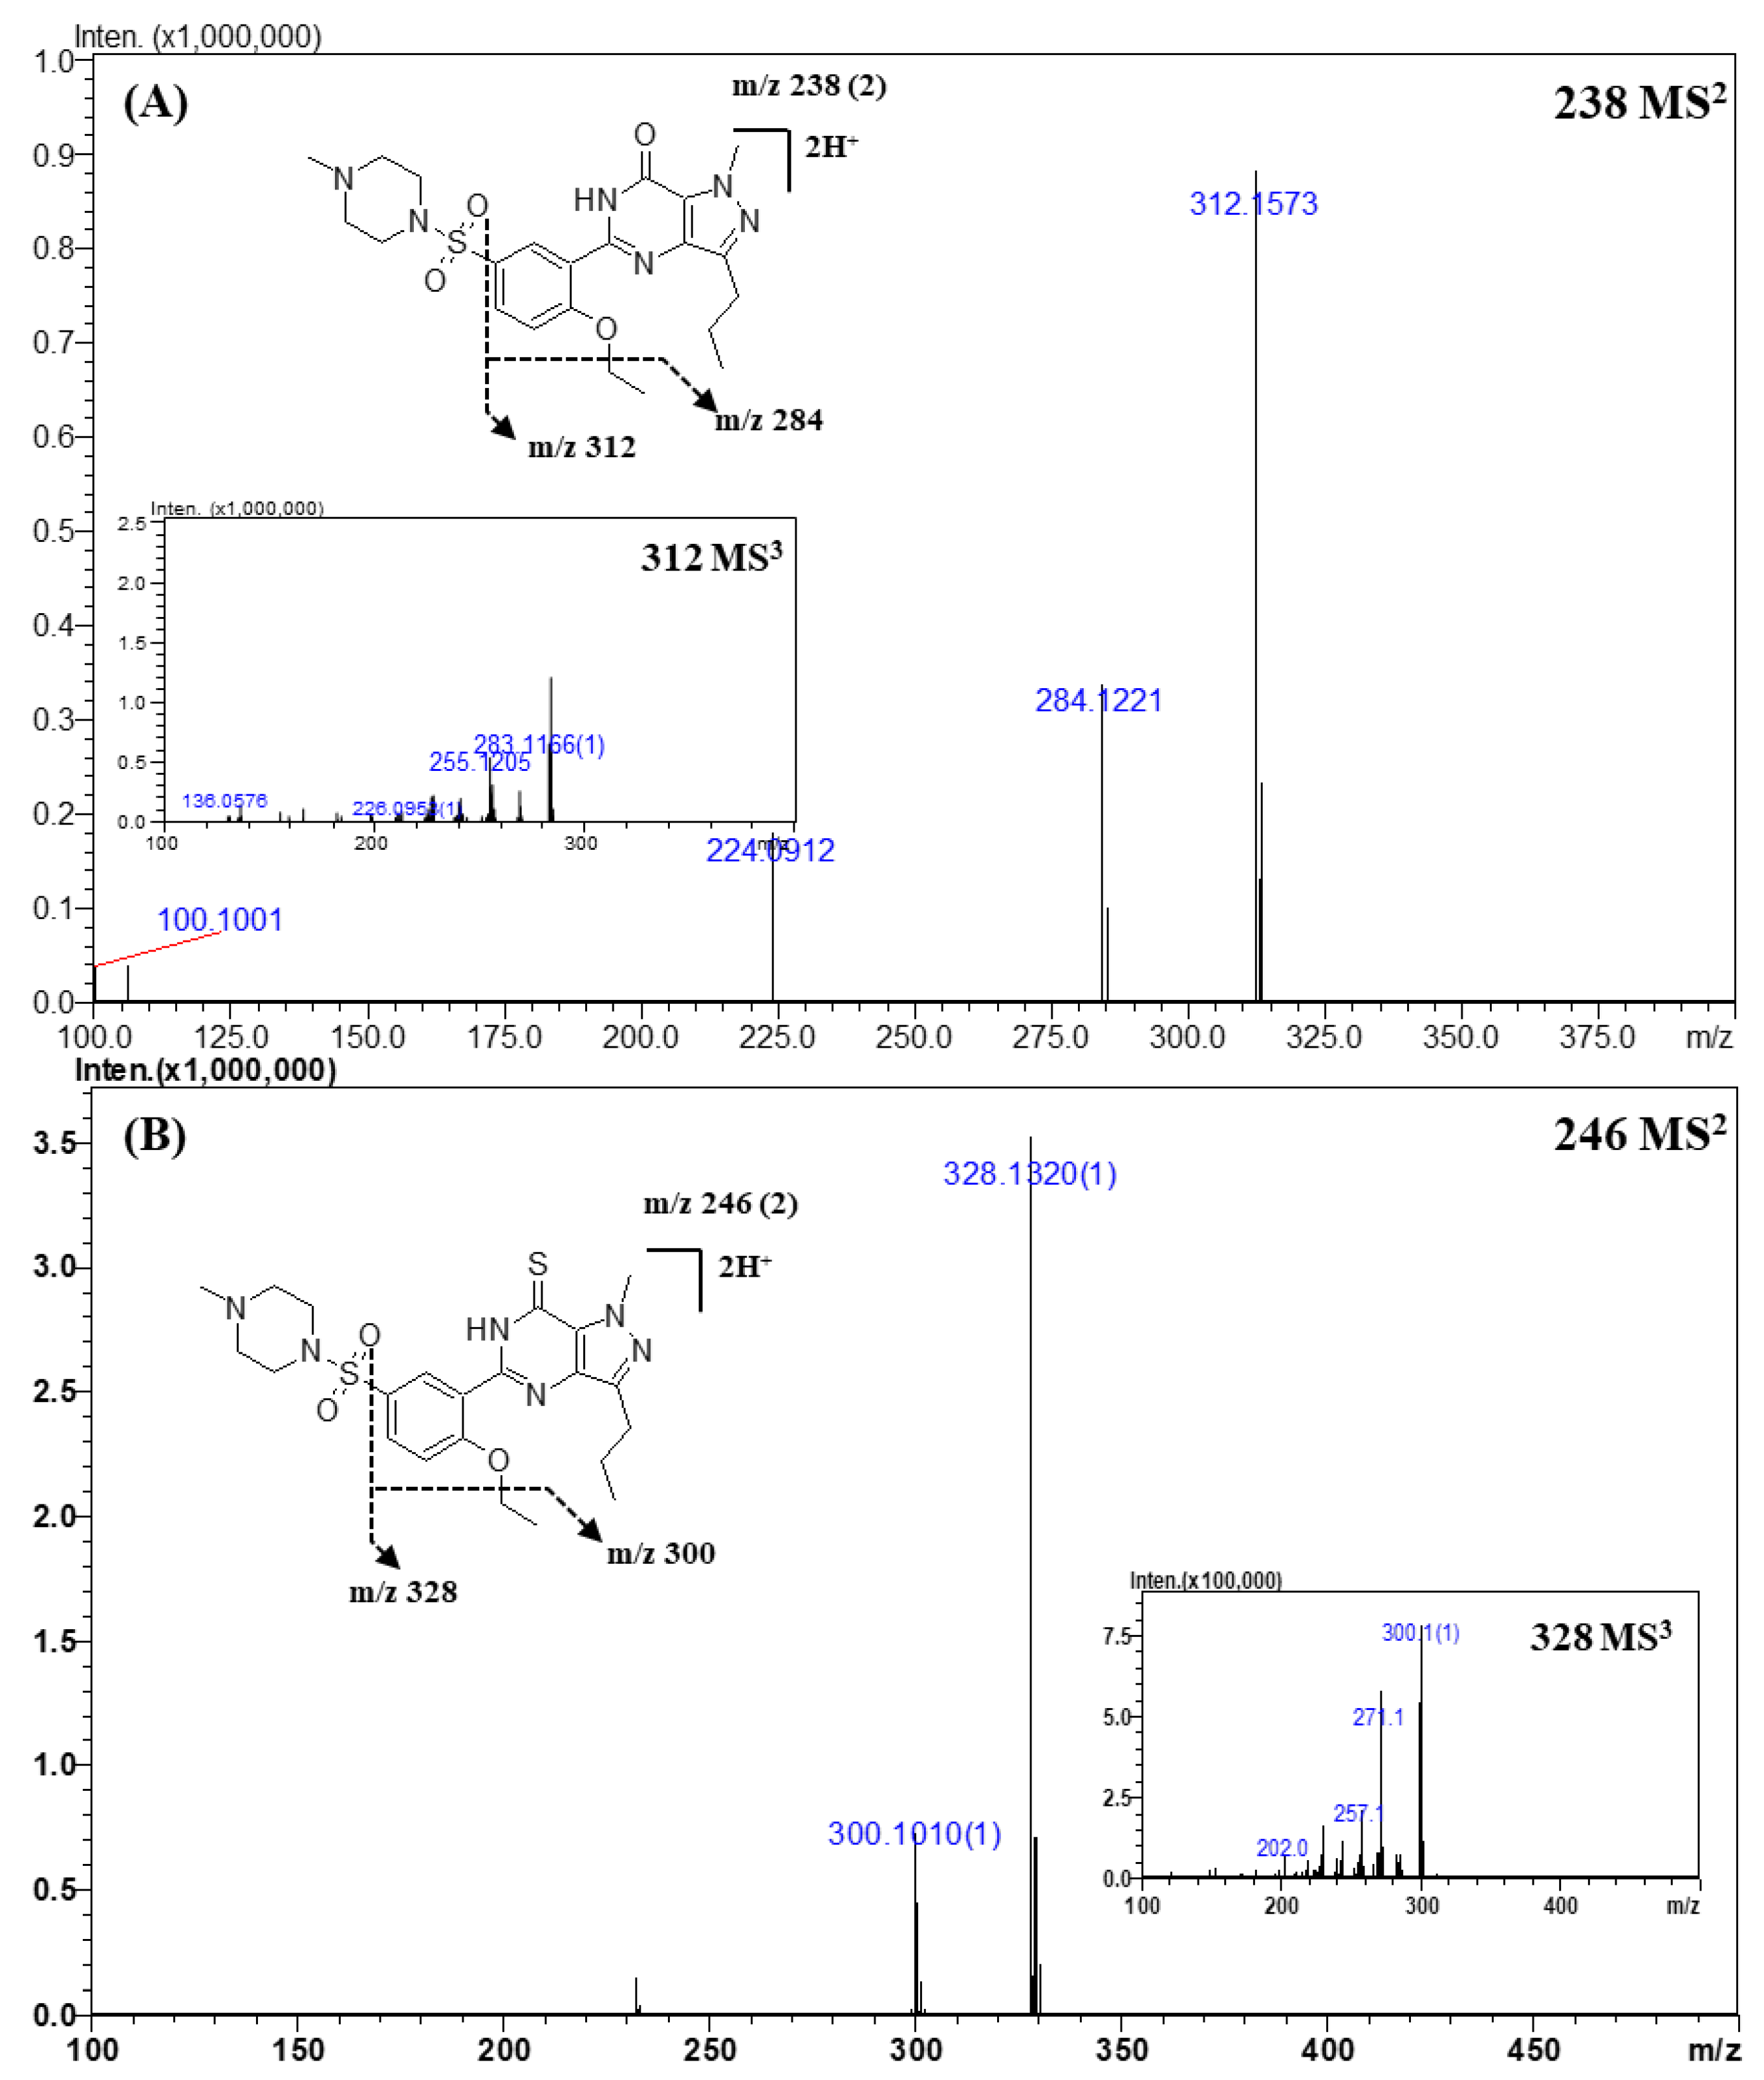
2.3.1. Sildenafil and Its Derivatives

Representative MS2 and MS3 spectra, and the proposed fragmentation mechanism of sildenafil and its derivatives are shown in Figure 2. A total of 22 compounds of sildenafil and their derivatives were analyzed. In the CID process, sildenafil and its derivatives showed a common fragmentation mechanism owing to their structural similarity. The exact masses and elemental compositions of the major fragment ions observed in the MS2 or MS3 spectra were m/z 312.1573 and m/z 284.1221, and their elemental compositions were C17H19N4O2 and C15H15N4O2, respectively (Table 4 and Figure 2A). The product ion of m/z 312.1573 was formed by a neutral loss of the sulfonyl group, and the ion of m/z 284.1221 was produced by a neutral loss of an ethyl moiety (-C2H2, -28 Da) from the ion of m/z 312.1573. In addition, product ions of m/z 311.1456 and m/z 283.1162 had 1 Da lower mass than that of the major fragment ions. The presence of the two groups of fragment ions indicated that more than one pathway could account for the formation of these fragments. The fragment ion observed at m/z 312.1573 was produced by the homolytic cleavage of the C-S bond, while the ion of m/z 311.1456 was formed by inductive cleavage [42]. This fragmentation mechanism was the same as that reported in the literature [3,11,31,42].
In the case of thiosildenafil derivatives (Figure 2B), the proposed fragmentation mechanism was almost the same as that described above; fragment ions of m/z 328.1344 (C17H19N4OS) and m/z 300.1022 (C15H15N4OS) were formed by C-S bond cleavage and subsequent detachment of the ethyl moiety. The mass of the fragment ions was 16 Da lower than that of the fragments from sildenafil; this difference was attributable to the presence of the thioketone moiety, whose mass was 16 Da higher than that of the ketone moiety in sildenafil.
Isobaric analytes could be distinguished by their retention times and MS2 or MS3 spectra. For instance, the theoretical mass and elemental compositions of homosildenafil and dimethylsildenafil were 489.2229 Da and C23H32N6O4S, respectively; however, their retention times were different (13.0 and 13.7 min, respectively, Figure 1 and Table 2). In the MS2 spectra of homosildenafil and dimethylsildenafil (Figure S1), the ion of m/z 312 was observed as a base peak, and the ion of m/z 284 was the second most intense peak. The ion ratio of m/z 284.1230 to m/z 312.1542 in the MS2 spectrum of homosildenafil was about three times higher than that in the spectrum of dimethylsildenafil. Thiohomosildenafil and dimethylthiosildenafil were separately observed at retention times of 24.1 and 25.1 min (Table 2), and their elemental composition was C23H32N6O3S2. Their MS2 and MS3 spectra were almost the same, except for their different m/z 300.1012 to m/z 328.1332 ion ratios (Figure S2). In the MS2 spectrum of thiohomosildenafil, the ion ratio of m/z 300.1019 to m/z 328.1364 was approximately three times higher than that in the MS2 spectrum of dimethylthiosildenafil. These results indicate that both the separation capability and the ion ratio of certain fragment ions in tandem MS spectra were important to gain sufficient information for discriminating the isobaric compounds.

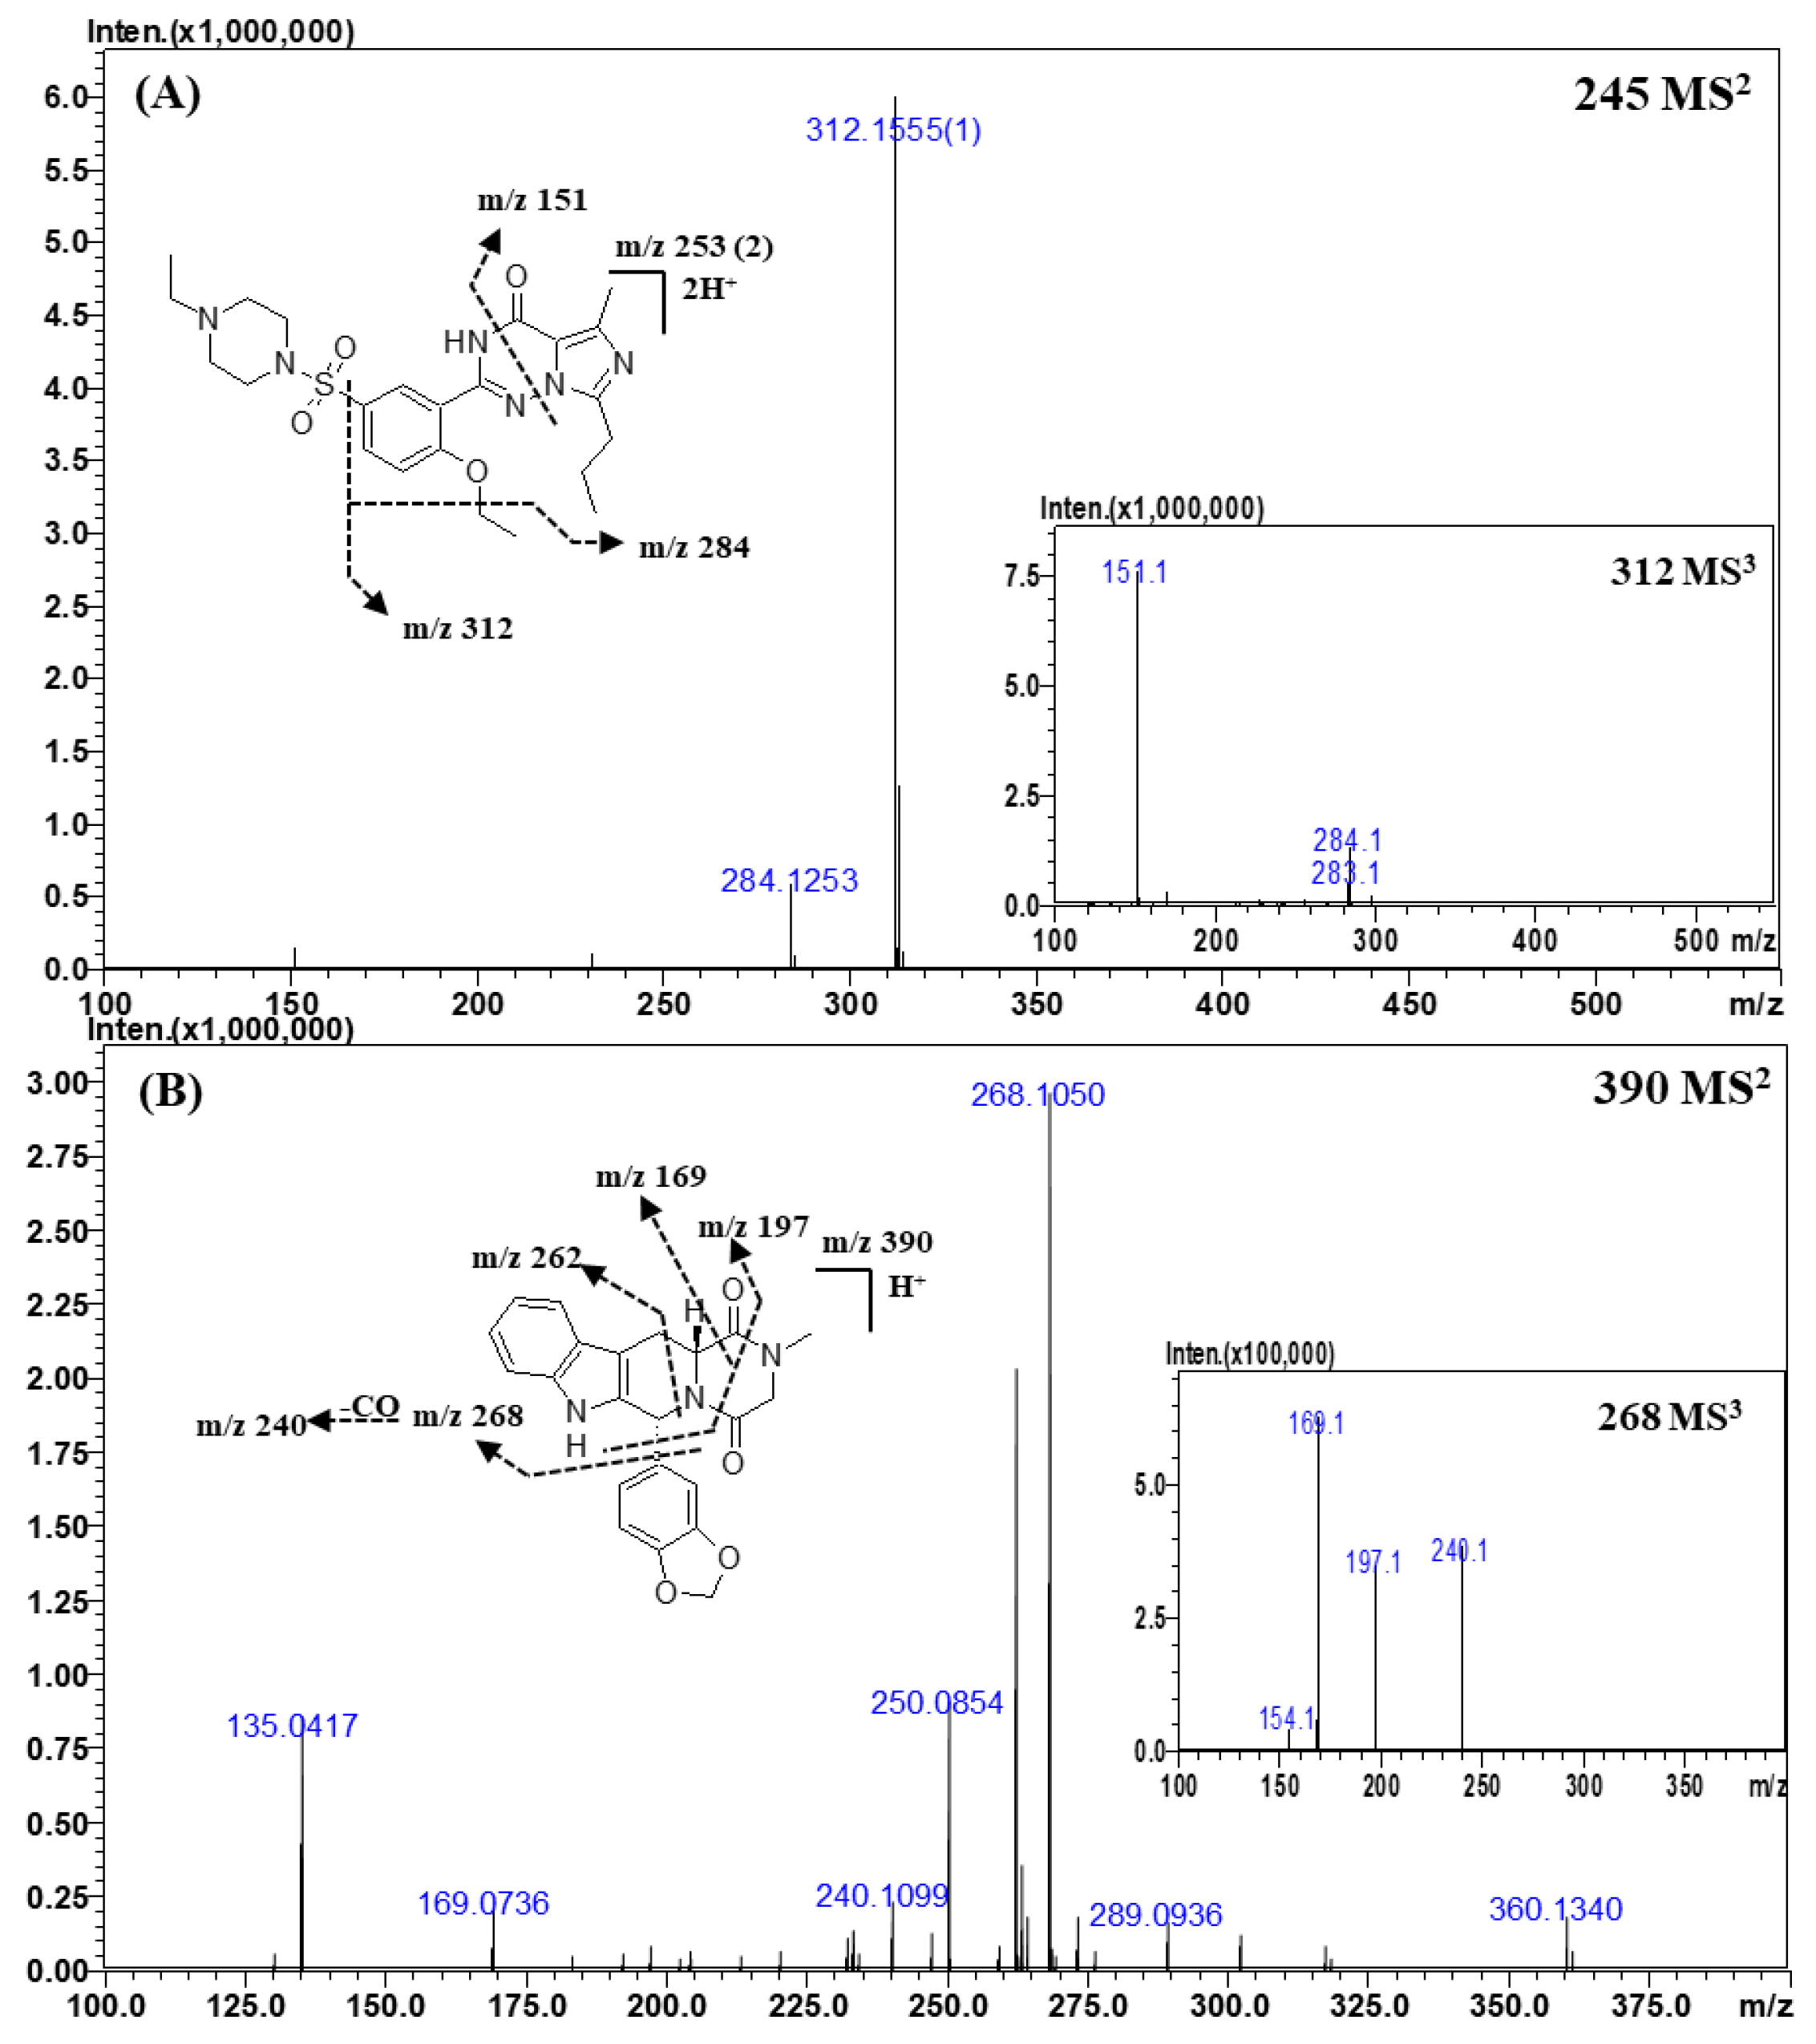
2.3.2. Vardenafil and Its Derivatives

Representative MS2 and MS3 spectra and the proposed fragmentation mechanism of vardenafil are shown in Figure 3A. The structures of vardenafil and its derivatives were almost identical to those of sildenafil and its derivatives. In the CID spectra of vardenafil and its derivatives, the fragment ions of m/z 312.1555 (C17H19N4O2) and m/z 284.1253 (C15H15N4O2) were formed by the fragmentation mechanisms identical to those for sildenafil and its derivatives owing to their structural similarity. However, the ions produced by the homolytic cleavage of the C-S bond were not found in the MSn spectra of vardenafil, and the ion of m/z 151.0877 (C8H10N2O), which was formed by the cross ring cleavage of triazin-4-one, was observed only in the CID process of vardenafil and its derivatives.
Because of the structural similarity between the vardenafil and sildenafil derivatives, the fragment ions generated in the MS2 or MS3 spectra were almost same. For example, when comparing the MS2 spectra of the vardenafil and sildenafil derivatives with the same molecular weights, such as homosildenafil and dimethylsildenafil, the major fragment ions were observed at m/z 312.1555 and m/z 284.1253. The ratio of these ions in the MS2 spectrum of vardenafil was similar to that in the spectrum of homosildenafil. Therefore, it was difficult to distinguish between vardenafil and homosildenafil by their MS2 spectra on the basis of the major fragment ions and the ion ratio of a certain fragment ion. As previously described in this section, the ion of m/z 151.0877 (C8H10N2O), a diagnostic ion of vardenafil, was only found in the MS2 or MS3 spectra of vardenafil analogs. Thus, we could distinguish vardenafil analogs from those of sildenafil by simply observing the diagnostic ion in the MS2 or MS3 spectra of the analytes.

2.3.3. Tadalafil and Its Derivatives

Representative MS2 and MS3 spectra and the proposed fragmentation mechanism of tadalafil are depicted in Figure 3B. In the CID spectra of tadalafil, the ion observed at m/z 268.1050 (C15H13N3O2) was formed by a neutral loss of 1,3-benzodioxole, and the ion of m/z 240.1099 (C14H13N3O) was produced by the loss of the carbonyl (CO) group from the ion with m/z 268.1050. The ion of m/z 197.0707 (C12H8N2O) was formed by a neutral loss of 1,3-benzodioxole and the cross ring cleavage of piperazine-2,5-dione, and the ion of m/z 169.0736 (C11H8N2) was produced by the loss of a CO group from the ion of m/z 197.0707. The ion observed at m/z 262.0866 was formed by a neutral loss of piperazine-2,5-dione. The fragment ions of m/z 262.0866, m/z 197.0707, and m/z 169.0736 and a neutral loss of 1,3-benzodioxole are commonly observed in the CID spectra of tadalafil derivatives.

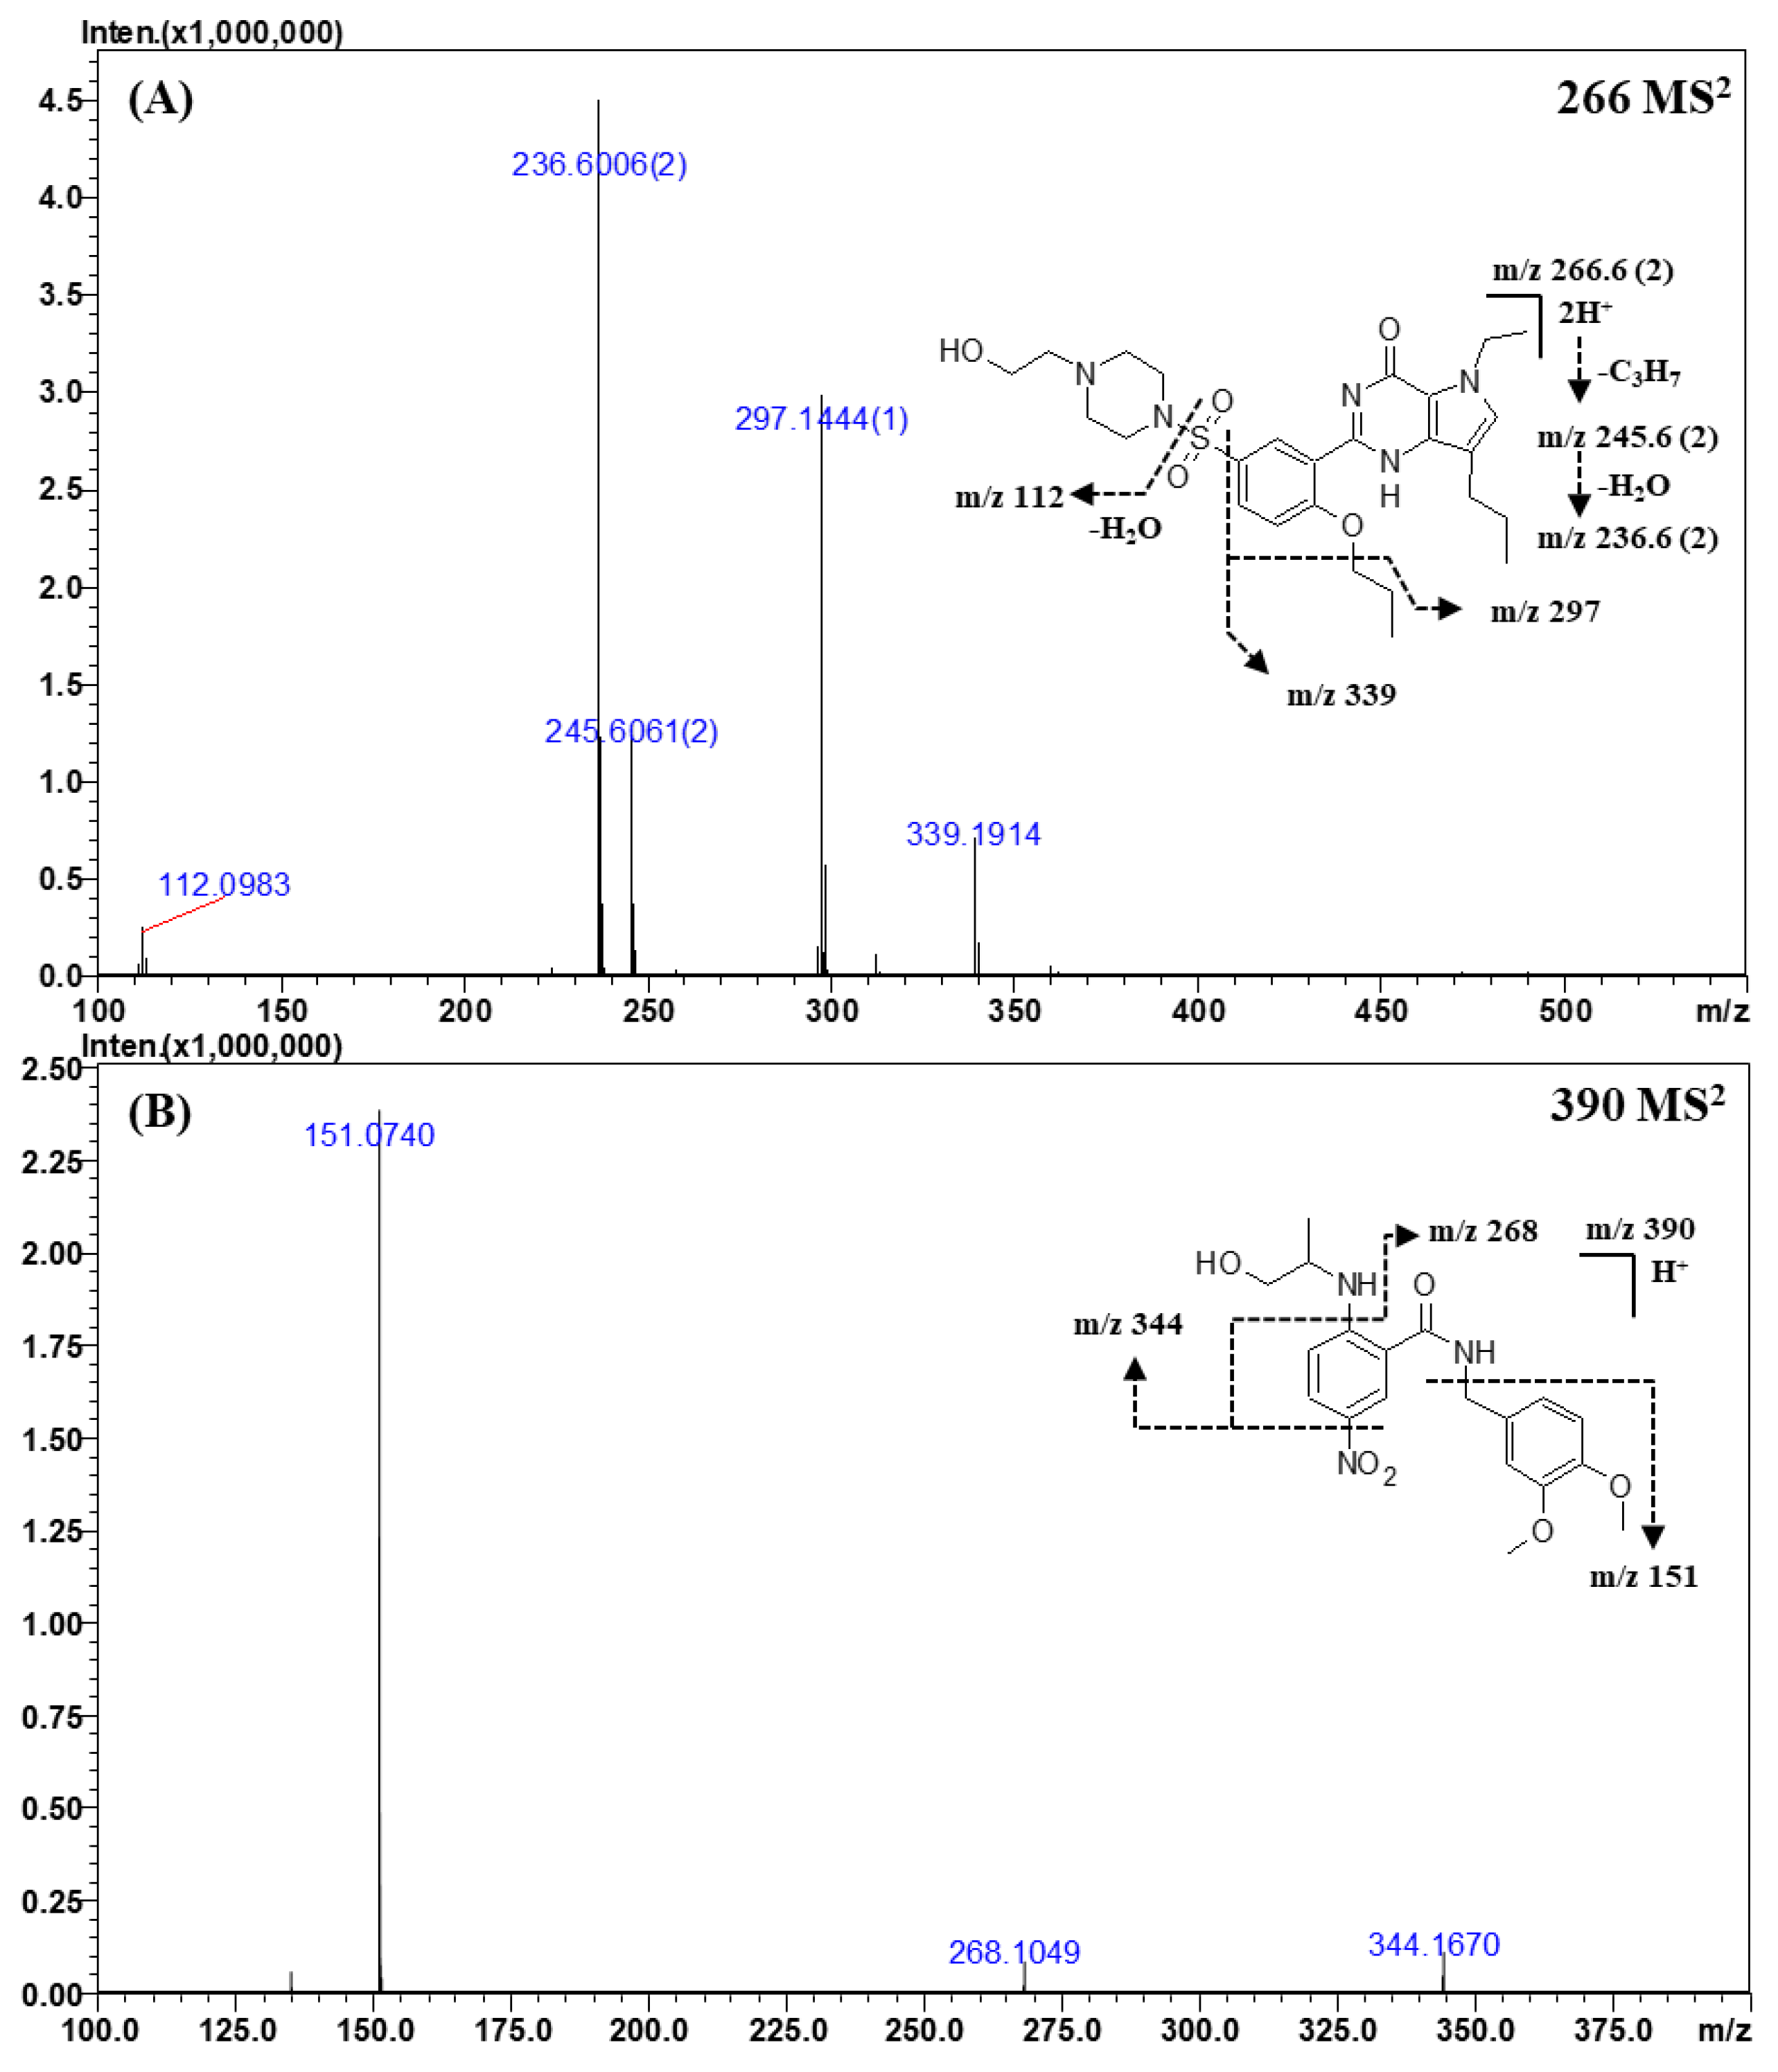
2.3.4. Other Classes

The CID spectra of mirodenafil, xanthoanthrafil, thioquinapiperifil, and yohimbine are shown in Figure 4; Figure 5. As the structure of mirodenafil was almost the same as that of sildenafil, its fragment ions were produced by the same fragmentation mechanism as that of sildenafil (Figure 4A). The ion observed at m/z 339.1914 (C20H24N3O2) was formed by the cleavage of the C-S bond, and the ion of m/z 297.1444 (C17H18N3O2) was produced by a neutral loss of the propyl group of phenyl propyl ether. The doubly charged ion of m/z 245.6061 (C23H31N5O5S) was formed by a neutral loss of the propyl group of phenyl propyl ether, and the ion of m/z 236.6006 (C23H29N5O4S) was produced by intra-molecular dehydration (-H2O) from the ion of m/z 245.6061.
The structures of xanthoanthrafil and thioquinapiperifil were different from those of other PDE-5 inhibitors and their analogs. As they have unique structures, the fragment ions produced in the CID spectra were different from those of other classes of analytes.
In the MS2 spectra of xanthoanthrafil (Figure 4B), the fragment ion of m/z 151.0740 (C9H10O2) was predominant. The ion observed at m/z 151.0740 was formed by a neutral loss of the 3-nitrobenzamide group. The ions of m/z 344.1670 (C19H23N2O4) and m/z 268.1049 (C16H14NO3) were produced by a sequential neutral loss of the NO2 group.
The fragment ions of thioquinapiperifil in the MS2 spectra (Figure 5A) were observed at m/z 246.0774 (C11H11N5S), m/z 204.1343 (C13H17NO), m/z 218.0493 (C9H7N5S), and m/z 189.0773 (C20H20N6S). The fragment ion of m/z 204.1343 was formed by the loss of the quinazolin-4-amine moiety, and that of m/z 246.0774 was produced by cleavage between quinazolin-4-amine and the benzyl group. The fragment ion of m/z 218.0493 was formed by a neutral loss of the ethyl moiety from the ion of m/z 246.0774, and the product ion of m/z 189.0773, a doubly charged ion, was produced by the cross ring cleavage of the piperidine ring.
The major product ions in the MS2 spectra of yohimbine (Figure 5B) were observed at m/z 212.1248 (C11H17NO3) and m/z 144.0803 (C10H9N), which were formed by piperidine ring cleavage. The MS3 spectra of the ion of m/z 212.1248 gave ions of m/z 194.1150 (C11H15NO2), m/z 180.1015 (C10H13NO2), m/z 162.0900 (C10H11NO), m/z 152.1059 (C9H13NO), and m/z 134.0955 (C9H11N). The ion observed at m/z 194.1150 was formed by intra-molecular dehydration from the aliphatic hydroxyl (-OH) group. The ions of m/z 180.1015 and m/z 152.1059 were formed by the loss of an ester moiety, and the ions of m/z 162.0900 and m/z 134.0955 were produced by intra-molecular dehydration (loss of the aliphatic hydroxyl group) from ions of m/z 180.1015 and m/z 152.1059, respectively. These ions were confirmed by measuring their accurate mass and elemental composition. The high-resolution MSn spectral library was built using all MSn spectra acquired from this study; all details are provided in the Supplementary Materials (Figures S1–S15 and Table S1).

2.4. Analysis of Real Samples

Two positive samples (denoted as sample 1 and sample 2) were analyzed by the developed LC–MS method. The samples were extracted with methanol and diluted 1000-fold with 50% methanol. Their total ion chromatograms, MSn (n = 1–3) spectra, and library search results are depicted in Figure 6. As shown in Figure 6, the unknown peaks were detected as the major peak even in the 1000-fold diluted samples. Two additional peaks were also observed in both samples. These peaks might be derived from the dilution solvent (50% methanol) or sample container because they appeared when the dilution solvent alone (present in the sample container) was injected into the LC–MS system (data not shown).
The unknown peak of sample 1 was observed at the retention time of 14.3 min with an accurate mass of m/z 245.1151 ([M + 2H]2+; Figure 6A). According to the accurate mass, the possible candidates for the unknown compound were homosildenafil, dimethylsildenafil, and vardenafil with mass errors of 10.2 ppm. On comparing the retention times of these candidates, the retention time of dimethylsildenafil was found to be similar to that of the unknown peak. Further confirmation was achieved by retrieving the MSn spectral library. The library provided three matched candidates with similarity scores of over 92, namely, dimethylsildenafil, vardenafil, and sildenafil. Vardenafil was excluded from the consideration because the tandem MS spectra did not contain the diagnostic fragment ion (m/z 151.0866, C8H10N2O) of vardenafil. Sildenafil was also excluded because the molecular weight of the unknown was completely different from that of sildenafil. These clues collectively suggested with a high confidence level that the unknown peak belongs to dimethylsildenafil.
In the chromatogram of sample 2, the unknown peak was observed at the retention time of 13.2 min with an accurate mass of m/z 475.2093 ([M + H]+; Figure 6B). By considering the retention time and accurate mass, a possible candidate was sildenafil with a mass error of 6.1 ppm. The spectral library suggested two possible candidates with a similarity score of over 91, namely, sildenafil and dimethylsildenafil. As the molecular weight of the unknown peak only matched with sildenafil among the two candidates with a high confidence level, it was concluded that this unknown peak was sildenafil.

3. Materials and Methods

3.1. Chemicals and Reagents

Thirty-eight standards of PDE-5 inhibitors and their analogs were obtained from Seoul Regional Ministry of Food and Drug Safety (MFDS, Seoul, Republic of Korea). The PDE-5 inhibitors and their analogs included sildenafil, vardenafil, tadalafil, mirodenafil, udenafil, thioquinapiperifil, hydroxyvardenafil, hydroxyhongdenafil, hongdenafil, piperidinohongdenafil, dimethylsildenafil, cyclopentinafil, benzylsildenafil, thiosildenafil, dimethylthiosildenafil, chloropretadalafil, nitrodenafil, nor-neosildenafil, hydroxyhomosildenafil, acetylvardenafil, nor-neovardenafil, desulfovardenafil, aminotadalafil, yohimbine, demethylhongdenafil, oxohongdenafil, homosildenafil, xanthoanthrafil, pseudovardenafil, hydroxychlorodenafil, chlorodenafil, N-octyltadalafil, dichlorodenafil, carbodenafil, thiohomosildenafil, hydroxythiohomosildenafil, acetaminotadalafil, and demethyltadalafil. Phenolphthalein (internal standard, IS) was purchased from Sigma Aldrich (St. Louis, MO, USA). The detailed structures of the analytes were depicted in the Table S2. HPLC-grade methanol, acetonitrile, and water were purchased from Thermo Fisher Scientific (Fair Lawn, NJ, USA). Glacial acetic acid (99.7%), formic acid (98%), and ammonium formate were purchased from Sigma Aldrich. Stock solutions of the standards were dissolved in methanol at the appropriate concentration and stored in the refrigerator (4 °C). All standard solutions were mixed and diluted to appropriate concentration with 50% methanol.

3.2. Sample Preparation

Dietary supplements (100 mg) suspected of adulteration with PDE-5 inhibitor analogs were vortexed for 10 min with 10 mL of methanol and extracted in an ultrasonic bath for 30 min at room temperature.
After extraction, the samples were centrifuged at 3500 rpm for 10 min. The supernatants were filtered through a syringe filter (0.45 μm of pore size). The aliquot of the filtered supernatants was diluted with 50% methanol by a dilution factor of 100 or 1000.

3.3. Instrumentation and Separation Conditions

The LC–MS/MS system consisted of a Shimadzu LC-20A HPLC system and LC–IT–TOF MS equipped with an electrospray ionization source (Shimadzu, Kyoto, Japan). The chromatographic separation was achieved on the Capcell PAK C18 UG120 column (2.1 × 150 mm, 3 μm particle size, Shiseido, Tokyo, Japan) using a mobile phase comprising 0.2% acetic acid (A) and acetonitrile (B) at a flow rate of 0.2 mL/min and a temperature of 50 °C. The gradient program was as follows: 0 min, 10% B; 5 min, 20% B; 45 min, 40% B; 50 min, 85% B; 55 min, 85% B; 55.1 min, 10% B; 70 min, 10% B. The injection volume was 5 μL. The operating electrospray ionization (ESI) parameters were as follows: ion spray voltage, 4.5 kV; drying gas (N2), 1.5 L/min; and curved desolvation line temperature and heat block temperature, 200 °C. The MS system was calibrated prior to the analysis by using sodium trifluoroacetate solution. The HPLC and MS systems were controlled by the Lab Solution (Ver. 3.1.360) software.

3.4. MSn Analysis

Data-dependent MSn (n = 1–3) analysis was adopted to obtain structural information of the analytes. The precursor ion was selected over the range of m/z 100–800, and the MSn spectra were obtained at the relative collision energy of 150%. Three precursor ions were selected automatically in the order of their intensity in a given spectrum (over 100,000 cps). Ion accumulation time in the ion trap was set to 10 ms for both MS and MSn (n = 2, 3) modes. Elemental composition and mass error were calculated using accurate mass by the formula predictor software included in the Lab Solution software. The spectral libraries of the references were built on the basis of the MS2 and MS3 spectra by the library editor software included in the Lab Solution software.

3.5. Method Validation

Calibration curves for LC–MS were constructed with six different concentration levels from the concentration ranges listed in Table 1. The intra- and inter-day precision (CV) and accuracy (%) were estimated by analyzing five replicates at three different concentrations all within one day or over five days. The reproducibility of accurate mass measurements was estimated by analyzing six replicates.

4. Conclusions

An accurate screening method for PDE-5 inhibitors and their analogs in dietary supplements was developed using hybrid IT–TOF MS and validated. IT–TOF MS gave more accurate information on the structure of analytes by providing accurate masses of the parent ion as well as fragment ions, which could be converted to determine elemental composition. The spectral library of references was built against the MSn spectra for retrieving the structural hits. The library suggested appropriate candidates and helped identify the unknown compounds during the real sample analysis. The combined measurement of accurate mass and retention time of the analytes facilitated accurate identification of the adulterated compounds. In conclusion, the developed LC–MS method and MSn spectral library provided spectral insights for newly synthesized PDE-5 inhibitors and facilitated the rapid screening and identification of illegally adulterated analogs.

Supplementary Materials

The following are available online, Figure S1: Representative MSn (n = 2, 3) spectra and proposed fragmentation mechanisms of homosildenafil (A) and dimethylsildenafil (B). The bracketed numbers next to the m/z values indicate the charge state of the ions; Figure S2: Representative MSn (n = 2, 3) spectra and proposed fragmentation mechanisms of thiohomosildenafil (A) and dimethylthiosildenafil (B). The bracketed numbers next to the m/z values indicate the charge state of the ions; Figure S3: Representative MSn (n = 2, 3) spectra and proposed fragmentation mechanisms of benzylsildenafil (A) and carbodenafil (B). The bracketed numbers next to the m/z values indicate the charge state of the ions; Figure S4: Representative MSn (n = 2, 3) spectra and proposed fragmentation mechanisms of nor-neosildenafil (A) and cyclopentinafil (B). The bracketed numbers next to the m/z values indicate the charge state of the ions; Figure S5: Representative MS2 spectra and proposed fragmentation mechanisms of hydroxythiohomosildenafil (A) and hydroxyhomosildenafil (B). The bracketed numbers next to the m/z values indicate the charge state of the ions; Figure S6: Representative MSn (n = 2, 3) spectra and proposed fragmentation mechanisms of chlorodenafil (A) and dichlorodenafil (B). The bracketed numbers next to the m/z values indicate the charge state of the ions; Figure S7: Representative MS2 spectra and proposed fragmentation mechanisms of hydroxychlorodenafil (A) and nitrodenafil (B). The bracketed numbers next to the m/z values indicate the charge state of the ions; Figure S8: Representative MSn (n = 2, 3) spectra and proposed fragmentation mechanisms of udenafil (A) and hongdenafil (B). The bracketed numbers next to the m/z values indicate the charge state of the ions; Figure S9: Representative MS2 and proposed fragmentation mechanisms of piperidinohongdenafil (A) and demethylhongdenafil (B). The bracketed numbers next to the m/z values indicate the charge state of the ions; Figure S10: Representative MS2 spectra and proposed fragmentation mechanisms of hydroxyhongdenafil (A) and oxohongdenafil (B). The bracketed numbers next to the m/z values indicate the charge state of the ions; Figure S11: Representative MS2 spectra and proposed fragmentation mechanisms of desolfovardenafil (A) and nor-neovardenafil (B). The bracketed numbers next to the m/z values indicate the charge state of the ions; Figure S12: Representative MS2 spectra and proposed fragmentation mechanisms of pseudovardenafil (A) and acetylvardenafil (B). The bracketed numbers next to the m/z values indicate the charge state of the ions; Figure S13: Representative MS2 spectra and proposed fragmentation mechanisms of hydroxyvardenafil (A) and acetaminotadalafil (B). The bracketed numbers next to the m/z values indicate the charge state of the ions; Figure S14: Representative MS2 spectra and proposed fragmentation mechanisms of aminotadalafil (A) and demethyltadalafil (B). The bracketed numbers next to the m/z values indicate the charge state of the ions; Figure S15: Representative MSn (n = 2, 3) spectra and proposed fragmentation mechanisms of chloropretadalafil (A) and N-octyltadalafil (B). The bracketed numbers next to the m/z values indicate the charge state of the ions; Table S1: Accurate masses and mass errors for fragment and precursor ions of PDE-5 inhibitors and their analogs; Table S2: The structures of PDE-5 inhibitors and their analogues.

Author Contributions

Conceptualization, U.K. and S.B.H.; methodology, U.K., H.-D.C., and H.R.K.; validation, U.K. and M.H.K.; formal Analysis, U.K., G.K., N.H., and U.T.S.; investigation, U.K., H.-D.C., S.S., and N.H.; resources, M.H.K. and U.T.S.; data curation, U.K., J.H.S., H.Y.E., and J.K.; writing—Original Draft Preparation, U.K. and H.-D.C.; visualization, U.K., H.-D.C., and J.K.; supervision, S.B.H.; project administration, S.B.H. All authors have read and agreed to the published version of the manuscript.

Funding

This research was supported by the Chung-Ang University research grant in 2019.

Conflicts of Interest

The authors declare no conflict of interest.

References

  1. Rotella, D.P. Phosphodiesterase 5 inhibitors: Current status and potential applications. Nat. Rev. Drug Discov. 2002, 1, 674–682. [Google Scholar] [CrossRef] [PubMed]
  2. Ke, H.; Wang, H. Crystal structure of phosphodiesterase’s and implications on substrate specificity and inhibitor selectivity. Curr. Top. Med. Chem. 2007, 7, 391–403. [Google Scholar] [CrossRef] [PubMed]
  3. Singh, S.; Prasad, B.; Savaliya, A.; Shah, R.; Gohil, V.; Kaur, A. Strategies for characterizing sildenafil, vardenafil, tadalafil and their analogues in herbal dietary supplements, and detecting counterfeit products containing these drugs. TrAC Trends Anal. Chem. 2009, 28, 13–28. [Google Scholar] [CrossRef]
  4. Lee, H.M.; Kim, C.S.; Jang, Y.M.; Kwon, S.W.; Lee, B.J. Separation and structural elucidation of a novel analogue of vardenafil included as an adulterant in a dietary supplement by liquid Chromatography-Electrospray ionization mass spectrometry, infrared spectroscopy and nuclear magnetic resonance spectroscopy. J. Pharm. Biomed. 2011, 54, 491–496. [Google Scholar] [CrossRef] [PubMed]
  5. Venhuis, B.J.; de Kaste, D. Towards a decade of detecting new analogues of sildenafil, tadalafil and vardenafil in food supplements: A history, analytical aspects and health risks. J. Pharm. Biomed. 2012, 69, 196–208. [Google Scholar] [CrossRef] [PubMed]
  6. Shin, M.H.; Hong, M.K.; Kim, W.S.; Lee, Y.J.; Jeoung, Y.C. Identification of a new analogue of sildenafil added illegally to a functional food marketed for penile erectile dysfunction. Food Addit. Contam. 2003, 20, 793–796. [Google Scholar] [CrossRef] [PubMed]
  7. Lam, Y.-H.; Poon, W.-T.; Lai, C.-K.; Chan, A.Y.-W.; Mak, T.W.-L. Identification of a novel vardenafil analogue in herbal product. J. Pharm. Biomed. 2008, 46, 804–807. [Google Scholar] [CrossRef]
  8. Venhuis, B.J.; Zomer, G.; Hamzink, M.; Meiring, H.D.; Aubin, Y.; de Kaste, D. The identification of a nitrosated prodrug of the PDE-5 inhibitor aildenafil in a dietary supplement: A Viagra with a pop. J. Pharm. Biomed. 2011, 54, 735–741. [Google Scholar] [CrossRef]
  9. Balayssac, S.; Gilard, V.; Zedde, C.; Martino, R.; Malet-Martino, M. Analysis of herbal dietary supplements for sexual performance enhancement: First characterization of Propoxyphenyl-Thiohydroxyhomosildenafil and identification of sildenafil, thiosildenafil, phentolamine and tetrahydropalmatine as adulterants. J. Pharm. Biomed. 2012, 63, 135–150. [Google Scholar] [CrossRef]
  10. Cai, Y.; Cai, T.-G.; Shi, Y.; Cheng, X.-L.; Ma, L.-Y.; Ma, S.-C.; Lin, R.-C.; Feng, W. Simultaneous determination of eight PDE5-Is potentially adulterated in herbal dietary supplements with TLC and HPLC-PDA-MS methods. J. Liq. Chromatogr. Relat. Technol. 2010, 33, 1287–1306. [Google Scholar] [CrossRef]
  11. Zou, P.; Oh, S.S.; Hou, P.; Low, M.Y.; Koh, H.L. Simultaneous determination of synthetic Phosphodiesterase-5 inhibitors found in a dietary supplement and Pre-Mixed bulk powders for dietary supplements using High-Performance liquid chromatography with diode array detection and liquid Chromatography–Electrospray ionization tandem mass spectrometry. J. Chromatogr. A 2006, 1104, 113–122. [Google Scholar] [PubMed]
  12. Kim, S.-H.; Kim, H.-J.; Son, J.-H.; Jeon, B.-W.; Jeong, E.-S.; Cha, E.-J.; Lee, J.-I. Simultaneous determination of synthetic Phosphodiesterase-5 inhibitors in dietary supplements by liquid Chromatography-High resolution/mass spectrometry. Mass Spectrom. Lett. 2012, 3, 50–53. [Google Scholar] [CrossRef]
  13. Clewell, A.; Qureshi, I.; Endres, J.; Horvath, J.; Financsek, I.; Neal-Kababick, J.; Jade, K.; Schauss, A.G. Toxicological evaluation of a dietary supplement formulated for male sexual health prior to market release. Regul. Toxicol. Pharm. 2010, 57, 55–61. [Google Scholar] [CrossRef] [PubMed]
  14. Venhuis, B.J.; Barends, D.M.; Zwaagstra, M.E.; de Kaste, D. Recent Developments in Counterfeits and Imitations of Viagra, Cialis and Levitra: A 2005–2006 Update; RIVM Report 37003001/2007; National Institute for Public-Health and the Environment: Utrecht, The Netherlands, 2007. [Google Scholar]
  15. Pissarnitski, D. Phosphodiesterase 5 (PDE 5) inhibitors for the treatment of male erectile disorder: Attaining selectivity versus PDE6. Med. Res. Rev. 2006, 26, 369–395. [Google Scholar] [CrossRef] [PubMed]
  16. Lee, H.M.; Lee, B.J. A novel approach to simultaneous screening and confirmation of regulated pharmaceutical compounds in dietary supplements by LC/MS/MS with an Information-Dependent acquisition method. Food Addit. Contam. A 2011, 28, 396–407. [Google Scholar] [CrossRef]
  17. Savaliya, A.A.; Shah, R.P.; Prasad, B.; Singh, S. Screening of Indian aphrodisiac ayurvedic/herbal healthcare products for adulteration with sildenafil, tadalafil and/or vardenafil using LC/PDA and extracted ion LC-MS/TOF. J. Pharm. Biomed. 2010, 52, 406–409. [Google Scholar] [CrossRef]
  18. Oh, S.S.; Zou, P.; Low, M.Y.; Koh, H.L. Detection of sildenafil analogues in herbal products for erectile dysfunction. J. Toxicol. Environ. Health A 2006, 69, 1951–1958. [Google Scholar]
  19. Park, M.; Ahn, S. Quantitative analysis of sildenafil and tadalafil in various fake drugs recently distributed in Korea. J. Forensic Sci. 2012, 57, 1637–1640. [Google Scholar] [CrossRef]
  20. Song, F.; El-Demerdash, A.; Lee, S.J. Screening for multiple phosphodiesterase type 5 inhibitor drugs in dietary supplement materials by flow injection mass spectrometry and their quantification by liquid chromatography tandem mass spectrometry. J. Pharm. Biomed. 2012, 70, 40–46. [Google Scholar] [CrossRef]
  21. Fryčák, P.; Hartmanová, L.; Lorencová, I.; Lemr, K. Screening of synthetic Phosphodiesterase-5 inhibitors in herbal dietary supplements using Transmission-Mode desorption electrospray and High-Resolution mass spectrometry. J. Mass Spectrom. 2016, 51, 358–362. [Google Scholar] [CrossRef]
  22. Mokhtar, S.U.; Chin, S.T.; Kee, C.L.; Low, M.Y.; Drummer, O.H.; Marriott, P.J. Rapid determination of sildenafil and its analogues in dietary supplements using gas Chromatography–Triple quadrupole mass spectrometry. J. Pharm. Biomed. 2016, 121, 188–196. [Google Scholar] [CrossRef] [PubMed] [Green Version]
  23. Bujang, N.B.; Chee, C.F.; Heh, C.H.; Rahman, N.A.; Buckle, M.J.C. Phosphodiesterase-5 inhibitors and their analogues as adulterants of herbal and food products: Analysis of the Malaysian market, 2014–2016. Food Addit. Contam. A 2017, 34, 1101–1109. [Google Scholar] [CrossRef] [PubMed]
  24. Ding, B.; Wang, Z.; Xie, J.; Zeng, G.; Chen, W. Phosphodiesterase-5 inhibitors in Chinese tonic liquors by liquid chromatography coupled with quadrupole time of flight mass spectrometry. Food Addit. Contam. B 2018, 11, 214–222. [Google Scholar] [CrossRef] [PubMed]
  25. Wang, X.-B.; Zheng, J.; Li, J.-J.; Yu, H.-Y.; Li, Q.-Y.; Xu, L.-H.; Liu, M.-J.; Xian, R.-Q.; Sun, Y.-E.; Liu, B.-J. Simultaneous analysis of 23 illegal adulterated aphrodisiac chemical ingredients in health foods and Chinese traditional patent medicines by ultrahigh performance liquid chromatography coupled with quadrupole Time-Of-Flight mass spectrometry. J. Food Drug Anal. 2018, 26, 1138–1153. [Google Scholar] [CrossRef] [PubMed] [Green Version]
  26. Jiru, M.; Stranska-Zachariasova, M.; Dzuman, Z.; Hurkova, K.; Tomaniova, M.; Stepan, R.; Cuhra, P.; Hajslova, J. Analysis of phosphodiesterase type 5 inhibitors as possible adulterants of Botanical-Based dietary supplements: Extensive survey of preparations available at the Czech market. J. Pharm. Biomed. 2019, 164, 713–724. [Google Scholar] [CrossRef]
  27. Lee, J.H.; Park, H.N.; Park, S.; Lee, Y.-M.; Kang, H. Development of a specific fragment Pattern-Based Quadrupole-Orbitrap mass spectrometry method to screen adulterated products of Phosphodiesterase-5 inhibitors and their analogues. Sci. Justice 2019, 59, 433–441. [Google Scholar] [CrossRef]
  28. Yusop, A.Y.M.; Xiao, L.; Fu, S. Determination of phosphodiesterase 5 (PDE5) inhibitors in instant coffee premixes using liquid chromatography–high-resolution mass spectrometry (LC–HRMS). Talanta 2019, 204, 36–43. [Google Scholar] [CrossRef]
  29. Shi, S.; Wu, Y.; Zhou, M.; Cheng, Q. Simultaneous analysis of 31 Anti-Impotence compounds potentially illegally added to Herbal-Based dietary supplements by Ultra-High-Performance liquid chromatography coupled with quadrupole Time-Of-Flight mass spectrometry. J. Chromatogr. B 2020, 1144, 122077. [Google Scholar] [CrossRef]
  30. Park, H.J.; Jeong, H.K.; Chang, M.I.; Im, M.H.; Jeong, J.Y.; Choi, D.M.; Park, K.; Hong, M.K.; Youm, J.; Han, S.B.; et al. Structure determination of new analogues of vardenafil and sildenafil in dietary supplements. Food Addit. Contam. 2007, 24, 122–129. [Google Scholar] [CrossRef]
  31. Gratz, S.R.; Gamble, B.M.; Flurer, R.A. Accurate mass measurement using Fourier transform ion cyclotron resonance mass spectrometry for structure elucidation of designer drug analogs of tadalafil, vardenafil and sildenafil in herbal and pharmaceutical matrices. Rapid Commun. Mass Spectrom. 2006, 20, 2317–2327. [Google Scholar] [CrossRef]
  32. Inoue, S.; Mitsunori, S.M.; Ogasawara, M.; Osamu, E.; Gen, S. Simultaneous determination of medicinal ingredients in So-Called Health-Promoting food using liquid chromatography tandem mass spectrometry with a pentafluorophenyl stationary phase. J. Health Sci. 2009, 55, 183–191. [Google Scholar] [CrossRef] [Green Version]
  33. Ge, X.; Low, M.-Y.; Zou, P.; Lin, L.; Yin, S.O.S.; Bloodworth, B.C.; Koh, H.-L. Structural elucidation of a PDE-5 inhibitor detected as an adulterant in a health supplement. J. Pharm. Biomed. 2008, 48, 1070–1075. [Google Scholar] [CrossRef] [PubMed]
  34. Hasegawa, T.; Takahashi, K.; Saijo, M.; Ishii, T.; Nagata, T.; Kurihara, M.; Haishima, Y.; Goda, Y.; Kawahara, N. Isolation and structural elucidation of cyclopentynafil and N-Octylnortadalafil found in a dietary supplement. Chem. Pharm. Bull. 2009, 57, 185–189. [Google Scholar] [CrossRef] [PubMed] [Green Version]
  35. Reepmeyer, J.C.; d’Avignon, D.A. Structure elucidation of thioketone analogues of sildenafil detected as adulterants in herbal aphrodisiacs. J. Pharm. Biomed. 2009, 49, 145–150. [Google Scholar] [CrossRef] [Green Version]
  36. Zou, P.; Hou, P.; Oh, S.S.-Y.; Chong, Y.M.; Bloodworth, B.C.; Low, M.-Y.; Koh, H.-L. Isolation and identification of thiohomosildenafil and thiosildenafil in health supplements. J. Pharm. Biomed. 2008, 47, 279–284. [Google Scholar] [CrossRef]
  37. Hou, P.; Zou, P.; Low, M.Y.; Chan, E.; Koh, H.L. Structural identification of a new acetildenafil analogue from Pre-Mixed bulk powder intended as a dietary supplement. Food Addit. Contam. 2006, 23, 870–875. [Google Scholar] [CrossRef]
  38. Zou, P.; Hou, P.; Low, M.Y.; Koh, H.L. Structural elucidation of a tadalafil analogue found as an adulterant of a herbal product. Food Addit. Contam. 2006, 23, 446–451. [Google Scholar] [CrossRef]
  39. Schwartz, J.C.; Senko, M.W.; Syka, J.E. A Two-Dimensional quadrupole ion trap mass spectrometer. J. Am. Soc. Mass Spectrom. 2002, 13, 659–669. [Google Scholar] [CrossRef] [Green Version]
  40. David, H.; Russell, R.D.E. High-Resolution mass spectrometry and accurate mass measurements with emphasis on the characterization of peptides and proteins by Matrix-Assisted laser desorption/ionization Time-Of-Flight mass spectrometry. J. Mass Spectrom. 1997, 32, 263–276. [Google Scholar]
  41. Gadgil, H.S.; Pipes, G.D.; Dillon, T.M.; Treuheit, M.J.; Bondarenko, P.V. Improving mass accuracy of high performance liquid chromatography/electrospray ionization Time-Of-Flight mass spectrometry of intact antibodies. J. Am. Soc. Mass Spectrom. 2006, 17, 867–872. [Google Scholar] [CrossRef] [Green Version]
  42. Dafang, Z.; Xie, J.; Shuqiu, Z.; Lu, S. Study of the electrospray ionization tandem mass spectrometry of sildenafil derivatives. Rapid Commun. Mass Spectrom. 2002, 16, 1836–1843. [Google Scholar]
Sample Availability: Samples of the compounds are not available from the authors.
Figure 1. Extracted ion chromatograms of PDE-5 inhibitors and their analogs: Sildenafil (1), carbodenafil (2), demethylhongdenafil (3), hydroxyhongdenafil (4), hongdenafil (5), hydroxyhomosildenafil (6), piperidinohongdenafil (7), homosildenafil (8), dimethylsildenafil (9), udenafil (10), cyclopentinafil (11), thiosildenafil (12), hydroxythiohomosildenafil (13), thiohomosildenafil (14), dimethylthiosildenafil (15), oxohongdenafil (16), benzylsildenafil (17), hydroxychlorodenafil (18), chlorodenafil (19), nitrodenafil (20), nor-neosildenafil (21), dichlorodenafil (22), vardenafil (23), acetylvardenafil (24), hydroxyvardenafil (25), nor-neovardenafil (26), desulfovardenafil (27), pseudovardenafil (28), tadalafil (29), aminotadalafil (30), acetaminotadalafil (31), demethyltadalafil (32), chloropretadalafil (33), N-octyltadalafil (34), yohimbine (35), mirodenafil (36), thioquinapiperifil (37), xanthoanthrafil (38), and phenolphthalein (39). * indicated the analytes among multiple peaks in the EIC.
Molecules 25 02734 g001
Figure 2. Representative MSn (n = 2, 3) spectra and proposed fragmentation mechanisms of sildenafil (A) and thiosildenafil (B). The bracketed numbers next to the m/z values indicate the charge state of the ions.
Molecules 25 02734 g002
Figure 3. Representative MSn (n = 2, 3) spectra and proposed fragmentation mechanisms of vardenafil (A) and tadalafil (B). The bracketed numbers next to the m/z values indicate the charge state of the ions.
Molecules 25 02734 g003
Figure 4. Representative MSn (n = 2, 3) spectra and proposed fragmentation mechanisms of mirodenafil (A) and xanthoanthrafil (B). The bracketed numbers next to the m/z values indicate the charge state of the ions.
Molecules 25 02734 g004
Figure 5. Representative MSn (n = 2, 3) spectra and proposed fragmentation mechanisms of thioquinapiperifil (A) and yohimbine (B). The bracketed numbers next to the m/z values indicate the charge state of the ions.
Molecules 25 02734 g005
Figure 6. MSn (n = 2, 3) spectra, total ion chromatograms, and library search results for real samples. (A) MS2 and MS3 spectra of sample 1, (B) chromatogram and corresponding MS spectrum of sample 1, (C) library search result for sample 1, (D) MS2 and MS3 spectra of sample 2, (E) chromatogram and corresponding MS spectrum of sample 2, and (F) library search result for sample 2.
Molecules 25 02734 g006
Table 1. Retention times and mass errors of PDE-5 inhibitors and their analogs.
CompoundRetention Time (min)Elemental CompositionMeasured MassTheoretical Massm
(mDa)
Mass Error
(ppm ± SD a)
Sildenafil12.6C22H30N6O4S475.2125475.21220.300.63 ± 2.21
Carbodenafil9.3C24H32N6O3453.2599453.2609−1.02−2.26 ± 0.54
Demethylhongdenafil9.3C24H32N6O3453.2618453.26090.942.08 ± 3.68
Hydroxyhongdenafil9.9C25H34N6O4483.2728483.27141.412.91 ± 1.70
Hongdenafil10.6C25H34N6O3467.2753467.2765−1.19−2.55 ± 3.09
Hydroxyhomosildenafil10.9C23H32N6O5S505.2215505.2228−1.26−2.49 ± 2.36
Piperidinohongdenafil11.2C24H31N5O3438.2505438.25000.481.10 ± 1.47
Homosildenafil13.0C23H32N6O4S489.2278489.2279−0.06−0.12 ± 0.42
Dimethylsildenafil13.7C23H32N6O4S489.2291489.22791.242.54 ± 0.95
Udenafil15.0C25H36N6O4S517.2567517.2592−2.52−4.48 ± 0.63
Cyclopentinafil16.2C26H36N6O4S529.2591529.2592−0.09−0.17 ± 0.52
Thiosildenafil23.6C22H30N6O3S2491.1882491.1893−1.09−2.22 ± 0.94
Hydroxythiohomosildenafil23.7C23H32N6O4S2521.1956521.1999−4.32−8.30 ± 2.15
Thiohomosildenafil24.4C23H32N6O3S2505.2013505.2050−3.73−7.37 ± 2.56
Dimethylthiosildenafil25.1C23H32N6O3S2505.2018505.2050−3.23−6.38 ± 2.42
Oxohongdenafil28.9C25H32N6O4481.2569481.25581.112.30 ± 1.22
Benzylsildenafil30.6C28H34N6O4S551.2403551.2435−3.19−5.79 ± 1.20
Hydroxychlorodenafil40.5C19H23N4O3Cl391.1528391.1531−0.28−0.72 ± 1.60
Chlorodenafil48.4C19H21N4O3Cl389.1377389.13750.170.43 ± 1.10
Nitrodenafil49.6C17H19N5O4358.1512358.15100.170.47 ± 1.59
Nor-neosildenafil51.7C22H29N5O4S460.2014460.20130.080.18 ± 1.72
Dichlorodenafil53.6C19H20N4O2Cl2407.1038407.10360.200.49 ± 1.81
Vardenafil11.1C23H32N6O4S489.2296489.22791.673.42 ± 0.86
Acetylvardenafil9.3C25H34N6O3467.2758467.2765−0.69−1.48 ± 5.47
Hydroxyvardenafil10.9C23H32N6O5S505.2209505.2228−1.86−3.68 ± 0.84
Nor-neovardenafil23.9C18H20N4O4357.1557357.1557−0.02−0.05 ± 0.86
Desulfovardenafil37.1C17H20N4O2313.1651313.1659−0.80−2.55 ± 0.88
Pseudovardenafil48.5C22H29N5O4S460.2013460.2013−0.05−0.11 ± 0.64
Tadalafil29.8C22H19N3O4390.1449390.14480.100.26 ± 1.42
Aminotadalafil24.4C21H18N4O4391.1410391.14010.882.26 ± 1.57
Acetaminotadalafil24.6C23H20N4O5433.1502433.1506−0.42−0.96 ± 1.81
Demethyltadalafil25.5C21H17N3O4376.1293376.12920.070.18 ± 1.36
Chloropretadalafil48.5C22H19N2O5Cl427.1031427.1055−2.42−5.66 ± 1.62
N-Octyltadalafil53.1C29H33N3O4488.2559488.25441.483.04 ± 3.23
Yohimbine6.4C21H26N2O3532.2580532.2588−0.82−1.55 ± 0.97
Mirodenafil22.4C26H37N5O5S355.2012355.2016−0.43−1.22 ± 1.73
Thioquinapiperifil10.8C24H28N6OS449.2098449.2118−1.96−4.36 ± 2.06
Xanthoanthrafil30.2C19H23N3O6390.1660390.1660−0.02−0.04 ± 1.94
IS b (Phenolphthalein)27.7C20H14O4319.0934319.0965−3.109.72
a Standard deviation; b Internal standard.
Table 2. Linear regression equations and linear correlation coefficients of PDE-5 inhibitors and their analogs.
CompoundEquationRange (μg/mL)R2
Sildenafily = 0.169 x + 0.0060.30–0.800.993
Carbodenafily = 0.430 x − 0.0080.16–0.430.997
Hongdenafily = 0.783 x + 0.0370.38–1.000.997
Hydroxyhongdenafily = 0.506 x + 0.1700.30–0.800.994
Demethylhongdenafily = 0.403 x + 0.0200.32–0.850.996
Piperidinohongdenafily = 0.504 x + 0.0520.28–0.740.996
Hydroxyhomosildenafily = 0.490 x + 0.0740.74–1.980.994
Homosildenafily = 0.321 x + 0.0250.20–0.550.998
Dimethylsildenafily = 0.409 x + 0.0300.30–0.800.995
Udenafily = 0.504 x + 0.1330.30–0.800.999
Cyclopentinafily = 0.389 x + 0.0400.30–0.800.997
Thiosildenafily = 0.165 x + 0.0261.20–3.200.996
Hydroxythiohomosildenafily = 0.198 x + 0.0030.75–2.000.998
Thiohomosildenafily = 0.252 x + 0.0070.15–0.400.993
Dimethylthiosildenafily = 0.255 x − 0.0100.18–0.470.995
Oxohongdenafily = 0.237 x + 0.0340.60–1.600.993
Benzylsildenafily = 0.157 x + 0.0100.31–0.840.993
Hydroxychlorodenafily = 0.302 x + 0.0110.25–0.660.998
Chlorodenafily = 0.341 x + 0.3861.50–4.000.990
Nitrodenafily = 0.444 x + 0.0160.15–0.400.994
Nor-neosildenafily = 0.356 x + 0.0200.20–0.540.993
Dichlorodenafily = 0.107 x + 0.0170.38–1.000.992
Vardenafily = 0.381 x + 0.0140.15–0.400.999
Acetylvardenafily = 0.501 x + 0.0460.31–0.830.992
Hydroxyvardenafily = 0.610 x + 0.0550.75–2.000.998
Nor-neovardenafily = 0.729 x + 0.0270.17–0.450.993
Desulfovardenafily = 1.289 x + 0.0520.15–0.400.991
Pseudovardenafily = 0.912 x + 0.0450.15–0.400.992
Tadalafily = 0.090 x + 0.0150.70–1.870.997
Aminotadalafily = 0.048 x + 0.0181.20–3.200.997
Acetaminotadalafily = 0.108 x + 0.0220.38–1.000.990
Demethyltadalafily = 0.088 x + 0.0150.75–2.000.993
Chloropretadalafily = 0.027 x + 0.0441.20–3.200.992
N-Octyltadalafily = 0.043 x + 0.0190.75–2.000.996
Yohimbiney = 0.539 x + 0.0280.13–0.340.995
Mirodenafily = 0.939 x + 0.0040.17–0.450.991
Thioquinapiperifily = 0.198 x − 0.0160.15–0.400.994
Xanthoanthrafily = 0.176 x + 0.0200.60–1.600.992
Table 3. Intra- and inter-day accuracy and precision of PDE-5 inhibitors and their analogs.
CompoundIntra-Day (n = 5)Inter-Day (n = 5)
Accuracy (%)Precision (CV %)Accuracy (%)Precision (CV %)
L aM bH cLMHLMHLMH
Sildenafil104.2103.7101.65.53.13.999.6103.4100.12.83.61.9
Carbodenafil103.7101.699.74.82.55.2100.9101.796.84.45.14.8
Hongdenafil106.0103.899.24.03.43.197.1103.298.95.94.34.1
Hydroxyhongdenafil101.298.697.64.22.22.094.198.498.25.33.32.0
Demethylhongdenafil102.499.698.75.22.35.594.499.596.94.23.92.5
Piperidinohongdenafil104.0103.496.77.12.82.893.0102.097.65.34.41.8
Hydroxyhomosildenafil107.1104.7101.86.70.73.494.599.998.35.35.33.5
Homosildenafil102.5103.6102.14.33.12.994.5105.197.83.72.13.3
Dimethylsildenafil105.6104.7102.07.81.11.796.0101.1100.01.23.33.3
Udenafil98.9104.7104.73.33.01.493.8103.6100.76.52.26.1
Cyclopentinafil100.2100.9102.24.11.52.395.4102.798.75.46.13.2
Thiosildenafil105.3105.2104.37.52.82.793.3100.6102.24.97.32.0
Hydroxythiohomosildenafil102.9104.2102.55.22.52.797.1104.4101.94.61.65.4
Thiohomosildenafil103.9103.7101.49.24.04.096.099.097.87.94.96.3
Dimethylthiosildenafil99.596.599.93.76.77.696.2101.297.08.46.86.1
Oxohongdenafil98.0101.899.92.32.12.491.3100.499.64.03.41.4
Benzylsildenafil96.296.699.33.13.55.691.899.797.74.33.43.2
Hydroxychlorodenafil92.598.1100.11.42.23.191.199.197.33.13.72.7
Chlorodenafil97.0103.3102.24.64.51.989.7103.097.87.84.23.4
Nitrodenafil98.399.8102.93.73.04.289.7101.0100.69.35.73.3
Nor-neosildenafil105.1105.3100.06.51.42.992.3102.397.43.03.21.9
Dichlorodenafil93.5100.7101.52.66.24.890.9103.497.84.16.33.4
Vardenafil100.898.796.44.43.03.793.0100.495.84.74.42.9
Acetylvardenafil102.1103.099.75.04.73.596.0103.6101.04.12.95.2
Hydroxyvardenafil104.9102.698.75.81.93.196.6100.697.95.95.32.1
Nor-neovardenafil87.896.698.15.93.61.397.0103.197.78.75.91.6
Desulfovardenafil86.794.796.55.23.32.691.1100.997.43.25.41.8
Pseudovardenafil101.0101.2100.53.01.22.891.3101.098.57.34.13.2
Tadalafil94.294.395.73.12.53.491.996.699.17.95.63.4
Aminotadalafil98.497.798.73.23.94.792.6102.399.95.43.51.3
Acetaminotadalafil99.2100.2101.34.66.64.290.399.4100.37.25.73.2
Demethyltadalafil92.1100.7102.44.52.42.689.8102.7101.05.12.03.5
Chloropretadalafil106.7105.6105.02.62.23.598.0105.6105.710.52.92.1
N-Octyltadalafil107.8106.098.17.90.64.895.4103.997.96.55.71.8
Yohimbine106.1104.0101.35.63.43.692.6101.297.06.35.22.1
Mirodenafil107.1100.295.95.11.33.296.2101.295.85.24.14.4
Thioquinapiperifil112.0105.0104.45.12.91.9104.499.3100.03.37.53.6
Xanthoanthrafil91.899.5102.33.02.14.692.699.398.44.94.42.1
a L: The lowest concentration in the calibration curve; b M: Medium concentration in the calibration curve; c H: The highest concentration in the calibration curve.
Table 4. Accurate masses and mass errors for fragment and precursor ions of PDE-5 inhibitors and their analogs.
CompoundElemental CompositionMeasured MassTheoretical Massm (mDa)Error (ppm)
SildenafilC22H30N6O4S a238.1087 b238.1100 b−1.3−5.46
C17H20N4O4S377.1263377.1278−1.5−3.98
C17H19N4O2312.1573312.1581−0.8−2.56
C15H15N4O2284.1221284.1268−4.7−16.54
ThiosildenafilC22H30N6O3S2 a246.0977 b246.0983 b−0.6−2.50
C17H19N4OS328.1344328.1352−0.8−2.44
C15H15N4OS300.1022300.1039−1.7−5.66
VardenafilC23H32N6O4S a245.1168 b245.1176 b−0.8−3.26
C17H19N4O2312.1555312.1581−2.6−8.33
C15H15N4O2284.1253284.1268−1.5−5.28
C8H10N2O151.0877151.08661.17.28
TadalafilC22H19N3O4 a390.1454390.14480.61.54
C15H13N3O2268.1050268.1081−3.1−11.56
C17H11NO2262.0866262.08630.31.14
C14H13N3O240.1099240.1131−3.2−13.33
C12H8N2O197.0707197.0709−0.2−1.01
C11H8N2169.0736169.0760−2.4−14.19
C8H6O2135.0451135.04411.07.40
MirodenafilC26H37N5O5S a266.6326 b266.6330 b−0.4−1.50
C20H24N3O2339.1914339.1941−2.7−7.96
C17H18N3O2297.1444297.1472−2.8−9.42
C23H31N5O5S245.6061 b245.6096 b−3.5−14.25
C23H29N5O4S236.6006 b236.6043 b−3.7−15.64
XanthoanthrafilC19H23N3O6390.1660390.16600.00.00
C9H10O2151.0740151.0754−1.418.17
ThioquinapiperifilC24H28N6OS a225.1093 b225.1095 b−0.2−0.89
C11H11N5S246.0774246.0808−3.4−13.82
C9H7N5S218.0493218.0495−0.2−0.92
C13H17NO204.1343204.1383−4.0−19.59
YohimbineC21H26N2O3 a355.2017355.20160.10.28
C11H17NO3212.1248212.1281−3.3−15.56
C11H15NO2194.1150194.1176−2.6−13.39
C10H9N144.0803144.0808−0.5−3.47
C10H13NO2180.1015180.1019−0.4−2.22
C10H11NO162.0900162.0913−1.3−8.02
C9H11N134.0955134.0964−0.9−6.71
a Precursor ion; b Multiply charged protonated ion [M + 2H]2+.

