The Interaction of Hydrogen with the van der Waals Crystal γ-InSe

 , , ,
, , , 
 ,
, 
Abstract
1. Introduction
2. Results
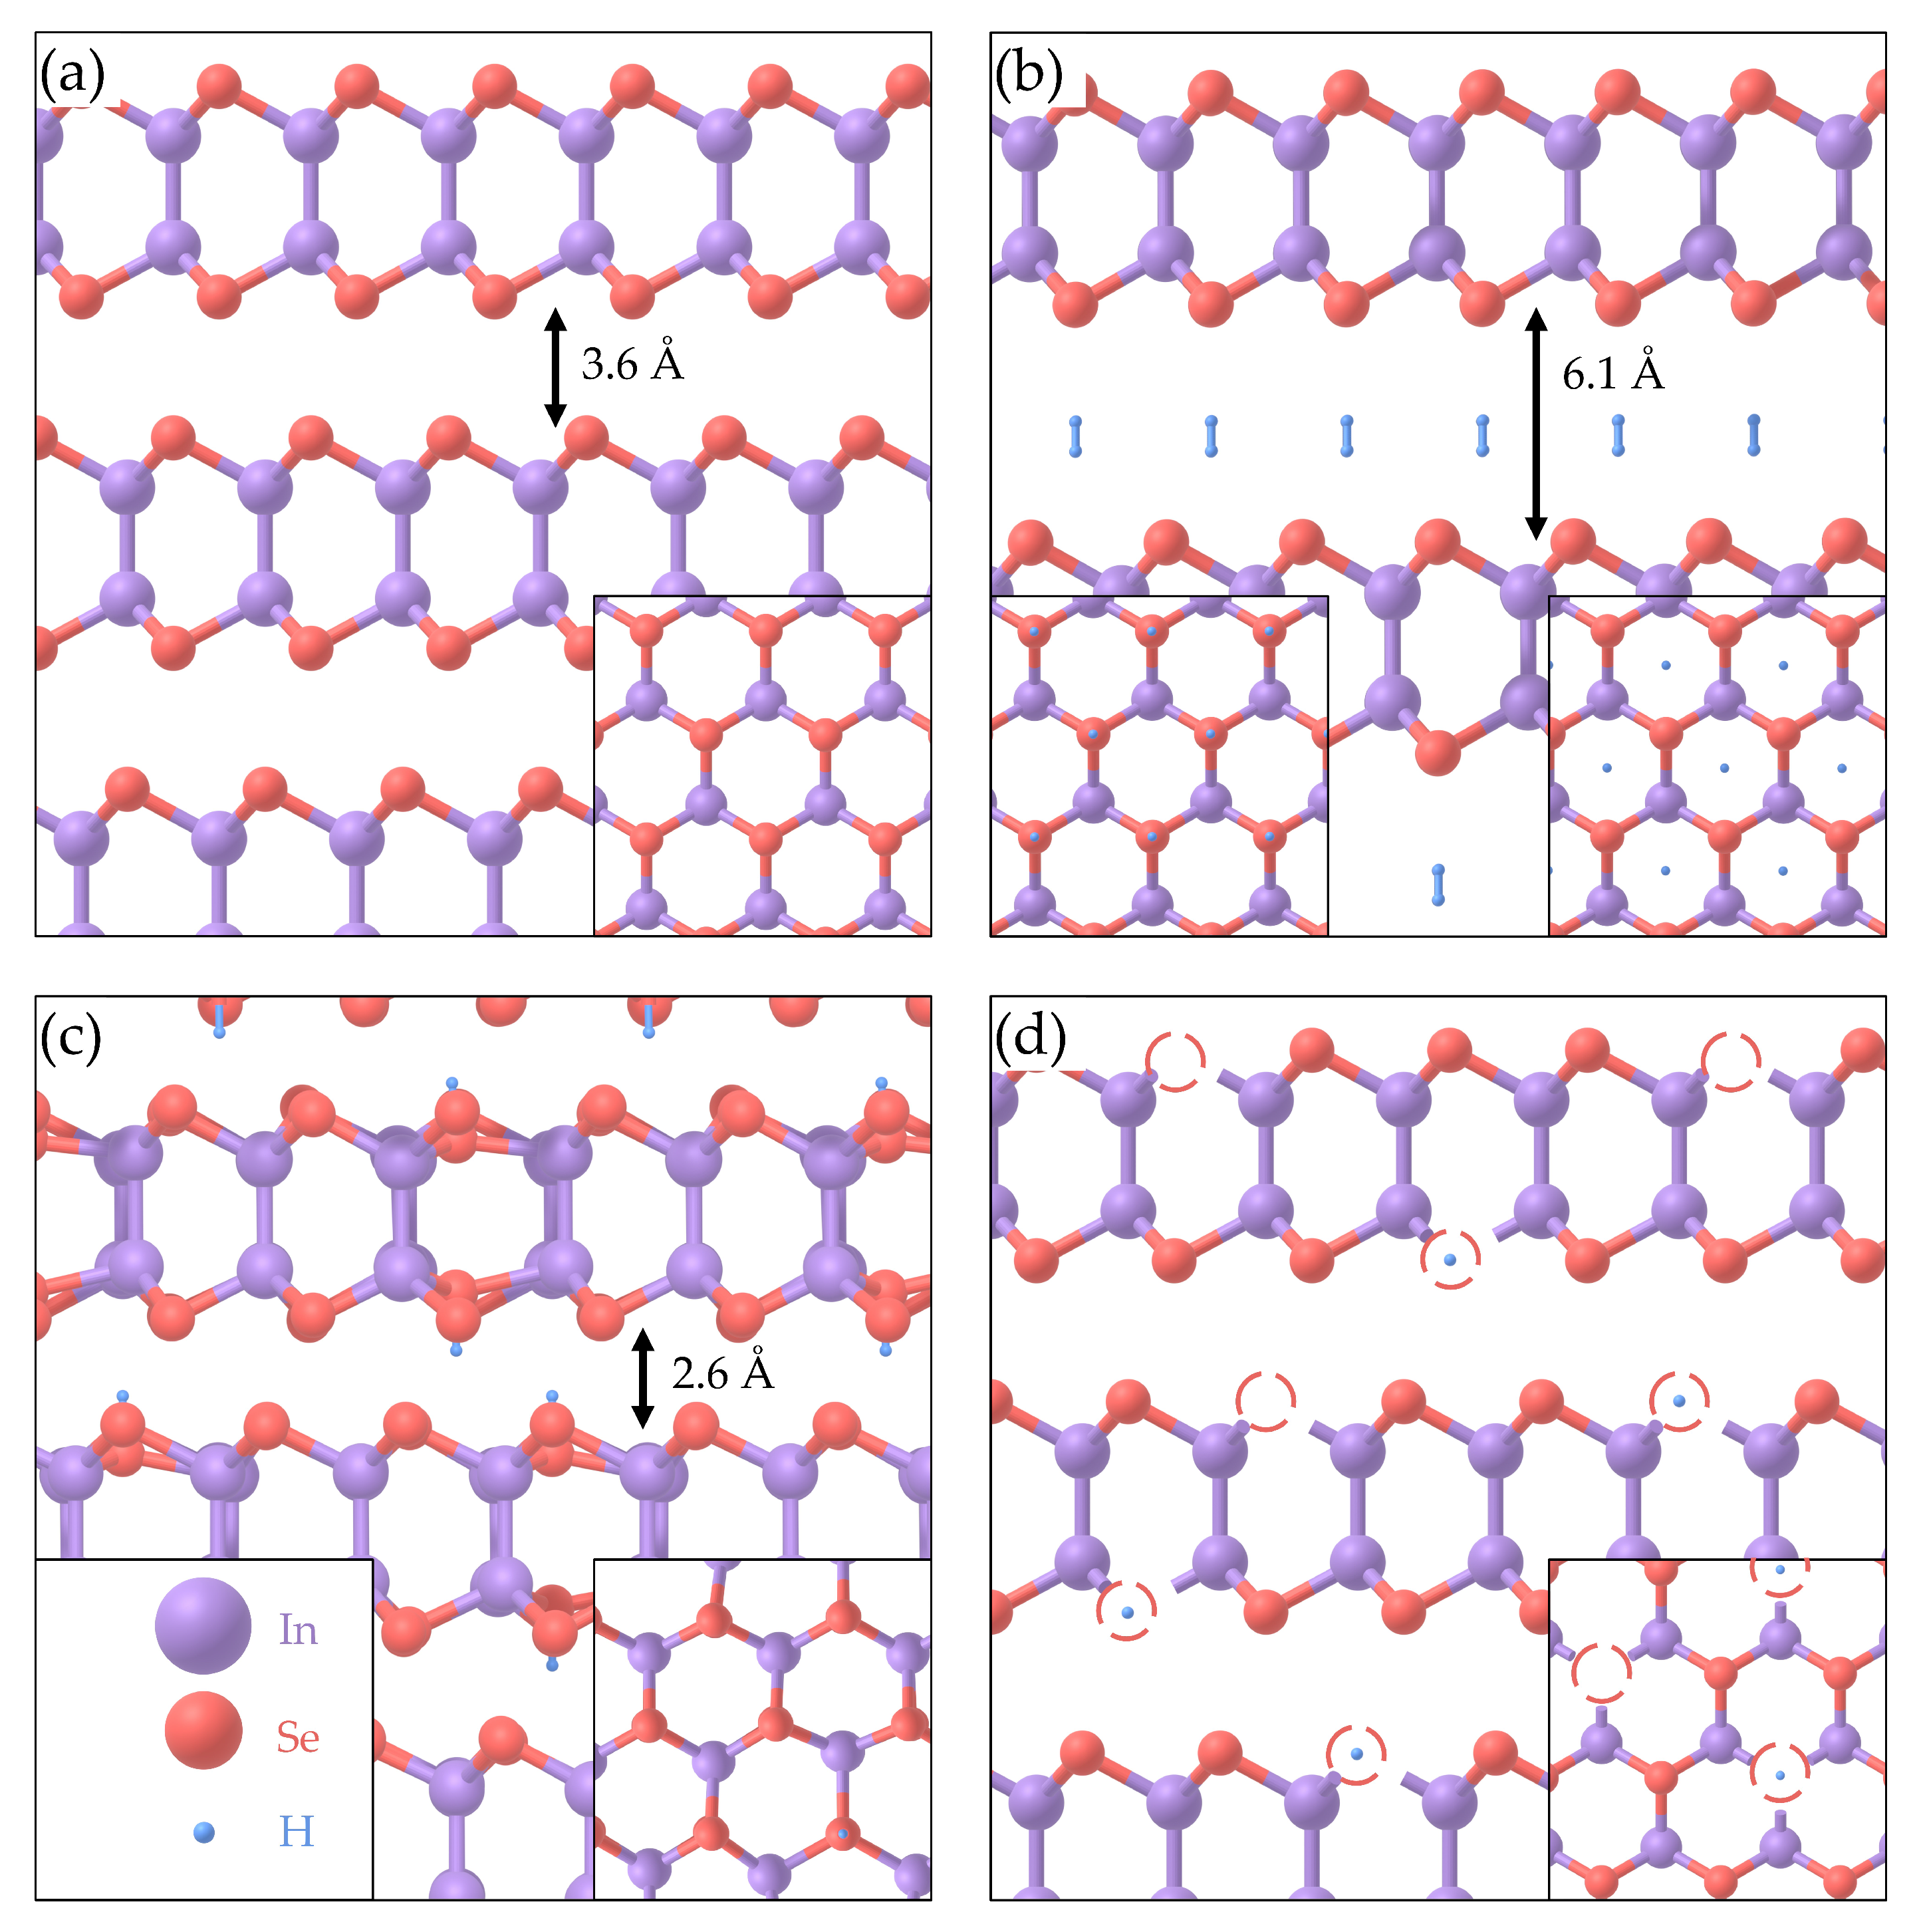
2.1. DFT
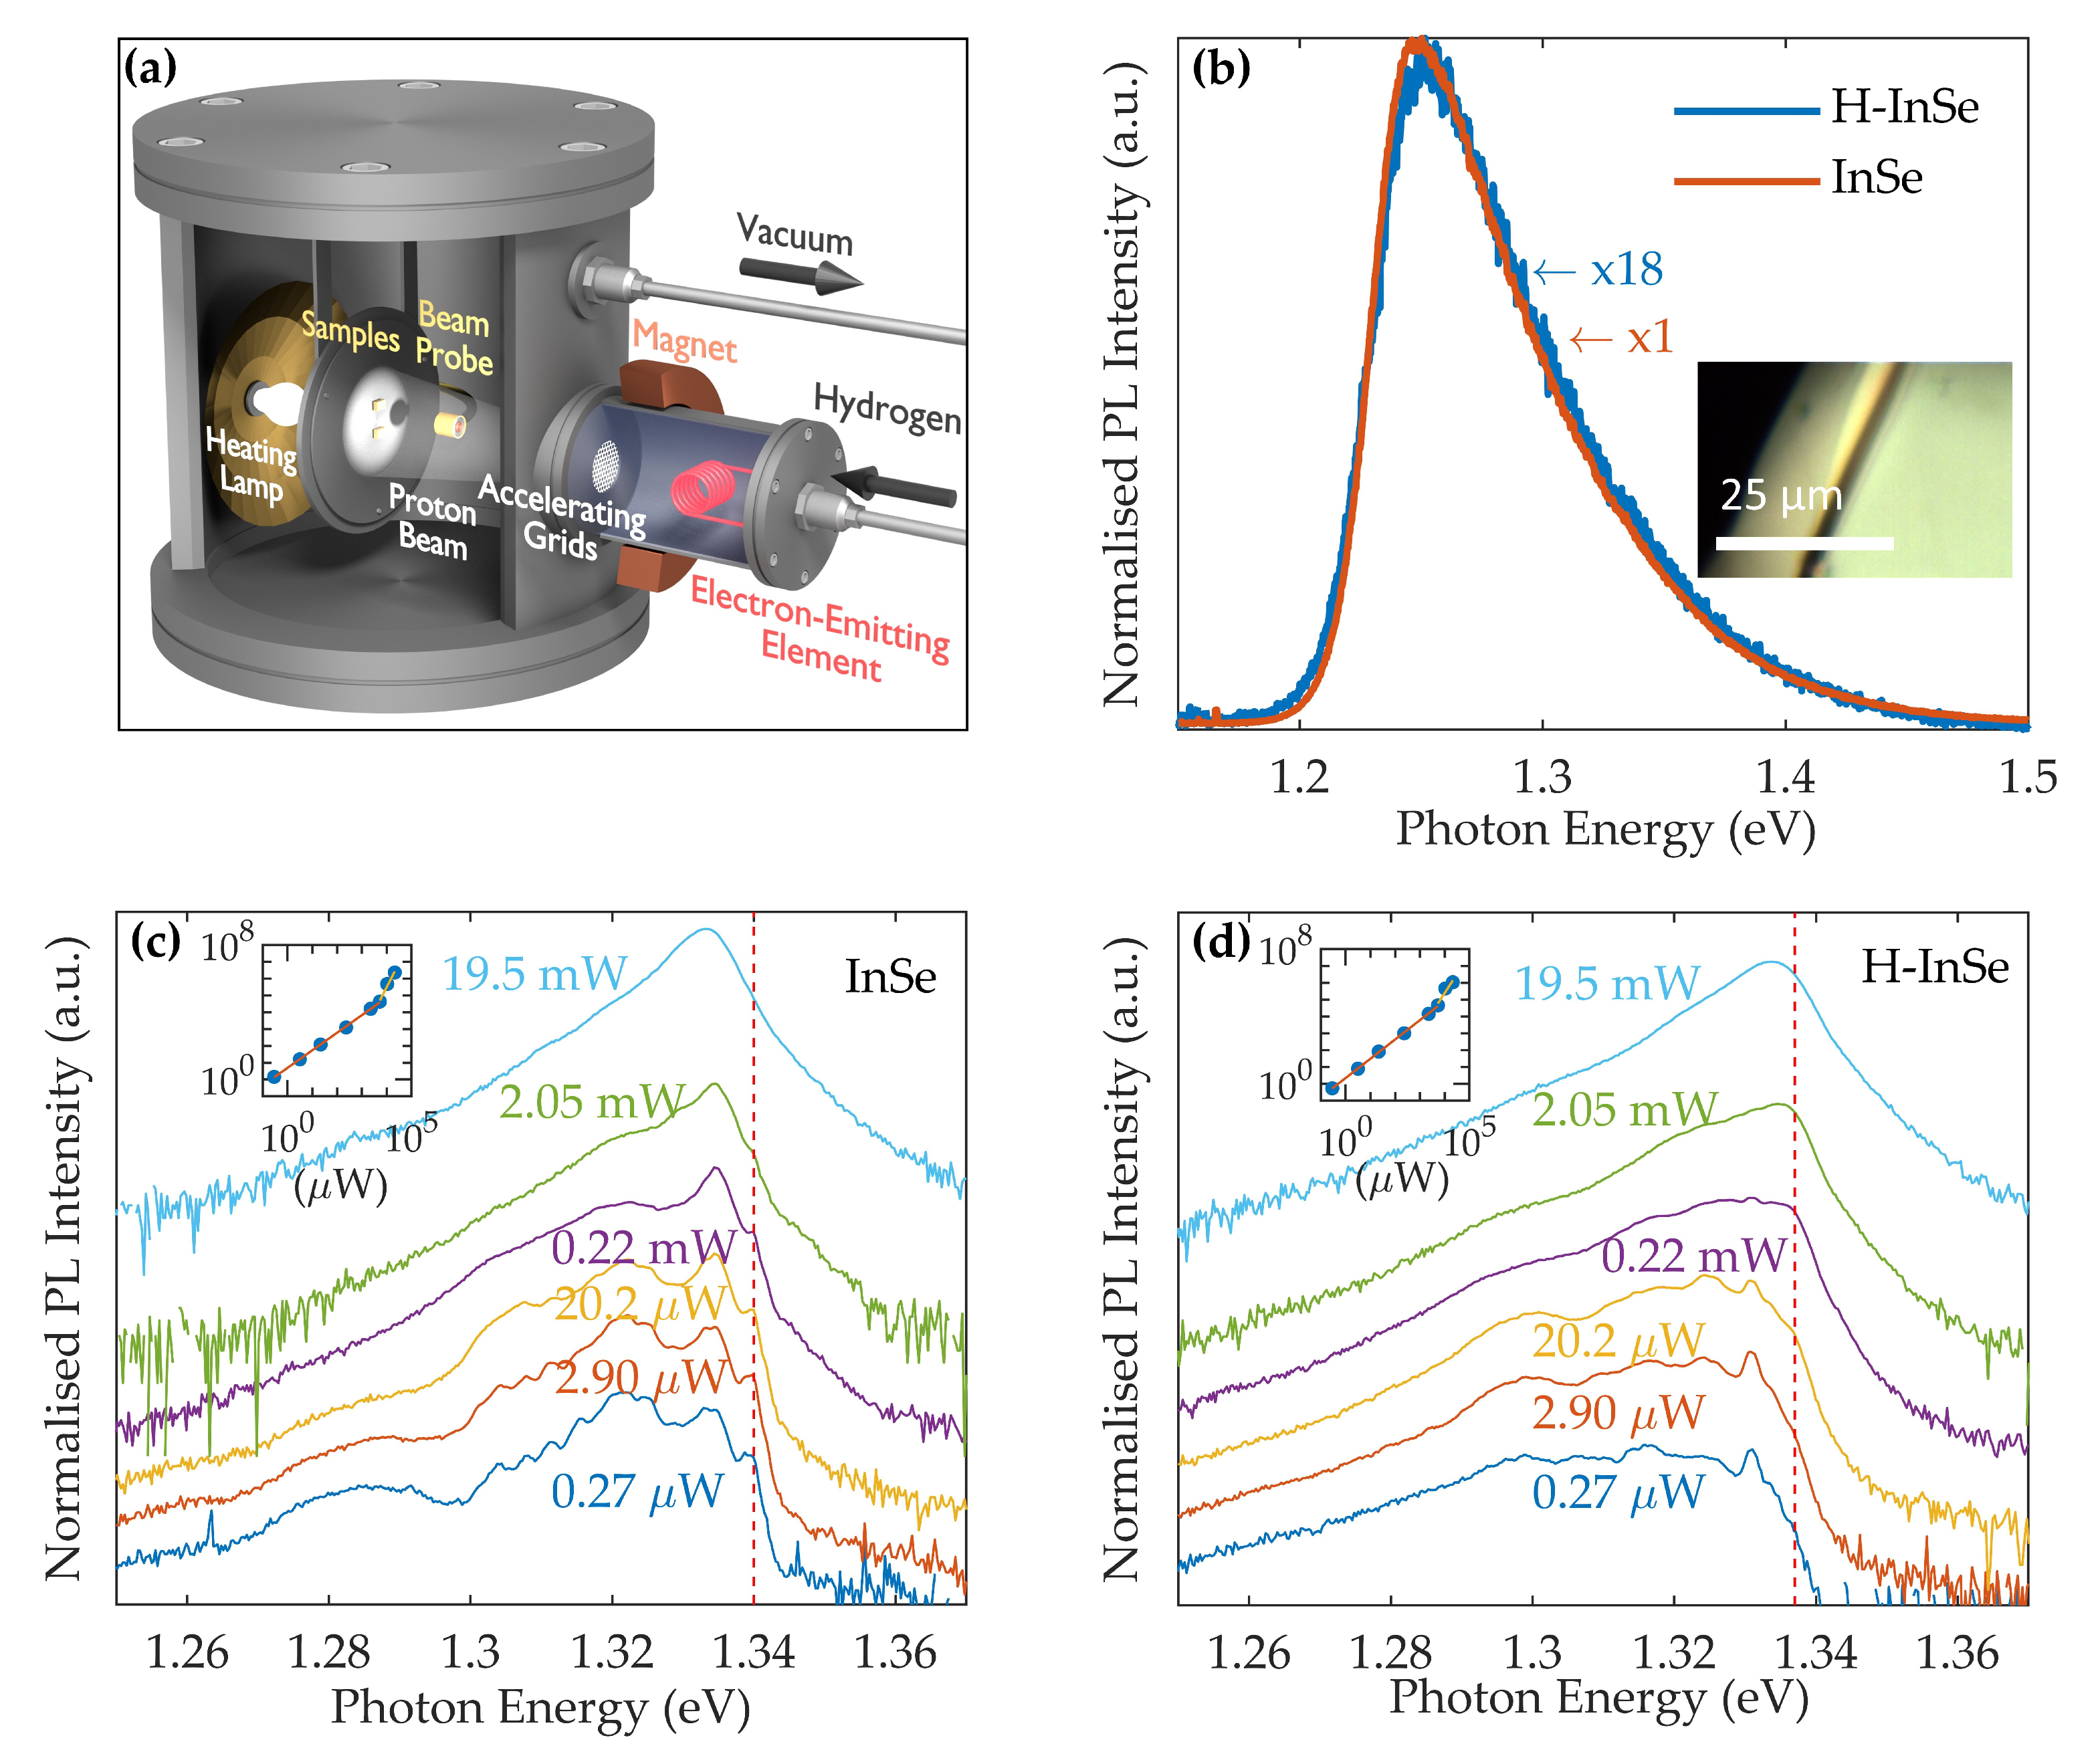
2.2. Photoluminescence
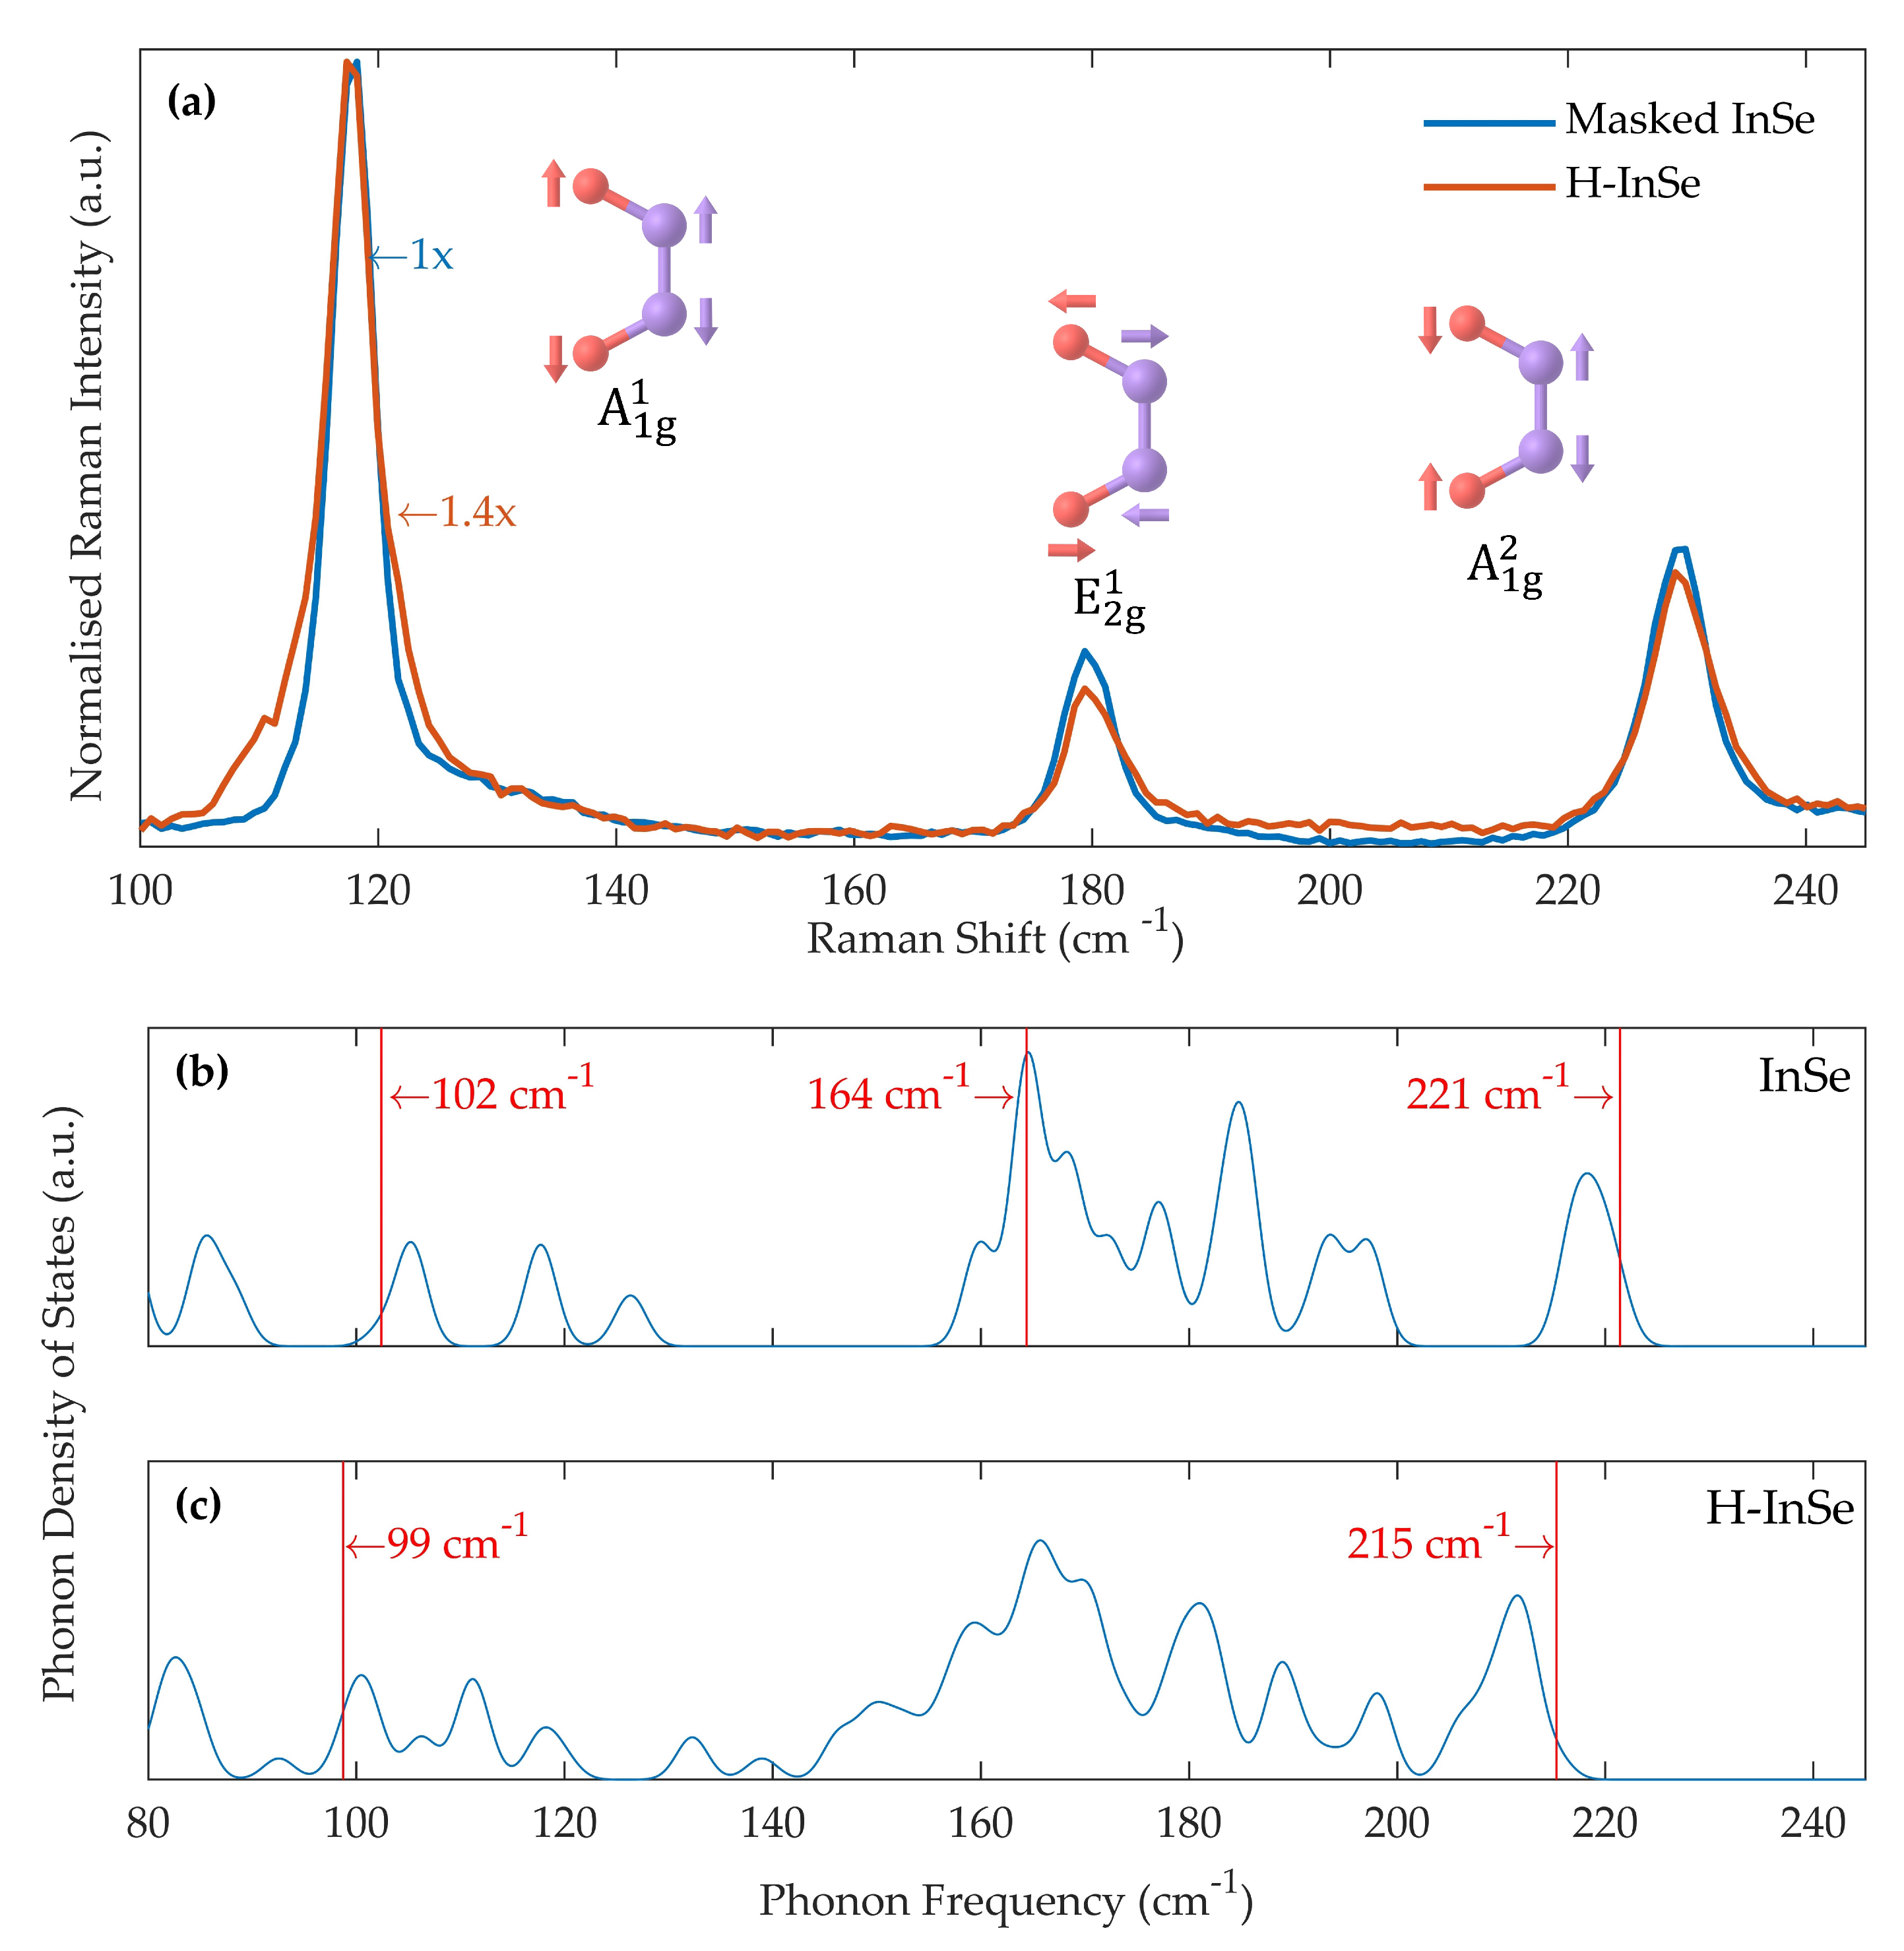
2.3. Raman
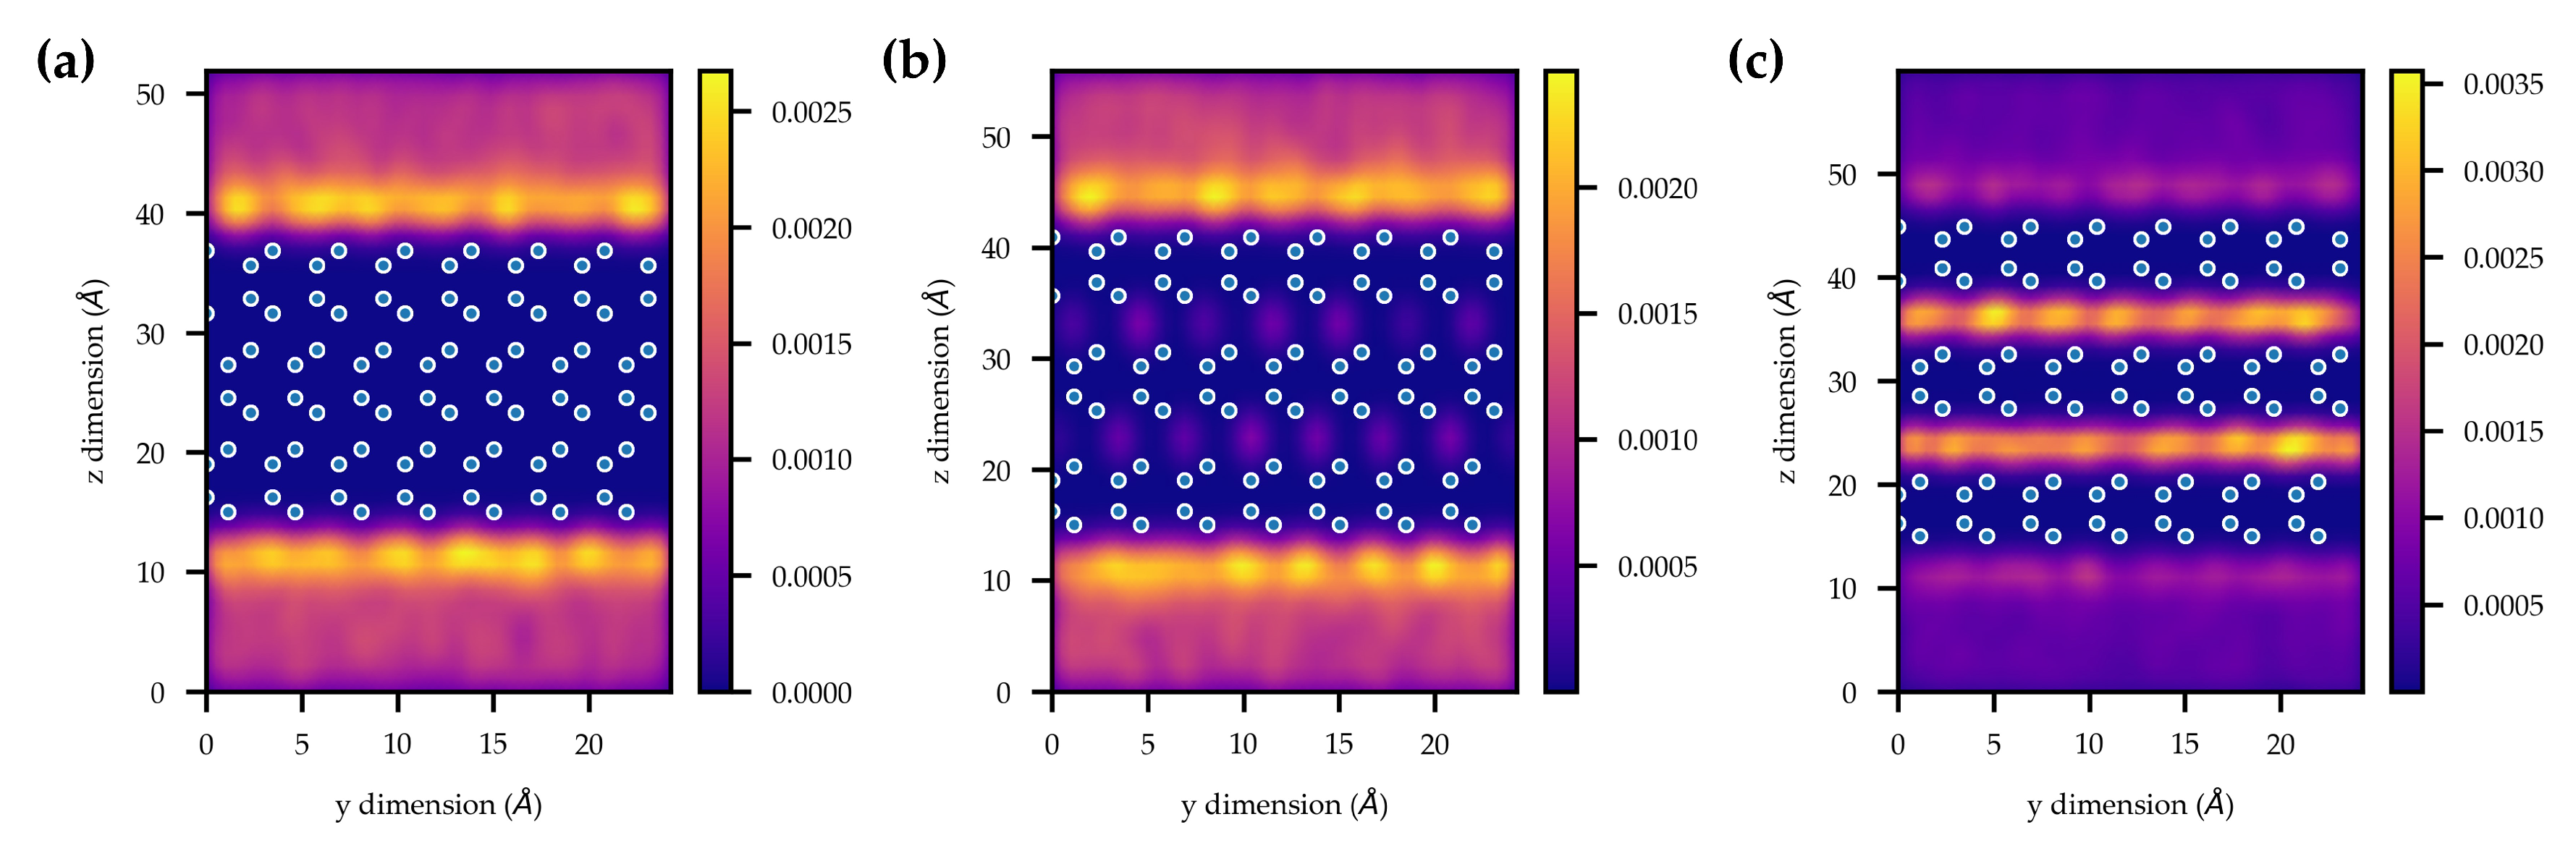
2.4. Grand Canonical Monte Carlo Simulations
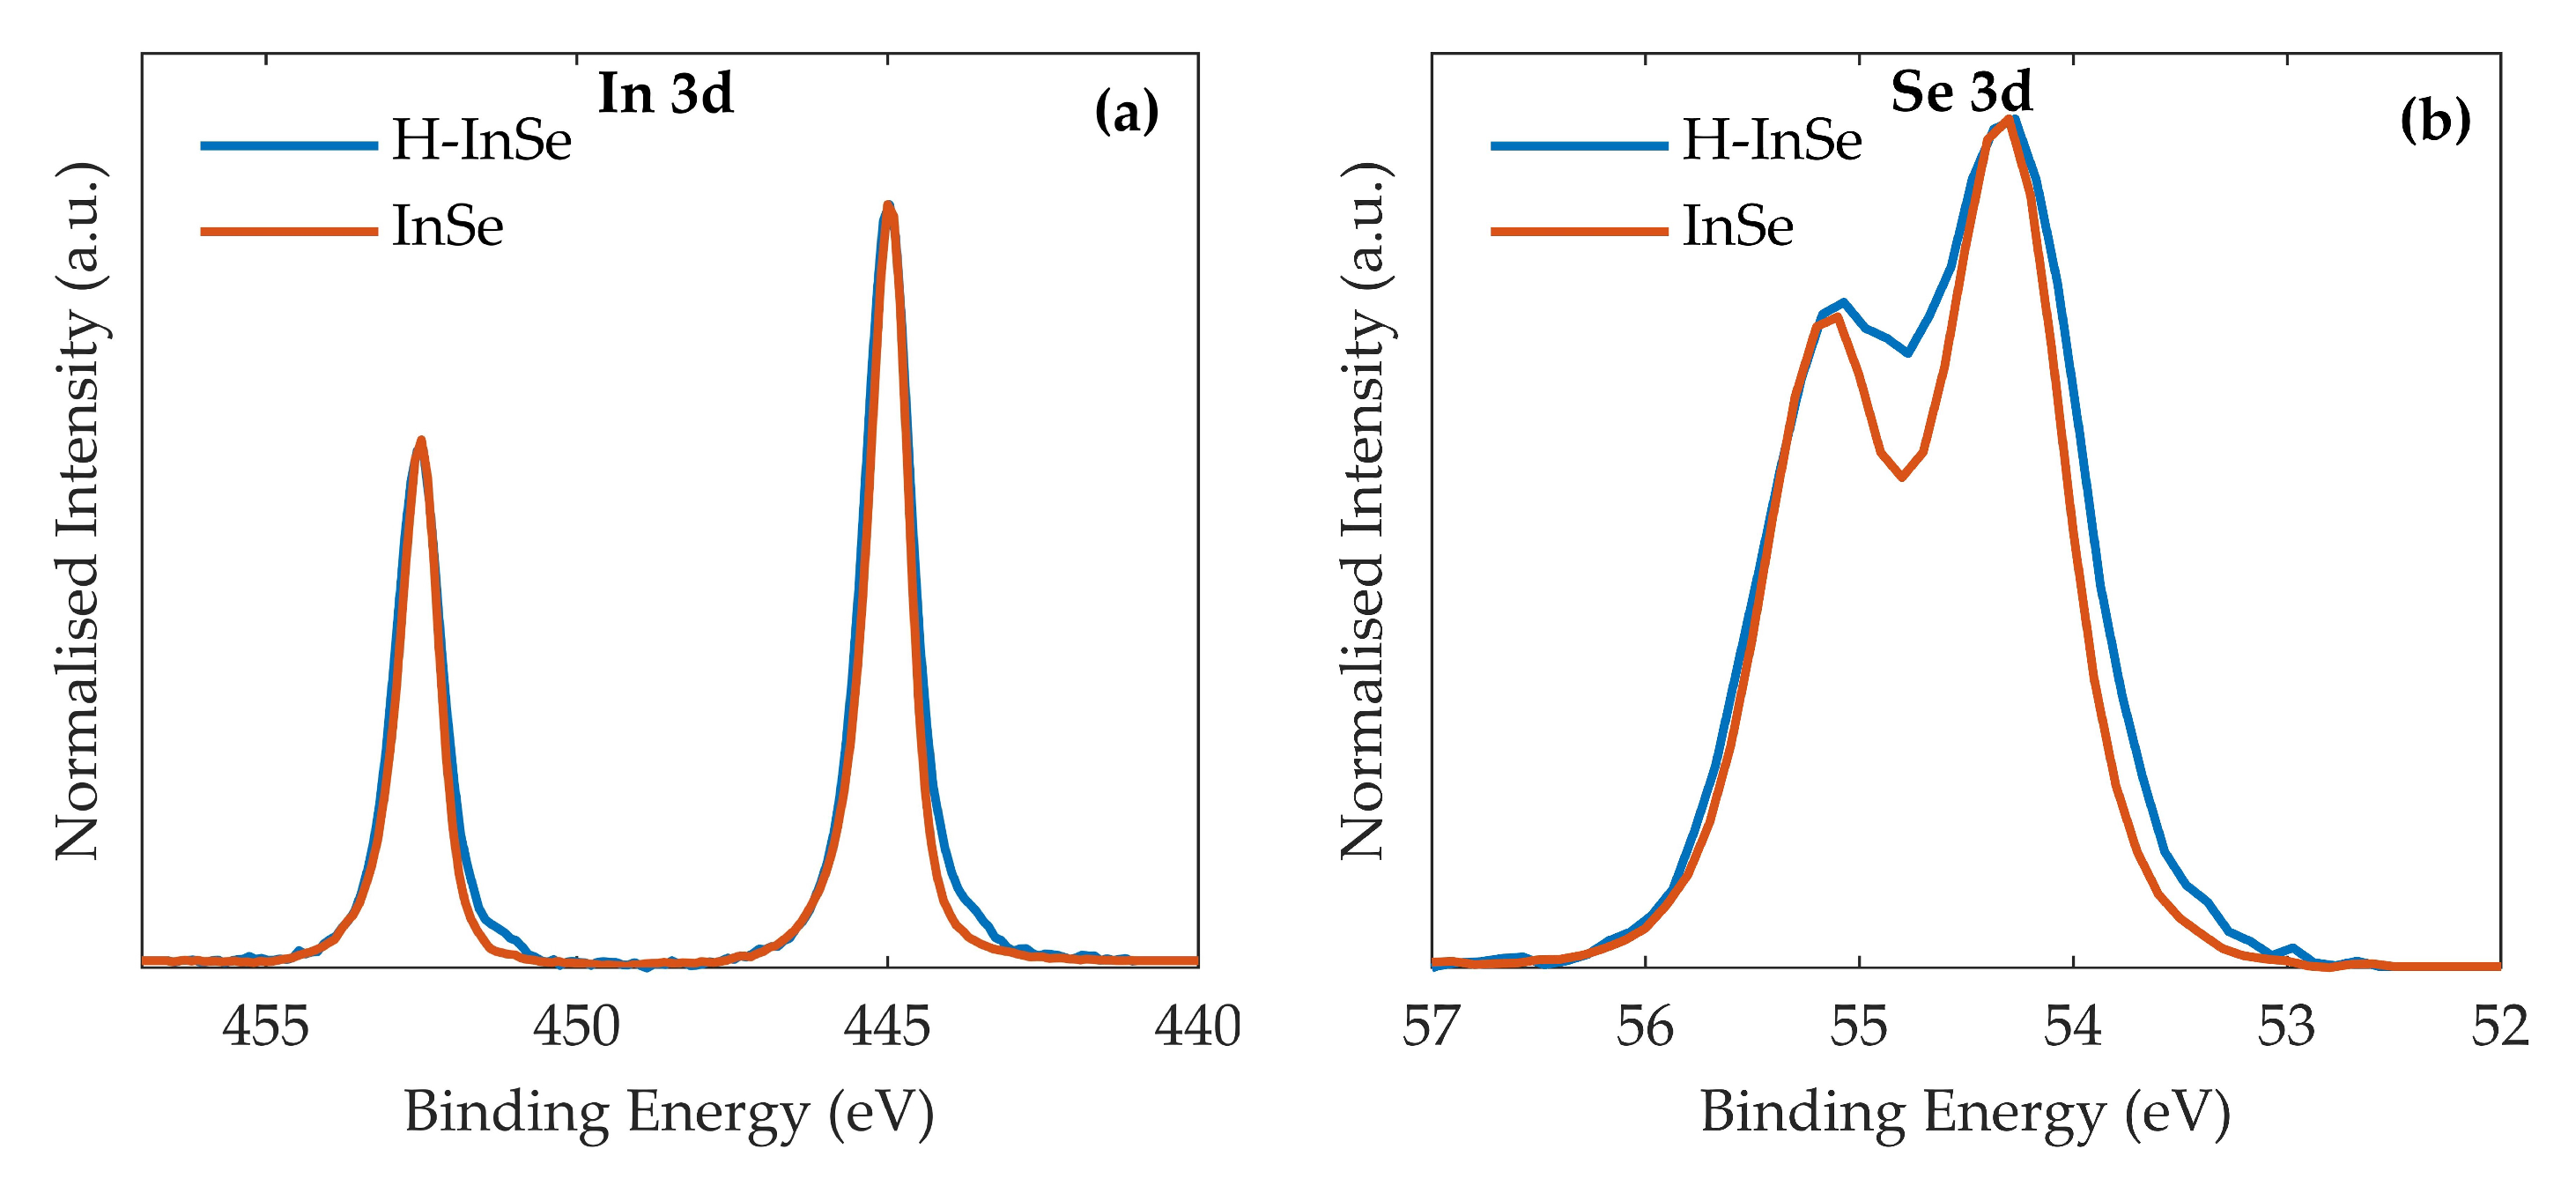
2.5. XPS
3. Discussion
4. Materials and Methods
4.1. Hydrogenation
4.2. Photoluminescence and Raman
4.3. XPS
4.4. DFT Calculations
4.5. Grand Canonical Monte Carlo Simulations
5. Conclusions
Supplementary Materials
Author Contributions
Funding
Conflicts of Interest
Abbreviations
| PL | photoluminescence |
| vdW | van der Waals |
| TMD | Transition Metal dichalcogenide |
| DFT | density functional theory |
| XPS | X-ray photoelectron spectroscopy |
| 2D | two-dimensional |
| GCMC | grand-canonical monte carlo |
References
- IEA. The Future of Hydrogen for G20; Technical Report June; IEA: Paris, France, 2019. [Google Scholar]
- Pallares, C.O. The Barriers for a Hydrogen Economy. SSRN Electron. J. 2012. [Google Scholar] [CrossRef]
- Buttner, W.; Burgess, R.; Post, M.; Rivkin, C. Summary and Findings from the NREL/DOE Hydrogen Sensor Workshop (8 June 2011); Technical Report July 2012; DOE: New York, NY, USA, 2011.
- El-Shafie, M.; Kambara, S.; Hayakawa, Y. Hydrogen Production Technologies Overview. J. Power Energy Eng. 2019, 7, 107–154. [Google Scholar] [CrossRef]
- Novoselov, K.S.; Geim, A.K.; Morozov, S.V.; Jiang, D.; Zhang, Y.; Dubonos, S.V.; Grigorieva, I.V.; Firsov, A.A. Electric Field Effect in Atomically Thin Carbon Films. Science 2004, 306, 666–669. [Google Scholar] [CrossRef] [PubMed]
- Bernardi, M.; Ataca, C.; Palummo, M.; Grossman, J.C. Optical and Electronic Properties of Two-Dimensional Layered Materials. Nanophotonics 2017, 6, 479–493. [Google Scholar] [CrossRef]
- Zhang, Y.; Rubio, A.; Lay, G.L. Emergent elemental two-dimensional materials beyond graphene. J. Phys. D Appl. Phys. 2017, 50, 053004. [Google Scholar] [CrossRef]
- Hong, Y.K.; Liu, N.; Yin, D.; Hong, S.; Kim, D.H.; Kim, S.; Choi, W.; Yoon, Y. Recent progress in high-mobility thin-film transistors based on multilayer 2D materials. J. Phys. D Appl. Phys. 2017, 50, 164001. [Google Scholar] [CrossRef]
- Kang, S.; Lee, D.; Kim, J.; Capasso, A.; Kang, H.S.; Park, J.W.; Lee, C.H.; Lee, G.H. 2D semiconducting materials for electronic and optoelectronic applications: Potential and challenge. 2D Mater. 2020, 7, 022003. [Google Scholar] [CrossRef]
- Gao, L. Flexible Device Applications of 2D Semiconductors. Small 2017, 13, 1603994. [Google Scholar] [CrossRef]
- Zou, M.; Ma, Y.; Yuan, X.; Hu, Y.; Liu, J.; Jin, Z. Flexible devices: From materials, architectures to applications. J. Semicond. 2018, 39, 011010. [Google Scholar] [CrossRef]
- Akinwande, D.; Petrone, N.; Hone, J. Two-dimensional flexible nanoelectronics. Nat. Commun. 2014, 5, 5678. [Google Scholar] [CrossRef]
- Kudrynskyi, Z.R.; Wang, X.; Sutcliffe, J.; Bhuiyan, M.A.; Fu, Y.; Yang, Z.; Makarovsky, O.; Eaves, L.; Solomon, A.; Maslyuk, V.T.; et al. Van der Waals SnSe2(1−x)S2x Alloys: Composition-Dependent Bowing Coefficient and Electron–Phonon Interaction. Adv. Funct. Mater. 2020, 30, 1908092. [Google Scholar] [CrossRef]
- Weng, Q.; Li, G.; Feng, X.; Nielsch, K.; Golberg, D.; Schmidt, O.G. Electronic and Optical Properties of 2D Materials Constructed from Light Atoms. Adv. Mater. 2018, 30, 1801600. [Google Scholar] [CrossRef] [PubMed]
- Deng, S.; Sumant, A.V.; Berry, V. Strain engineering in two-dimensional nanomaterials beyond graphene. Nano Today 2018, 22, 14–35. [Google Scholar] [CrossRef]
- Dai, Z.; Liu, L.; Zhang, Z. Strain Engineering of 2D Materials: Issues and Opportunities at the Interface. Adv. Mater. 2019, 31, 1805417. [Google Scholar] [CrossRef]
- Guo, Y.; Xu, K.; Wu, C.; Zhao, J.; Xie, Y. Surface chemical-modification for engineering the intrinsic physical properties of inorganic two-dimensional nanomaterials. Chem. Soc. Rev. 2015, 44, 637–646. [Google Scholar] [CrossRef]
- Jung, Y.; Zhou, Y.; Cha, J.J. Intercalation in two-dimensional transition metal chalcogenides. Inorg. Chem. Front. 2016, 3, 452–463. [Google Scholar] [CrossRef]
- Srinivas, G.; Zhu, Y.; Piner, R.; Skipper, N.; Ellerby, M.; Ruoff, R. Synthesis of graphene-like nanosheets and their hydrogen adsorption capacity. Carbon 2010, 48, 630–635. [Google Scholar] [CrossRef]
- Ma, L.P.; Wu, Z.S.; Li, J.; Wu, E.D.; Ren, W.C.; Cheng, H.M. Hydrogen adsorption behavior of graphene above critical temperature. Int. J. Hydrogen Energy 2009, 34, 2329–2332. [Google Scholar] [CrossRef]
- Schlapbach, L.; Züttel, A. Hydrogen-Storage Materials for Mobile Applications. Nature 2001, 353–358. [Google Scholar] [CrossRef]
- Chen, J.; He, X.; Sa, B.; Zhou, J.; Xu, C.; Wen, C.; Sun, Z. III-VI van der Waals heterostructures for sustainable energy related applications. Nanoscale 2019, 11, 6431–6444. [Google Scholar] [CrossRef]
- Kannan, P.K.; Late, D.J.; Morgan, H.; Rout, C.S. Recent developments in 2D layered inorganic nanomaterials for sensing. Nanoscale 2015, 7, 13293–13312. [Google Scholar] [CrossRef] [PubMed]
- Vargas-Bernal, R. Electrical properties of two-dimensional materials used in gas sensors. Sensors 2019, 19, 1295. [Google Scholar] [CrossRef] [PubMed]
- Bandurin, D.A.; Tyurnina, A.V.; Yu, G.L.; Mishchenko, A.; Zólyomi, V.; Morozov, S.V.; Kumar, R.K.; Gorbachev, R.V.; Kudrynskyi, Z.R.; Pezzini, S.; et al. High electron mobility, quantum Hall effect and anomalous optical response in atomically thin InSe. Nat. Nanotechnol. 2017, 12, 223–227. [Google Scholar] [CrossRef] [PubMed]
- Brotons-Gisbert, M.; Andres-Penares, D.; Suh, J.; Hidalgo, F.; Abargues, R.; Rodríguez-Cantó, P.J.; Segura, A.; Cros, A.; Tobias, G.; Canadell, E.; et al. Nanotexturing To Enhance Photoluminescent Response of Atomically Thin Indium Selenide with Highly Tunable Band Gap. Nano Lett. 2016, 16, 3221–3229. [Google Scholar] [CrossRef] [PubMed]
- Sucharitakul, S.; Goble, N.J.; Kumar, U.R.; Sankar, R.; Bogorad, Z.A.; Chou, F.C.; Chen, Y.T.; Gao, X.P.A. Intrinsic Electron Mobility Exceeding 103 cm2/(V s) in Multilayer InSe FETs. Nano Lett. 2015, 15, 3815–3819. [Google Scholar] [CrossRef]
- Kudrynskyi, Z.R.; Bhuiyan, M.A.; Makarovsky, O.; Greener, J.D.G.; Vdovin, E.E.; Kovalyuk, Z.D.; Cao, Y.; Mishchenko, A.; Novoselov, K.S.; Beton, P.H.; et al. Giant Quantum Hall Plateau in Graphene Coupled to an InSe van der Waals Crystal. Phys. Rev. Lett. 2017, 119, 157701. [Google Scholar] [CrossRef]
- Rushchanskii, K.Z. The influence of hydrostatic pressure on the static and dynamic properties of an InSe crystal: A first-principles study. Phys. Solid State 2004, 46, 179–187. [Google Scholar] [CrossRef]
- Zhirko, Y.I.; Kovalyuk, Z.; Pyrlja, M.; Boledzyuk, V. Application of Layered InSe and GaSe Crystals and Powders for Solid State Hydrogen Storage. In Hydrogen Materials Science and Chemistry of Carbon Nanomaterials; Springer: Dordrecht, The Netherlands, 2007; pp. 325–340. [Google Scholar] [CrossRef]
- Zhirko, Y.; Trachevsky, V.; Kovalyuk, Z. On the Possibility of Layered Crystals Application for Solid State Hydrogen Storages—InSe and GaSe Crystals. In Hydrogen Storage; InTech: Rijeka, Croatia, 2012; pp. 211–242. [Google Scholar] [CrossRef]
- Balyts’kyi, O.O. Influence of hydrogenation on properties of layered crystals of gallium and indium monoselenides. Mater. Sci. 2011, 46, 473–477. [Google Scholar] [CrossRef]
- Zhirko, I.Y.; Kovalyuk, Z.D.; Pyrlja, M.M.; Boledzyuk, V.B. Optical Investigation of Hydrogen Intercalation- Deinteracalation Processes in Layered Semiconductor γ-InSe Crystals. In Hydrogen Materials Science and Chemistry of Carbon Nanomaterials; Springer: Dordrecht, The Netherlands, 2004; pp. 519–530. [Google Scholar] [CrossRef]
- Koz’mik, I.D.; Kovalyuk, Z.D.; Grigorchak, I.I.; Bakhmatyuk, B. Preparation and Properties of Hydrogen- Intercalated Indium and Galium Monoselenides. Inorg. Mater. 1987, 23, 754–757. [Google Scholar]
- Ma, D.; Ju, W.; Tang, Y.; Chen, Y. First-principles study of the small molecule adsorption on the InSe monolayer. Appl. Surf. Sci. 2017, 426, 244–252. [Google Scholar] [CrossRef]
- Cai, Y.; Zhang, G.; Zhang, Y.W. Charge Transfer and Functionalization of Monolayer InSe by Physisorption of Small Molecules for Gas Sensing. J. Phys. Chem. C 2017, 121, 10182–10193. [Google Scholar] [CrossRef]
- Petroni, E.; Lago, E.; Bellani, S.; Boukhvalov, D.W.; Politano, A.; Gürbulak, B.; Duman, S.; Prato, M.; Gentiluomo, S.; Oropesa-Nuñez, R.; et al. Liquid-Phase Exfoliated Indium-Selenide Flakes and Their Application in Hydrogen Evolution Reaction. Small 2018, 14, 1800749. [Google Scholar] [CrossRef] [PubMed]
- Ma, D.; Li, T.; Yuan, D.; He, C.; Lu, Z.; Lu, Z.; Yang, Z.; Wang, Y. The role of the intrinsic Se and In vacancies in the interaction of O2 and H2O molecules with the InSe monolayer. Appl. Surf. Sci. 2018, 434, 215–227. [Google Scholar] [CrossRef]
- Tedeschi, D.; Blundo, E.; Felici, M.; Pettinari, G.; Liu, B.; Yildrim, T.; Petroni, E.; Zhang, C.; Zhu, Y.; Sennato, S.; et al. Controlled Micro/Nanodome Formation in Proton-Irradiated Bulk Transition-Metal Dichalcogenides. Adv. Mater. 2019, 31, 1903795. [Google Scholar] [CrossRef]
- Blundo, E.; Felici, M.; Yildirim, T.; Pettinari, G.; Tedeschi, D.; Miriametro, A.; Liu, B.; Ma, W.; Lu, Y.; Polimeni, A. Evidence of the direct-to-indirect band gap transition in strained two-dimensional WS2, MoS2 and WSe2. Phys. Rev. Res. 2020, 2, 012024. [Google Scholar] [CrossRef]
- Shubina, T.; Desrat, W.; Moret, M.; Tiberj, A.; Briot, O.; Davydov, V.Y.; Platonov, A.; Semina, M.; Gil, B. InSe as a case between 3D and 2D layered crystals for excitons. Nat. Commun. 2019, 10, 1–8. [Google Scholar] [CrossRef]
- Abay, B.; Efeoğlu, H.; Yoğurtçu, Y. Low-temperature photoluminescence of n-InSe layer semiconductor crystals. Mater. Res. Bull. 1998, 33, 1401–1410. [Google Scholar] [CrossRef]
- Nakayama, M.; Hirao, T.; Hasegawa, T. Photoluminescence properties of exciton–exciton scattering in a GaAs/AlAs multiple quantum well. Phys. E Low-Dimens. Syst. Nanostruct. 2010, 42, 2644–2647. [Google Scholar] [CrossRef]
- Sánchez-Royo, J.F.; Muñoz-Matutano, G.; Brotons-Gisbert, M.; Martínez-Pastor, J.P.; Segura, A.; Cantarero, A.; Mata, R.; Canet-Ferrer, J.; Tobias, G.; Canadell, E.; et al. Electronic structure, optical properties, and lattice dynamics in atomically thin indium selenide flakes. Nano Res. 2014, 7, 1556–1568. [Google Scholar] [CrossRef]
- Ismail, A.F.; Khulbe, K.C.; Matsuura, T. Gas Separation Membranes; Springer: Cham, Switzerland, 2015. [Google Scholar]
- Balakrishnan, N.; Kudrynskyi, Z.R.; Smith, E.F.; Fay, M.W.; Makarovsky, O.; Kovalyuk, Z.D.; Eaves, L.; Beton, P.H.; Patanè, A. Engineering p–n junctions and bandgap tuning of InSe nanolayers by controlled oxidation. 2D Mater. 2017, 4, 025043. [Google Scholar] [CrossRef]
- Stoicheff, B.P. High Resolution Raman Spectroscopy of Gases: IX. Spectra of H2, HD, and D2. Can. J. Phys. 1957, 35, 730–741. [Google Scholar] [CrossRef]
- Leitch, A.W.R.; Alex, V.; Weber, J. Raman Spectroscopy of Hydrogen Molecules in Crystalline Silicon. Phys. Rev. Lett. 1998, 81, 421–424. [Google Scholar] [CrossRef]
- Centrone, A.; Siberio-Pérez, D.Y.; Millward, A.R.; Yaghi, O.M.; Matzger, A.J.; Zerbi, G. Raman spectra of hydrogen and deuterium adsorbed on a metal–organic framework. Chem. Phys. Lett. 2005, 411, 516–519. [Google Scholar] [CrossRef]
- Klar, P.; Grüning, H.; Güngerich, M.; Heimbrodt, W.; Koch, J.; Torunski, T.; Stolz, W.; Polimeni, A.; Capizzi, M. Global changes of the band structure and the crystal lattice of Ga (N, As) due to hydrogenation. Phys. Rev. B 2003, 67, 121206. [Google Scholar] [CrossRef]
- VandeVondele, J.; Krack, M.; Mohamed, F.; Parrinello, M.; Chassaing, T.; Hutter, J. Quickstep: Fast and accurate density functional calculations using a mixed Gaussian and plane waves approach. Comput. Phys. Commun. 2005, 167, 103–128. [Google Scholar] [CrossRef]
- Hutter, J.; Iannuzzi, M.; Schiffmann, F.; VandeVondele, J. cp2k: Atomistic simulations of condensed matter systems. Wiley Interdiscip. Rev. Comput. Mol. Sci. 2014, 4, 15–25. [Google Scholar] [CrossRef]
- VandeVondele, J.; Hutter, J. Gaussian basis sets for accurate calculations on molecular systems in gas and condensed phases. J. Chem. Phys. 2007, 127, 114105. [Google Scholar] [CrossRef]
- Goedecker, S.; Teter, M.; Hutter, J. Separable dual-space Gaussian pseudopotentials. Phys. Rev. B 1996, 54, 1703. [Google Scholar] [CrossRef]
- Krack, M. Pseudopotentials for H to Kr optimized for gradient-corrected exchange-correlation functionals. Theor. Chem. Acc. 2005, 114, 145–152. [Google Scholar] [CrossRef]
- Perdew, J.P.; Burke, K.; Ernzerhof, M. Generalized gradient approximation made simple. Phys. Rev. Lett. 1996, 77, 3865. [Google Scholar] [CrossRef]
- Ehrlich, S.; Moellmann, J.; Reckien, W.; Bredow, T.; Grimme, S. System-Dependent Dispersion Coefficients for the DFT-D3 Treatment of Adsorption Processes on Ionic Surfaces. ChemPhysChem 2011, 12, 3414–3420. [Google Scholar] [CrossRef] [PubMed]
- Faradev, F.; Gasanly, N.; Mavrin, B.; Melnik, N. Raman scattering in some III-VI layer single crystals. Phys. Status Solidi (B) 1978, 85, 381–386. [Google Scholar] [CrossRef]
- Dubbeldam, D.; Calero, S.; Ellis, D.E.; Snurr, R.Q. RASPA: Molecular simulation software for adsorption and diffusion in flexible nanoporous materials. Mol. Simul. 2016, 42, 81–101. [Google Scholar] [CrossRef]
- Peng, D.Y.; Robinson, D.B. A New Two-Constant Equation of State. Ind. Eng. Chem. Fundam. 1976, 15, 59–64. [Google Scholar] [CrossRef]
- Rappe, A.K.; Casewit, C.J.; Colwell, K.S.; Goddard, W.A.; Skiff, W.M. UFF, a full periodic table force field for molecular mechanics and molecular dynamics simulations. J. Am. Chem. Soc. 1992, 114, 10024–10035. [Google Scholar] [CrossRef]
- Darkrim, F.; Levesque, D. Monte Carlo simulations of hydrogen adsorption in single-walled carbon nanotubes. J. Chem. Phys. 1998, 109, 4981–4984. [Google Scholar] [CrossRef]
- Frenkel, D.; Smit, B. Understanding Molecular Simulation, 2nd ed.; Academic Press: Cambridge, MA, USA, 2002. [Google Scholar]
- Berthelot, D. Sur le mélange des gaz. C. R. Hebd. Séances l’Acad. Sci. 1898, 126, 1703–1855. [Google Scholar]
- Lorentz, H.A. Ueber die Anwendung des Satzes vom Virial in der kinetischen Theorie der Gase. Ann. Phys. 1881, 248, 127–136. [Google Scholar] [CrossRef]
- Ewald, P.P. Die Berechnung optischer und elektrostatischer Gitterpotentiale. Ann. Phys. 1921, 369, 253–287. [Google Scholar] [CrossRef]
- Basdogan, Y.; Keskin, S. Simulation and modelling of MOFs for hydrogen storage. CrystEngComm 2015, 17, 261–275. [Google Scholar] [CrossRef]
- Getman, R.B.; Bae, Y.S.; Wilmer, C.E.; Snurr, R.Q. Review and analysis of molecular simulations of methane, hydrogen, and acetylene storage in metal–organic frameworks. Chem. Rev. 2012, 112, 703–723. [Google Scholar] [CrossRef] [PubMed]
Sample Availability: Samples of bulk -InSe are available from the authors. |


| -InSe Bulk | Interlayer | Intralayer |
| 30.1 (29.3) | 19.8 | |
| InSe Monolayer | On Surface | Intralayer |
| −6.0 | 20.7 |
| Atom | (Å) | (K) | q(e) |
|---|---|---|---|
| In | 4.463 | 301.43 | - |
| Se | 4.205 | 146.44 | - |
| H_H2 | 0.000 | 0.000 | 0.4829 |
| COM_H2 | 2.958 | 36.700 | −0.9658 |
© 2020 by the authors. Licensee MDPI, Basel, Switzerland. This article is an open access article distributed under the terms and conditions of the Creative Commons Attribution (CC BY) license (http://creativecommons.org/licenses/by/4.0/).
Share and Cite
Felton, J.; Blundo, E.; Ling, S.; Glover, J.; Kudrynskyi, Z.R.; Makarovsky, O.; Kovalyuk, Z.D.; Besley, E.; Walker, G.; Polimeni, A.; et al. The Interaction of Hydrogen with the van der Waals Crystal γ-InSe. Molecules 2020, 25, 2526. https://doi.org/10.3390/molecules25112526
Felton J, Blundo E, Ling S, Glover J, Kudrynskyi ZR, Makarovsky O, Kovalyuk ZD, Besley E, Walker G, Polimeni A, et al. The Interaction of Hydrogen with the van der Waals Crystal γ-InSe. Molecules. 2020; 25(11):2526. https://doi.org/10.3390/molecules25112526
Chicago/Turabian StyleFelton, James, Elena Blundo, Sanliang Ling, Joseph Glover, Zakhar R. Kudrynskyi, Oleg Makarovsky, Zakhar D. Kovalyuk, Elena Besley, Gavin Walker, Antonio Polimeni, and et al. 2020. "The Interaction of Hydrogen with the van der Waals Crystal γ-InSe" Molecules 25, no. 11: 2526. https://doi.org/10.3390/molecules25112526
APA StyleFelton, J., Blundo, E., Ling, S., Glover, J., Kudrynskyi, Z. R., Makarovsky, O., Kovalyuk, Z. D., Besley, E., Walker, G., Polimeni, A., & Patané, A. (2020). The Interaction of Hydrogen with the van der Waals Crystal γ-InSe. Molecules, 25(11), 2526. https://doi.org/10.3390/molecules25112526