
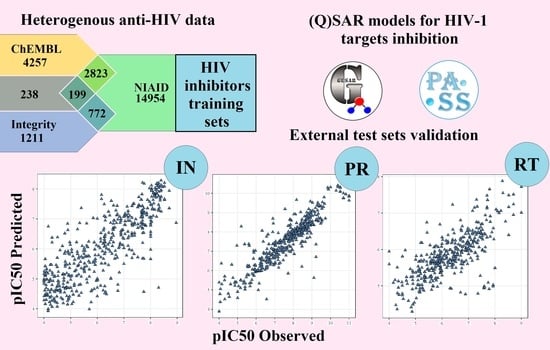
(Q)SAR Models of HIV-1 Protein Inhibition by Drug-Like Compounds

 ,
, 
Abstract
1. Introduction
2. Results
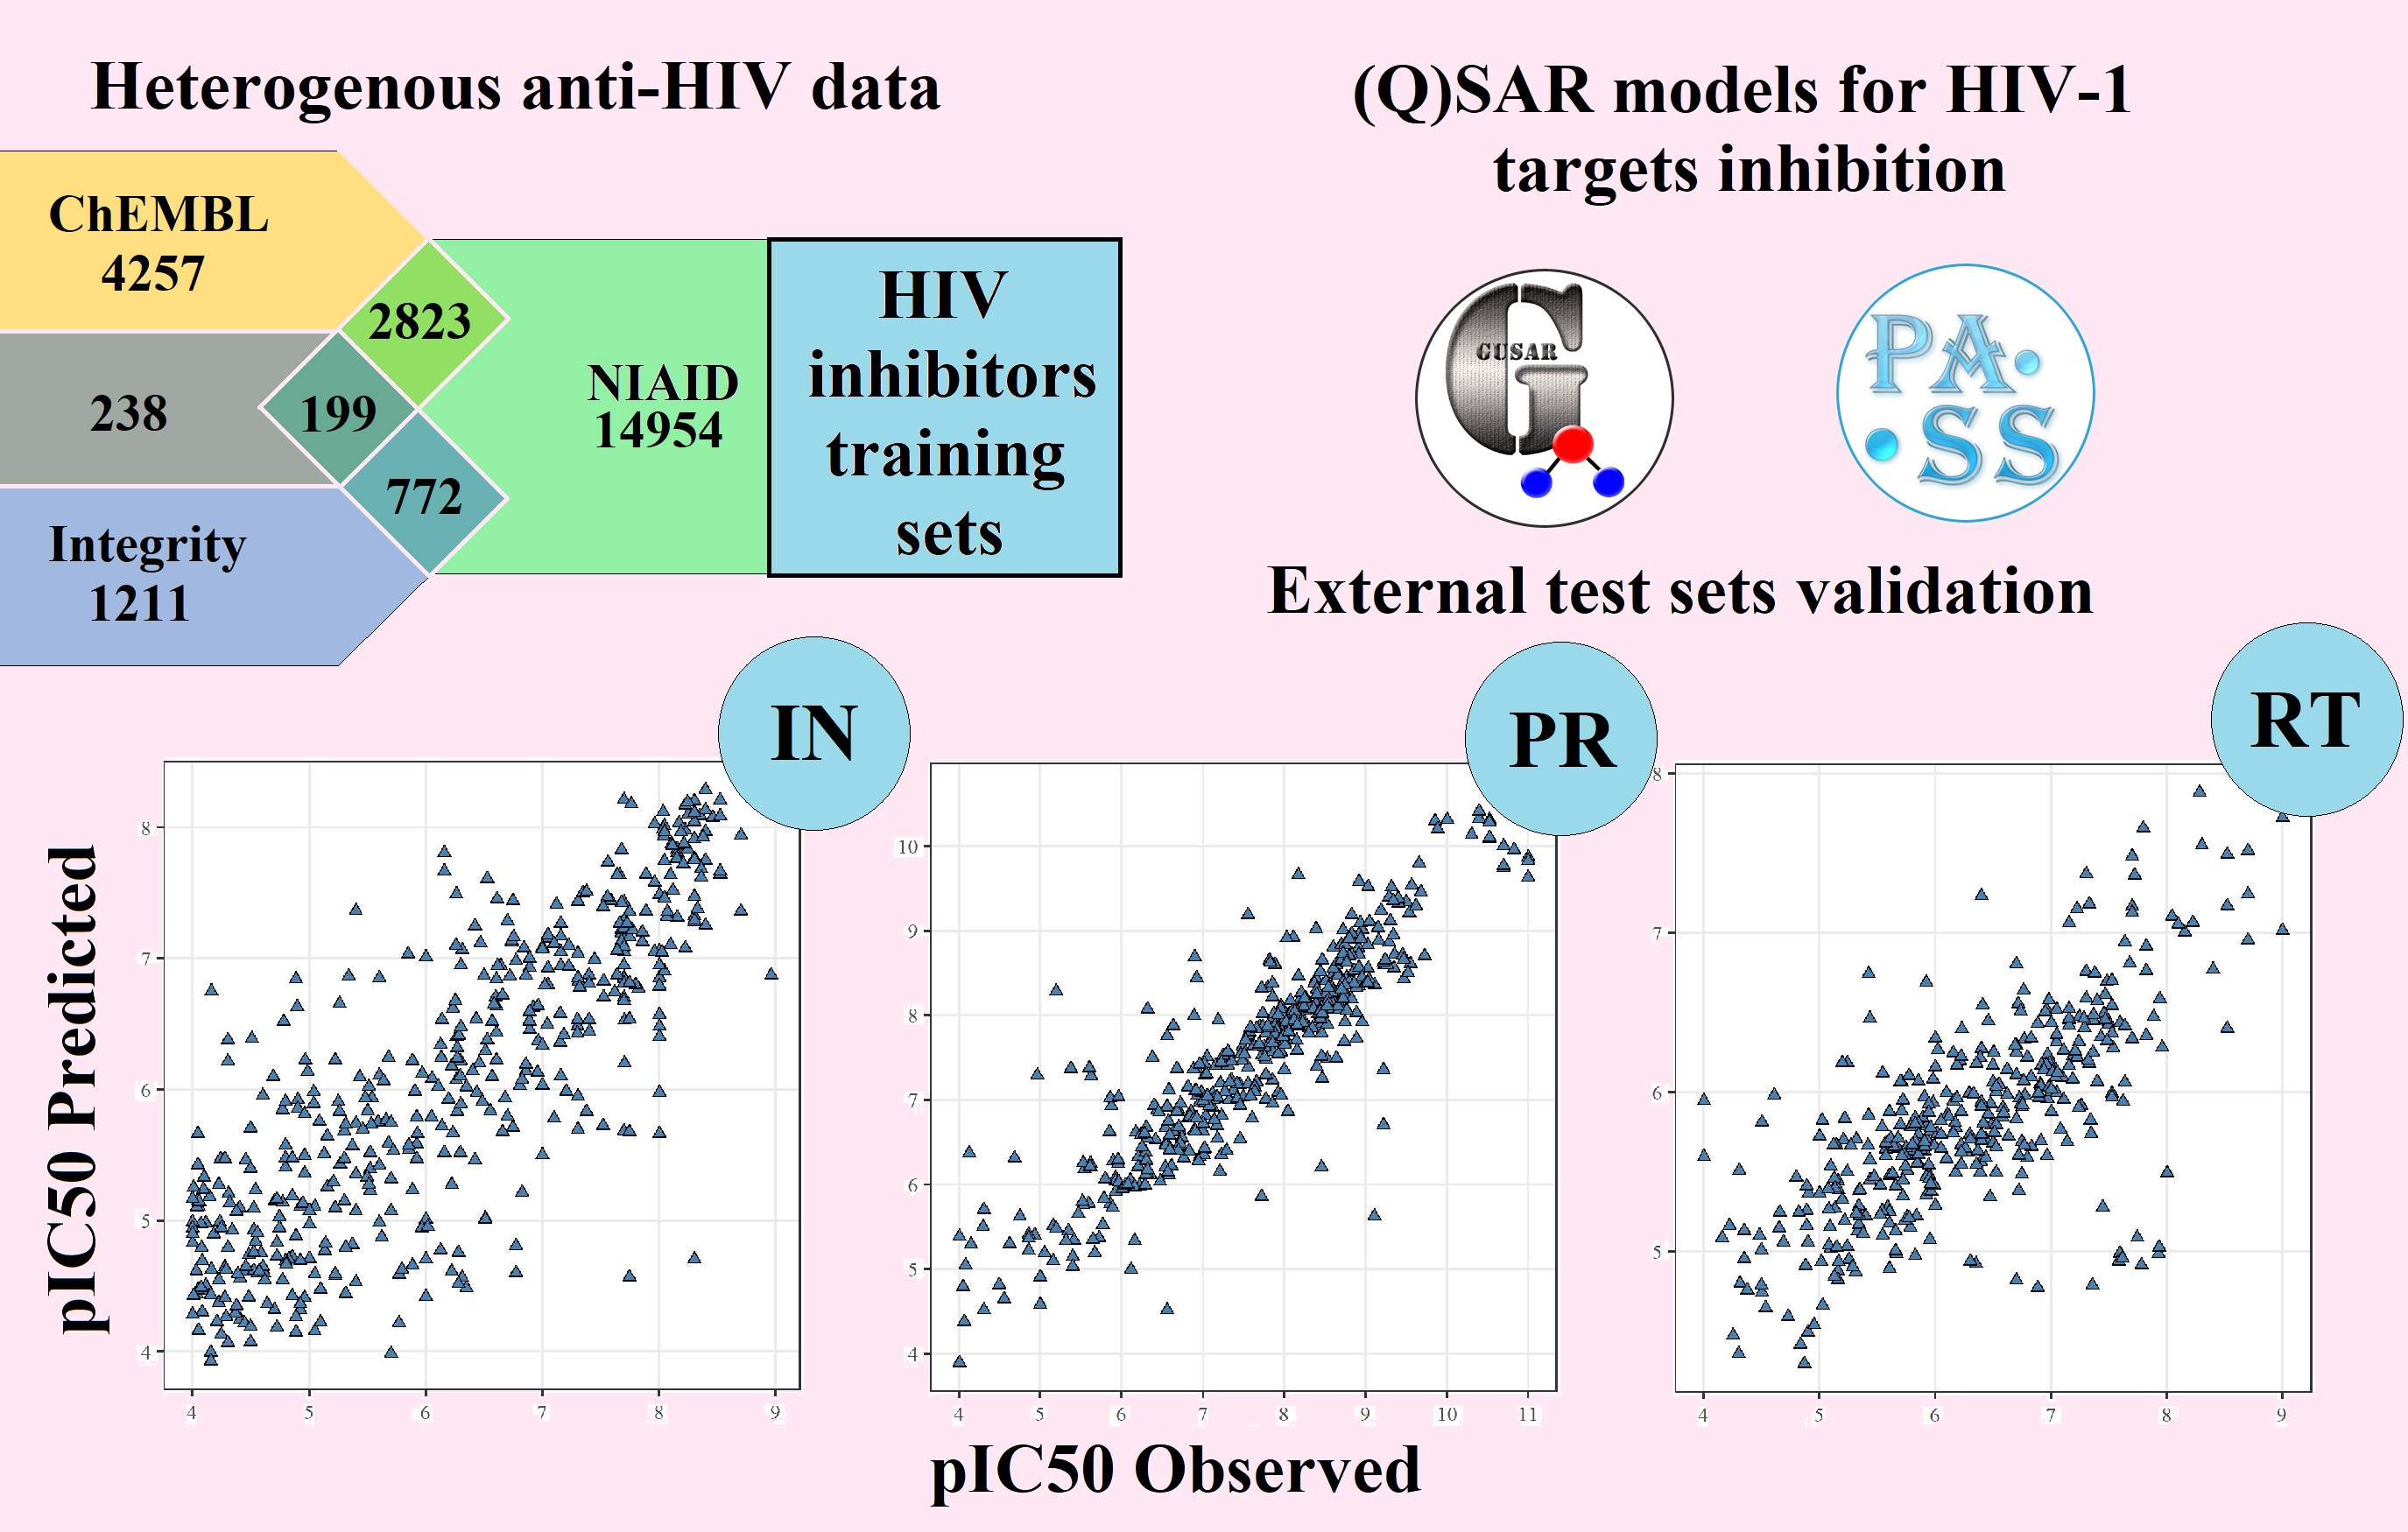
2.1. Training Sets
2.2. Classification Models
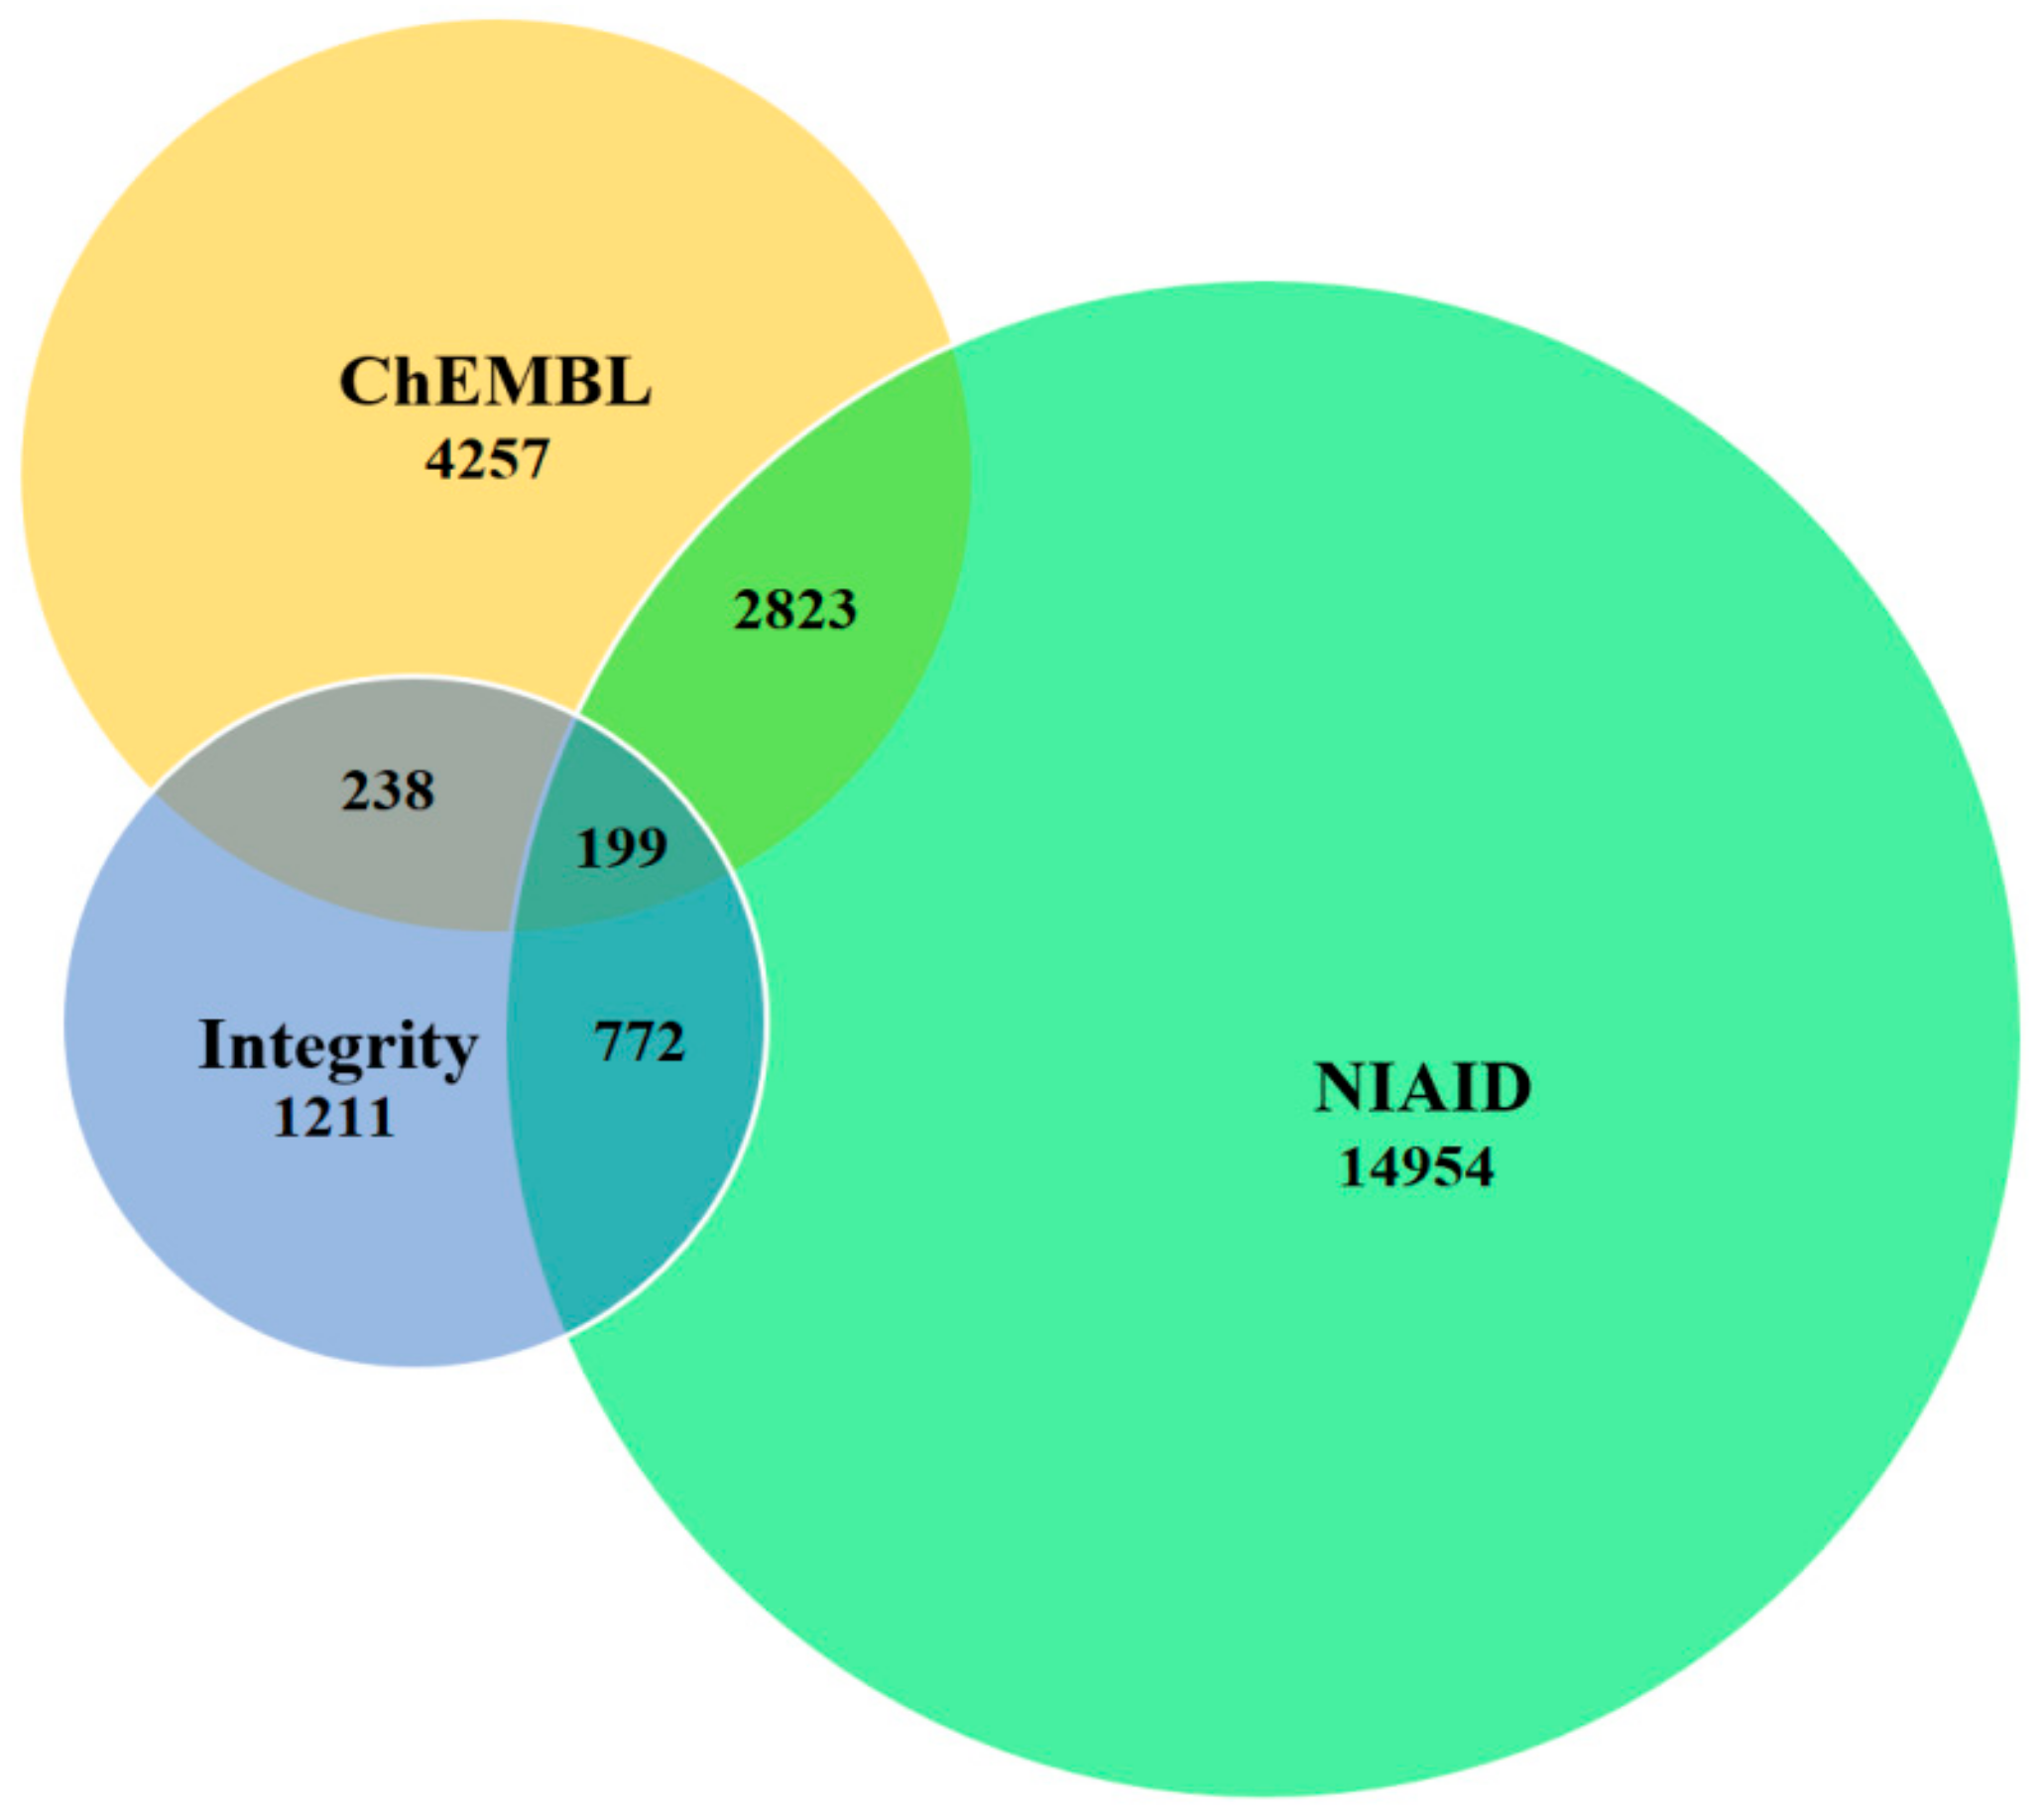
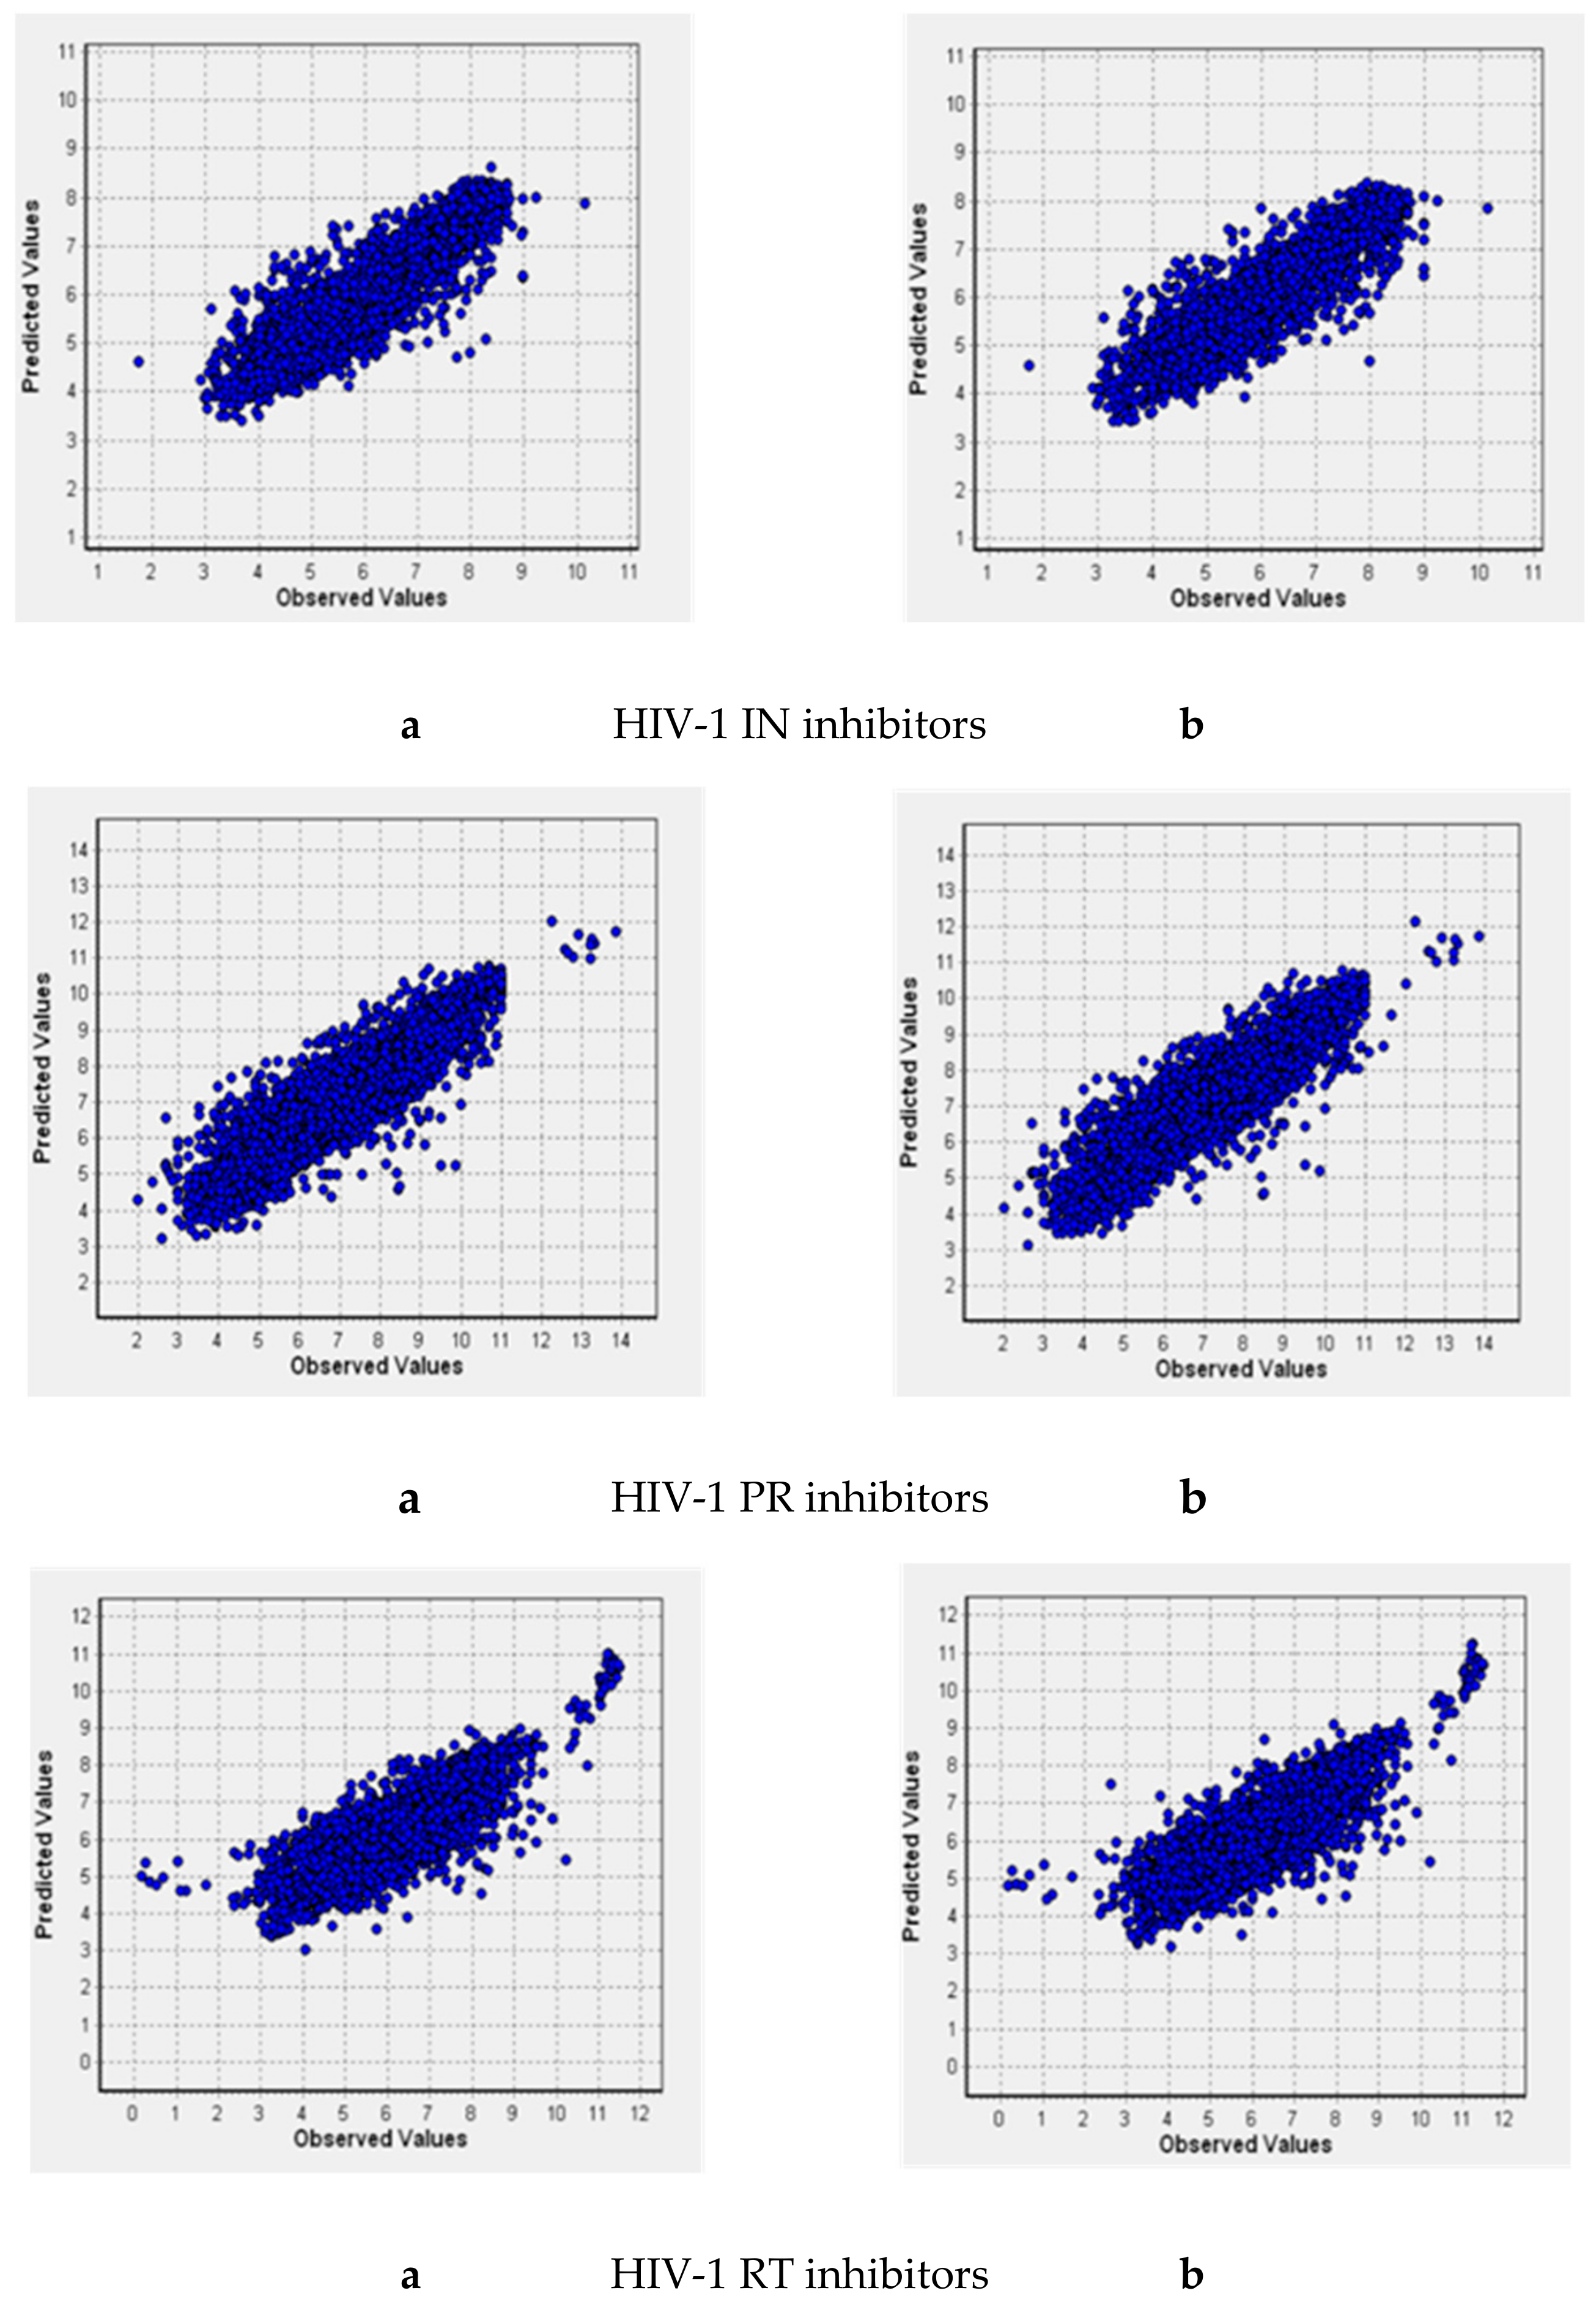
2.3. Quantitative Structure–Activity Relationships (QSAR) Models
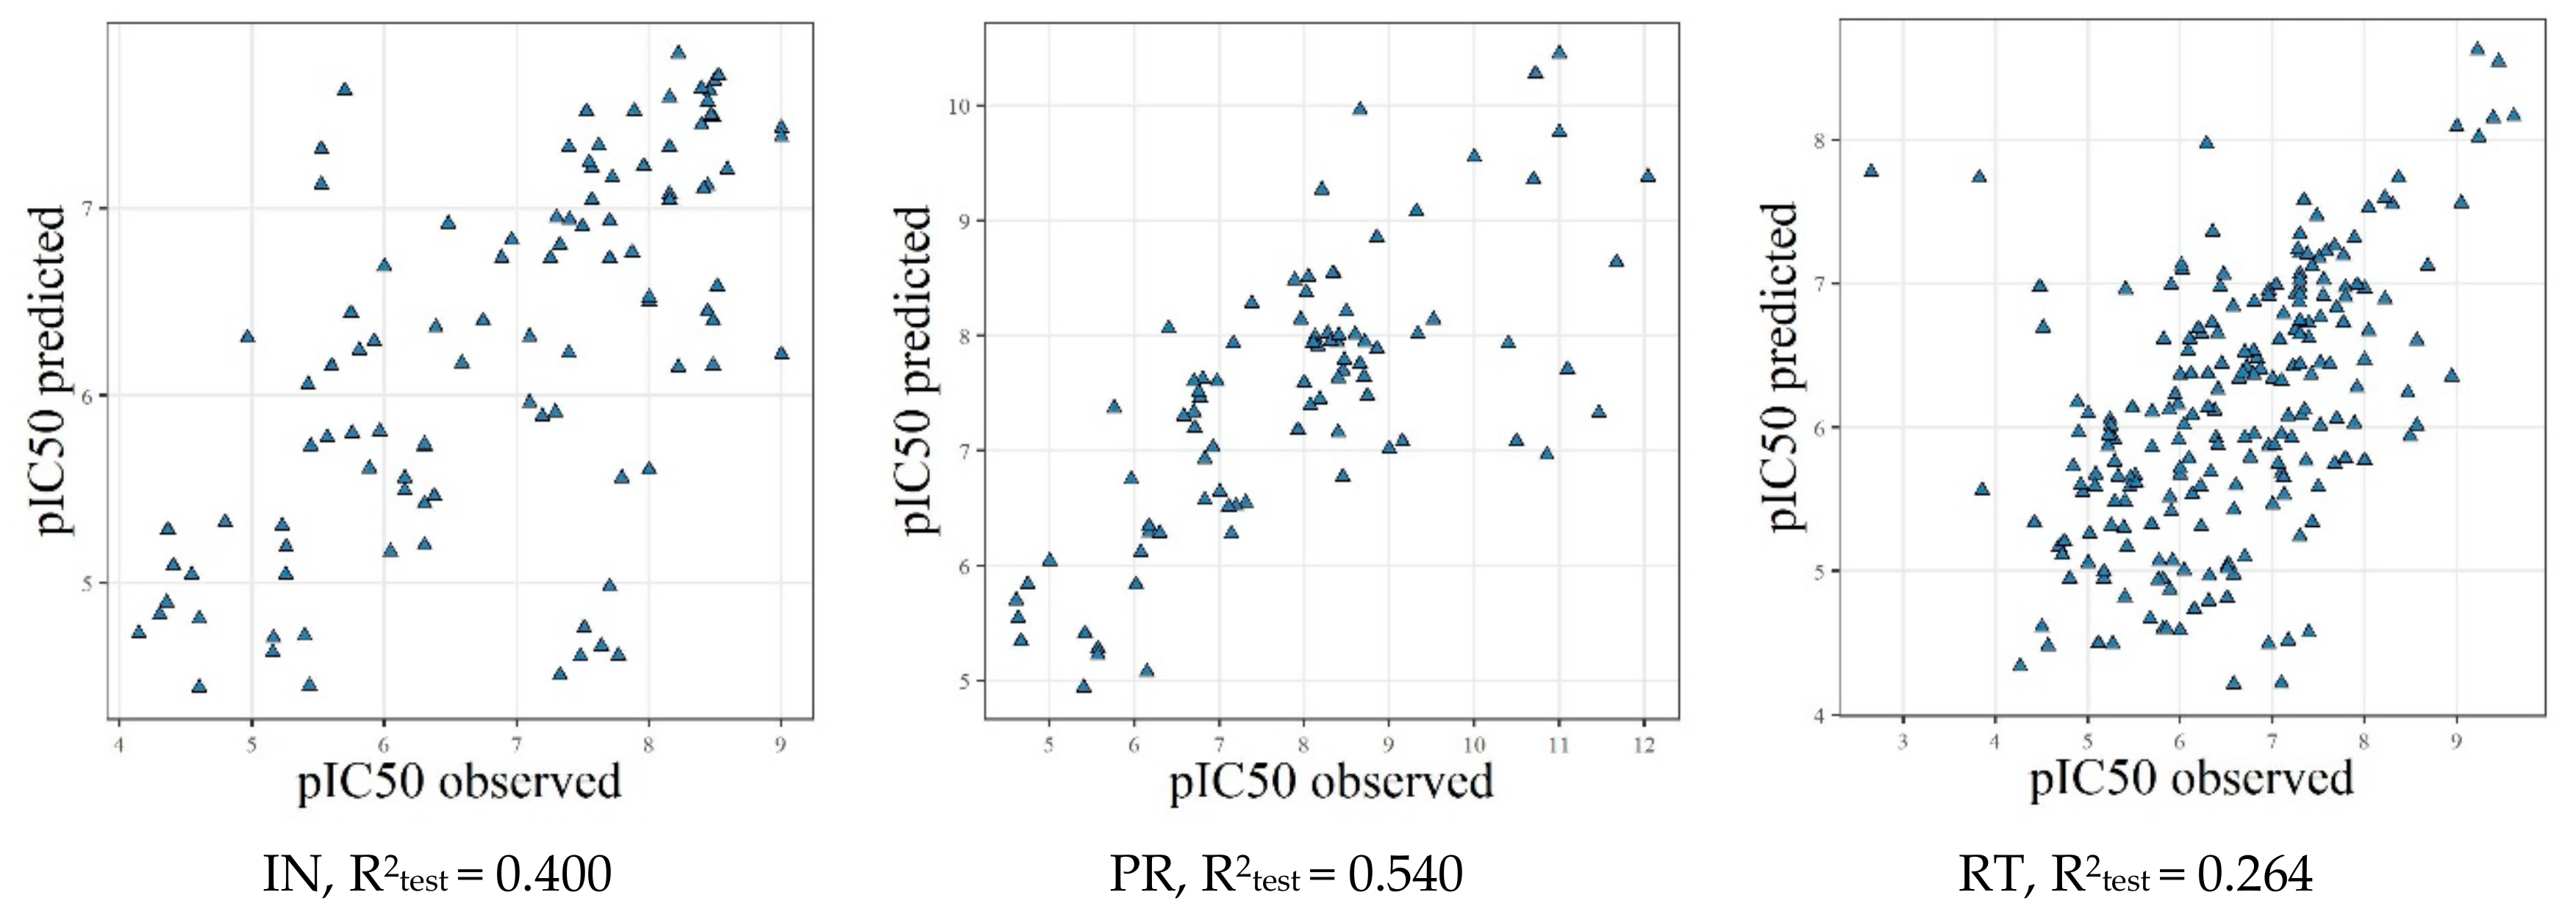
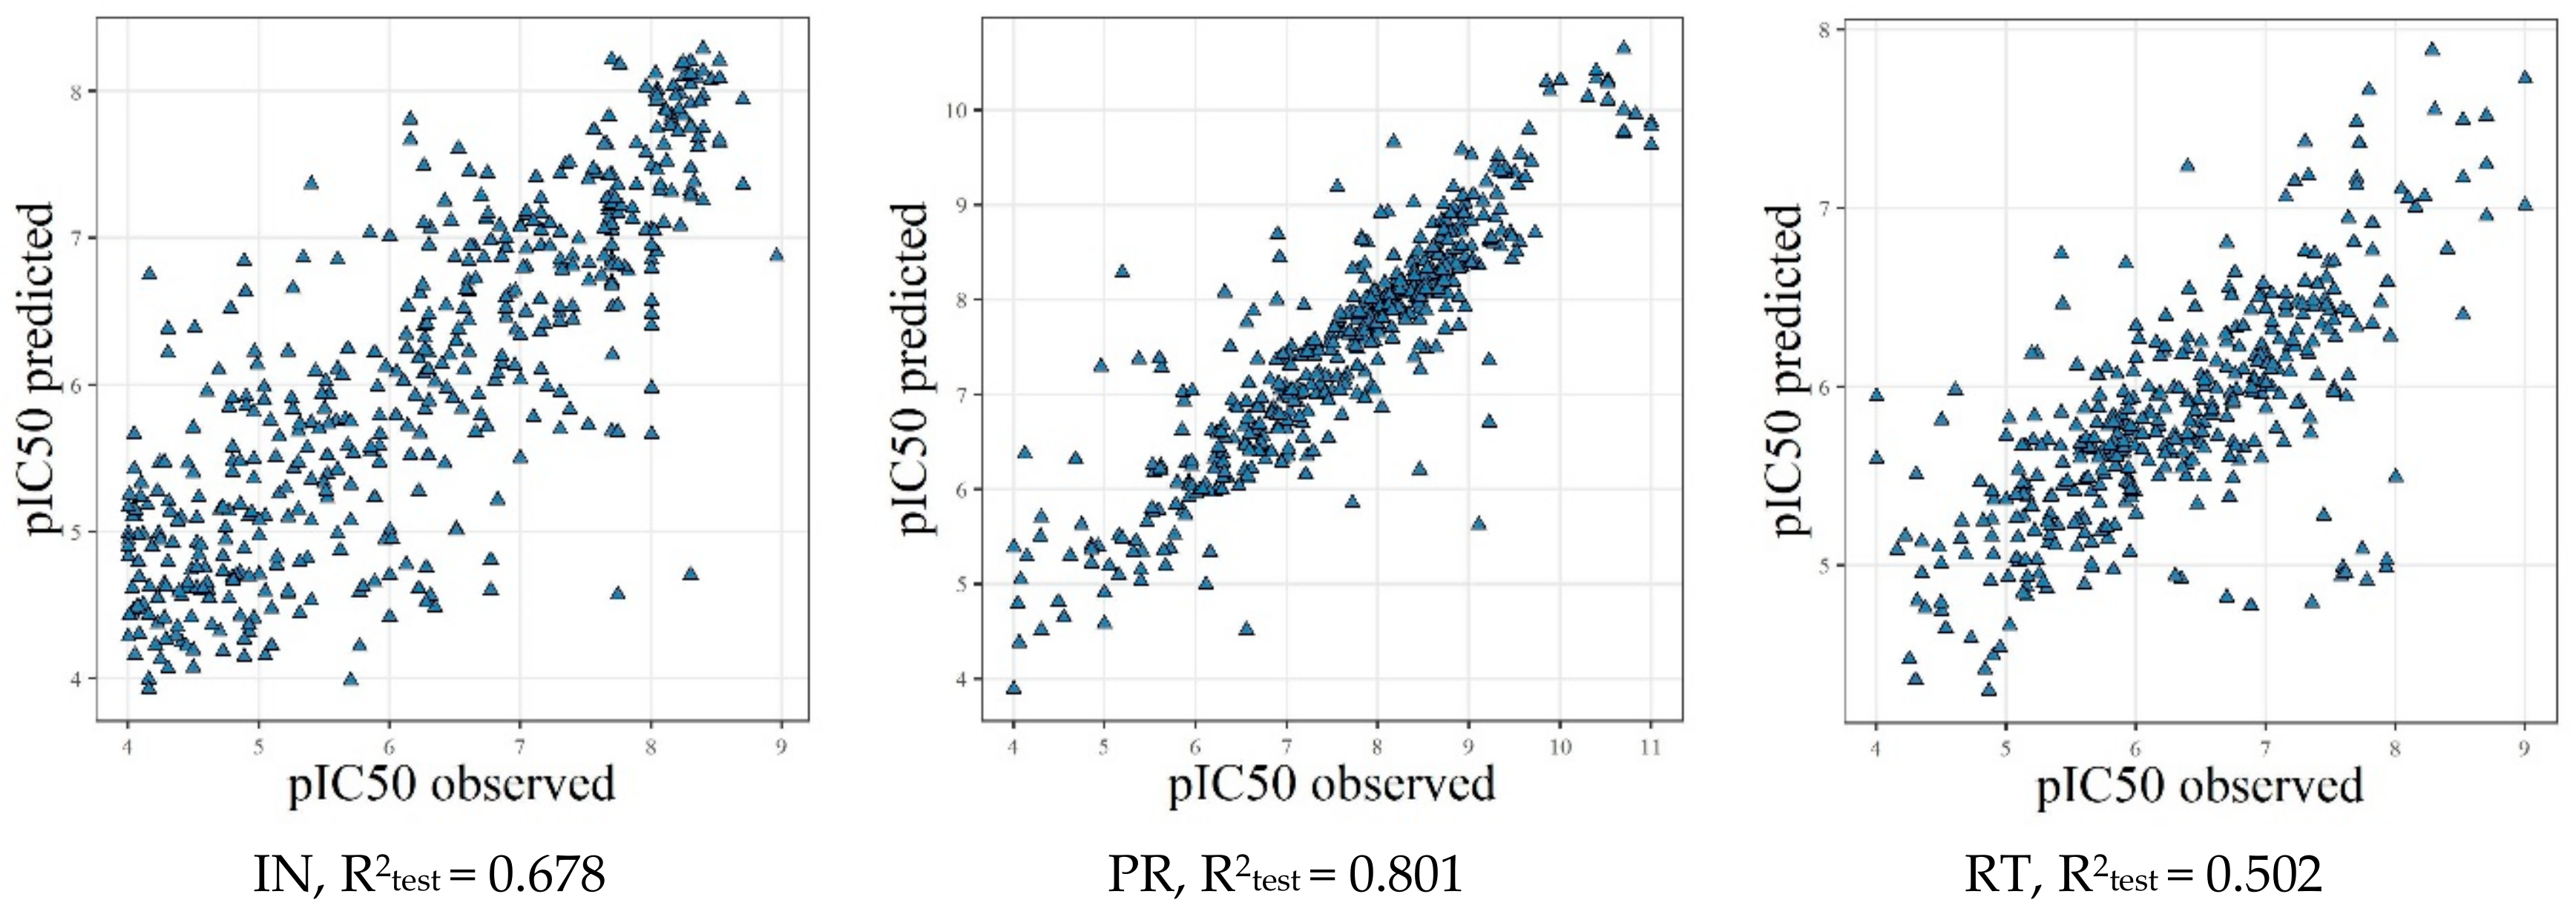
2.4. Model Validation Using the External Test Sets
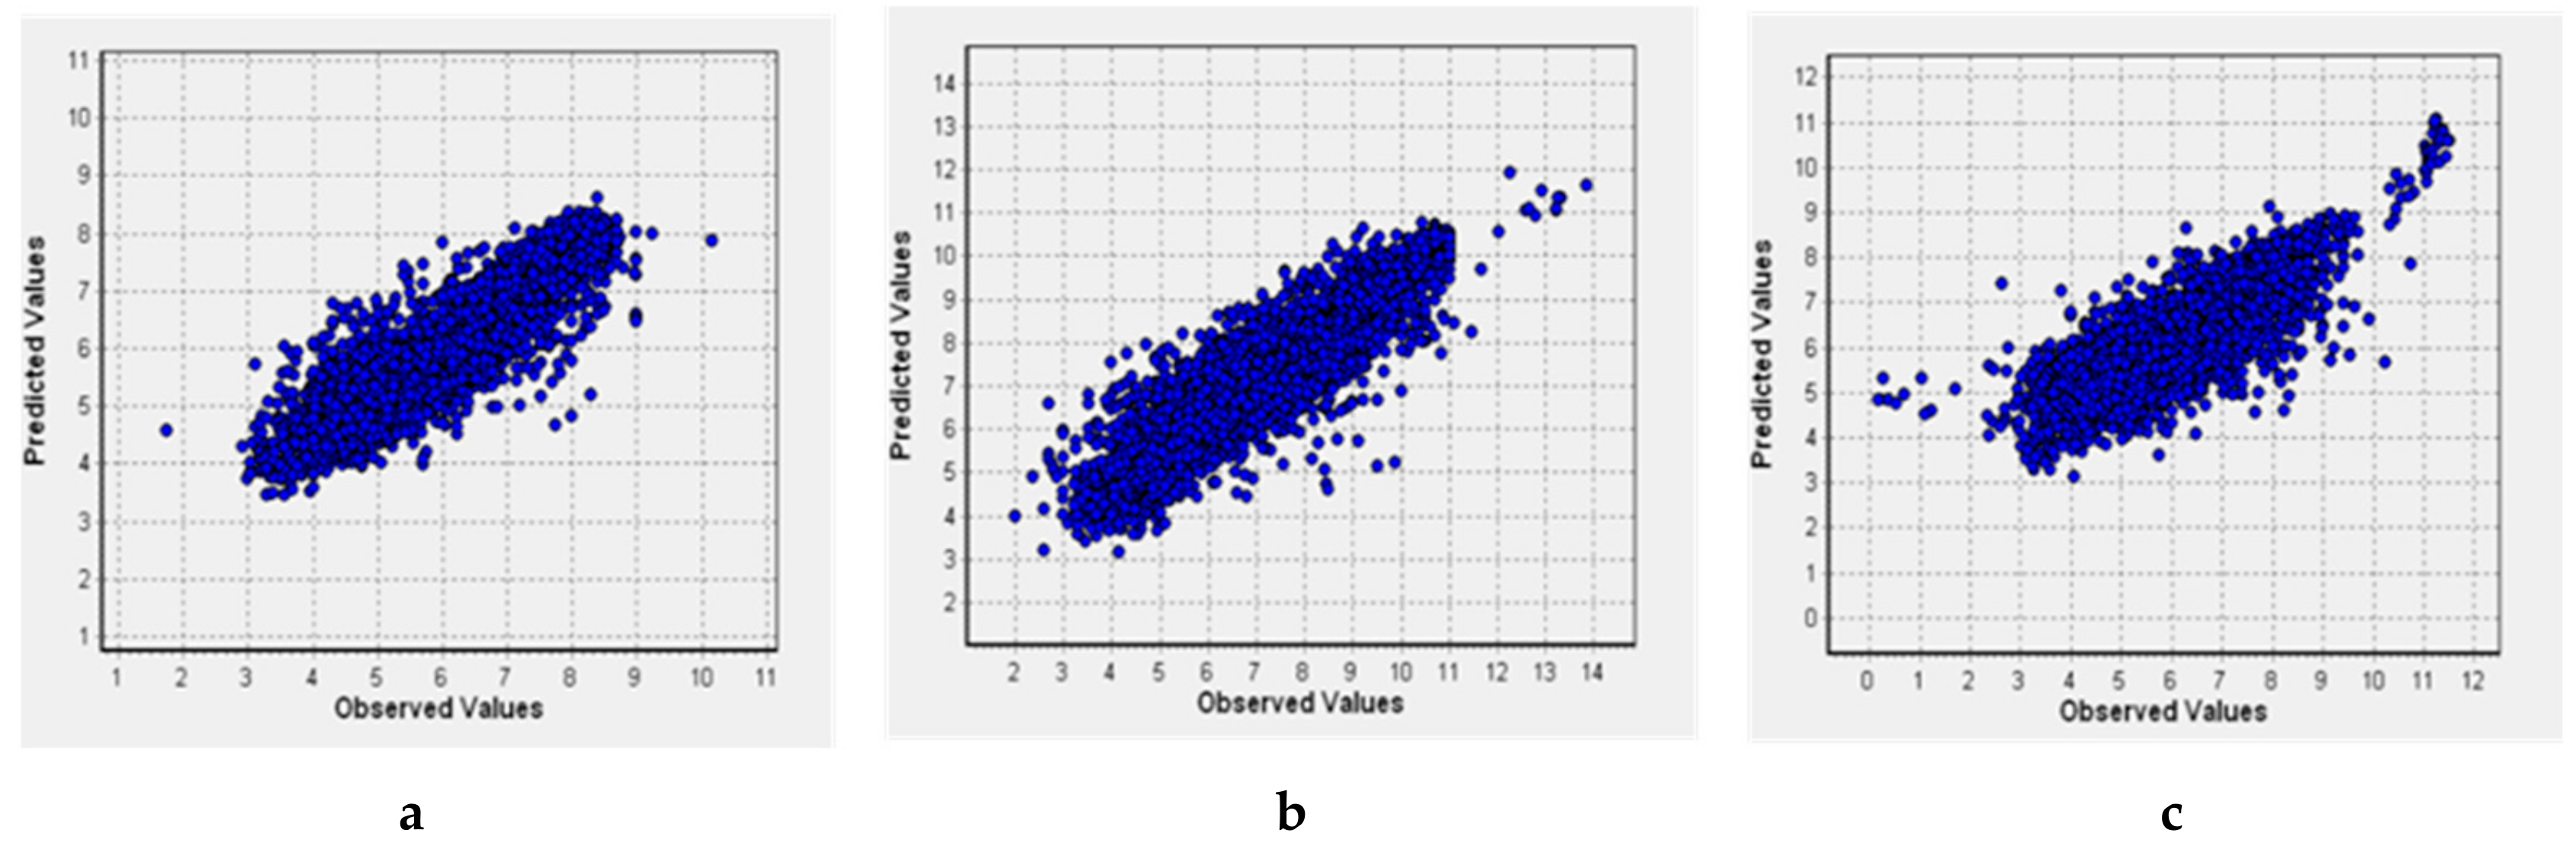
2.5. (Q)SAR Models Based on the Complete Dataset
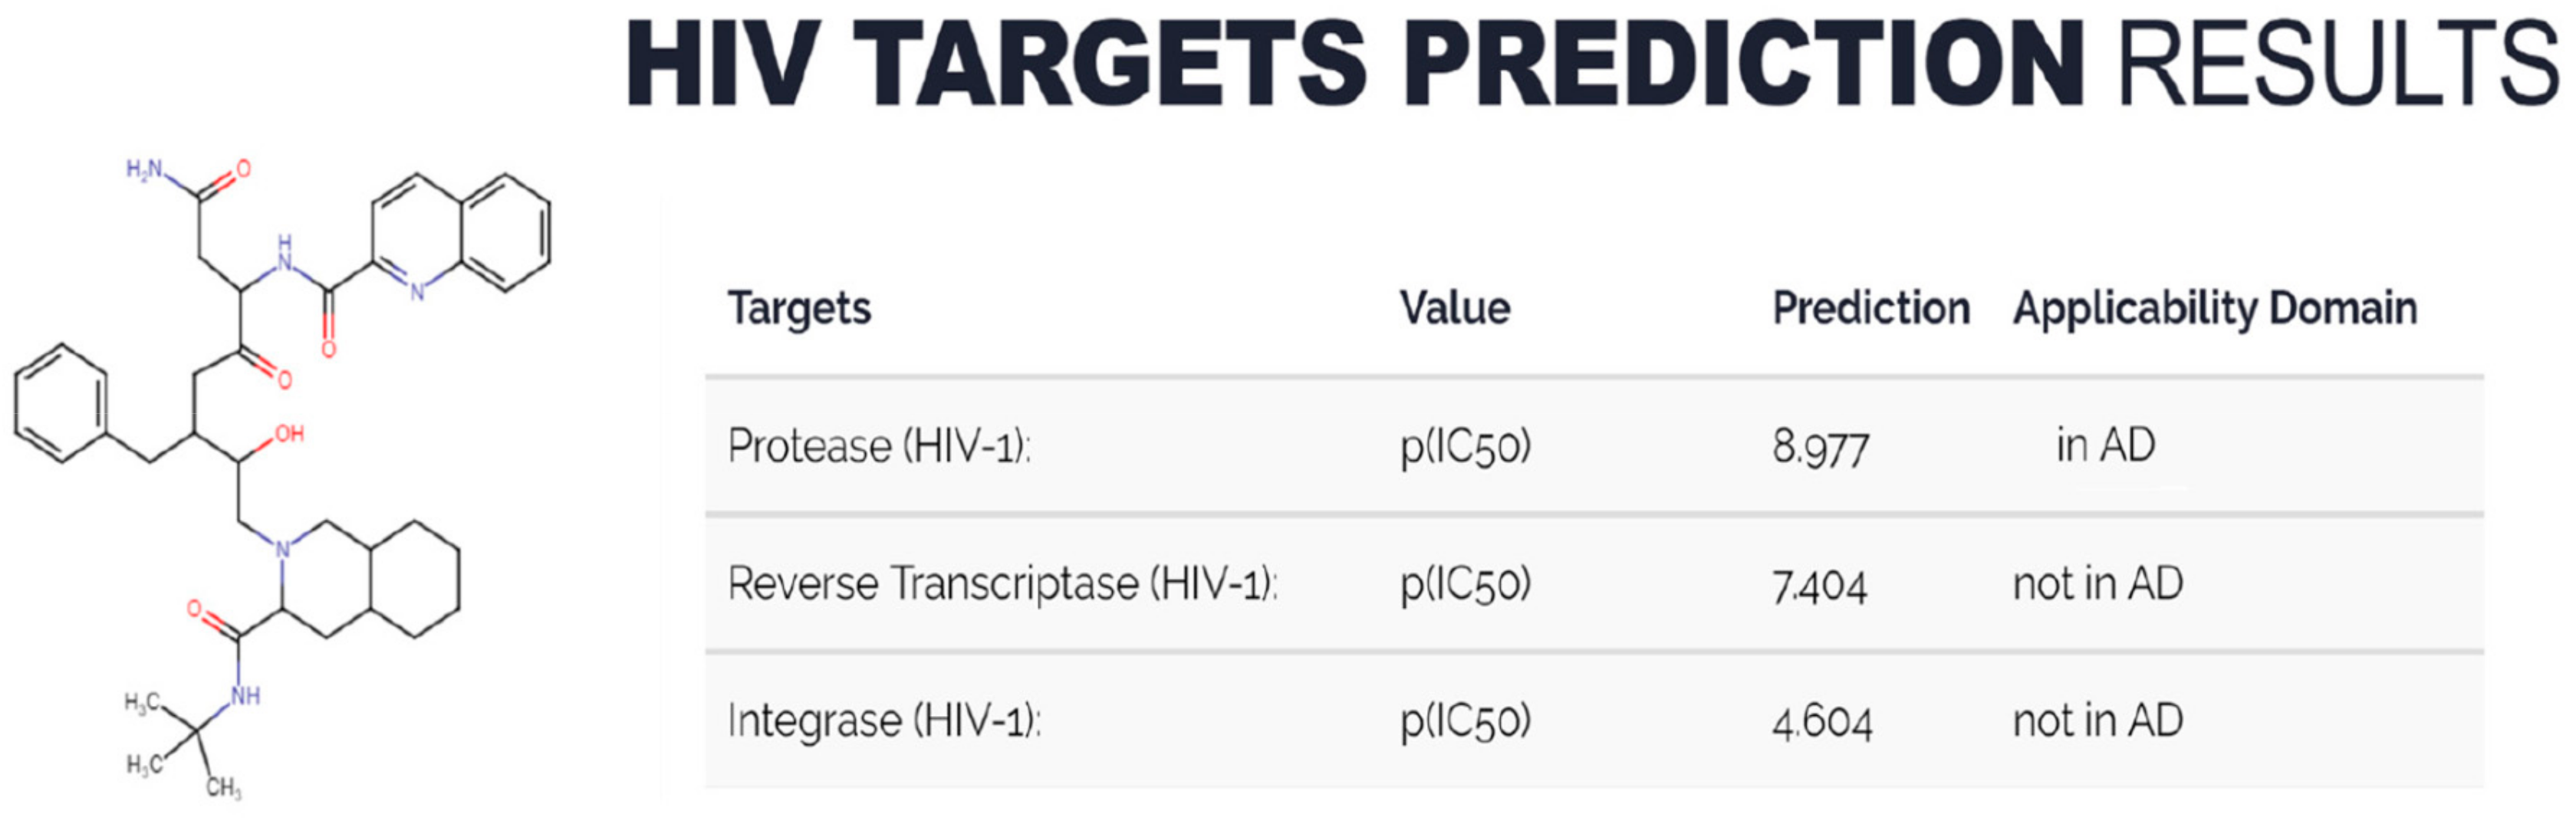
2.6. Implementation of (Q)SAR Models in Web-Service
3. Discussion
4. Materials and Methods
4.1. Sources of Information for Preparation of the Training Sets
4.1.1. NIAID HIV/OI/TB DB Dataset
4.1.2. ChEMBL Datasets
4.1.3. Integrity Dataset
4.2. Data Curation Pipeline
4.3. Modeling Methods
- Each atom must be presented by an atom symbol from the periodic table;
- Each bond must be a covalent bond presented by single, double, or triple bond types only;
- The structure must include three or more carbon atoms;
- The structure must include only one component;
- The molecule must be uncharged;
- The absolute molecular weight of the substance must be less than 1250 Da.
Supplementary Materials
Author Contributions
Funding
Acknowledgments
Conflicts of Interest
References
- Yella, J.K.; Yaddanapudi, S.; Wang, Y.; Jegga, A.G. Changing trends in computational drug repositioning. Pharmaceuticals (Basel) 2018, 11, 57. [Google Scholar] [CrossRef] [PubMed]
- Jorgensen, W.L. The many roles of computation in drug discovery. Science 2004, 303, 1813–1818. [Google Scholar] [CrossRef] [PubMed]
- Chen, Y.C. Beware of docking! Trends Pharmacol. Sci. 2015, 36, 78–95. [Google Scholar] [CrossRef] [PubMed]
- Phillips, M.A.; Stewart, M.A.; Woodling, D.L.; Xie, Z.-R. Has molecular docking ever brought us a medicine. In Molecular Docking; IntechOpen: London, UK, 2018. [Google Scholar] [CrossRef]
- Tarasova, O.; Poroikov, V.; Veselovsky, A. Molecular docking studies of HIV-1 resistance to reverse transcriptase inhibitors: Mini-review. Molecules 2018, 23, 1233. [Google Scholar] [CrossRef] [PubMed]
- Hancsh, C.; Fujita, T. Ro-sigma–pi analysis. A method for the correlation of biological activity and chemical structure. J. Am. Chem. Soc. 1964, 86, 1616–1626. [Google Scholar]
- Free, S.M.; Wilson, J.W. A mathematical contribution to structure-activity studies. J. Med. Chem. 1964, 7, 395–399. [Google Scholar] [CrossRef]
- Franke, R. Theoretical Drug Design Methods; Akademie—Verlag: Berlin, Germany, 1984. [Google Scholar]
- Mayr, A.; Klambauer, G.; Unterthiner, T.; Steijaert, M.; Wegner, J.K.; Ceulemans, H.; Clevert, D.A.; Hochreiter, S. Large-scale comparison of machine learning methods for drug target prediction on ChEMBL. Chem. Sci. 2018, 9, 5441–5451. [Google Scholar] [CrossRef]
- Geronikaki, A.; Eleftheriou, P.; Poroikov, V. Anti-HIV Agents: Current Status and Recent Trends. Top. Med. Chem. 2016, 29, 37–95. [Google Scholar]
- Guasch, L.; Zakharov, A.V.; Tarasova, O.A.; Poroikov, V.V.; Liao, C.; Nicklaus, M.C. Novel HIV-1 integrase inhibitor development by virtual screening based on QSAR models. Cur. Top. Med. Chem. 2016, 16, 441–448. [Google Scholar] [CrossRef]
- Halder, A.K. Finding the structural requirements of diverse HIV-1 protease inhibitors using multiple QSAR modelling for lead identification. SAR QSAR Environ. Res. 2018, 29, 911–933. [Google Scholar] [CrossRef]
- Hdoufane, I.; Bjij, I.; Soliman, M.; Tadjer, A.; Villemin, D.; Bogdanov, J.; Cherqaoui, D. In silico SAR studies of HIV-1 inhibitors. Pharmaceuticals (Basel) 2018, 13, 69. [Google Scholar] [CrossRef] [PubMed]
- Toropova, A.P.; Toropov, A.A.; Veselinović, J.B.; Miljković, F.N.; Veselinović, A.M. QSAR models for HEPT derivates as NNRTI inhibitors based on Monte Carlo method. Eur. J. Med. Chem. 2014, 77, 298–305. [Google Scholar] [CrossRef] [PubMed]
- Synthetically Accessible Virtual Inventory. Available online: https://cactus.nci.nih.gov/download/savi_download/ (accessed on 19 October 2019).
- REAL Compounds Library. Available online: https://www.enaminestore.com/products/real-compounds (accessed on 19 October 2019).
- NIAID HIV/OI/TB Therapeutics Database. Available online: https://chemdb.niaid.nih.gov/ (accessed on 19 October 2019).
- European Bioinformatics Institute ChEMBL Database. Available online: https://www.ebi.ac.uk/chembl/ (accessed on 19 October 2019).
- Clarivate Analytics Integrity Database. Available online: https://integrity.clarivate.com/ (accessed on 19 October 2019).
- Fourches, D.; Muratov, E.; Tropsha, A. Trust, but verify II: A practical guide to chemogenomics data curation. J. Chem. Inf. Model. 2016, 56, 1243–1252. [Google Scholar] [CrossRef] [PubMed]
- Tarasova, O.A.; Urusova, A.F.; Filimonov, D.A.; Nicklaus, M.C.; Zakharov, A.V.; Poroikov, V.V. QSAR Modeling using large-scale databases: case study for HIV-1 reverse transcriptase inhibitors. J. Chem. Inf. Model. 2015, 55, 1388–1399. [Google Scholar] [CrossRef]
- Nikitina, A.A.; Orlov, A.A.; Kozlovskaya, L.I.; Palyulin, V.A.; Osolodkin, D.I. Enhanced taxonomy annotation of antiviral activity data from ChEMBL. Database (Oxford) 2019, bay139. [Google Scholar] [CrossRef]
- Filimonov, D.A.; Lagunin, A.A.; Gloriozova, T.A.; Rudik, A.V.; Druzhilovskiy, D.S.; Pogodin, P.V.; Poroikov, V.V. Prediction of the biological activity spectra of organic compounds using the PASS online web resource. Chem. Heterocycl. Comp. 2014, 50, 444–457. [Google Scholar] [CrossRef]
- Filimonov, D.A.; Zakharov, A.V.; Lagunin, A.A.; Poroikov, V.V. QNA based “Star Track” QSAR approach. SAR QSAR Environ. Res. 2009, 20, 679–709. [Google Scholar] [CrossRef]
- Pogodin, P.V.; Lagunin, A.A.; Rudik, A.V.; Druzhilovskiy, D.S.; Filimonov, D.A.; Poroikov, V.V. AntiBac-Pred: A web portal for predicting antibacterial activity of chemical compounds. J. Chem. Inform. Model. 2019. [Google Scholar] [CrossRef]
- AntiHIV-Pred. Available online: http://www.way2drug.com/hiv/ (accessed on 19 October 2019).
- Stolbov, L.; Druzhilovskiy, D.; Rudik, A.; Filimonov, D.; Poroikov, V.; Nicklaus, M. AntiHIV-Pred: Web-resource for in silico prediction of anti-HIV/AIDS activity. Bioinformatics 2019. [Google Scholar] [CrossRef]
- Tarasova, O.A.; Biziukova, N.Y.; Filimonov, D.A.; Poroikov, V.V.; Nicklaus, M.C. Data mining approach for extraction of useful information about biologically active compounds from publications. J. Chem. Inform. Model. 2019, 59, 3635–3644. [Google Scholar] [CrossRef]
- Tropsha, A. Best Practices for QSAR Model Development, Validation, and Exploitation. Mol. Inform. 2010, 12, 476–488. [Google Scholar] [CrossRef] [PubMed]
- Filimonov, D.; Poroikov, V.; Borodina, Y.; Gloriozova, T. Chemical Similarity Assessment through Multilevel Neighborhoods of Atoms: Definition and Comparison with the Other Descriptors. J. Chem. Inf. Comput. Sci. 1999, 39, 666–670. [Google Scholar] [CrossRef]
Sample Availability: Samples of the compounds are not available from the authors. |


| IN | PR | RT | |
|---|---|---|---|
| NIAID | 10,377/3459 | 7604/5972 | 8936/5675 |
| ChEMBL | 2283/1430 | 2387/1437 | 2149/1390 |
| Integrity | 563/328 | 316/268 | 731/615 |
| Inhibitors of | Active | Inactive | IAP |
|---|---|---|---|
| HIV-1 IN | 1813/1622 | 2108/1930 | 0.924/0.922 |
| HIV-1 PR | 4762/4504 | 1337/1298 | 0.938/0.937 |
| HIV-1 RT | 3142/3054 | 2854/2752 | 0.878/0.878 |
| Inhibitors of | N | R2 | Q2 | RMSD | V |
|---|---|---|---|---|---|
| IN | 3987/3597 | 0.960/0.960 | 0.821/0.819 | 0.587/0.592 | 384/371 |
| PR | 6462/6068 | 0.956/0.957 | 0.829/0.827 | 0.696/0.710 | 494/485 |
| RT | 6093/5894 | 0.943/0.942 | 0.723/0.715 | 0.760/0.776 | 455/441 |
| Model | Test Set | Sensitivity | Specificity | Balanced Accuracy |
|---|---|---|---|---|
| IN, NIAID and ChEMBL | IN, Integrity test set | 0.753 | 0.677 | 0.715 |
| IN, NIAID and Integrity | IN, ChEMBL test set | 0.813 | 0.820 | 0.817 |
| PR, NIAID and ChEMBL | PR, Integrity test set | 0.697 | 0.857 | 0.777 |
| PR, NIAID and Integrity | PR, ChEMBL test set | 0.826 | 0.788 | 0.807 |
| RT, NIAID and ChEMBL | RT, Integrity test set | 0.611 | 0.620 | 0.615 |
| RT, NIAID and Integrity | RT, ChEMBL test set | 0.596 | 0.867 | 0.732 |
| Inhibitors of | Active | Inactive | IAP LOO CV | IAP 20-fold CV |
|---|---|---|---|---|
| IN | 1884 | 2139 | 0.922 | 0.921 |
| PR | 4840 | 1351 | 0.937 | 0.936 |
| RT | 3286 | 2935 | 0.876 | 0.875 |
| Inhibitors of | N | R2 | Q2 | RMSD | V |
|---|---|---|---|---|---|
| IN | 4091 | 0.96 | 0.818 | 0.595 | 392 |
| PR | 6554 | 0.954 | 0.824 | 0.709 | 470 |
| RT | 6309 | 0.941 | 0.714 | 0.767 | 452 |
| IN | PR | RT | |
|---|---|---|---|
| ChEMBL and NIAID | 104 | 92 | 216 |
| Integrity and NIAID | 494 | 486 | 415 |
© 2019 by the authors. Licensee MDPI, Basel, Switzerland. This article is an open access article distributed under the terms and conditions of the Creative Commons Attribution (CC BY) license (http://creativecommons.org/licenses/by/4.0/).
Share and Cite
Stolbov, L.A.; Druzhilovskiy, D.S.; Filimonov, D.A.; Nicklaus, M.C.; Poroikov, V.V. (Q)SAR Models of HIV-1 Protein Inhibition by Drug-Like Compounds. Molecules 2020, 25, 87. https://doi.org/10.3390/molecules25010087
Stolbov LA, Druzhilovskiy DS, Filimonov DA, Nicklaus MC, Poroikov VV. (Q)SAR Models of HIV-1 Protein Inhibition by Drug-Like Compounds. Molecules. 2020; 25(1):87. https://doi.org/10.3390/molecules25010087
Chicago/Turabian StyleStolbov, Leonid A., Dmitry S. Druzhilovskiy, Dmitry A. Filimonov, Marc C. Nicklaus, and Vladimir V. Poroikov. 2020. "(Q)SAR Models of HIV-1 Protein Inhibition by Drug-Like Compounds" Molecules 25, no. 1: 87. https://doi.org/10.3390/molecules25010087
APA StyleStolbov, L. A., Druzhilovskiy, D. S., Filimonov, D. A., Nicklaus, M. C., & Poroikov, V. V. (2020). (Q)SAR Models of HIV-1 Protein Inhibition by Drug-Like Compounds. Molecules, 25(1), 87. https://doi.org/10.3390/molecules25010087