Ionic Liquid-Based Ultrasonic-Assisted Extraction to Analyze Seven Compounds in Psoralea Fructus Coupled with HPLC


Abstract
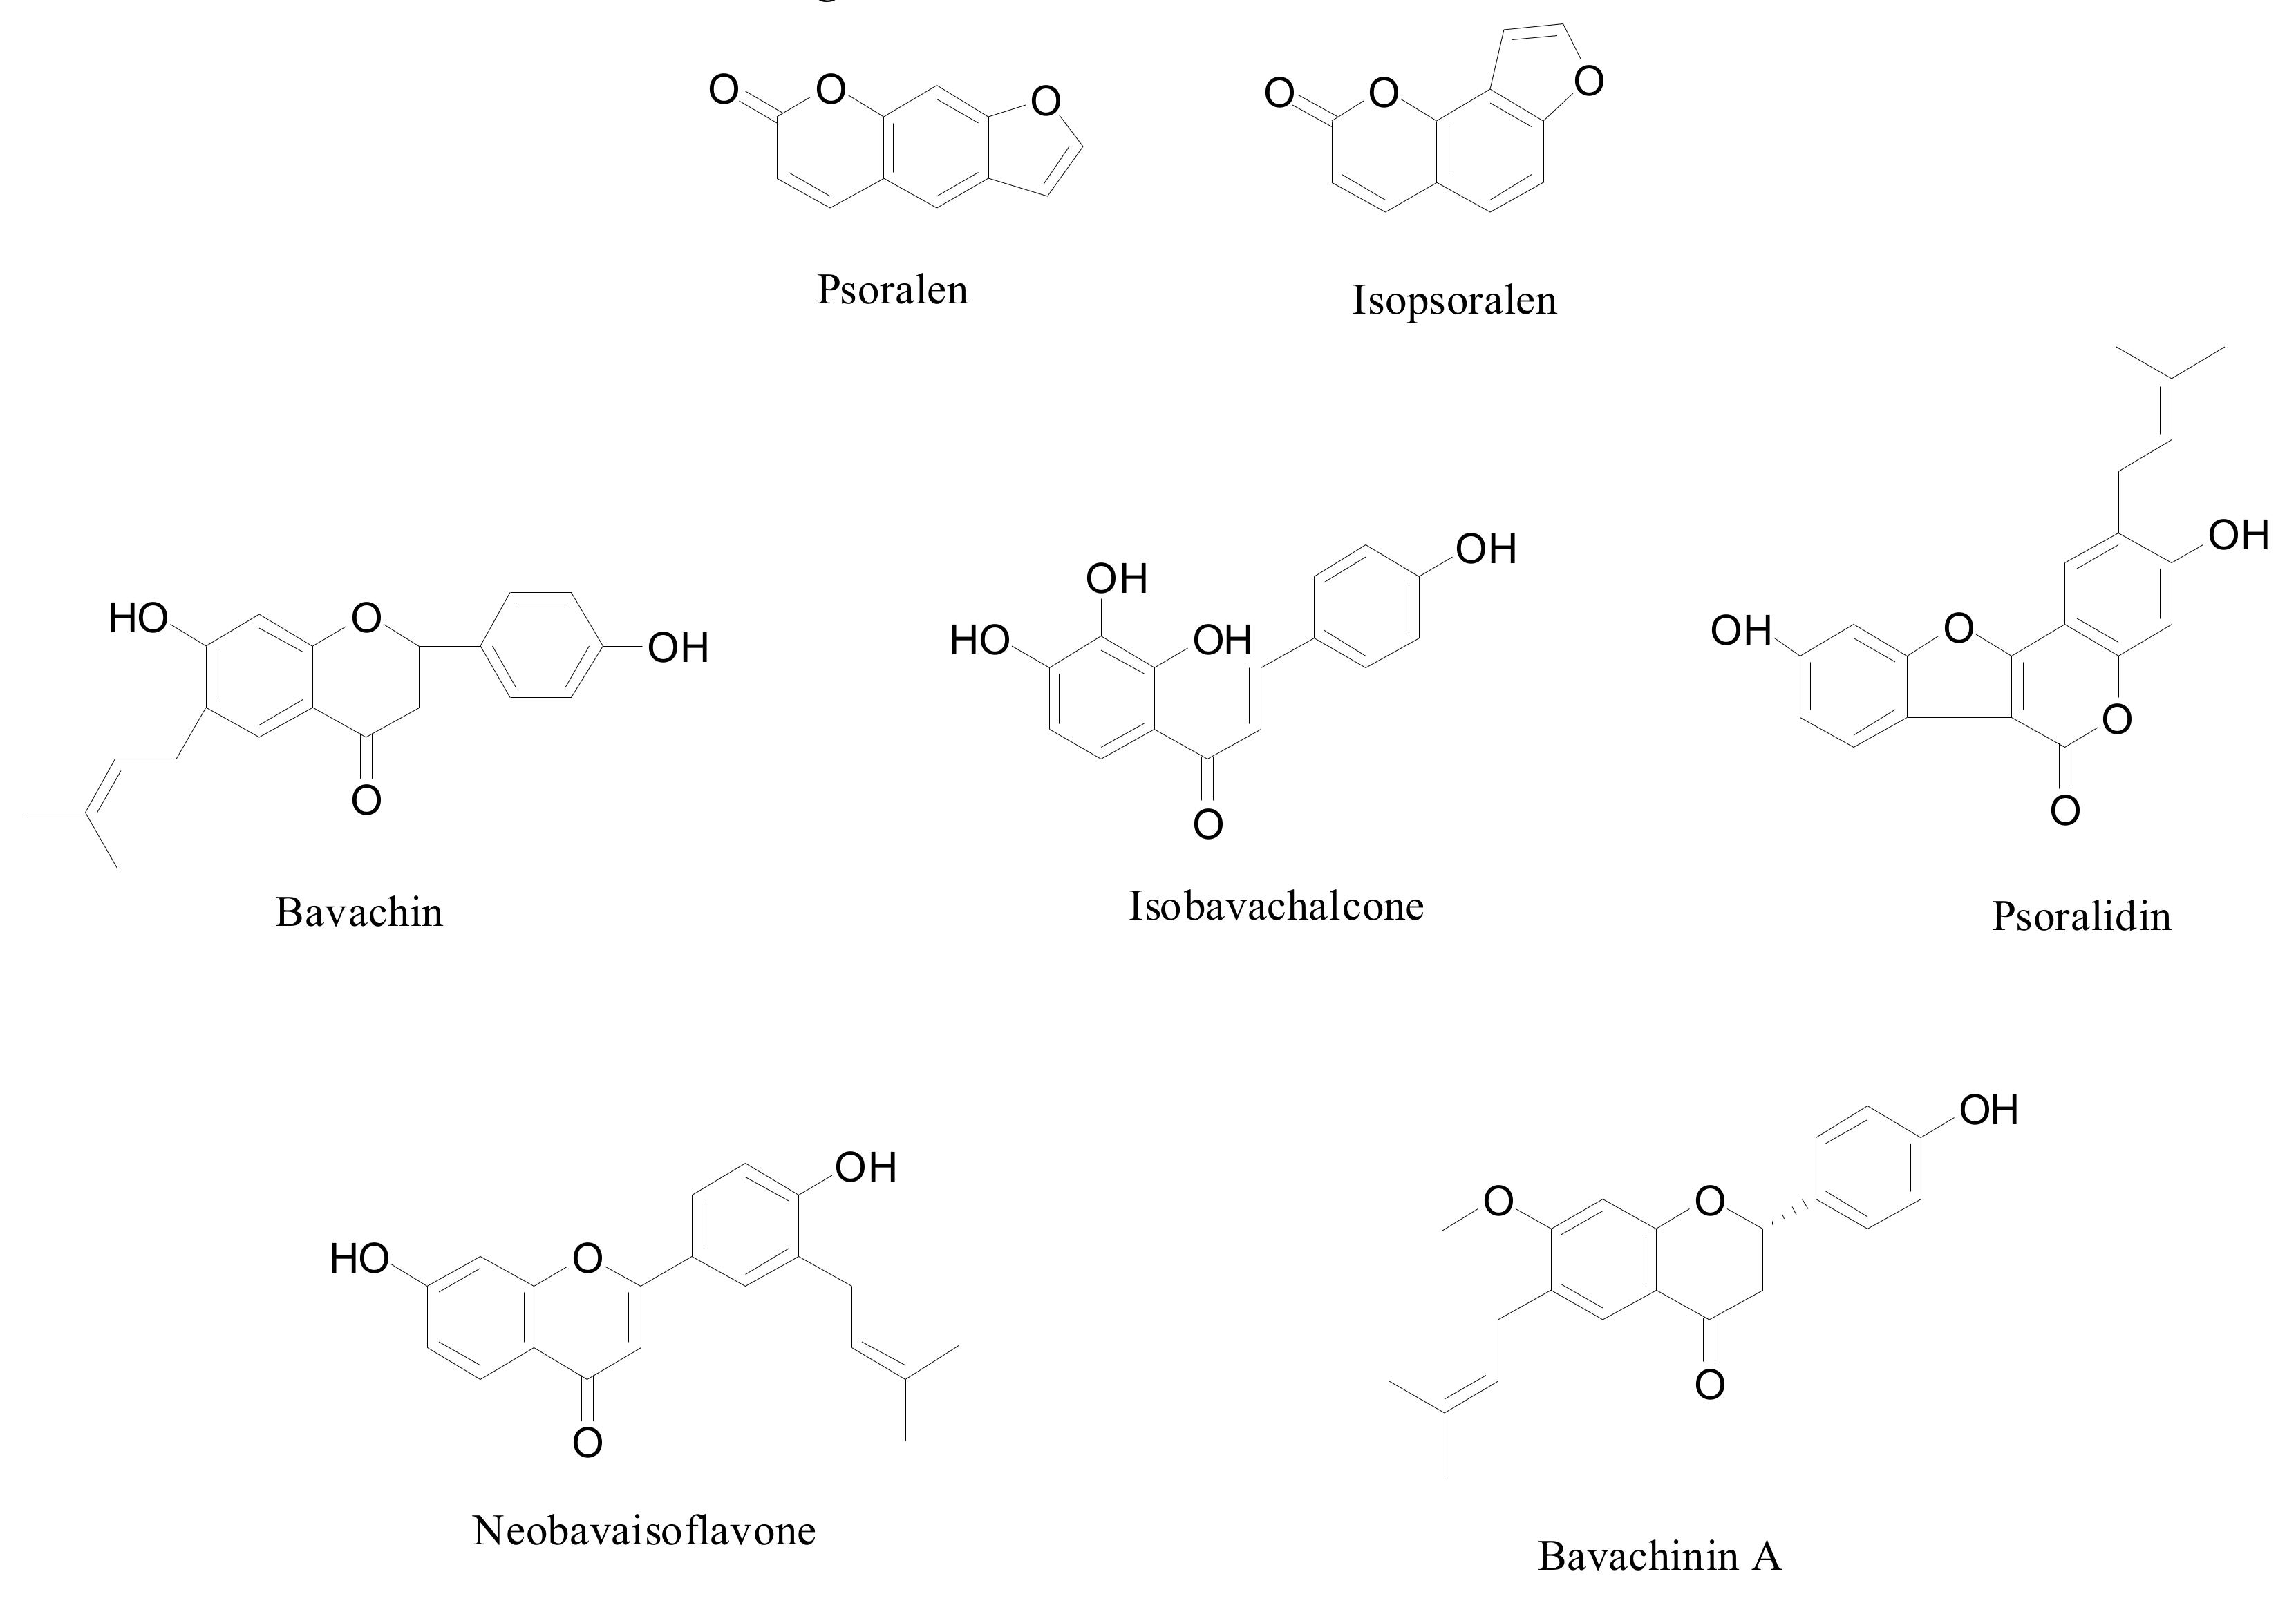
1. Introduction
2. Result and Discussion
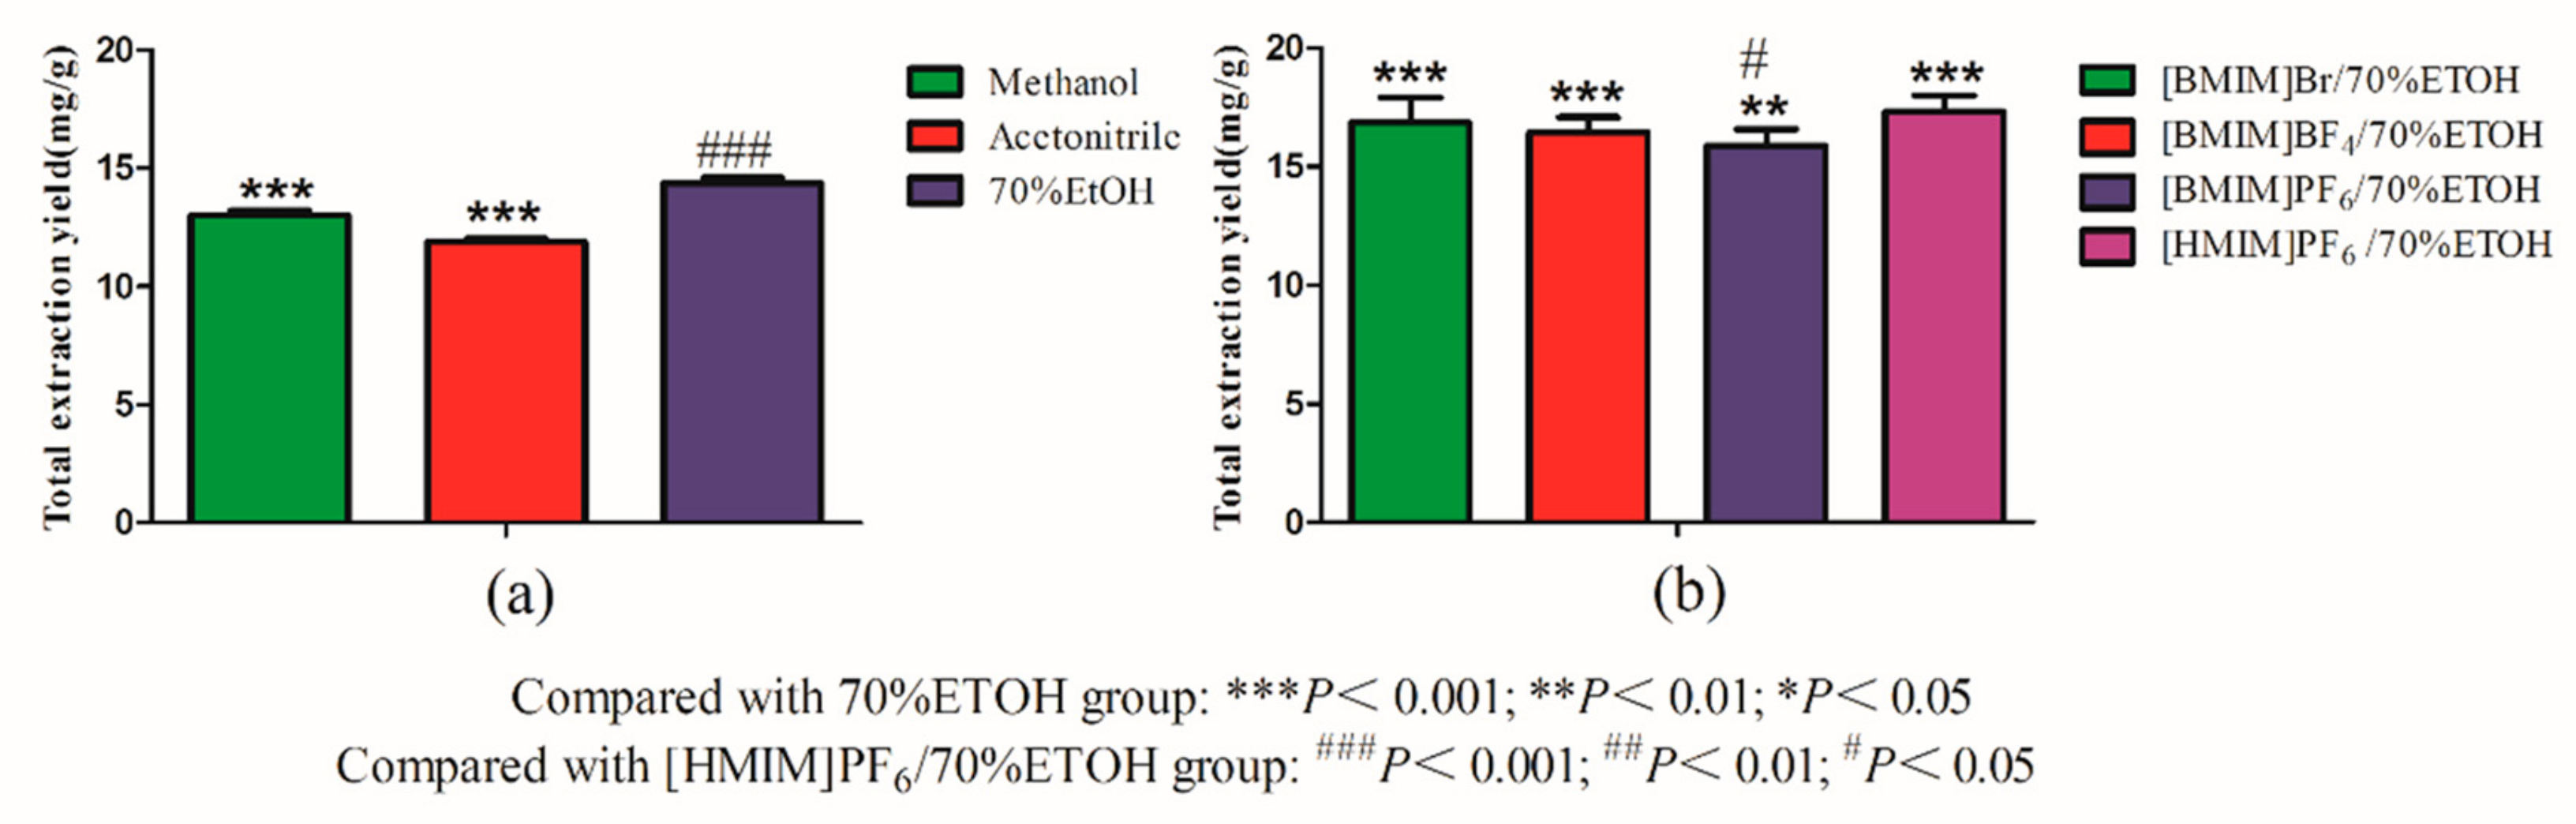
2.1. Screening of Ionic Liquid (ILs)
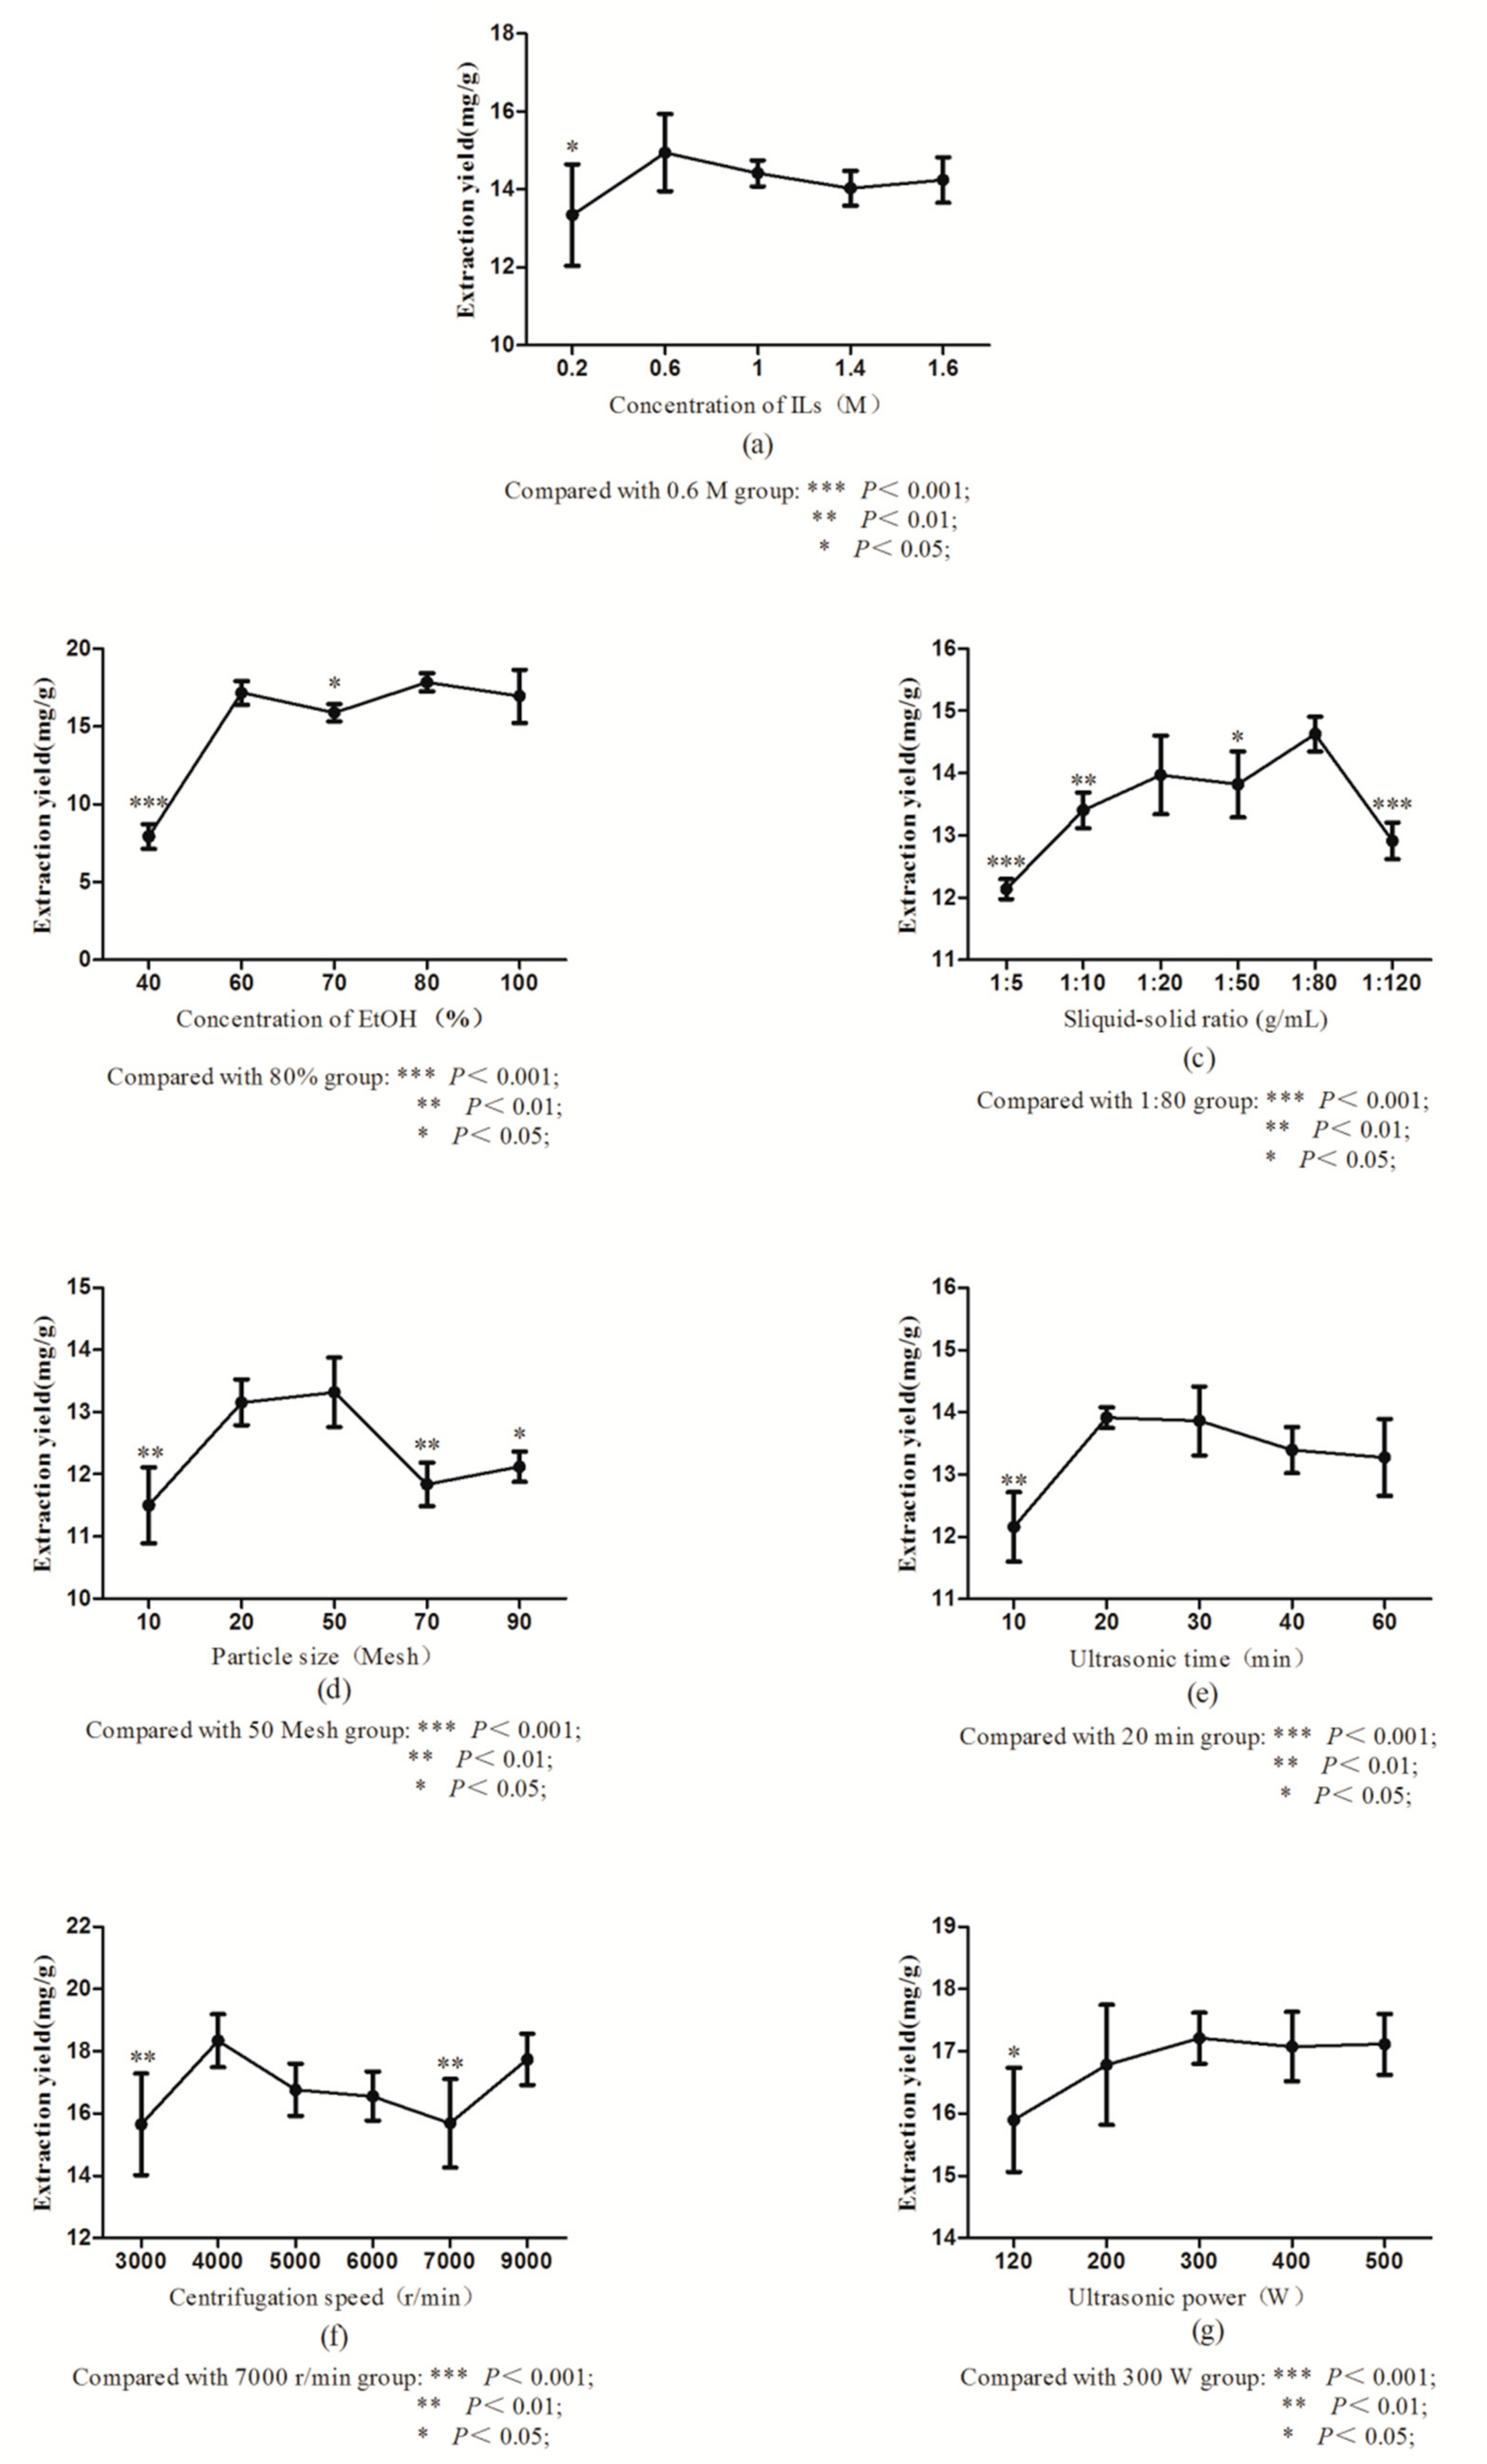
2.2. Single Factor Experiments
2.2.1. Selection of Concentration of ILs
2.2.2. Selection of Concentration of EtOH
2.2.3. Selection of Solid–Liquid Ratio
2.2.4. Selection of Concentration of Particle Size
2.2.5. Selection of Concentration of Ultrasonic Time
2.2.6. Selection of Concentration of Centrifugal Speed
2.2.7. Selection of Concentration of Ultrasonic Power
2.3. Screening of Significant Factors Using a Plackett–Burman (PB) Design
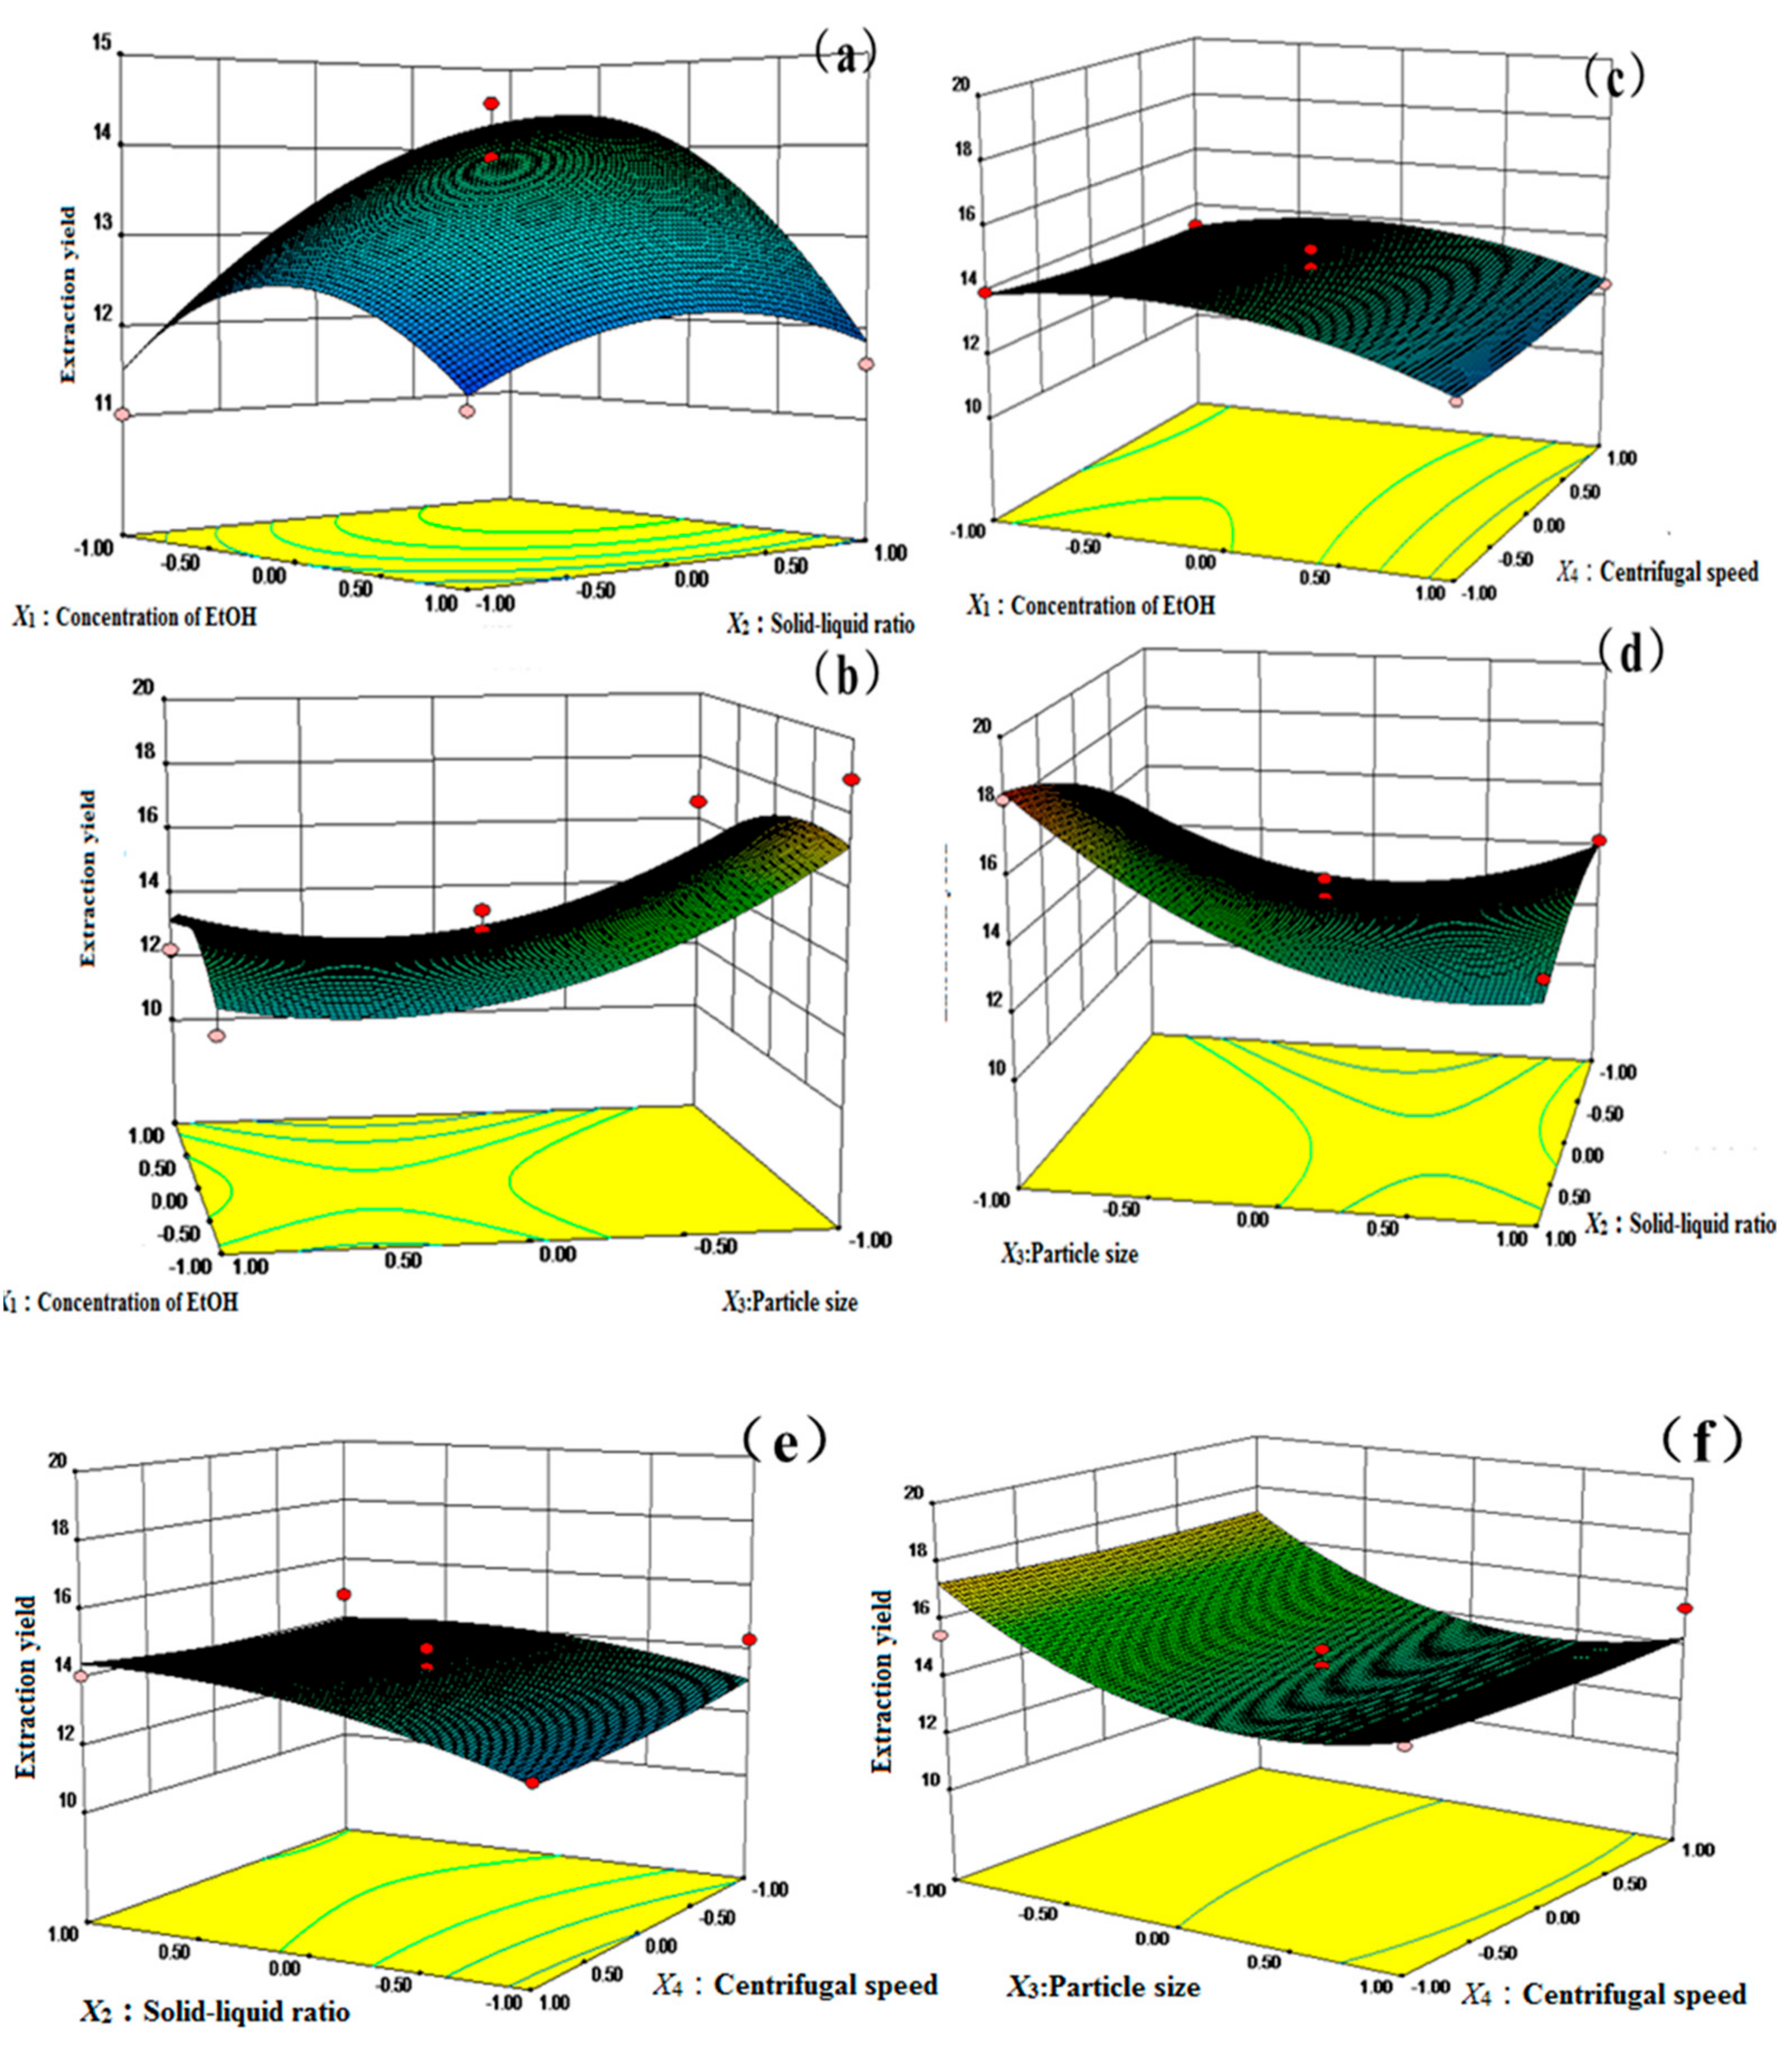
2.4. Optimization of Parameters by the Box–Behnken Design (BBD)
2.5. Comparison with Conventional Solvents Extraction
2.6. Method Validation
3. Materials and Methods
3.1. Materials and Reagent
3.2. Instrument and Chromatographic Conditions
3.3. Preparation of the Standard Solution
3.4. Screening of ILs
3.5. Optimization of Parameters for ILUAE by the Plackett–Burman (PB) Design and Response Surface Methodology (RSM)
3.6. Conventional Solvent Procedures
4. Conclusions
Author Contributions
Funding
Acknowledgments
Conflicts of Interest
References
- People’s Republic of China Pharmacopoeia; China Medical Science Press: Beijing, China, 2015.
- Hadjipavloulitina, D.; Bariamis, S.E.; Militsopoulou, M.; Athanassopoulos, C.M.; Papaioannou, D. Trioxsalen derivatives with lipoxygenase inhibitory activity. J. Enzym. Inhib. Med. Chem. 2009, 24, 1351–1356. [Google Scholar] [CrossRef]
- Daniel, R.S.; Gloria, O.G.; Israel, G.R.; Luis, S.A.; Manuela, M. Molecular basis of DNA photodimerization: Intrinsic production of cyclobutane cytosine dimers. J. Am. Chem. Soc. 2008, 130, 10768–10779. [Google Scholar]
- Zhang, X.; Zhao, W.; Wang, Y.; Lu, J.; Chen, X. The Chemical Constituents and Bioactivities of Psoralea corylifolia Linn: A Review. Am. J. Chin. Med. 2016, 44, 35–60. [Google Scholar] [CrossRef] [PubMed]
- Lau, K.M.; Fu, L.H.; Cheng, L.; Wong, C.W.; Wong, Y.L.; Lau, C.P.; Han, S.Q.; Chan, P.K.; Fung, K.P.; Lau, C.B.; et al. Two antifungal components isolated from Fructus Psoraleae and Folium Eucalypti Globuli by bioassay-guided purification. Am. J. Chin. Med. 2010, 38, 1005–1014. [Google Scholar] [CrossRef]
- Gidwani, B.; Alaspure, R.N. Anti-inflammatory activity of psoralea corylifolia linn. J. Res. Edu. Indian Med. Int. Q. 2010, 16, 55–56. [Google Scholar]
- Feng, J.; Yang, Y.; Zhou, Y.; Wang, B.; Xiong, H.; Fan, C.; Shuai, J.; Liu, J.; Ma, Z.; Wei, H. Bakuchiol attenuates myocardial ischemia reperfusion injury by maintaining mitochondrial function: The role of silent information regulator 1. Apoptosis 2016, 21, 532–545. [Google Scholar] [CrossRef] [PubMed]
- Guo, J.; Weng, X.; Wu, H.; Li, Q.; Bi, K. Antioxidants from a Chinese medicinal herb—Psoralea corylifolia L. Food Chem. 2005, 91, 287–292. [Google Scholar]
- Mao, H.; Wang, H.; Ma, S.; Xu, Y.; Zhang, H.; Wang, Y.; Niu, Z.; Fan, G.; Zhu, Y.; Gao, X.M. Bidirectional regulation of bakuchiol, an estrogenic-like compound, on catecholamine secretion. Toxicol. Appl. Pharmacol. 2014, 274, 180–189. [Google Scholar] [CrossRef] [PubMed]
- Xu, Q.; Pan, Y.; Yi, L.T.; Li, Y.C.; Mo, S.F.; Jiang, F.X.; Qiao, C.F.; Xu, H.X.; Lu, X.B.; Kong, L.D.; et al. Antidepressant-like effects of psoralen isolated from the seeds of Psoralea corylifolia in the mouse forced swimming test. Biol. Pharm. Bull. 2008, 31, 1109–1114. [Google Scholar] [CrossRef] [PubMed]
- Wang, Y.; Hong, C.; Zhou, C.; Xu, D.; Qu, H.B. Screening Antitumor Compounds Psoralen and Isopsoralen from Psoralea corylifolia L. Seeds. Evid. Based Complement. Altern. Med. 2011, 2011, 363052. [Google Scholar] [CrossRef] [PubMed]
- Rajan, V.; Tripathi, J.; Variyar, P.; Pandey, B.N. Mechanism of cytotoxicity by Psoralea corylifolia extract in human breast carcinoma cells. J. Environ. Pathol. Toxicol. Oncol. Off. Organ Int. Soc. Environ. Toxicol. Cancer 2014, 33, 265. [Google Scholar] [CrossRef]
- Seo, E.; Oh, Y.S.; Kim, D.; Lee, M.Y.; Chae, S.; Jun, H.S. Protective Role of Psoralea corylifolia L. Seed Extract against Hepatic Mitochondrial Dysfunction Induced by Oxidative Stress or Aging. Evid. Based Complement. Altern. Med. 2013, 2013, 678028. [Google Scholar] [CrossRef]
- Liu, X.; Nam, J.W.; Song, Y.S.; Viswanath, A.N.I.; Pae, A.N.; Kil, Y.S.; Kim, H.D.; Park, J.H.; Seo, E.K.; Chang, M. Psoralidin, a coumestan analogue, as a novel potent estrogen receptor signaling molecule isolated from Psoralea corylifolia. Bioorg. Med. Chem. Lett. 2014, 24, 1403–1406. [Google Scholar] [CrossRef]
- Park, J.; Kim, D.H.; Ahn, H.N.; Yun, S.S.; Lee, Y.J.; Ryu, J.H. Activation of Estrogen Receptor by Bavachin from Psoralea corylifolia. Biomol. Ther. 2012, 20, 183–188. [Google Scholar] [CrossRef]
- Stern, R. Psoralen and ultraviolet a light therapy for psoriasis. N. Engl. J. Med. 2007, 357, 682. [Google Scholar] [CrossRef] [PubMed]
- Conforti, F.; Marrelli, M.; Menichini, F.; Bonesi, M.; Statti, G.; Provenzano, E.; Menichini, F. Natural and Synthetic Furanocoumarins as Treatment for Vitiligo and Psoriasis. Curr. Drug Ther. 2009, 4, 38–58. [Google Scholar] [CrossRef]
- Szliszka, E.; Czuba, Z.P.; Sędek, Ł.; Paradysz, A.; Król, W. Enhanced TRAIL-mediated apoptosis in prostate cancer cells by the bioactive compounds neobavaisoflavone and psoralidin isolated from Psoralea corylifolia. Pharmacol. Rep. 2011, 63, 139–148. [Google Scholar] [CrossRef]
- Don, M.J.; Lin, L.C.; Chiou, W.F. Neobavaisoflavone stimulates osteogenesis via p38-mediated up-regulation of transcription factors and osteoid genes expression in MC3T3-E1 cells. Phytomedicine 2012, 19, 551–561. [Google Scholar] [CrossRef] [PubMed]
- Luo, J.; Liang, Q.; Shen, Y.; Chen, X.; Yin, Z.; Wang, M. Biotransformation of bavachinin by three fungal cell cultures. J. Biosci. Bioeng. 2014, 117, 191–196. [Google Scholar] [CrossRef] [PubMed]
- Jin, X.; Shi, Y.I. Isobavachalcone induces the apoptosis of gastric cancer cells via inhibition of the Akt and Erk pathways. Exp. Ther. Med. 2016, 11, 403. [Google Scholar] [CrossRef] [PubMed]
- Wang, T.X.; Yin, Z.H.; Wei, Z.; Tao, P.; Kang, W.Y. Chemical constituents from Psoralea corylifolia and their antioxidant α-glucosidase inhibitory and antimicrobial activities. China J. Chin. Mater. Med. 2013, 38, 2328–2333. [Google Scholar]
- Juan, Z. Study on Antibacterial Mechanism of Corylifolinio; Henan University: Kaifeng, China, 2016. [Google Scholar]
- Xin, D.; Wang, H.; Yang, J.; Su, Y.F.; Fan, G.W.; Wang, Y.F.; Zhu, Y.; Gao, X.M. Phytoestrogens from Psoralea corylifolia reveal estrogen receptor-subtype selectivity. Phytomedicine 2010, 17, 126–131. [Google Scholar] [CrossRef]
- Li, W.D.; Yan, C.P.; Wu, Y.; Weng, Z.B.; Yin, F.Z.; Yang, G.M.; Cai, B.C.; Chen, Z.P. Osteoblasts proliferation and differentiation stimulating activities of the main components of Fructus Psoraleae corylifoliae. Phytomed. Int. J. Phytother. Phytopharm. 2014, 21, 400–405. [Google Scholar] [CrossRef]
- Wang, Y.; Jin, G.; Qian, L.; Guo, B.; Zhou, Y. Study on the ionic liquids-based extraction technology of total flavonoids from Broussonetia papyriferaleaves. Chem. Ind. Eng. Prog. 2016, 35, 328–331. [Google Scholar]
- Mocan, A.; Diuzheva, A.; Carradori, S.; Andruch, V.; Massafra, C.; Moldovan, C.; Sisea, C.; Petzer, J.P.; Petzer, A.; Zara, S. Development of novel techniques to extract phenolic compounds from Romanian cultivars of Prunus domestica L. and their biological properties. Food Chem. Toxicol. 2018, 119, 189–198. [Google Scholar] [CrossRef]
- Mocan, A.; Diuzheva, A.; Andruch, V.; Massafra, C.; Moldovan, C. Liquid Phase and Microwave-Assisted Extractions for Multicomponent Phenolic Pattern Determination of Five Romanian Galium Species Coupled with Bioassays. Molecules 2019, 24, 1226. [Google Scholar] [CrossRef]
- Tsukasa, T.; Tetsuya, T.; Ken-Ichi, O.; Susumu, K. New frontiers in materials science opened by ionic liquids. Adv. Mater. 2010, 22, 1196–1221. [Google Scholar]
- Moniruzzaman, M.; Nakashima, K.; Kamiya, N.; Goto, M. Recent advances of enzymatic reactions in ionic liquids. Biochem. Eng. J. 2010, 48, 295–314. [Google Scholar] [CrossRef]
- Poole, C.F.; Poole, S.K. Extraction of organic compounds with room temperature ionic liquids. J. Chromatogr. A 2010, 1217, 2268–2286. [Google Scholar] [CrossRef] [PubMed]
- Katharina, B.; Julia, S.; Hough, W.L.; Macfarlane, D.R.; Rogers, R.D. Liquid forms of pharmaceutical co-crystals: Exploring the boundaries of salt formation. Chem. Commun. 2011, 47, 2267–2269. [Google Scholar]
- Xia, Z.; Li, D.; Li, Q.; Yan, Z.; Kang, W. Simultaneous determination of brazilin and protosappanin B in Caesalpinia sappan by ionic-liquid dispersive liquid-phase microextraction method combined with HPLC. Chem. Cent. J. 2017, 11, 114. [Google Scholar] [CrossRef]
- Yang, L.; Li, L.L.; Liu, T.T.; Zu, Y.G.; Yang, F.J.; Zhao, C.J.; Zhang, L.; Chen, X.Q.; Zhang, Z.H. Development of sample preparation method for isoliquiritigenin, liquiritin, and glycyrrhizic acid analysis in licorice by ionic liquids-ultrasound based extraction and high-performance liquid chromatography detection. Food Chem. 2013, 138, 173–179. [Google Scholar] [CrossRef]
- Lin, H.; Zhang, Y.; Han, M.; Yang, L. Aqueous ionic liquid based ultrasonic assisted extraction of eight ginsenosides from ginseng root. Ultrason. Sonochem. 2013, 20, 680–684. [Google Scholar] [CrossRef]
- Shi, M.; He, N.; Li, W.; Li, C.; Kang, W. Simultaneous determination of myricetrin, quercitrin and afzelin in leaves of Cercis chinensis by a fast and effective method of ionic liquid microextraction coupled with HPLC. Chem. Cent. J. 2018, 12, 23. [Google Scholar] [CrossRef] [PubMed]
- Xiao, W.; Yang, F.Q.; Xia, Z.N. Applications of ionic liquids in chromatographic analysis of natural products. Chin. J. Pharm. Anal. 2015, 35, 856–866. [Google Scholar]
- Zhao, Y.L.; Yuan, Y.C.; Zhang, X.L. Synthesis and application of green ionic siquids. Chem. Eng. 2010, 9, 38–41. [Google Scholar]
- Li, W.; Shi, M.; Wang, P.; Guo, X.; Li, C.; Kang, W. Efficient determination of three flavonoids in Malus pumila flowers by ionic liquid-HPLC. J. Mol. Liq. 2018, 263, 139–146. [Google Scholar] [CrossRef]
- Wei, J.; Cao, P.; Wang, J.; Kang, W. Analysis of tilianin and acacetin in Agastache rugosa by high-performance liquid chromatography with ionic liquids-ultrasound based extraction. Chem. Cent. J. 2016, 10, 76. [Google Scholar] [CrossRef]
- Bhan, M.; Satija, S.; Garg, C.; Dureja, H.; Garg, M. Optimization of ionic liquid-based microwave assisted extraction of a diterpenoid lactone-andrographolide from Andrographis paniculata by response surface methodology. J. Mol. Liq. 2017, 229, 161–166. [Google Scholar] [CrossRef]
- Guo, J.B.; Fan, Y.; Zhang, W.J.; Wu, H.; Du, L.M.; Chang, Y.X. Extraction of gingerols and shogaols from ginger (Zingiber officinale Roscoe) through microwave technique using ionic liquids. J. Food Compos. Anal. 2017, 62, 35–42. [Google Scholar] [CrossRef]
- Bogdanov, M.G. Ionic Liquids as Alternative Solvents for Extraction of Natural Products; Springer: Berlin/Heidelberg, Germany, 2014; pp. 127–166. [Google Scholar]
- Harde, S.M.; Lonkar, S.L.; Degani, M.S.; Singhal, R.S. Ionic liquid based ultrasonic-assisted extraction of forskolin from Coleus forskohlii roots. Ind. Crop. Prod. 2014, 61, 258–264. [Google Scholar] [CrossRef]
- Tan, Z.; Li, Q.; Wang, C.; Zhou, W.; Yang, Y.; Wang, H.; Yi, Y.; Li, F. Ultrasonic Assisted Extraction of Paclitaxel from Taxus x media Using Ionic Liquids as Adjuvants: Optimization of the Process by Response Surface Methodology. Molecules 2017, 22, 1483. [Google Scholar] [CrossRef]
- Kim, G.J.; Kim, J.H. A simultaneous microwave-assisted extraction and adsorbent treatment process under acidic conditions for recovery and separation of paclitaxel from plant cell cultures. Korean J. Chem. Eng. 2015, 32, 1023–1028. [Google Scholar] [CrossRef]
- Kim, G.J.; Kim, J.H. Enhancement of extraction efficiency of paclitaxel from biomass using ionic liquid-methanol co-solvents under acidic conditions. Process Biochem. 2015, 50, 989–996. [Google Scholar] [CrossRef]
- Wei, Q.; Gui, Q.; Qiu, Z.; Fei, X.U.; Xiaoying, J.I.; University, A.X. Microwave-Assisted Extraction and Antioxidant Activities in vitro of Polysaccharides from Cercis chinensis Bunge Flowers. Food Sci. 2015, 36, 39–44. [Google Scholar]
- Jin, R.; Fan, L.; An, X. Ionic Liquid-Assisted Extraction of Paeonol from Cynanchum paniculatum. Chromatographia 2011, 73, 787–792. [Google Scholar] [CrossRef]
- Liang, P.; Wang, F.; Qin, W. Ionic liquid-based ultrasound-assisted emulsification microextraction coupled with high performance liquid chromatography for the determination of four fungicides in environmental water samples. Talanta 2013, 105, 57–62. [Google Scholar] [CrossRef] [PubMed]
- Zhi-Yuan, H.E. Study on Ultrasonic Power Extraction of Costunolide and Dehydrocostuslactone from Radix valdimiriae. J. Anhui Agric. Sci. 2010, 38, 20040–20042. [Google Scholar]
- Zhao, Q.; Kennedy, J.F.; Wang, X.; Yuan, X.; Zhao, B.; Peng, Y.; Huang, Y. Optimization of ultrasonic circulating extraction of polysaccharides from Asparagus officinalis using response surface methodology. Int. J. Biol. Macromol. 2011, 49, 181–187. [Google Scholar] [CrossRef]
- Chen, F.; Zhang, Q.; Fei, S.; Gu, H.; Yang, L. Optimization of ultrasonic circulating extraction of samara oil from Acer saccharum using combination of Plackett-Burman design and Box-Behnken design. Ultrason. Sonochem. 2017, 35, 161–175. [Google Scholar] [CrossRef]
- Box, G.E.P.; Behnken, D.W. Some New Three Level Designs for the Study of Quantitative Variables. Technometrics 1960, 2, 455–475. [Google Scholar] [CrossRef]
- Meng, X.J.; Dong-Nan, L.I.; Wang, Y.Q.; Liu, X.M.; Liu, J.; Bin, L.I. Response Surface Methodology as An Approach for Optimization of Extraction of Water-soluble Polysaccharides from Schisandra chinensis (Turcz.) Baill. Food Sci. 2010, 31, 111–115. [Google Scholar]
- Wasserscheid, P.; Keim, W. Ionic Liquids-New “Solutions” for Transition Metal Catalysis. Angew. Chem. Int. Ed. 2000, 39, 3772–3789. [Google Scholar] [CrossRef]
- Han, S.; Wong, H.T.; Livingston, A.G. Application of Organic Solvent Nanofiltration to Separation of Ionic Liquids and Products from Ionic Liquid Mediated Reactions. Chem. Eng. Res. Des. 2005, 83, 309–316. [Google Scholar] [CrossRef]
Sample Availability: Samples of the compounds psoralen, isopsoralen, neobavaisoflavone, bavachin, psoralidin, isobavachalcone, and bavachinin are available from the authors. |


| No. | A (M/L) | B (%) | C (g/mL) | D (Mesh) | E (min) | F (r/min) | G (W) | Total Extraction Yield (mg/g) |
|---|---|---|---|---|---|---|---|---|
| 1 | 1(1) | −1(80%) | −1(1:120) | −1(20) | 1(30) | −1(3000) | 1(500) | 17.85 |
| 2 | −1(0.2) | −1 | −1 | −1 | −1(10) | −1 | −1(200) | 17.10 |
| 3 | −1 | −1 | −1 | 1(70) | −1 | 1 (5000) | 1 | 13.84 |
| 4 | −1 | 1(100%) | −1 | 1 | 1 | −1 | 1 | 11.67 |
| 5 | 1 | 1 | 1(1:50) | −1 | −1 | −1 | 1 | 17.00 |
| 6 | 1 | 1 | −1 | 1 | 1 | 1 | −1 | 13.38 |
| 7 | −1 | 1 | 1 | −1 | 1 | 1 | 1 | 14.22 |
| 8 | 1 | −1 | 1 | 1 | 1 | −1 | −1 | 13.88 |
| 9 | −1 | −1 | 1 | −1 | 1 | 1 | −1 | 19.87 |
| 10 | 1 | 1 | −1 | −1 | −1 | 1 | −1 | 21.78 |
| 11 | 1 | −1 | 1 | 1 | −1 | 1 | 1 | 14.18 |
| 12 | −1 | 1 | 1 | 1 | −1 | −1 | −1 | 11.53 |
| Source | Sum of Squares | Degree of Freedom | Mean Square | F-Value | p-Value | Inference |
|---|---|---|---|---|---|---|
| Model | 112.46 | 10 | 11.25 | 935.34 | 0.0254 | Significance |
| Residua | 0.012 | 1 | 0.012 | |||
| Cor total | 112.47 | 11 | ||||
| R2 = 0.9999; Ragj2 = 0.9988 | ||||||
| Term | Mean Square | F-Value | p-Value | |||
| A | 11.25 | 935.34 | 0.061 | |||
| B | 18.95 | 1576.04 | 0.024 | Significance | ||
| C | 8.49 | 705.83 | 0.0276 | Significance | ||
| D | 6.4 | 532.15 | 0.0116 | Significance | ||
| E | 36.14 | 3006.1 | 0.0706 | |||
| F | 0.97 | 80.74 | 0.0418 | Significance | ||
| G | 2.79 | 231.66 | 0.066 | |||
| Level | X1 (%) | X2 (g/mL) | X3 (Mesh) | X4 (r/min) |
|---|---|---|---|---|
| −1 | 60 | 1:120 | 20 | 3000 |
| 0 | 80 | 1:80 | 40 | 4000 |
| 1 | 100 | 1:40 | 60 | 5000 |
| Run Order | X1 | X2 | X3 | X4 | Extraction Yield (mg/g) | Total Extraction Yield (mg/g) | |
|---|---|---|---|---|---|---|---|
| Coumarin | Flavone | ||||||
| 1 | 0 | 1 | 0 | 1 | 16.03 | 11.07 | 14.04 |
| 2 | 1 | 0 | 0 | −1 | 13.16 | 10.47 | 12.09 |
| 3 | 0 | 0 | 0 | 0 | 15.69 | 10.56 | 13.64 |
| 4 | 1 | 0 | 0 | 1 | 13.33 | 11.00 | 12.39 |
| 5 | 1 | 0 | 1 | 0 | 13.84 | 9.82 | 12.23 |
| 6 | 0 | −1 | 1 | 0 | 16.59 | 10.66 | 14.22 |
| 7 | −1 | −1 | 0 | 0 | 13.05 | 7.96 | 11.01 |
| 8 | 0 | 0 | 1 | 1 | 17.93 | 11.56 | 15.38 |
| 9 | 0 | 0 | 0 | 0 | 16.03 | 9.87 | 13.57 |
| 10 | −1 | 1 | 0 | 0 | 16.73 | 9.05 | 13.66 |
| 11 | 0 | −1 | 0 | −1 | 16.46 | 11.09 | 14.31 |
| 12 | −1 | 0 | −1 | 0 | 22.95 | 12.84 | 18.91 |
| 13 | 0 | −1 | −1 | 0 | 17.44 | 8.29 | 13.78 |
| 14 | 0 | 0 | 0 | 0 | 16.74 | 11.01 | 14.45 |
| 15 | 0 | 1 | 1 | 0 | 16.61 | 9.87 | 13.91 |
| 16 | 0 | 0 | −1 | −1 | 18.79 | 10.53 | 15.48 |
| 17 | −1 | 0 | 1 | 0 | 14.89 | 9.00 | 12.54 |
| 18 | 0 | 1 | 0 | −1 | 17.02 | 11.46 | 14.79 |
| 19 | 0 | 0 | 0 | 0 | 16.17 | 9.78 | 13.61 |
| 20 | 1 | 0 | −1 | 0 | 19.35 | 12.36 | 16.55 |
| 21 | −1 | 0 | 0 | 1 | 15.55 | 9.87 | 13.28 |
| 22 | 0 | 0 | 0 | 0 | 16.19 | 10.34 | 13.85 |
| 23 | −1 | 0 | 0 | −1 | 16.22 | 10.59 | 13.97 |
| 24 | 0 | −1 | 0 | 1 | 14.52 | 9.11 | 12.35 |
| 25 | 0 | 1 | −1 | 0 | 21.32 | 13.54 | 18.21 |
| 26 | 0 | 0 | −1 | 1 | 20.23 | 10.97 | 16.52 |
| 27 | 0 | 0 | 1 | −1 | 17.09 | 10.02 | 14.26 |
| 28 | 1 | 1 | 0 | 0 | 12.55 | 10.16 | 11.60 |
| 29 | 1 | −1 | 0 | 0 | 12.56 | 9.61 | 11.38 |
| Source | Sum of Squares | df | Mean Square | F Value | p Value |
|---|---|---|---|---|---|
| Model | 80.22 | 14 | 5.73 | 4.82 | 0.0029 ** |
| X1 | 4.22 | 1 | 4.22 | 3.55 | 0.0804 |
| X2 | 7.01 | 1 | 7.01 | 5.9 | 0.0292 |
| X3 | 23.83 | 1 | 23.83 | 20.06 | 0.0005 |
| X4 | 0.071 | 1 | 0.071 | 0.06 | 0.8098 |
| X1X2 | 1.48 | 1 | 1.48 | 1.24 | 0.2834 |
| X1X3 | 1.05 | 1 | 1.05 | 0.88 | 0.3637 |
| X1X4 | 0.25 | 1 | 0.25 | 0.21 | 0.6535 |
| X2X3 | 5.61 | 1 | 5.61 | 4.72 | 0.0474 |
| X2X4 | 0.36 | 1 | 0.36 | 0.31 | 0.5889 |
| X3X4 | 0.0016 | 1 | 0.0016 | 0.0014 | 0.9712 |
| X12 | 6.47 | 1 | 6.47 | 5.45 | 0.035 |
| X22 | 1.89 | 1 | 1.89 | 1.59 | 0.2274 |
| X32 | 21.06 | 1 | 21.06 | 17.73 | 0.0009 |
| X42 | 0.17 | 1 | 0.17 | 0.14 | 0.7113 |
| Residual | 16.63 | 14 | 1.19 | ||
| Lack of fit | 16.1 | 10 | 1.61 | 12.09 | 0.0141 * |
| Pure error | 0.53 | 4 | 0.13 | ||
| Cor total | 96.85 | 28 |
| Analyte | Regression Equation | Linear Range (μg) | Correlation Coefficient | LOD (ng) | LOQ (ng) |
|---|---|---|---|---|---|
| Psoralen | Y = 6467788X + 592182 | 0.2150~9.677 | 0.9998 | 0.2150 | 0.4301 |
| Isopsoralen | Y = 8303251X − 504662 | 0.2238~10.07 | 0.9999 | 0.2238 | 0.4476 |
| Neobavaisoflavone | Y = 4085132X + 42249.1 | 0.06885~3.098 | 0.9999 | 0.4131 | 1.3770 |
| Bavachin | Y = 3233926X − 86602.6 | 0.03072~1.382 | 0.9974 | 0.6144 | 1.5360 |
| Psoralidin | Y = 3225382X + 2381.59 | 0.1030~4.637 | 0.9999 | 0.3091 | 2.0608 |
| Isobavachalcone | Y = 2246978X + 579.852 | 0.03768~1.696 | 0.9999 | 0.4522 | 1.8840 |
| Bavachinin A | Y = 1943405X + 66464.4 | 0.1392~6.264 | 0.9996 | 0.2784 | 2.7840 |
© 2019 by the authors. Licensee MDPI, Basel, Switzerland. This article is an open access article distributed under the terms and conditions of the Creative Commons Attribution (CC BY) license (http://creativecommons.org/licenses/by/4.0/).
Share and Cite
Shi, M.; Zhang, J.; Liu, C.; Cui, Y.; Li, C.; Liu, Z.; Kang, W. Ionic Liquid-Based Ultrasonic-Assisted Extraction to Analyze Seven Compounds in Psoralea Fructus Coupled with HPLC. Molecules 2019, 24, 1699. https://doi.org/10.3390/molecules24091699
Shi M, Zhang J, Liu C, Cui Y, Li C, Liu Z, Kang W. Ionic Liquid-Based Ultrasonic-Assisted Extraction to Analyze Seven Compounds in Psoralea Fructus Coupled with HPLC. Molecules. 2019; 24(9):1699. https://doi.org/10.3390/molecules24091699
Chicago/Turabian StyleShi, Mengjun, Juanjuan Zhang, Cunyu Liu, Yiping Cui, Changqin Li, Zhenhua Liu, and Wenyi Kang. 2019. "Ionic Liquid-Based Ultrasonic-Assisted Extraction to Analyze Seven Compounds in Psoralea Fructus Coupled with HPLC" Molecules 24, no. 9: 1699. https://doi.org/10.3390/molecules24091699
APA StyleShi, M., Zhang, J., Liu, C., Cui, Y., Li, C., Liu, Z., & Kang, W. (2019). Ionic Liquid-Based Ultrasonic-Assisted Extraction to Analyze Seven Compounds in Psoralea Fructus Coupled with HPLC. Molecules, 24(9), 1699. https://doi.org/10.3390/molecules24091699