
Greek Graviera Cheese Assessment through Elemental Metabolomics—Implications for Authentication, Safety and Nutrition

 ,
,  ,
,
Abstract
1. Introduction
2. Results & Discussion
2.1. Elemental Concentrations in Greek Graviera and Implications for Authentication
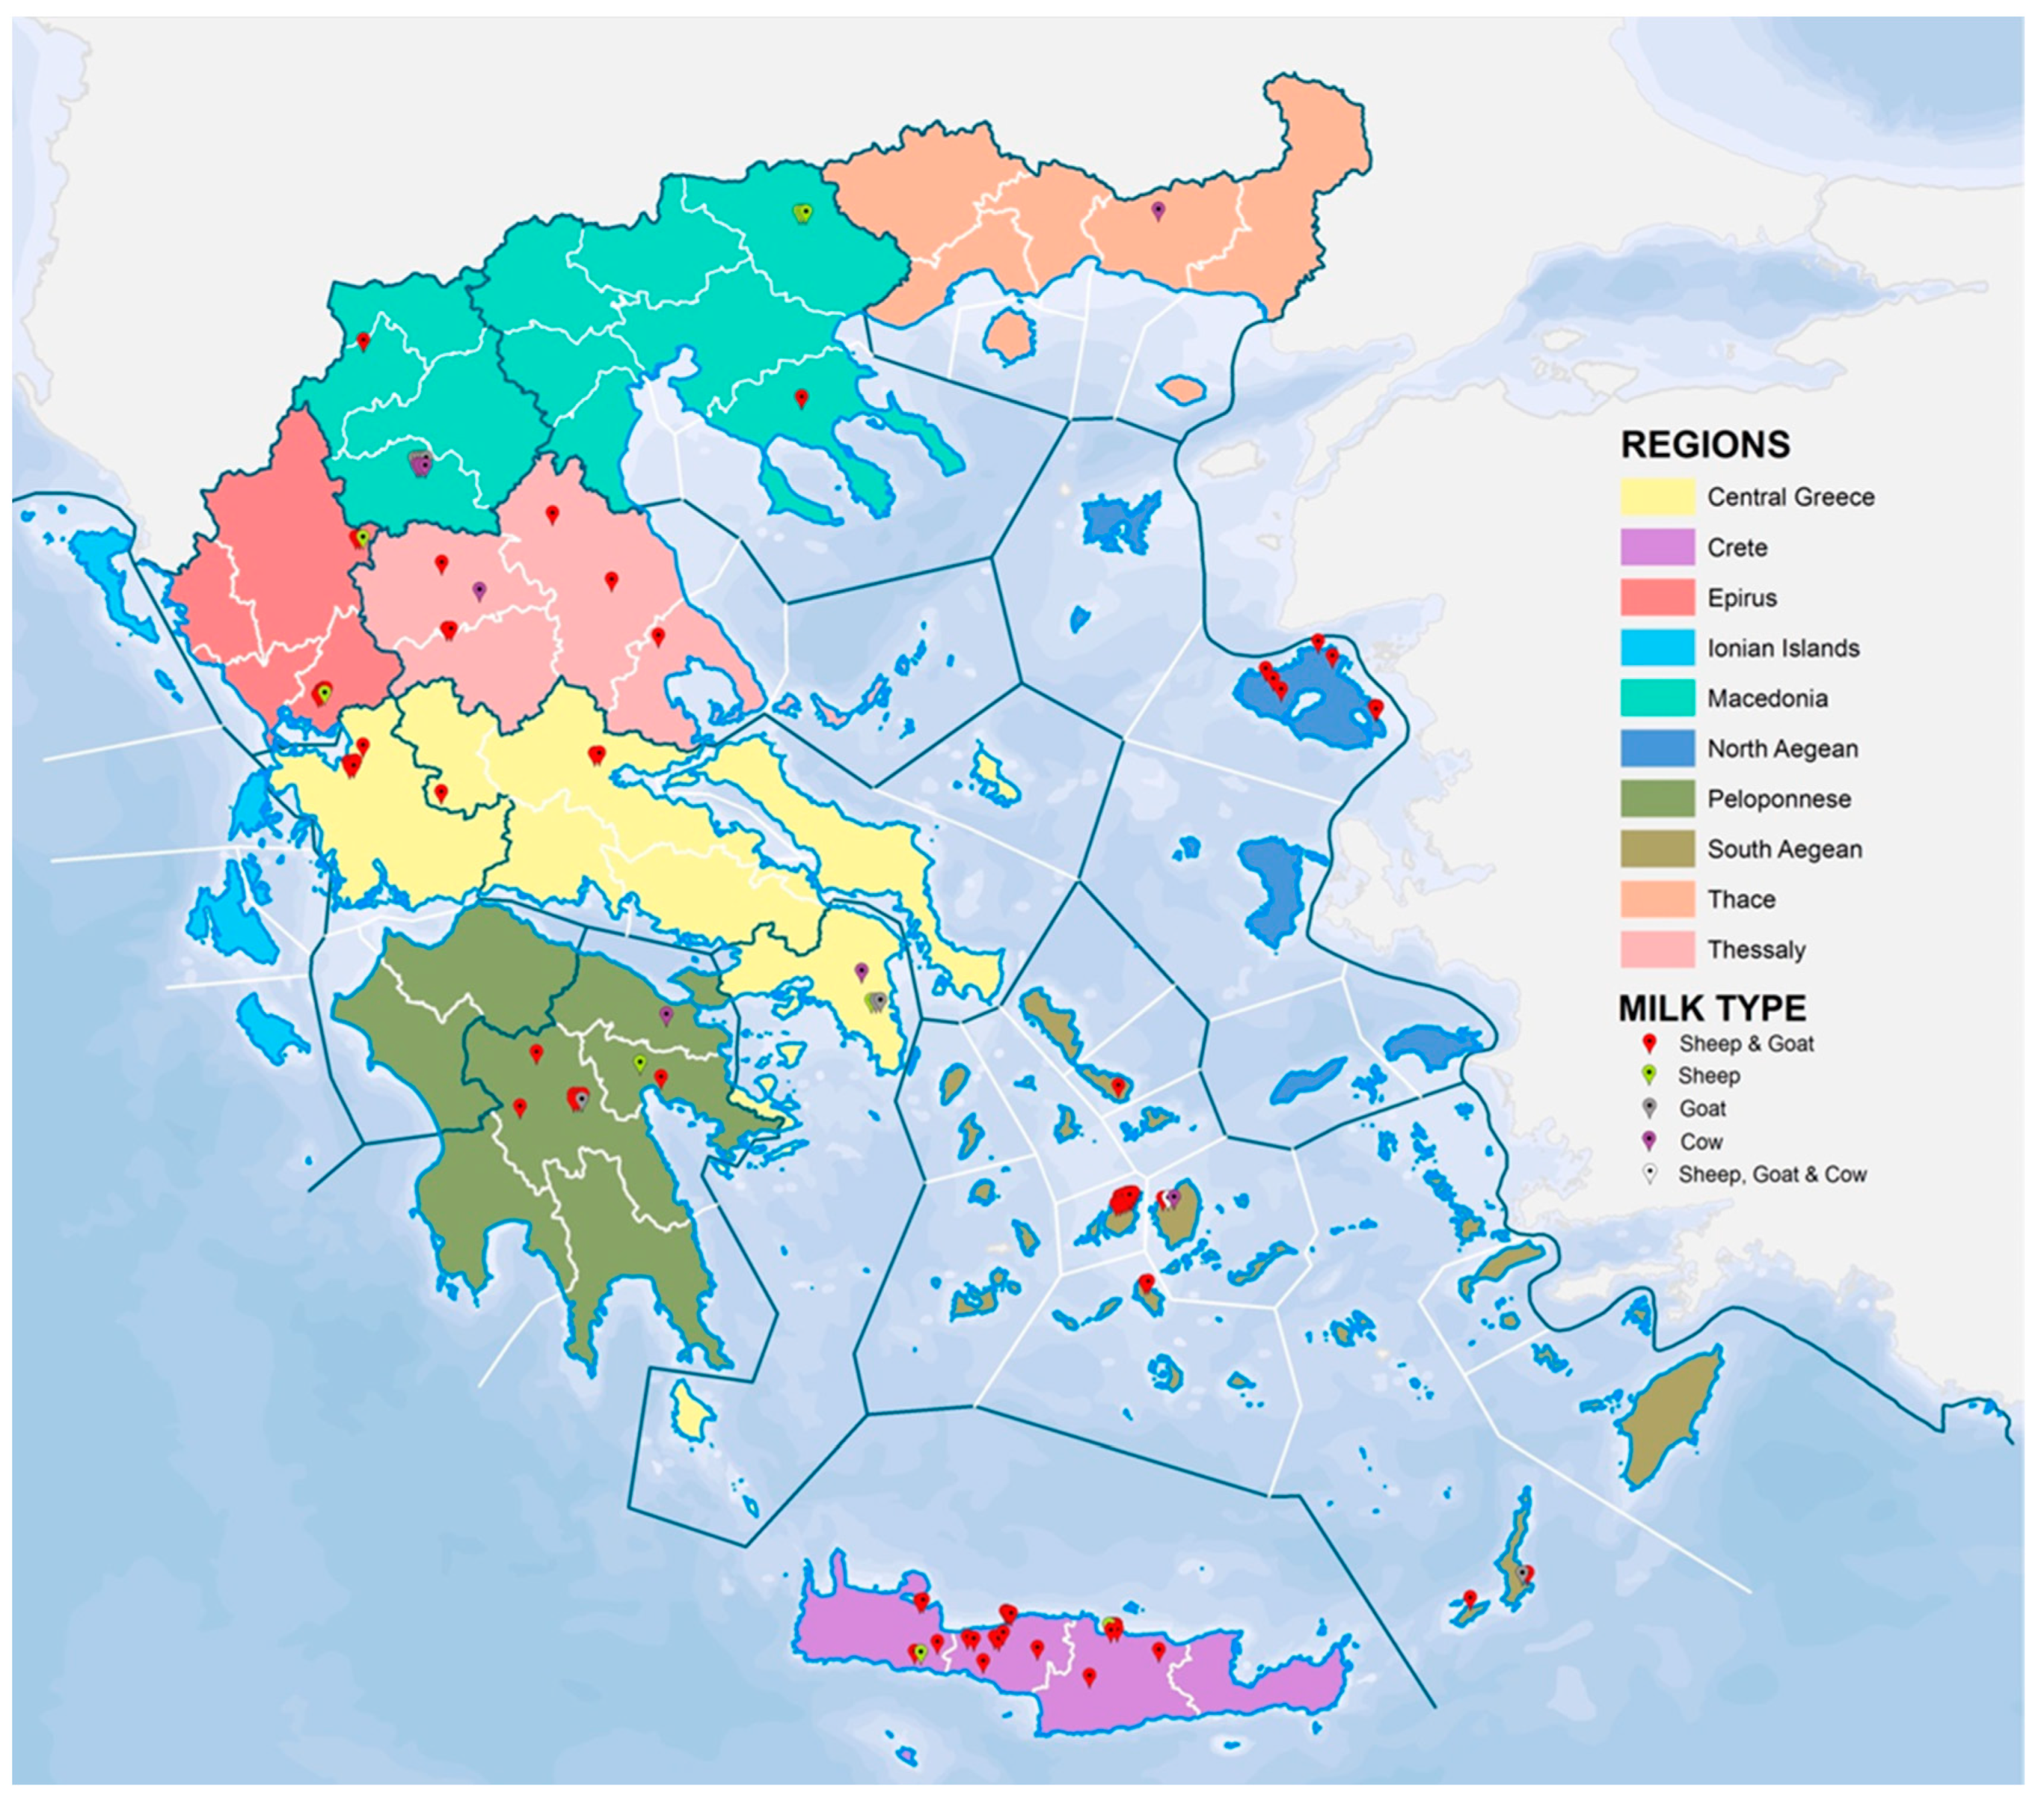
2.1.1. Geographical Origin
2.1.2. Milk Type
2.2. Contribution to Total Diet—Safety Aspects and Nutritional Value
3. Materials and Methods
3.1. Instrumentation and Reagents
3.2. Sample Collection, Preparation and Digestion
3.3. ICP-MS Analysis
- REEs: Ce, Dy, Er, Eu, Gd, Ho, La, Lu, Nd, Pr, Sc, Sm, Tb, Tm, Y, Yb
- Actinides: Th, U
- Precious metals: Au, Ir, Pd, Pt, Re, Rh, Ru
- Ultra-trace elements: Hf, Nb, Sb, Sn, Ta, Tl, W, Zr
- Trace elements: Ag, Al, As, B, Ba, Bi, Cd, Co, Cr, Cs, Cu, Fe, Ga, Mn, Mo, Ni, Pb, Rb, Se, Si, Sr, Ti, V, Zn
- Macro elements: Ca, K, Mg, P
- ➢
- Start
- Daily performance check with set up solution from Perkin Elmer that contains 10 μg L−1 of the following elements: Be, Mg, Co, In, Pb
- Standard solutions for REEs, actinides, precious metals and ultra-trace elements of 0.001, 0.01, 0.1, 0.5, 1, 5, 10, 50, 100 and 1000 μg L−1
- Standard solutions for macro and trace elements of 0.01, 0.1, 0.5, 1, 5, 10, 50, 100, 1000 and 10000 μg L−1
- ➢
- Steps to be repeated after 4 h:
- Standard reference materials
- Blank
- Samples
- ➢
- End
- Standard reference materials
3.4. Calibration and Quality Assurance
- Trace and macro elements, ERM-BD151 skimmed milk powder (IRMM), RM 8414 bovine muscle powder (NIST) and RM 1573a tomato leaves (NIST).
- Rare earth elements and actinides CRM-668 mussel tissue (IRMM).
3.5. Statistical Analysis
4. Conclusions
Supplementary Materials
Author Contributions
Funding
Acknowledgments

Conflicts of Interest
References
- Danezis, G.P.; Tsagkaris, A.S.; Camin, F.; Brusic, V.; Georgiou, C.A. Food authentication: Techniques, trends & emerging approaches. TrAC Trends Anal. Chem. 2016, 85, 123–132. [Google Scholar]
- Danezis, G.P.; Tsagkaris, A.S.; Brusic, V.; Georgiou, C.A. Food authentication: State of the art and prospects. Curr. Opin. Food Sci. 2016, 10, 22–31. [Google Scholar] [CrossRef]
- Karoui, R. Methodologies for the Characterization of the Quality of Dairy Products. In Advances in Food and Nutrition Research; Toldrá, F., Ed.; Academic Press Inc.: Cambridge, MA, USA, 2017; Volume 82, pp. 237–275. [Google Scholar]
- Hadjigeorgiou, I. Past, present and future of pastoralism in Greece. Pastoralism 2011, 1, 1–24. [Google Scholar] [CrossRef]
- Litopoulou-Tzanetaki, E.; Tzanetakis, N. The Microfloras of Traditional Greek Cheeses. Microbiol Spectr 2014, 2, CM-0009-2012. [Google Scholar] [CrossRef] [PubMed]
- Cunha, J.T.; Ribeiro, T.I.B.; Rocha, J.B.; Nunes, J.; Teixeira, J.A.; Domingues, L. RAPD and SCAR markers as potential tools for detection of milk origin in dairy products: Adulterant sheep breeds in Serra da Estrela cheese production. Food Chem. 2016, 211, 631–636. [Google Scholar] [CrossRef] [PubMed]
- Fontenele, M.A.; Bastos, M.D.S.R.; dos Santos, K.M.O.; Bemquerer, M.P.; do Egito, A.S. Peptide profile of Coalho cheese: A contribution for Protected Designation of Origin (PDO). Food Chem. 2017, 219, 382–390. [Google Scholar] [CrossRef]
- Brandao, M.P.; de Carvalho dos Anjos, V.; Bell, M.J.V. Time resolved fluorescence of cow and goat milk powder. Spectrochim Acta A Mol. Biomol. Spectrosc. 2017, 171, 193–199. [Google Scholar] [CrossRef]
- Moreno-Rojas, R.; Cámara-Martos, F.; Sánchez-Segarra, P.J.; Amaro-López, M.A. Influence of manufacturing conditions and discrimination of Northern Spanish cheeses using multi-element analysis. Int. J. Dairy Technol. 2012, 65, 594–602. [Google Scholar] [CrossRef]
- Moreno-Rojas, R.; Sánchez-Segarra, P.J.; Cámara-Martos, F.; Amaro-López, M.A. Multivariate analysis techniques as tools for categorization of Southern Spanish cheeses: Nutritional composition and mineral content. Eur. Food Res. Technol. 2010, 231, 841–851. [Google Scholar] [CrossRef]
- Koreňovská, M.; Suhaj, M. Identification of Slovakian, Polish, and Romanian bryndza cheeses origin by factor analysis of some elemental data. Eur. Food Res. Technol. 2007, 225, 707–713. [Google Scholar] [CrossRef]
- Camin, F.; Wehrens, R.; Bertoldi, D.; Bontempo, L.; Ziller, L.; Perini, M.; Nicolini, G.; Nocetti, M.; Larcher, R. H, C, N and S stable isotopes and mineral profiles to objectively guarantee the authenticity of grated hard cheeses. Anal. Chim. Acta 2012, 711, 54–59. [Google Scholar] [CrossRef] [PubMed]
- Russo, R.; Rega, C.; Chambery, A. Rapid detection of water buffalo ricotta adulteration or contamination by matrix-assisted laser desorption/ionisation time-of-flight mass spectrometry. Rapid Commun. Mass Spectrom. 2016, 30, 497–503. [Google Scholar] [CrossRef] [PubMed]
- Mazzei, P.; Piccolo, A. 1H HRMAS-NMR metabolomic to assess quality and traceability of mozzarella cheese from Campania buffalo milk. Food Chem. 2012, 132, 1620–1627. [Google Scholar] [CrossRef] [PubMed]
- Osorio, M.T.; Koidis, A.; Papademas, P. Major and trace elements in milk and Halloumi cheese as markers for authentication of goat feeding regimes and geographical origin. Int. J. Dairy Technol. 2015, 68, 573–581. [Google Scholar] [CrossRef]
- Brescia, M.A.; Monfreda, M.; Buccolieri, A.; Carrino, C. Characterisation of the geographical origin of buffalo milk and mozzarella cheese by means of analytical and spectroscopic determinations. Food Chem. 2005, 89, 139–147. [Google Scholar] [CrossRef]
- Karoui, R.; Dufour, É.; Pillonel, L.; Picque, D.; Cattenoz, T.; Bosset, J.O. Determining the geographic origin of Emmental cheeses produced during winter and summer using a technique based on the concatenation of MIR and fluorescence spectroscopic data. Eur. Food Res. Technol. 2004, 219, 184–189. [Google Scholar] [CrossRef]
- Pillonel, L.; Badertscher, R.; Froidevaux, P.; Haberhauer, G.; Hölzl, S.; Horn, P.; Jakob, A.; Pfammatter, E.; Piantini, U.; Rossmann, A.; et al. Stable isotope ratios, major, trace and radioactive elements in emmental cheeses of different origins. LWT-Food Sci. Technol. 2003, 36, 615–623. [Google Scholar] [CrossRef]
- Zhang, P.; Georgiou, C.A.; Brusic, V. Elemental metabolomics. Briefings Bioinf. 2017, 19, 524–536. [Google Scholar] [CrossRef]
- Franke, B.M.; Haldimann, M.; Gremaud, G.; Bosset, J.-O.; Hadorn, R.; Kreuzer, M. Element signature analysis: Its validation as a tool for geographic authentication of the origin of dried beef and poultry meat. Eur. Food Res. Technol. 2008, 227, 701–708. [Google Scholar] [CrossRef]
- Baroni, M.V.; Podio, N.S.; Badini, R.G.; Inga, M.; Ostera, H.A.; Cagnoni, M.; Gallegos, E.; Gautier, E.; Peral-García, P.; Hoogewerff, J.; et al. How much do soil and water contribute to the composition of meat? A case study: Meat from three areas of Argentina. J. Agric. Food Chem. 2011, 59, 11117–11128. [Google Scholar] [CrossRef]
- Danezis, G.P.; Papachristidis, C.A.; Georgiou, C.A. Elemental Fingerprinting. In Food Authentication: Management, Analysis and Regulation; Georgiou, C.A., Danezis, G.P., Eds.; Wiley-Blackwell: Chichester, UK, 2017; Volume 4, pp. 85–116. [Google Scholar]
- Drivelos, S.A.; Higgins, K.; Kalivas, J.H.; Haroutounian, S.A.; Georgiou, C.A. Data fusion for food authentication. Combining rare earth elements and trace metals to discriminate “fava Santorinis” from other yellow split peas using chemometric tools. Food Chem. 2014, 165, 316–322. [Google Scholar] [CrossRef] [PubMed]
- Pii, Y.; Zamboni, A.; Dal Santo, S.; Pezzotti, M.; Varanini, Z.; Pandolfini, T. Prospect on Ionomic Signatures for the Classification of Grapevine Berries According to Their Geographical Origin. Front. Recent Dev. Plant Sci. 2017, 8, 640. [Google Scholar] [CrossRef] [PubMed]
- Danezis, G.P.; Pappas, A.C.; Zoidis, E.; Papadomichelakis, G.; Hadjigeorgiou, I.; Zhang, P.; Brusic, V.; Georgiou, C.A. Game meat authentication through rare earth elements fingerprinting. Anal. Chim. Acta 2017, 991, 46–57. [Google Scholar] [CrossRef] [PubMed]
- Drivelos, S.A.; Danezis, G.P.; Haroutounian, S.A.; Georgiou, C.A. Rare earth elements minimal harvest year variation facilitates robust geographical origin discrimination: The case of PDO “Fava Santorinis”. Food Chem. 2016, 213, 238–245. [Google Scholar] [CrossRef] [PubMed]
- Melfos, V.; Voudouris, P.C. Geological, mineralogical and geochemical aspects for critical and rare metals in Greece. Minerals 2012, 2, 300–317. [Google Scholar] [CrossRef]
- Chang, C.; Li, F.; Liu, C.; Gao, J.; Tong, H.; Chen, M. Fractionation characteristics of rare earth elements (REEs) linked with secondary Fe, Mn, and Al minerals in soils. Acta Geochim. 2016, 35, 329–339. [Google Scholar] [CrossRef]
- Koepke, J.; Seidel, E. Hornblendites within ophiolites of Crete, Greece: Evidence for amphibole-rich cumulates derived from an iron-rich tholeiitic melt. Ofioliti 2004, 29, 159–175. [Google Scholar]
- Aceto, M.; Musso, D.; Calà, E.; Arieri, F.; Oddone, M. Role of Lanthanides in the Traceability of the Milk Production Chain. J. Agric. Food Chem. 2017, 65, 4200–4208. [Google Scholar] [CrossRef]
- Koutrotsios, G.; Danezis, G.P.; Georgiou, C.A.; Zervakis, G.I. Rare earth elements concentration in mushroom cultivation substrates affects the production process and fruit-bodies content of Pleurotus ostreatus and Cyclocybe cylindracea. J. Sci. Food Agric. 2018, 98, 5418–5427. [Google Scholar] [CrossRef]
- Nečemer, M.; Potočnik, D.; Ogrinc, N. Discrimination between Slovenian cow, goat and sheep milk and cheese according to geographical origin using a combination of elemental content and stable isotope data. J. Food Compos. Anal. 2016, 52, 16–23. [Google Scholar] [CrossRef]
- Suhaj, M.; Koreňovská, M. Study of some European cheeses geographical traceability by pattern recognition analysis of multielemental data. Eur. Food Res. Technol. 2008, 227, 1419–1427. [Google Scholar] [CrossRef]
- Fresno, J.M.; Prieto, B.; Urdiales, R.; Sarmiento, R.M.; Carballo, J. Mineral content of some Spanish cheese varieties. Differentiation by source of milk and by variety from their content of main and trace elements. J. Sci. Food Agric. 1995, 69, 339–345. [Google Scholar] [CrossRef]
- Economou-Eliopoulos, M.; Tsoupas, G.; Kiousis, G. Exploration for platinum-group elements (PGE) in various geotectonic settings of Greece. J. Virtual Explorer 2013, 45, 1441–8142. [Google Scholar]
- Khozam, R.B.; Pohl, P.; Ayoubi, B.A.; Jaber, F.; Lobinski, R. Toxic and essential elements in Lebanese cheese. Food Addit. Contam. Part B Surveill. 2012, 5, 172–181. [Google Scholar] [CrossRef] [PubMed]
- Vural, A.; Narin, I.; Erkan, M.E.; Soylak, M. Trace metal levels and some chemical parameters in herby cheese collected from south eastern Anatolia-Turkey. Environ. Monit. Assess. 2008, 139, 27–33. [Google Scholar] [CrossRef] [PubMed]
- Lante, A.; Lomolino, G.; Cagnin, M.; Spettoli, P. Content and characterisation of minerals in milk and in Crescenza and Squacquerone Italian fresh cheeses by ICP-OES. Food Control 2006, 17, 229–233. [Google Scholar] [CrossRef]
- Mendil, D. Mineral and trace metal levels in some cheese collected from Turkey. Food Chem. 2006, 96, 532–537. [Google Scholar] [CrossRef]
- Şanal, H.; Güler, Z.; Park, Y.W. Profiles of non-essential trace elements in ewe and goat milk and their yoghurt, torba yoghurt and whey. Food Addit. Contam. Part. B 2011, 4, 275–281. [Google Scholar] [CrossRef] [PubMed]
- Lee, A.W.; Cho, S.S. Association between phosphorus intake and bone health in the NHANES population. Nutr. J. 2015, 14, 28. [Google Scholar] [CrossRef] [PubMed]
- Georgiou, C.A.; Danezis, G.P. Elemental and Isotopic Mass Spectrometry. In Advanced Mass Spectrometry for Food Safety and Quality, Comprehensive Analytical Chemistry; Pico, Y., Ed.; Elsevier: Amsterdam, The Netherlands, 2015; Volume 68, pp. 131–243. [Google Scholar]
Sample Availability: Samples are not available. |


| Region | Ce | Dy | Er | Eu | Gd | Ho | La | Lu | Nd | Pr | Sc | Sm | Tb | Tm | Y | Yb | Th | U | |
|---|---|---|---|---|---|---|---|---|---|---|---|---|---|---|---|---|---|---|---|
| Central Greece | Mean | 2.5 | 0.17 | 0.19 | 3.1 | 0.5 | 0.06 | 1.7 | 0.07 | 1.2 | 0.33 | 26 | 2.9 | 0.16 | 0.07 | 0.8 | 0.22 | 1.4 | 3.7 |
| SEM (8) | 0.5 | 0.04 | 0.04 | 1.0 | 0.1 | 0.01 | 0.4 | 0.02 | 0.2 | 0.07 | 7 | 0.7 | 0.04 | 0.02 | 0.2 | 0.04 | 0.2 | 0.4 | |
| Crete | Mean | 4.1 | 0.24 | 0.26 | 1.0 | 0.9 | 0.08 | 2.7 | 0.08 | 2.0 | 0.5 | 27 | 1.0 | 0.21 | 0.11 | 1.1 | 0.29 | 1.7 | 2.6 |
| SEM (22) | 0.9 | 0.04 | 0.05 | 0.1 | 0.2 | 0.01 | 0.6 | 0.01 | 0.6 | 0.1 | 4 | 0.1 | 0.03 | 0.02 | 0.4 | 0.06 | 0.1 | 0.3 | |
| Epirus | Mean | 2.8 | 0.24 | 0.31 | 1.1 | 0.69 | 0.086 | 1.9 | 0.092 | 1.6 | 0.43 | 34 | 0.89 | 0.18 | 0.097 | 0.9 | 0. | 1.56 | 2.2 |
| SEM (9) | 0.3 | 0.02 | 0.02 | 0.09 | 0.05 | 0.006 | 0.2 | 0.005 | 0.1 | 0.04 | 2 | 0.06 | 0.01 | 0.009 | 0.1 | 0.02 | 0.07 | 0.1 | |
| Macedonia | Mean | 2.2 | 0.18 | 0.25 | 0.7 | 0.56 | 0.071 | 1.3 | 0.085 | 1.0 | 0.24 | 2 | 0.8 | 0.25 | 0.085 | 0.51 | 0.25 | 1.6 | 2.9 |
| SEM (13) | 0.4 | 0.02 | 0.02 | 0.1 | 0.06 | 0.005 | 0.3 | 0.006 | 0.1 | 0.03 | 1 | 0.1 | 0.04 | 0.007 | 0.08 | 0.02 | 0.1 | 0.2 | |
| North Aegean | Mean | 2.0 | 0.147 | 0.217 | 0.8 | 0.48 | 0.065 | 1.3 | 0.080 | 0.9 | 0.23 | 26 | 0.69 | 0.23 | 0.078 | 0.35 | 0.21 | 1.60 | 2.7 |
| SEM (8) | 0.4 | 0.007 | 0.008 | 0.1 | 0.05 | 0.004 | 0.3 | 0.003 | 0.1 | 0.02 | 2.0 | 0.09 | 0.04 | 0.005 | 0.06 | 0.01 | 0.07 | 0.2 | |
| Peloponnese | Mean | 3.6 | 0.26 | 0.28 | 1.2 | 0.7 | 0.09 | 1.8 | 0.09 | 1.5 | 0.45 | 28 | 1.3 | 0.18 | 0.08 | 1.2 | 0.28 | 1.7 | 3.3 |
| SEM (11) | 0.7 | 0.04 | 0.04 | 0.2 | 0.1 | 0.01 | 0.3 | 0.01 | 0.2 | 0.08 | 5 | 0.1 | 0.03 | 0.01 | 0.2 | 0.03 | 0.2 | 0.4 | |
| South Aegean | Mean | 3.7 | 0.22 | 0.26 | 1.1 | 1.0 | 0.09 | 2.3 | 0.086 | 1.7 | 0.41 | 28 | 1.1 | 0.19 | 0.09 | 0.9 | 0.28 | 1.52 | 2.4 |
| SEM (21) | 0.8 | 0.02 | 0.04 | 0.1 | 0.3 | 0.01 | 0.4 | 0.007 | 0.3 | 0.07 | 3 | 0.2 | 0.02 | 0.01 | 0.2 | 0.03 | 0.09 | 0.3 | |
| Thessaly | Mean | 2.2 | 0.12 | 0.13 | 0.9 | 0.7 | 0.06 | 3 | 0.07 | 0.7 | 0.18 | 19 | 1.4 | 0.12 | 0.05 | 0.58 | 0.16 | 1.3 | 4.2 |
| SEM (7) | 0.4 | 0.02 | 0.02 | 0.2 | 0.3 | 0.01 | 2 | 0.01 | 0.1 | 0.02 | 5 | 0.3 | 0.03 | 0.02 | 0.08 | 0.03 | 0.2 | 0.6 | |
| Thrace | One sample ** | 1.7 | 0.13 | 0.07 | 0.6 | 0.3 | 0.03 | 0.9 | 0.04 | 0.5 | 0.16 | 14 | 1.0 | 0.06 | 0.02 | 0.8 | 0.12 | 1.2 | 4.3 |
| p Value * | 0.098 | >0.001 | 0.001 | >0.001 | 0.190 | 0.075 | 0.209 | 0.413 | 0.002 | >0.001 | 0.028 | >0.001 | 0.236 | 0.075 | 0.004 | 0.007 | 0.337 | >0.001 | |
| Region | Au | Ir | Pd | Pt | Re | Rh | Ru | Hf | Nb | Sb | Sn | Ta | Tl | W | Zr | |
|---|---|---|---|---|---|---|---|---|---|---|---|---|---|---|---|---|
| Central Greece | Mean | 6 | 0.9 | 2.1 | 1.4 | 1.6 | 5 | 10 | 0.5 | 1.2 | 6 | 12 | 0.9 | 2.0 | 6 | 7 |
| SEM (8) | 1 | 0.1 | 0.4 | 0.3 | 0.4 | 2 | 2 | 0.1 | 0.3 | 1 | 4 | 0.3 | 0.6 | 2 | 1 | |
| Crete | Mean | 4.0 | 0.65 | 1.7 | 1.6 | 0.7 | 5.6 | 6 | 0.52 | 1.2 | 6 | 10 | 0.7 | 1.32 | 7 | 5 |
| SEM (22) | 0.8 | 0.07 | 0.3 | 0.2 | 0.2 | 0.8 | 1 | 0.06 | 0.2 | 1 | 2 | 0.2 | 0.08 | 1 | 1 | |
| Epirus | Mean | 3.8 | 0.68 | 1.7 | 1.73 | 2.2 | 4.3 | 5.3 | 0.56 | 1.30 | 6.2 | 13 | 0.50 | 1.5 | 7.6 | 5.4 |
| SEM (9) | 0.4 | 0.04 | 0.1 | 0.07 | 0.6 | 0.4 | 0.2 | 0.04 | 0.09 | 0.4 | 2 | 0.03 | 0.1 | 0.5 | 0.4 | |
| Macedonia | Mean | 3.8 | 0.64 | 1.34 | 1.6 | 0.6 | 5 | 3.8 | 0.49 | 0.6 | 4.4 | 7 | 0.44 | 1.4 | 4.4 | 3.6 |
| SEM (13) | 0.5 | 0.04 | 0.09 | 0.1 | 0.2 | 2 | 0.7 | 0.03 | 0.1 | 0.2 | 1 | 0.08 | 0.1 | 0.6 | 0.3 | |
| North Aegean | Mean | 3.1 | 0.57 | 1.37 | 1.5 | 0.5 | 6 | 4.0 | 0.47 | 0.89 | 5.0 | 9 | 0.50 | 1.31 | 5.4 | 3.8 |
| SEM (8) | 0.3 | 0.04 | 0.09 | 0.1 | 0.1 | 1 | 0.5 | 0.02 | 0.09 | 0.2 | 2 | 0.07 | 0.05 | 0.5 | 0.3 | |
| Peloponnese | Mean | 6 | 0.9 | 2.9 | 1.5 | 0.8 | 4.7 | 7.1 | 0.6 | 1.3 | 6.2 | 13 | 0.6 | 1.5 | 6.0 | 6.0 |
| SEM (11) | 2 | 0.1 | 0.2 | 0.2 | 0.2 | 0.9 | 0.8 | 0.1 | 0.2 | 0.7 | 4 | 0.1 | 0.1 | 1 | 0.5 | |
| South Aegean | Mean | 3.7 | 0.64 | 1.8 | 1.8 | 0.8 | 5.1 | 5.8 | 0.57 | 1.3 | 6.1 | 11 | 0.51 | 2.1 | 6.5 | 5.6 |
| SEM (21) | 0.6 | 0.04 | 0.2 | 0.1 | 0.1 | 0.7 | 0.9 | 0.05 | 0.1 | 0.6 | 2 | 0.07 | 0.3 | 0.9 | 0.8 | |
| Thessaly | Mean | 7 | 0.7 | 2.2 | 1.4 | 1.2 | 4 | 11 | 1.1 | 1.8 | 5.8 | 13 | 3 | 2.1 | 4 | 7 |
| SEM (7) | 1 | 0.1 | 0.3 | 0.3 | 0.4 | 1 | 2 | 0.6 | 0.7 | 0.8 | 3 | 2 | 0.2 | 1 | 1 | |
| Thrace | One sample ** | 5 | 0.4 | 1.4 | 0.5 | 0.2 | 1 | 11 | 0.1 | 0.8 | 4.6 | 9 | 1 | 1.3 | 0.9 | 6 |
| p Value * | 0.005 | 0.075 | 0.015 | 0.389 | 0.026 | 0.845 | >0.001 | 0.111 | 0.029 | 0.217 | 0.419 | 0.002 | 0.013 | 0.022 | 0.003 | |
| Region | Ag | As | Ba | Bi | Cd | Co | Cr | Cs | Cu | Ga | Mo | Ni | Pb | Se | V | |
|---|---|---|---|---|---|---|---|---|---|---|---|---|---|---|---|---|
| Central Greece | Mean | 3.4 | 25 | 3000 | 17 | 5.2 | 80 | 650 | 14 | 800 | 35 | 100 | 430 | 38 | 110 | 500 |
| SEM (8) | 0.6 | 20 | 500 | 6 | 0.7 | 20 | 40 | 3 | 100 | 4 | 30 | 40 | 17 | 20 | 70 | |
| Crete | Mean | 4.4 | 212 | 1000 | 16 | 5.8 | 39 | 590 | 4.5 | 780 | 13 | 110 | 370 | 28 | 65 | 390 |
| SEM (22) | 0.7 | 8 | 100 | 2 | 0.8 | 6 | 30 | 0.7 | 50 | 1 | 30 | 20 | 7 | 9 | 20 | |
| Epirus | Mean | 4.2 | 202 | 920 | 15.3 | 6.2 | 36.0 | 580 | 5.3 | 820 | 12.4 | 130 | 380 | 27 | 75 | 339 |
| SEM (9) | 0.3 | 6 | 70 | 0.6 | 0.3 | 0.7 | 10 | 0.4 | 40 | 0.5 | 10 | 20 | 3 | 3 | 9 | |
| Macedonia | Mean | 2.9 | 220 | 1000 | 14.8 | 4.3 | 28 | 500 | 3.0 | 530 | 12 | 60 | 290 | 21 | 51 | 470 |
| SEM (13) | 0.2 | 20 | 200 | 0.8 | 0.2 | 5 | 30 | 0.4 | 80 | 2 | 10 | 40 | 4 | 9 | 40 | |
| North Aegean | Mean | 3.8 | 220 | 800 | 14.5 | 5.4 | 31 | 540 | 2.8 | 670 | 11.6 | 100 | 320 | 20 | 60 | 440 |
| SEM (8) | 0.4 | 9 | 60 | 0.7 | 0.3 | 3 | 20 | 0.3 | 90 | 0.8 | 10 | 30 | 2 | 4 | 30 | |
| Peloponnese | Mean | 3.9 | 240 | 1000 | 49 | 5.8 | 70 | 640 | 5 | 640 | 17 | 110 | 367 | 24 | 100 | 470 |
| SEM (11) | 0.6 | 10 | 200 | 35 | 0.6 | 20 | 30 | 1 | 60 | 2 | 20 | 9 | 4 | 20 | 50 | |
| South Aegean | Mean | 4.0 | 220 | 1000 | 14 | 5.8 | 38 | 570 | 6 | 780 | 14 | 110 | 350 | 32 | 63 | 400 |
| SEM (21) | 0.4 | 10 | 100 | 1 | 0.4 | 5 | 20 | 2 | 40 | 2 | 20 | 20 | 6 | 8 | 30 | |
| Thessaly | Mean | 5 | 170 | 1155 | 14 | 5.3 | 70 | 700 | 5 | 800 | 19 | 80 | 410 | 25 | 110 | 340 |
| SEM (7) | 2 | 30 | 207 | 2 | 0.9 | 10 | 100 | 1 | 100 | 4 | 20 | 30 | 7 | 20 | 60 | |
| Thrace | One sample ** | 2 | 240 | 697 | 11 | 3.8 | 85 | 730 | 3 | 740 | 17 | 90 | 420 | 20 | 210 | 560 |
| p Value * | 0.184 | 0.044 | >0.001 | 0.416 | 0.140 | >0.001 | >0.001 | >0.001 | 0.130 | >0.001 | 0.137 | 0.058 | 0.432 | >0.001 | 0.007 | |
| Region | Al | B | Fe | Mn | Rb | Si | Sr | Ti | Zn | Ca | K | Mg | P | |
|---|---|---|---|---|---|---|---|---|---|---|---|---|---|---|
| Central Greece | Mean | 1.6 | 62 | 32 | 0.42 | 1.5 | 157 | 7.6 | 62 | 34 | 8.7 | 0.56 | 0.47 | 7.3 |
| SEM (8) | 0.2 | 8 | 3 | 0.04 | 0.1 | 14 | 0.9 | 2 | 2 | 0.6 | 0.04 | 0.02 | 0.3 | |
| Crete | Mean | 1.8 | 48 | 29 | 0.39 | 0.98 | 134 | 4.7 | 62 | 30 | 9.9 | 0.45 | 0.52 | 7.0 |
| SEM (22) | 0.3 | 5 | 1 | 0.02 | 0.07 | 8 | 0.5 | 1 | 1 | 0.4 | 0.02 | 0.01 | 0.2 | |
| Epirus | Mean | 1.3 | 42.9 | 31.9 | 0.44 | 1.03 | 126 | 3.8 | 68 | 34.9 | 10.9 | 0.56 | 0.56 | 7.5 |
| SEM (9) | 0.2 | 0.6 | 0.6 | 0.02 | 0.06 | 3 | 0.3 | 1 | 0.8 | 0.2 | 0.02 | 0.01 | 0.1 | |
| Macedonia | Mean | 1.3 | 44 | 23 | 0.32 | 0.8 | 128 | 2.4 | 50 | 28 | 7.4 | 0.7 | 0.38 | 5.8 |
| SEM (13) | 0.2 | 4 | 2 | 0.03 | 0.1 | 10 | 0.3 | 5 | 4 | 0.8 | 0.1 | 0.03 | 0.5 | |
| North Aegean | Mean | 0.9 | 44 | 26 | 0.27 | 0.63 | 122 | 2.5 | 56 | 35 | 8.7 | 0.68 | 0.39 | 6.3 |
| SEM (8) | 0.1 | 2 | 1 | 0.02 | 0.04 | 4 | 0.2 | 2 | 1 | 0.5 | 0.03 | 0.02 | 0.3 | |
| Peloponnese | Mean | 2 | 58 | 29 | 0.47 | 0.90 | 151 | 3.6 | 62 | 33 | 9.3 | 0.64 | 0.50 | 7.2 |
| SEM (11) | 1 | 6 | 1 | 0.05 | 0.08 | 11 | 0.3 | 1 | 1 | 0.6 | 0.06 | 0.02 | 0.2 | |
| South Aegean | Mean | 1.8 | 45 | 31 | 0.36 | 0.88 | 124 | 4.2 | 61 | 32 | 10.0 | 0.51 | 0.49 | 6.9 |
| SEM (21) | 0.4 | 3 | 1 | 0.03 | 0.06 | 5 | 0.4 | 2 | 1 | 0.4 | 0.02 | 0.03 | 0.2 | |
| Thessaly | Mean | 1.6 | 79 | 35 | 0.41 | 1.02 | 166 | 4.3 | 68 | 36 | 9.8 | 0.66 | 0.55 | 8.1 |
| SEM (7) | 0.3 | 19 | 3 | 0.04 | 0.08 | 30 | 0.5 | 2 | 1 | 0.8 | 0.06 | 0.03 | 0.4 | |
| Thrace | One sample ** | 3.0 | 85 | 40 | 0.29 | 0.65 | 177 | 3.7 | 66 | 42 | 7.4 | 0.70 | 0.41 | 8.3 |
| p Value * | 0.162 | >0.001 | >0.001 | >0.001 | >0.001 | 0.009 | >0.001 | >0.001 | 0.016 | >0.001 | 0.020 | >0.001 | >0.001 | |
| Actual | Group Size | Predicted | ||||||||
|---|---|---|---|---|---|---|---|---|---|---|
| Central Greece | Crete | Epirus | Macedonia | North Aegean | Peloponnese | South Aegean | Thessaly | Thrace | ||
| Central Greece | 13 | 13 | 0 | 0 | 0 | 0 | 0 | 0 | 0 | 0 |
| (100.0%) | (0.0%) | (0.0%) | (0.0%) | (0.0%) | (0.0%) | (0.0%) | (0.0%) | (0.0%) | ||
| Crete | 22 | 0 | 22 | 0 | 0 | 0 | 0 | 0 | 0 | 0 |
| (0.0%) | (100.0%) | (0.0%) | (0.0%) | (0.0%) | (0.0%) | (0.0%) | (0.0%) | (0.0%) | ||
| Epirus | 9 | 1 | 0 | 8 | 0 | 0 | 0 | 0 | 0 | 0 |
| (11.1%) | (0.0%) | (88.9%) | (0.0%) | (0.0%) | (0.0%) | (0.0%) | (0.0%) | (0.0%) | ||
| Macedonia | 13 | 0 | 0 | 0 | 12 | 0 | 0 | 1 | 0 | 0 |
| (0.0%) | (0.0%) | (0.0%) | (92.3%) | (0.0%) | (0.0%) | (7.7%) | (0.0%) | (0.0%) | ||
| North Aegean | 8 | 0 | 0 | 0 | 0 | 8 | 0 | 0 | 0 | 0 |
| (0.0%) | (0.0%) | (0.0%) | (0.0%) | (100.0%) | (0.0%) | (0.0%) | (0.0%) | (0.0%) | ||
| Peloponnese | 11 | 0 | 0 | 0 | 0 | 0 | 11 | 0 | 0 | 0 |
| (0.0%) | (0.0%) | (0.0%) | (0.0%) | (0.0%) | (100.0%) | (0.0%) | (0.0%) | (0.0%) | ||
| South Aegean | 21 | 0 | 0 | 0 | 0 | 0 | 0 | 21 | 0 | 0 |
| (0.0%) | (0.0%) | (0.0%) | (0.0%) | (0.0%) | (0.0%) | (100.0%) | (0.0%) | (0.0%) | ||
| Thessaly | 7 | 1 | 0 | 0 | 0 | 0 | 0 | 0 | 6 | 0 |
| (14.3%) | (0.0%) | (0.0%) | (0.0%) | (0.0%) | (0.0%) | (0.0%) | (85.7%) | (0.0%) | ||
| Actual Type of Milk | Group Size | Predicted Type of Milk | |||
|---|---|---|---|---|---|
| Sheep + Goat | Sheep | Goat | Cow | ||
| Sheep + goat | 78 | 78 | 0 | 0 | 0 |
| (100.0%) | (0.0%) | (0.0%) | (0.0%) | ||
| Sheep | 10 | 2 | 8 | 0 | 0 |
| (20.0%) | (80.0%) | (0.0%) | (0.0%) | ||
| Goat | 8 | 0 | 0 | 8 | 0 |
| (0.0%) | (0.0%) | (100.0%) | (0.0%) | ||
| Cow | 8 | 1 | 0 | 0 | 7 |
| (12.5%) | (0.0%) | (0.0%) | (87.5%) | ||
| Element | PTWI (μg kg−1) | % Intake (Greece) | % Intake (Canada) |
|---|---|---|---|
| Al | 1000 | 1.34% | 0.81% |
| As | 15 | 12.8% | 7.7% |
| Cd | 7 | 0.70% | 0.42% |
| Pb | 25 | 0.91% | 0.55% |
| Sn | 14,000 | 0.0007% | 0.0004% |
| Element | NRV | % Intake | RDA/AI * Males 31–50 years of age | % Intake | RDA/AI * Pregnancy 31–50 years of age | % Intake | RDA & AI * Lactation 31–50 years of age | % Intake | ||||
|---|---|---|---|---|---|---|---|---|---|---|---|---|
| Greece | Canada | Greece | Canada | Greece | Canada | Greece | Canada | |||||
| Ca | 800 mg | 111 | 67% | 1000 mg | 89% | 54% | 1000 mg | 89% | 54% | 1000 mg | 89% | 54% |
| P | 700 mg | 94% | 56% | 700 mg | 94% | 56% | 700 mg | 94% | 56% | 700 mg | 94% | 56% |
| Mg | 375 mg | 12% | 7.3% | 420 mg | 11% | 6.5% | 360 mg | 13% | 7.6% | 320 mg | 14% | 8.5% |
| Fe | 14 mg | 20% | 12% | 8 mg | 35% | 21% | 27 mg | 10% | 6.2% | 9 mg | 31% | 19% |
| Zn | 10 mg | 31% | 19% | 11 mg | 29% | 17% | 11 mg | 29% | 17% | 12 mg | 26% | 16% |
| Cu | 1 mg | 6.8% | 4.1% | 900 μg | 7.6% | 4.6% | 1000 μg | 6.8% | 4.1% | 1300 μg | 5.2% | 3.2% |
| Mn | 2 mg | 1.8% | 1.1% | 2.3 * mg | 1.5% | 0.9% | 2.0 * mg | 1.8% | 1.1% | 2.6 * mg | 1.4% | 0.8% |
| Se | 55 μg | 13% | 7.8% | 55 μg | 13% | 7.8% | 60 μg | 12% | 7.2% | 70 μg | 10% | 6.1% |
| Cr | 40 μg | 139% | 83% | 35 * μg | 158% | 95% | 30 * μg | 185% | 111% | 45 * μg | 123% | 74% |
| Mo | 50 μg | 20% | 12% | 45 μg | 22% | 13% | 50 μg | 20% | 12% | 50 μg | 20% | 12% |
| BCR 668 | ERM-BD151 | ||||||||
|---|---|---|---|---|---|---|---|---|---|
| REEs | Certified μg kg−1 | Found μg kg−1 | % Recoveries | % RSD | TREs | Certified mg kg−1 | Found mg kg−1 | % Recoveries | %RSD |
| Ce | 89 ± 7 | 82 ± 3 | 92 | 4 | Cd | 0.106 ± 0.013 | 0.121 ± 0.041 | 114 | 34 |
| Dy | 8.9 ± 0.6 | 7.9 ± 0.9 | 89 | 11 | Cu | 5.00 ± 0.23 | 5.77 ± 0.97 | 115 | 17 |
| Er | 4.5 ± 0.5 | 3.7 ± 0.7 | 82 | 19 | Fe | 53 ± 4 | 50 ± 13 | 94 | 26 |
| Eu | 2.79 ± 0.16 | 2.4 ± 0.10 | 86 | 4 | Mn | 0.29 ± 0.03 | 0.34 ± 0.09 | 117 | 26 |
| Gd | 13.0 ± 0.6 | 12.1 ± 0.7 | 93 | 6 | Pb | 0.207 ± 0.014 | 0.201 ± 0.049 | 97 | 24 |
| Ho | 1.8 ± 0.6 a | 1.2 ± 0.2 | 67 | 17 | Se | 0.19 ± 0.04 | 0.27 ± 0.09 | 142 | 33 |
| La | 80 ± 6 | 71 ± 5 | 89 | 7 | Zn | 44.9 ± 2.3 | 54.0 ± 7.9 | 120 | 15 |
| Lu | 0.389 ± 0.024 | 0.379 ± 0.010 | 97 | 3 | Macro elements | ||||
| Nd | 54 ± 4 | 49 ± 1 | 91 | 2 | Ca | 13.9 ± 0.7 | 9.9 ± 1.4 | 71 | 14 |
| Pr | 12.3 ± 1.1 | 11.1 ± 0.2 | 90 | 2 | K | 17.0 ± 0.8 | 14.0 ± 1.7 | 82 | 12 |
| Sc | 8.5 ± 1.8 | 10.3 ± 1.5 | 121 | 14 | Mg | 1.26 ± 0.07 | 1.20 ± 0.13 | 95 | 11 |
| Sm | 11.2 ± 0.8 | 10.4 ± 0.4 | 93 | 4 | Na | 4.19 ± 0.23 | 3.89 ± 0.7 | 93 | 18 |
| Tb | 1.62 ± 0.12 | 1.60 ± 0.07 | 99 | 4 | P | 11.0 ± 0.6 | 12.3 ± 2.4 | 112 | 20 |
| Tm | 0.48 ± 0.08 | 0.571 ± 0.03 | 119 | 5 | |||||
| Y | 59 ± 5 | 53 ± 3 | 90 | 6 | |||||
| Yb | 2.8 ± 0.5 a | 2.1 ± 0.1 | 75 | 5 | |||||
| Actinides | |||||||||
| Th | 10.7 ± 1.2 | 9.7 ± 0.3 | 91 | 3 | |||||
| U | 56 ± 5 | 51 ± 4 | 91 | 8 | |||||
© 2019 by the authors. Licensee MDPI, Basel, Switzerland. This article is an open access article distributed under the terms and conditions of the Creative Commons Attribution (CC BY) license (http://creativecommons.org/licenses/by/4.0/).
Share and Cite
Danezis, G.; Theodorou, C.; Massouras, T.; Zoidis, E.; Hadjigeorgiou, I.; Georgiou, C.A. Greek Graviera Cheese Assessment through Elemental Metabolomics—Implications for Authentication, Safety and Nutrition. Molecules 2019, 24, 670. https://doi.org/10.3390/molecules24040670
Danezis G, Theodorou C, Massouras T, Zoidis E, Hadjigeorgiou I, Georgiou CA. Greek Graviera Cheese Assessment through Elemental Metabolomics—Implications for Authentication, Safety and Nutrition. Molecules. 2019; 24(4):670. https://doi.org/10.3390/molecules24040670
Chicago/Turabian StyleDanezis, Georgios, Charis Theodorou, Theofilos Massouras, Evangelos Zoidis, Ioannis Hadjigeorgiou, and Constantinos A. Georgiou. 2019. "Greek Graviera Cheese Assessment through Elemental Metabolomics—Implications for Authentication, Safety and Nutrition" Molecules 24, no. 4: 670. https://doi.org/10.3390/molecules24040670
APA StyleDanezis, G., Theodorou, C., Massouras, T., Zoidis, E., Hadjigeorgiou, I., & Georgiou, C. A. (2019). Greek Graviera Cheese Assessment through Elemental Metabolomics—Implications for Authentication, Safety and Nutrition. Molecules, 24(4), 670. https://doi.org/10.3390/molecules24040670