1. Introduction
Most of the species belonging to the genus Burkholderia are known as plants’ associated pathogens with a soil reservoir. Two important exceptions are B. mallei and B. pseudomallei, which are implicated in life-threatening infections in human and animals. Genetic similarities and serological cross reactions between both pathovars make the identification and differentiation from each other difficult and challenging. The high infectious potential of both agents, increased resistance against many antibiotics and their small infectious dose, imply a need for fast and robust identification methods.
B. mallei is a Gram-negative non-motile bacterium belonging to the family
Burkholderiaceae that mainly affects equines, causing the notifiable zoonotic disease glanders [
1]. Glanders in equids is endemic in North Africa, South America, Middle East, and Asia [
2]. Infection can be transmitted through direct contact with infected animals, skin cuts and abrasions, aerosol inhalation, and ingestion of contaminated drinking water and meat. The predominant generalized clinical signs are fever, drooping of the head, labored breathing, emaciation, swelling of limbs and joints. The cutaneous manifestation by multiple popular or pustular nodules and sometimes the typical yellowish-green nasal discharge with or without ulcerous nodules on the nasal mucosa can be observed [
3]. The meat of infected equids can act as a reservoir for carnivorous animal infection [
4]. The disease in human is occupational, affecting mainly veterinarians and laboratory and slaughterhouse workers in addition to horse owners.
B. mallei is a host-adapted pathogen and has no environmental reservoir [
5]. In contrast, its closely related species
B. pseudomallei is a saprophyte with a reservoir in soil [
6].
B. pseudomallei is a Gram-negative, motile, aerobic, nonspore-forming, and intracellular pathogen with a high resistance to environmental conditions [
7]. The organism causes serious invasive infections in humans (including septicemia and pneumonia) and is the causative agent of melioidosis, an endemic disease affecting humans and many animal species in tropical areas with a high fatality rate [
8,
9]. It has frequently been reported in recent decades that melioidosis is an endemic disease of public health importance in Southeast Asia and Australia [
10,
11].
B. mallei and
B. pseudomallei cause similar clinical symptoms in human and animals. The conventional microbiological identification for both have the disadvantages of being time and labor consuming and have to be performed in biosafety level 3 (BSL 3) conditions [
12]. The soil bacterium
B. thailandensis is phenotypically and genetically related to
B. mallei and
B. pseudomallei. Nonetheless, it shows less pathogenicity [
6,
13]. Since
B. thailandensis and
B. pseudomallei share the same reservoir, the appearance of
B. thailandensis frequently decreases the assay specificity for the hazardous agents [
13,
14].
The
B. cepacia complex (comprising the
B. cepacia, B. multivorans, B. stabilis, B. ambifaria, B. dolosa, and
B. cenocepacia spp.) is occupying ecological niches ranging from soil to hospital environments. Those species are considered as opportunistic pathogens to humans. They are suspected to cause cystic fibrosis [
15].
B. glathei and
B. phytofirmans represent the non-pathogen species of the genus
Burkholderia [
16,
17,
18].
The classification of
B. mallei and
B. pseudomallei as category B biothreat agents on one side and the increasing spread of pathogens due to international animal transport on the other side provoked researches to evaluate innovative diagnostic strategies to differentiate between both pathovars at one time. Beside the serodiagnosis, DNA microarray-based detection methods and matrix-assisted laser desorption/ionization mass spectrometry (MALDI-TOF MS) are evaluated by various research groups for the above-mentioned task [
14,
19,
20].
The concept of Raman spectroscopic differentiation of bacteria combines the physical recording of bacterial Raman spectra with machine learning on validated reference spectra [
21,
22,
23,
24]. Stöckel et al. reported the successful differentiation between
B. mallei and
B. pseudomallei by Raman spectroscopy after inactivation of the bacteria with formaldehyde to handle them under BSL 1 condition [
25]. Raman spectroscopy-named after Indian physicist C.V Raman-is a modern analytical tool, which uses monochromatic light sources in the visible, infrared, or ultraviolet range to investigate the biochemical composition of specimen. By simply irradiating a sample with laser light, the molecular composition of the probed sample volume can be analyzed. The photons, which are inelastically scattered by molecular bonds, are analyzed spectroscopically and the intensity of the inelastic scattering is plotted as a Raman spectrum [
26]. Since Raman scattering can be observed through a microscope to measure very small sample volumes such as single bacterial cells, it became a promising tool for a wide range of microbiological applications. Within the cell’s structure, a phenotypic specific mixture of biochemical components is present. Probing a single bacterium results in a complicated Raman spectrum exhibiting overlapping Raman peaks originating from the cell’s typical components for example lipids, proteins, DNA/RNA, pigments and storage materials. Such a Raman spectrum acts as a molecular pattern, which consists of multiple features and can hardly be interpreted by comparing with a single reference spectrum. To utilize these Raman spectra for microbial diagnostic and bacterial identification, the spectral information is analyzed by multivariate statistics and machine learning. After many replicates, the class-specific Raman spectral pattern will be learned, and the algorithm can model the differences between the bacterial classes of interest [
24].
Depending on the extent of distinguishable spectral phenotypes, the identification of bacteria based on Raman spectroscopic data is either successful, providing imprecise prediction or fail. It has been shown that the learning performance improves considerably if the expected biological or biochemical variances of a certain spectral phenotype are included in the training [
27]. Phenotypical variations that typically mirrored in the Raman spectrum are contributed to: (
i) The ecological setting from which the bacteria originate, (
ii) the isolation procedures for the bacterial cells from their habitat, and (
iii) the inactivation techniques to handle potential pathogen germs [
28,
29,
30,
31,
32]. Furthermore, it was shown that the data pre-processing and a proper compilation of training collectives for the supervised machine learning in combination with hierarchical classification approaches improve the identification outcome significantly [
27,
33,
34,
35,
36,
37,
38,
39]. Once a reliable statistical model is established, the microbial diagnostic based on Raman spectroscopy is not dependent on time consuming cultivation, molecular or biochemical reactions. Only a small number of single cells (<100 isolated cells) or a minimum of biomass can uncover the identity of a specimen with a high level of accuracy. The only pre-requisite processing is the nondestructive isolation of the bacterial cells from the sample matrix to probe single intact cells [
23]. The present study evaluates the reproducibility of a Raman based differentiation of
Burkholderia spp. previously reported by Stöckel et al. carried out by an independent research laboratory and with an independent measurement set-up. In contrast to the study from Stöckel et al. bacteria in the current study are inactivated by heat instead of formaldehyde-inactivation to perform the analysis under biosafety level 1 conditions [
25]. This study aims mainly to differentiate between the hazardous agents
B. mallei and
B. pseudomallei on a single cell level. It is investigated to which extent the spectral phenotypes form clusters analogous to the taxonomic pre-determined
Burkholderia species. The potential to additionally detect and differentiate further relevant
Burkholderia species is discussed. A representative panel of strains compromising
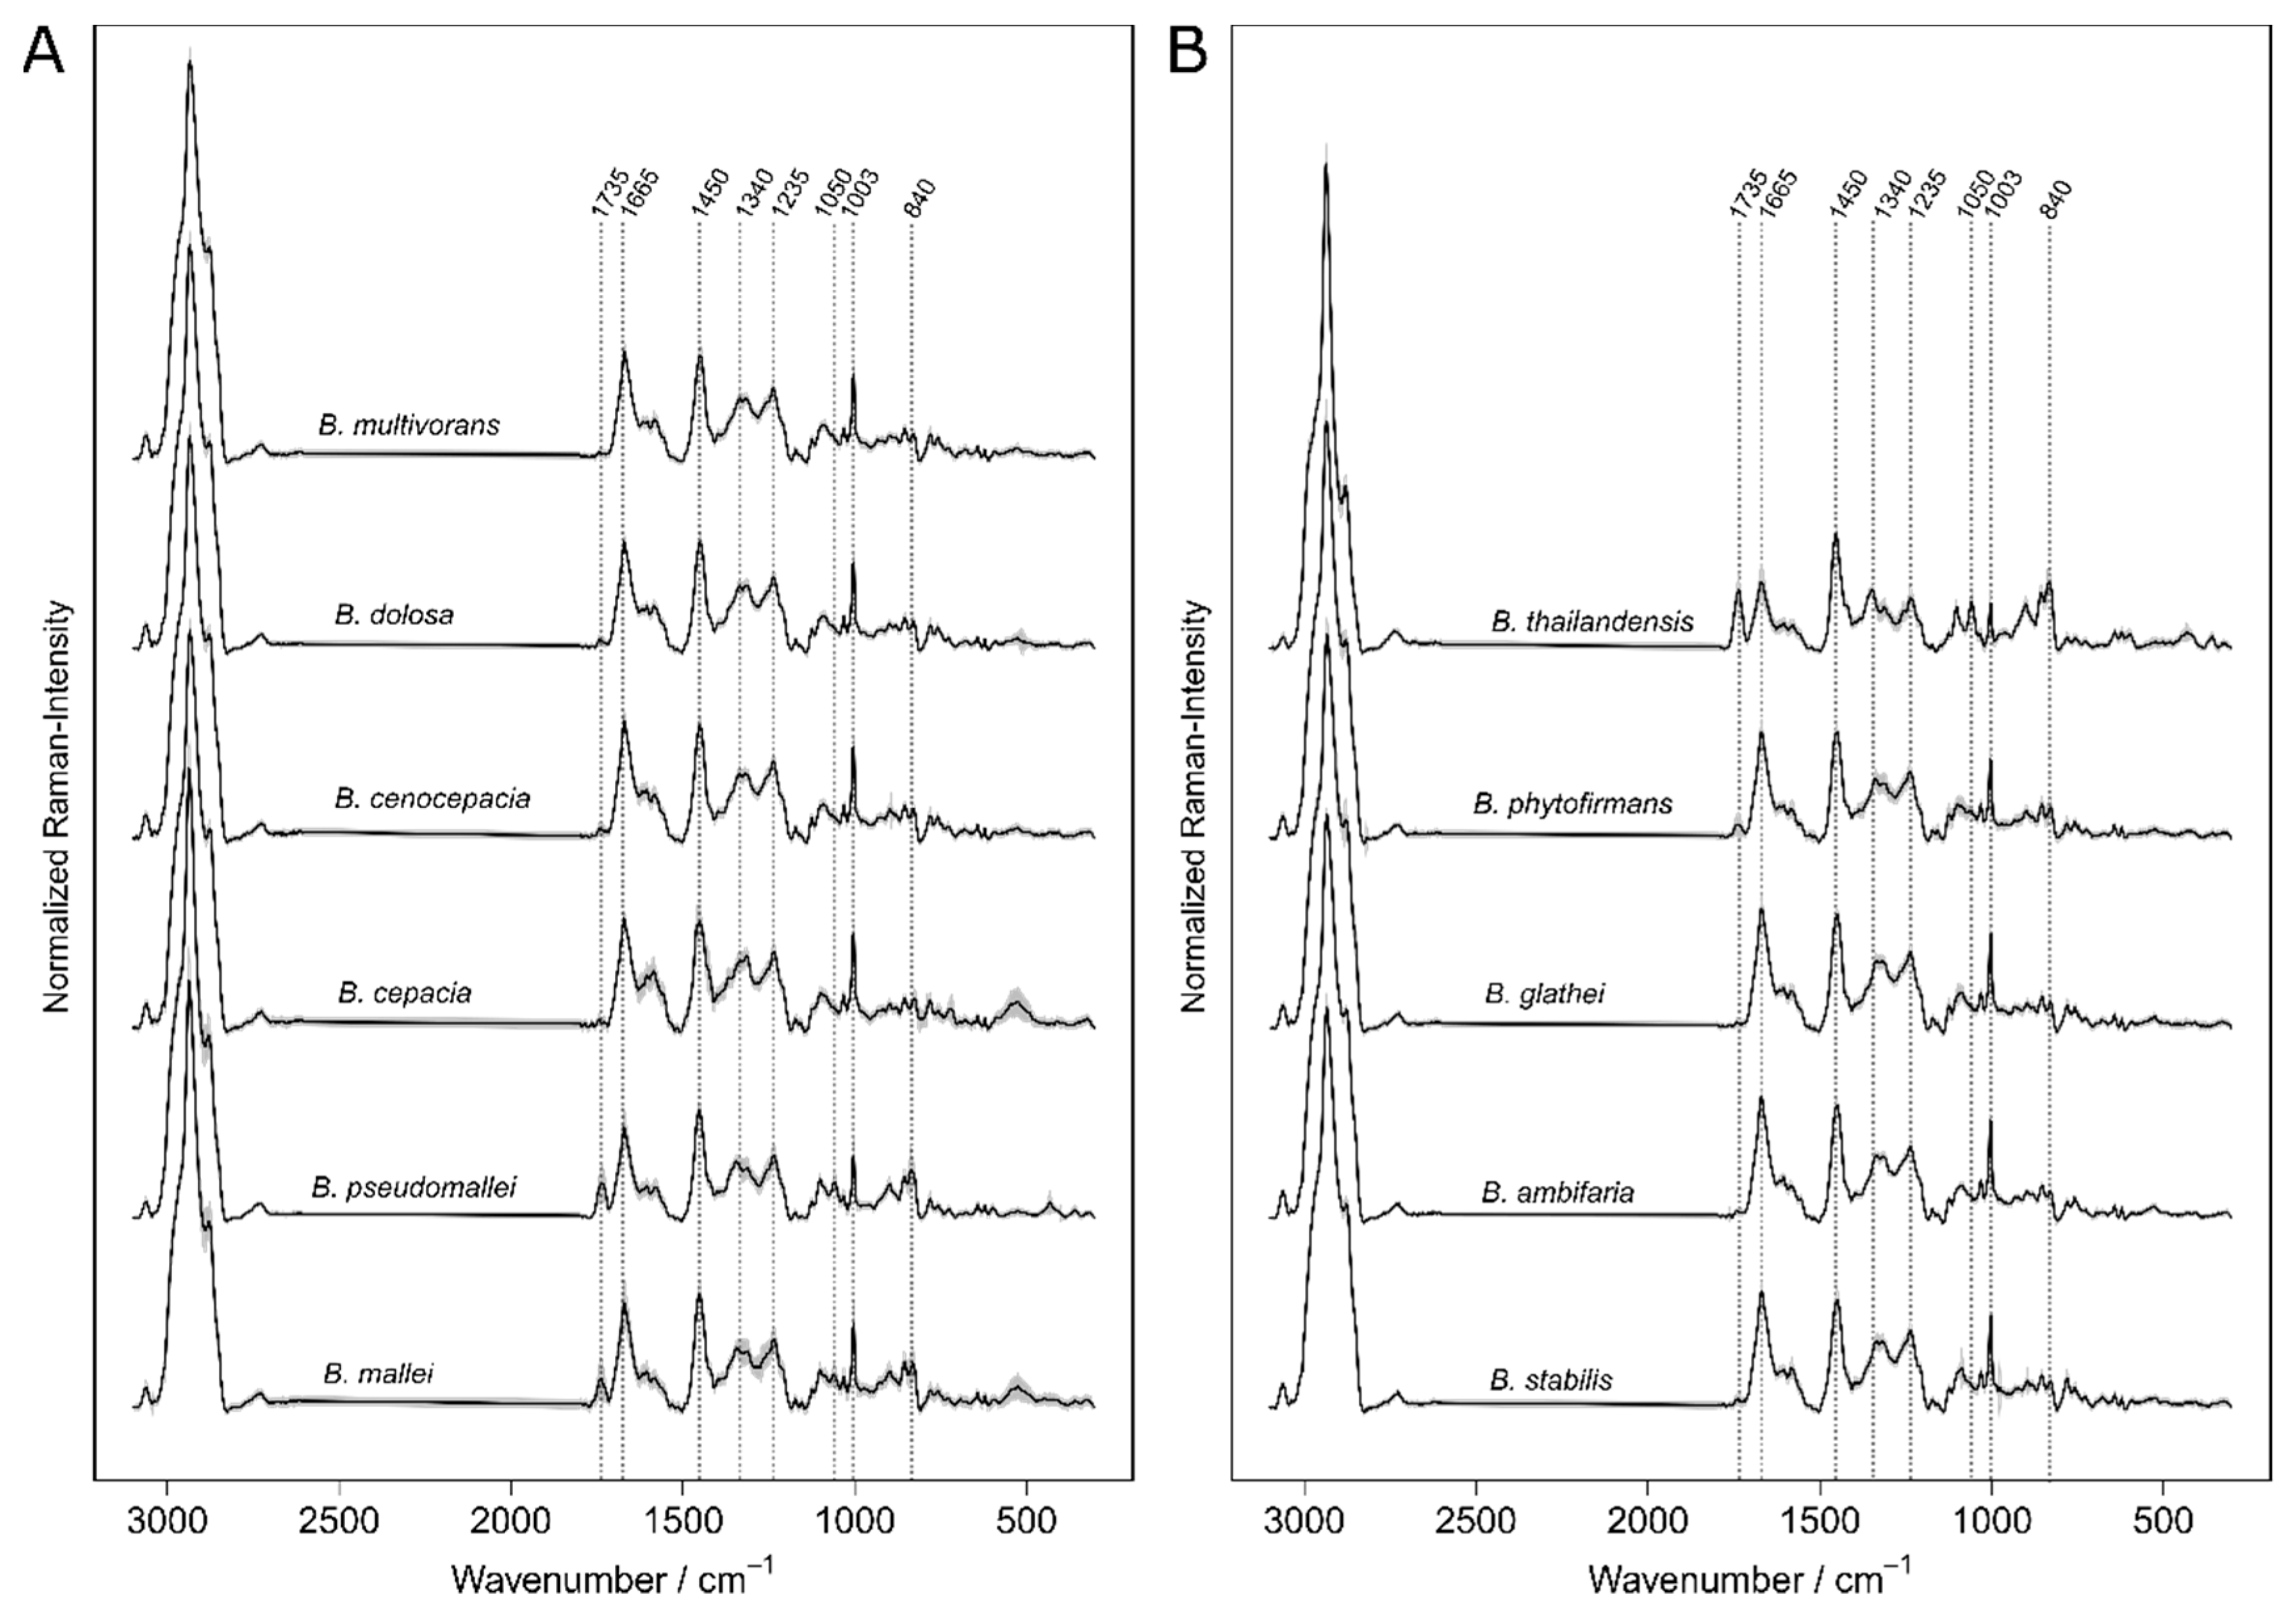
Burkholderia from cell culture selections, round-robin tests, and well-characterized isolates (see
Table 1) are measured to find out which spectral phenotypes are interfering the performance of the classification. According to the observed spectral phenotypes, classification tasks are defined to train predictive models for the stepwise differentiation of the most relevant
Burkholderia classes. The performance of the classification is validated by independent batch cultures of the test strains. Finally, the statistic models are evaluated by the identification of
Burkholderia strains, which are not included in the training database.
4. Discussion
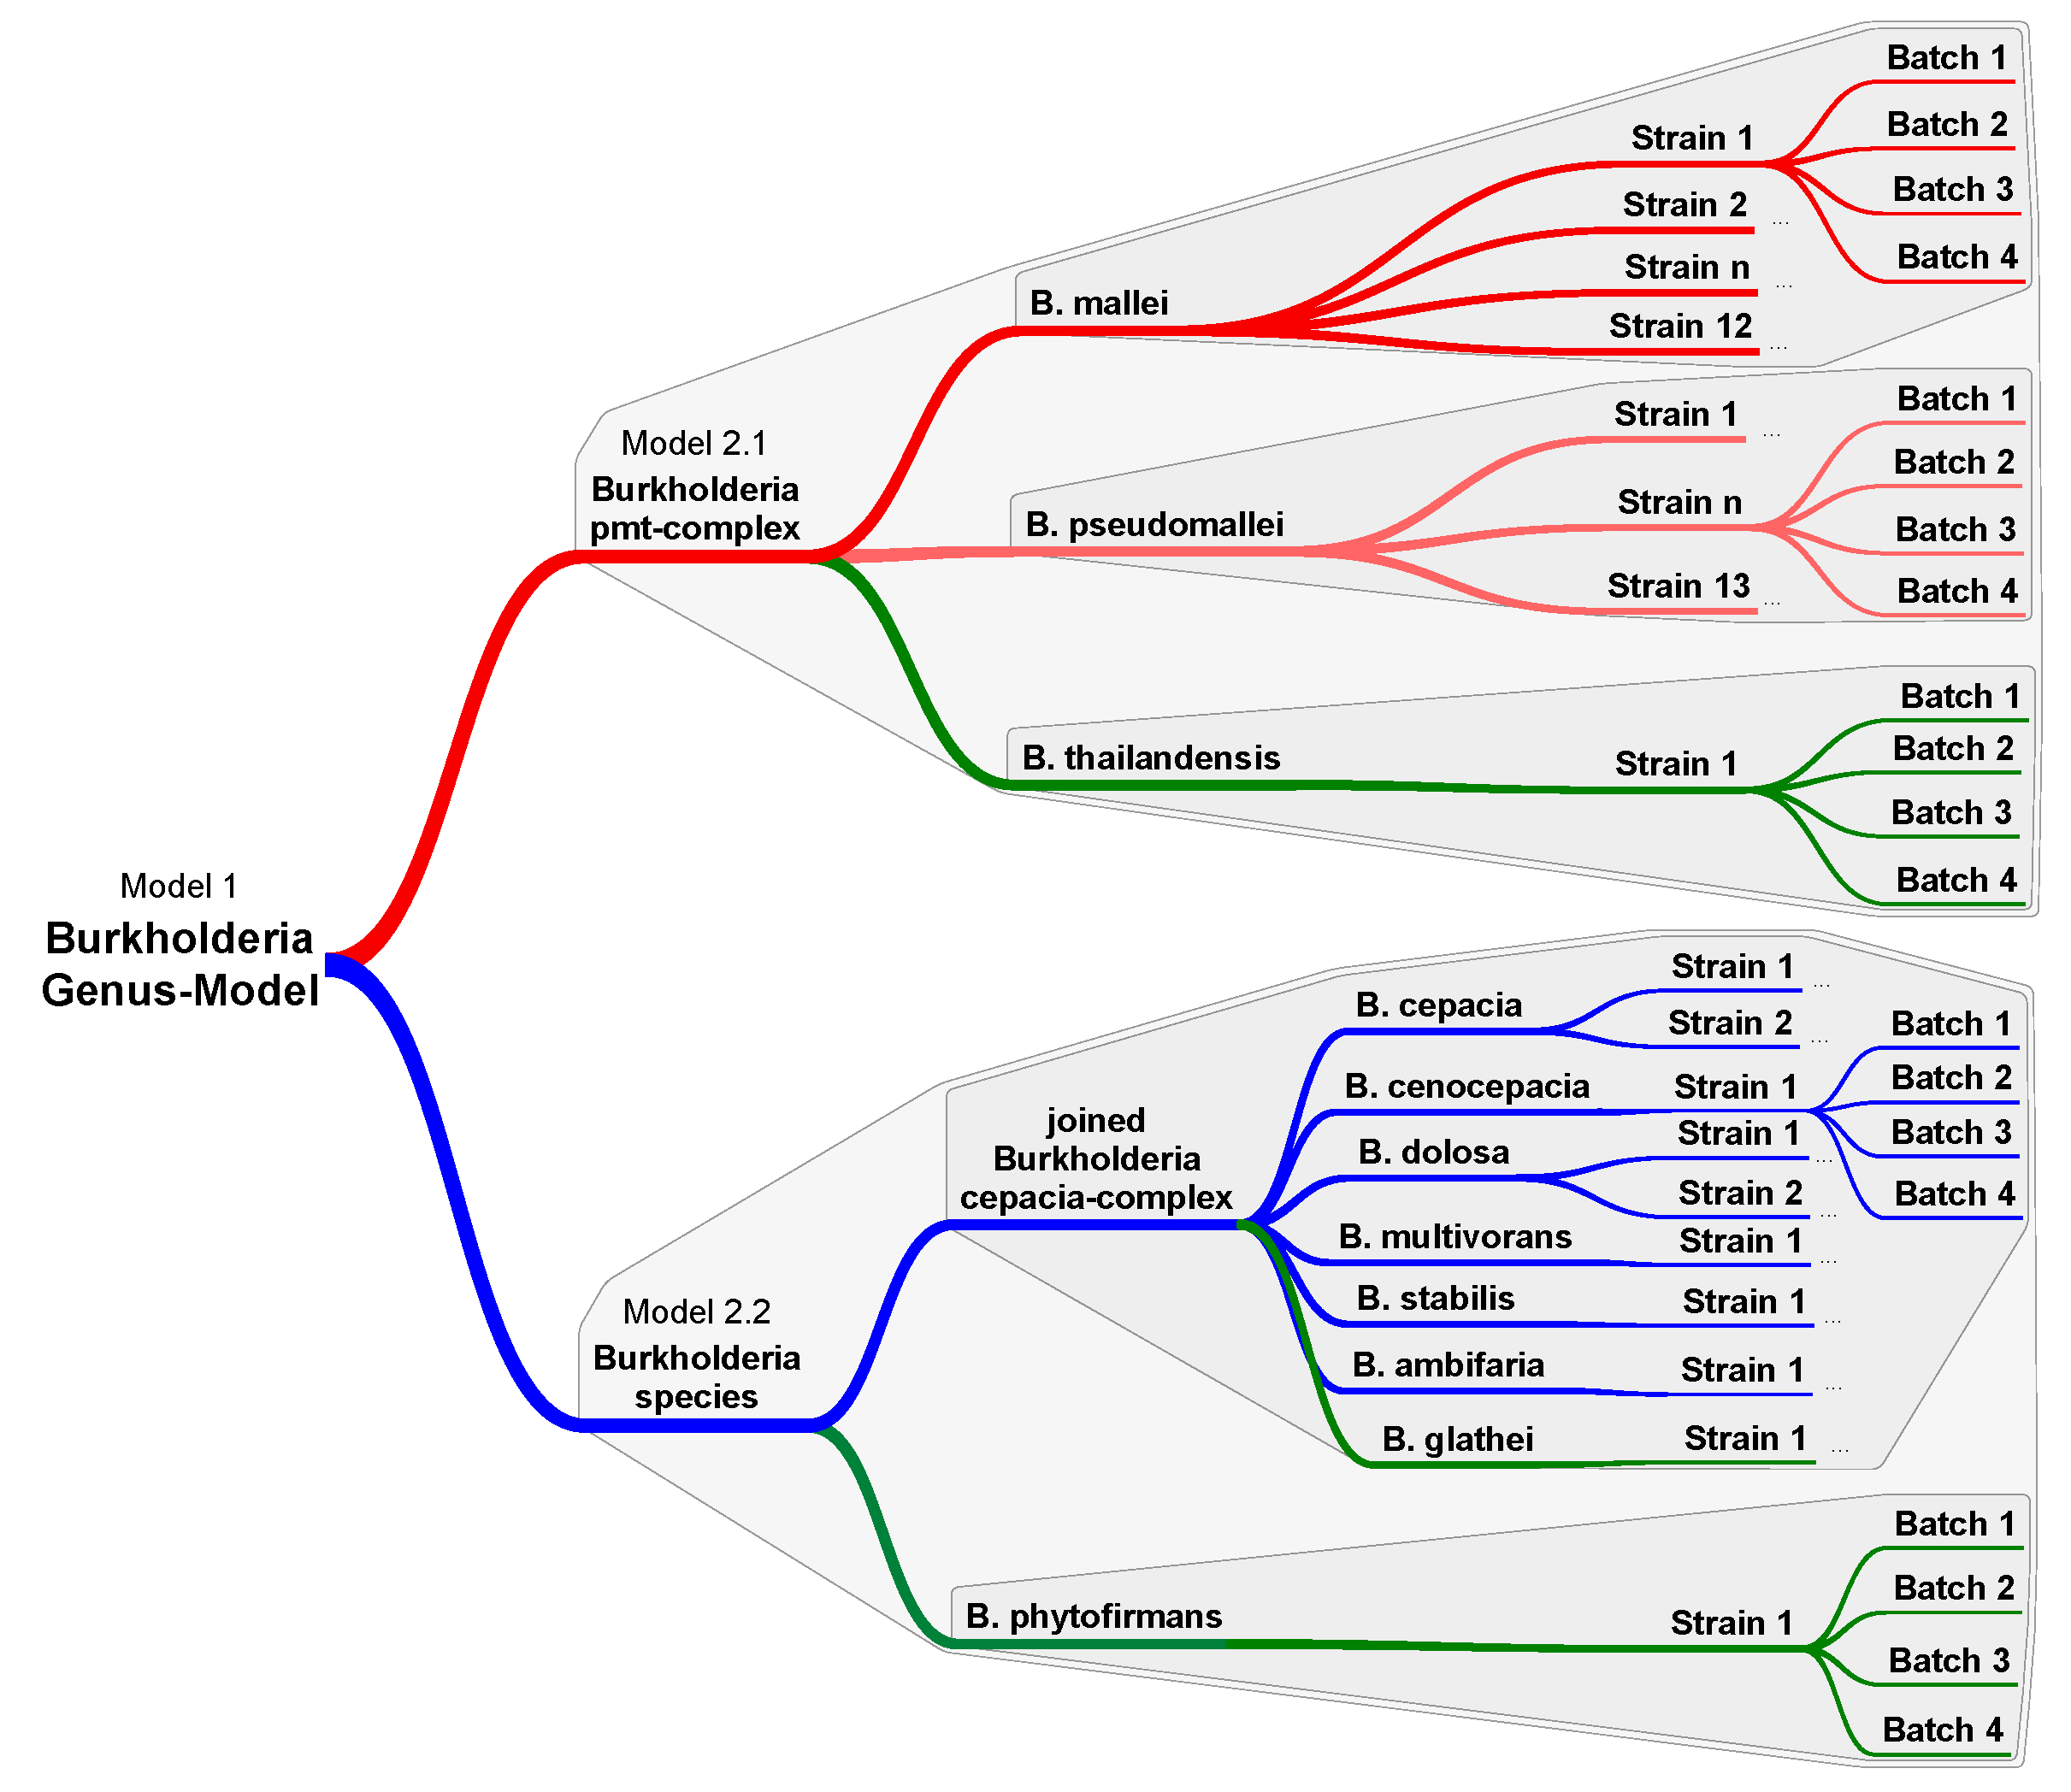
The concept of Raman spectroscopic differentiation of bacteria combines the physical recording of bacterial Raman spectra with supervised machine learning on validated reference spectra. Stöckel et al. reported that a single SVM was not capable of discriminating the Raman data of
B. mallei and
B. pseudomallei alongside other
Burkholderia and
Pseudomonas species [
25]. Therefore, the Raman spectra of
B. mallei and
B. pseudomallei were pooled together and treated as a joined class. A top-level SVM separated this joined class from the remaining species and a sub-level SVM exclusively performs on data of
B. mallei and
B. pseudomallei for definitive species separation. Identification accuracies of more than 90% could be achieved on the spectra level. The hierarchically organized classification workflow for Raman data of
Burkholderia previously described by Stöckel et.al [
25] was further developed in the present study.
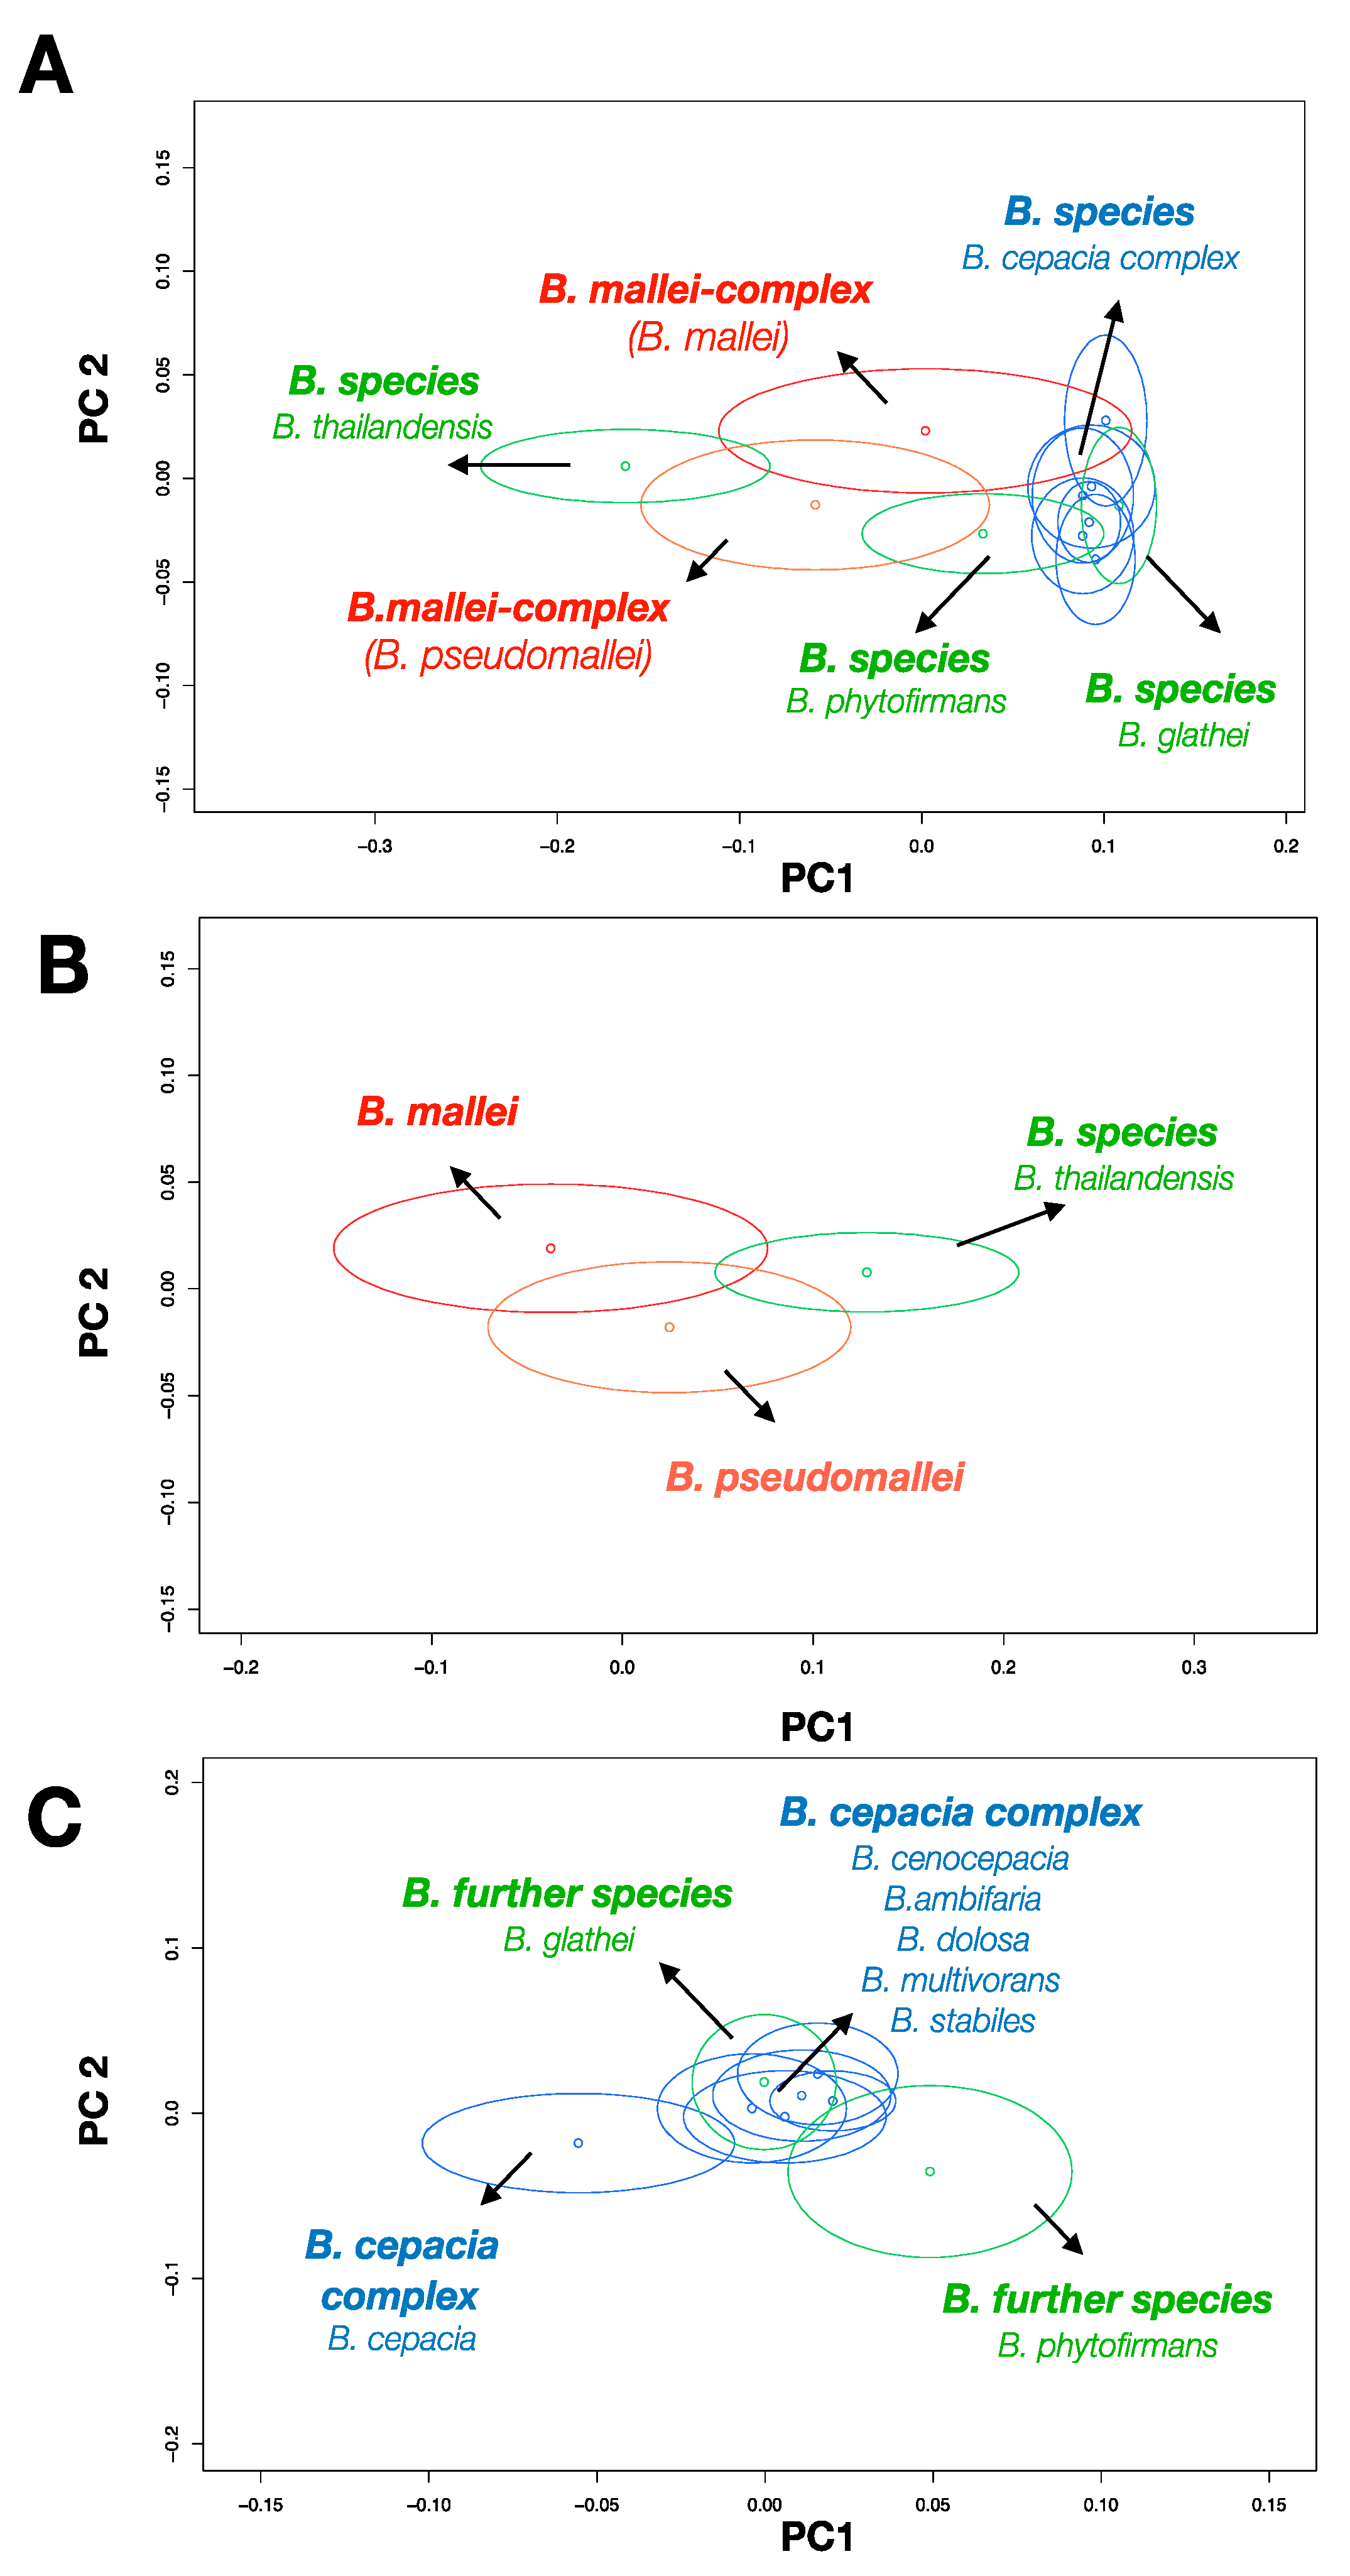
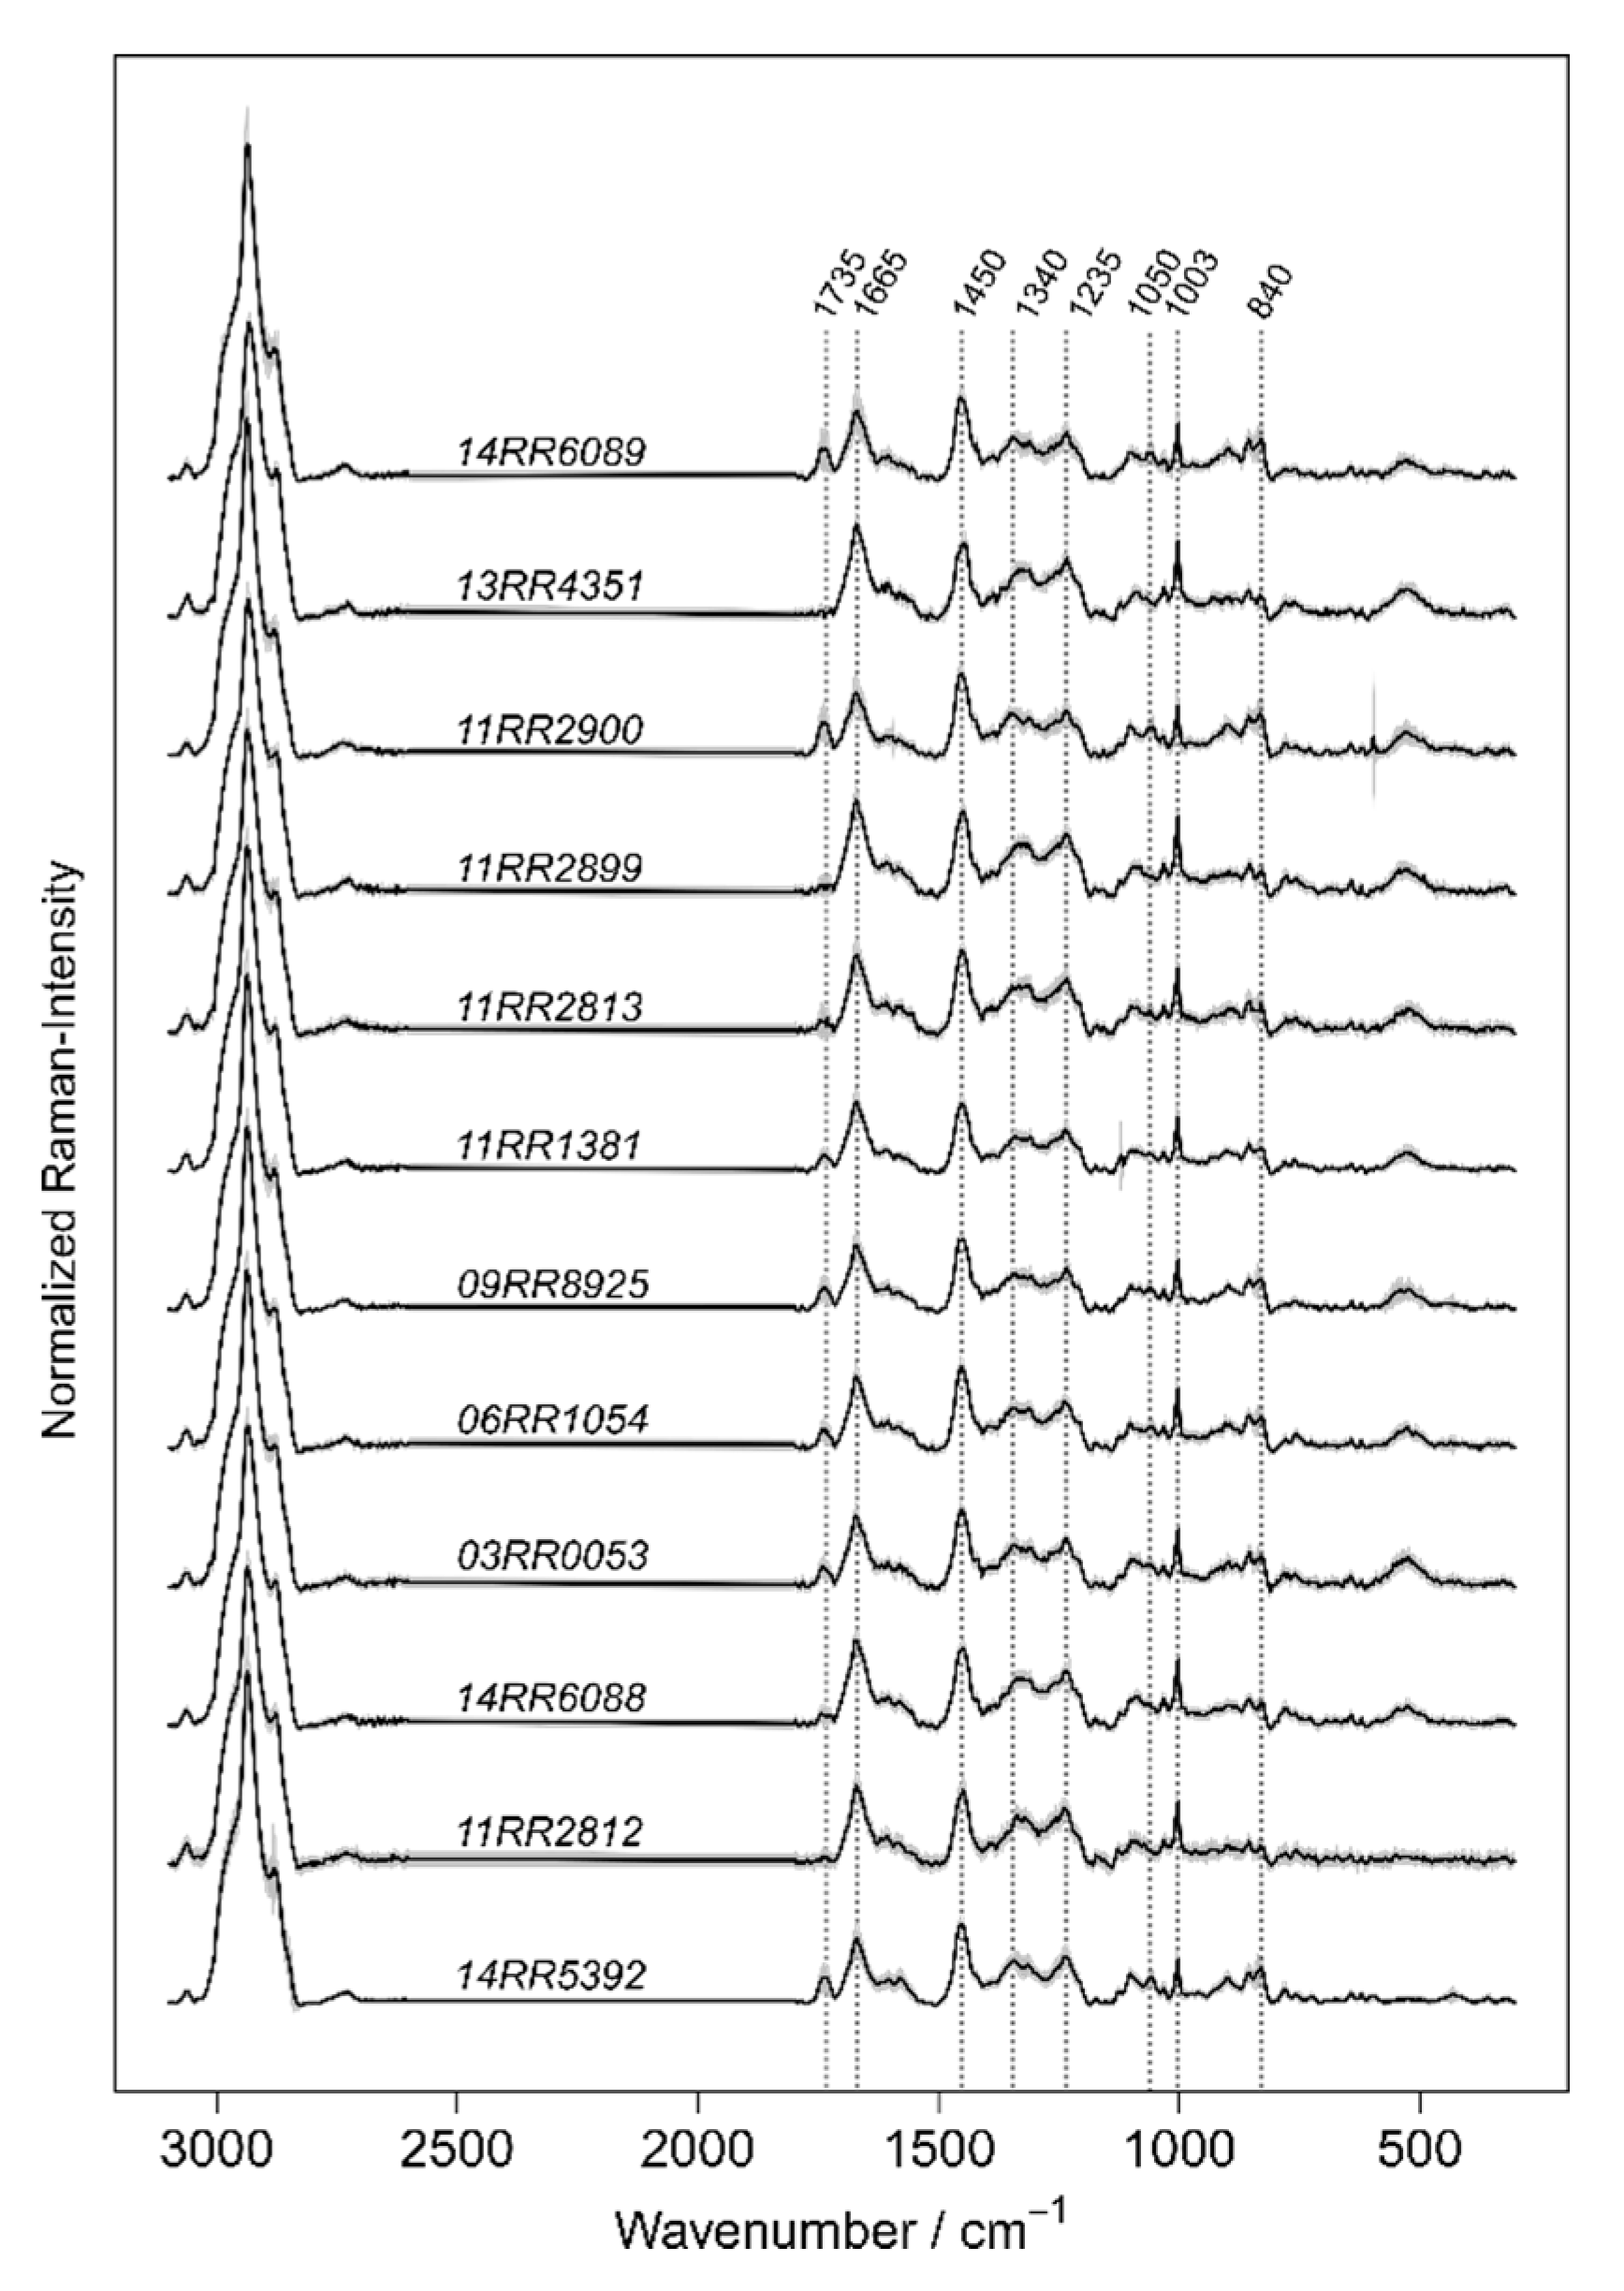
For an optimal supervision of the learning process, data’s inherent clusters were considered for the compilation of joined classes. Valuable insights into the nature of the Burkholderia’s Raman data are provided and information about the interfering species are delivered. By applying a LOBOCV, a realistic estimation of the strength and limits of Burkholderia species identification based on Raman spectroscopic data can be elucidated. The strength of the method is exhibited by the high sensitivities for the identification of the target species B. mallei and B. pseudomallei which follows the results of Stöckel et al. This is supported by the identification of the new and not referenced B. mallei and B. pseudomallei strains. The sensitives for the identification of the new Burkholderia strains reached for ten of the twelve strains between 90% and 100%. The results of the present study provided independent evidence of reproducibility for the classification and identification of B. mallei and B. pseudomllei based on Raman data. However, the quality of a classifier is also dependent on the specificity for the identification of a target species. The in comparison more frequently occurring misclassification of the ce–gla–phy-complex as B. mallei related agents at the top-level limits the reliability of the model. It is suggested that the misclassified class might be not sufficiently represented in the training data set and therefore model 1 insufficiently captures the underlying pattern of the data. This also applies to B. thailandensis which was represented by only one strain at the level of model 2.1. An increased classification accuracy is expected by a proper representation of the species-specific spectral phenotype. Even it is essential to have B.thailandensis in the database, it is important to mention that the bacterium is not an expected contaminant in sample material for clinical diagnostics, and any misclassifications could be not over-interpreted.
In contrast, model 2.1 perfectly predicts the classes for B. mallei and B. pseudomallei in the training and generalizes to the new strains that hasn’t been utilized before.
To address a specific diagnostic, the problem of sample size planning and the compilation of training data for machine learning has to be optimized so that the differences between species with a similar spectral phenotype can be properly modelled. The present study highlighted the potential of a machine learning-based Raman spectroscopic assay as a microbial diagnostic tool. It was shown that the performance of the method for the identification of B. mallei and B. pseudomallei could be reproduced by an independent laboratory and with independent measurement equipment.
As a next step, the model transferability for bacterial Raman data has to be optimized. With a view to multicenter identification purposes established database can then be shared between different laboratories. Once the access to a comprehensive bacterial Raman data collection is provided, task-specific compilations of data subsets can be used to answer new upcoming diagnostic questions.


 ,
, 


