
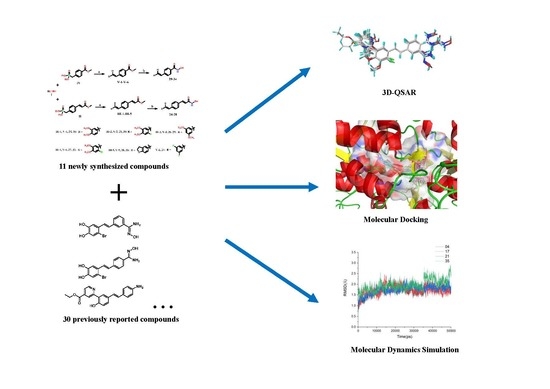
Investigating the Binding Mode of Reversible LSD1 Inhibitors Derived from Stilbene Derivatives by 3D-QSAR, Molecular Docking, and Molecular Dynamics Simulation

 , and
, and
Abstract
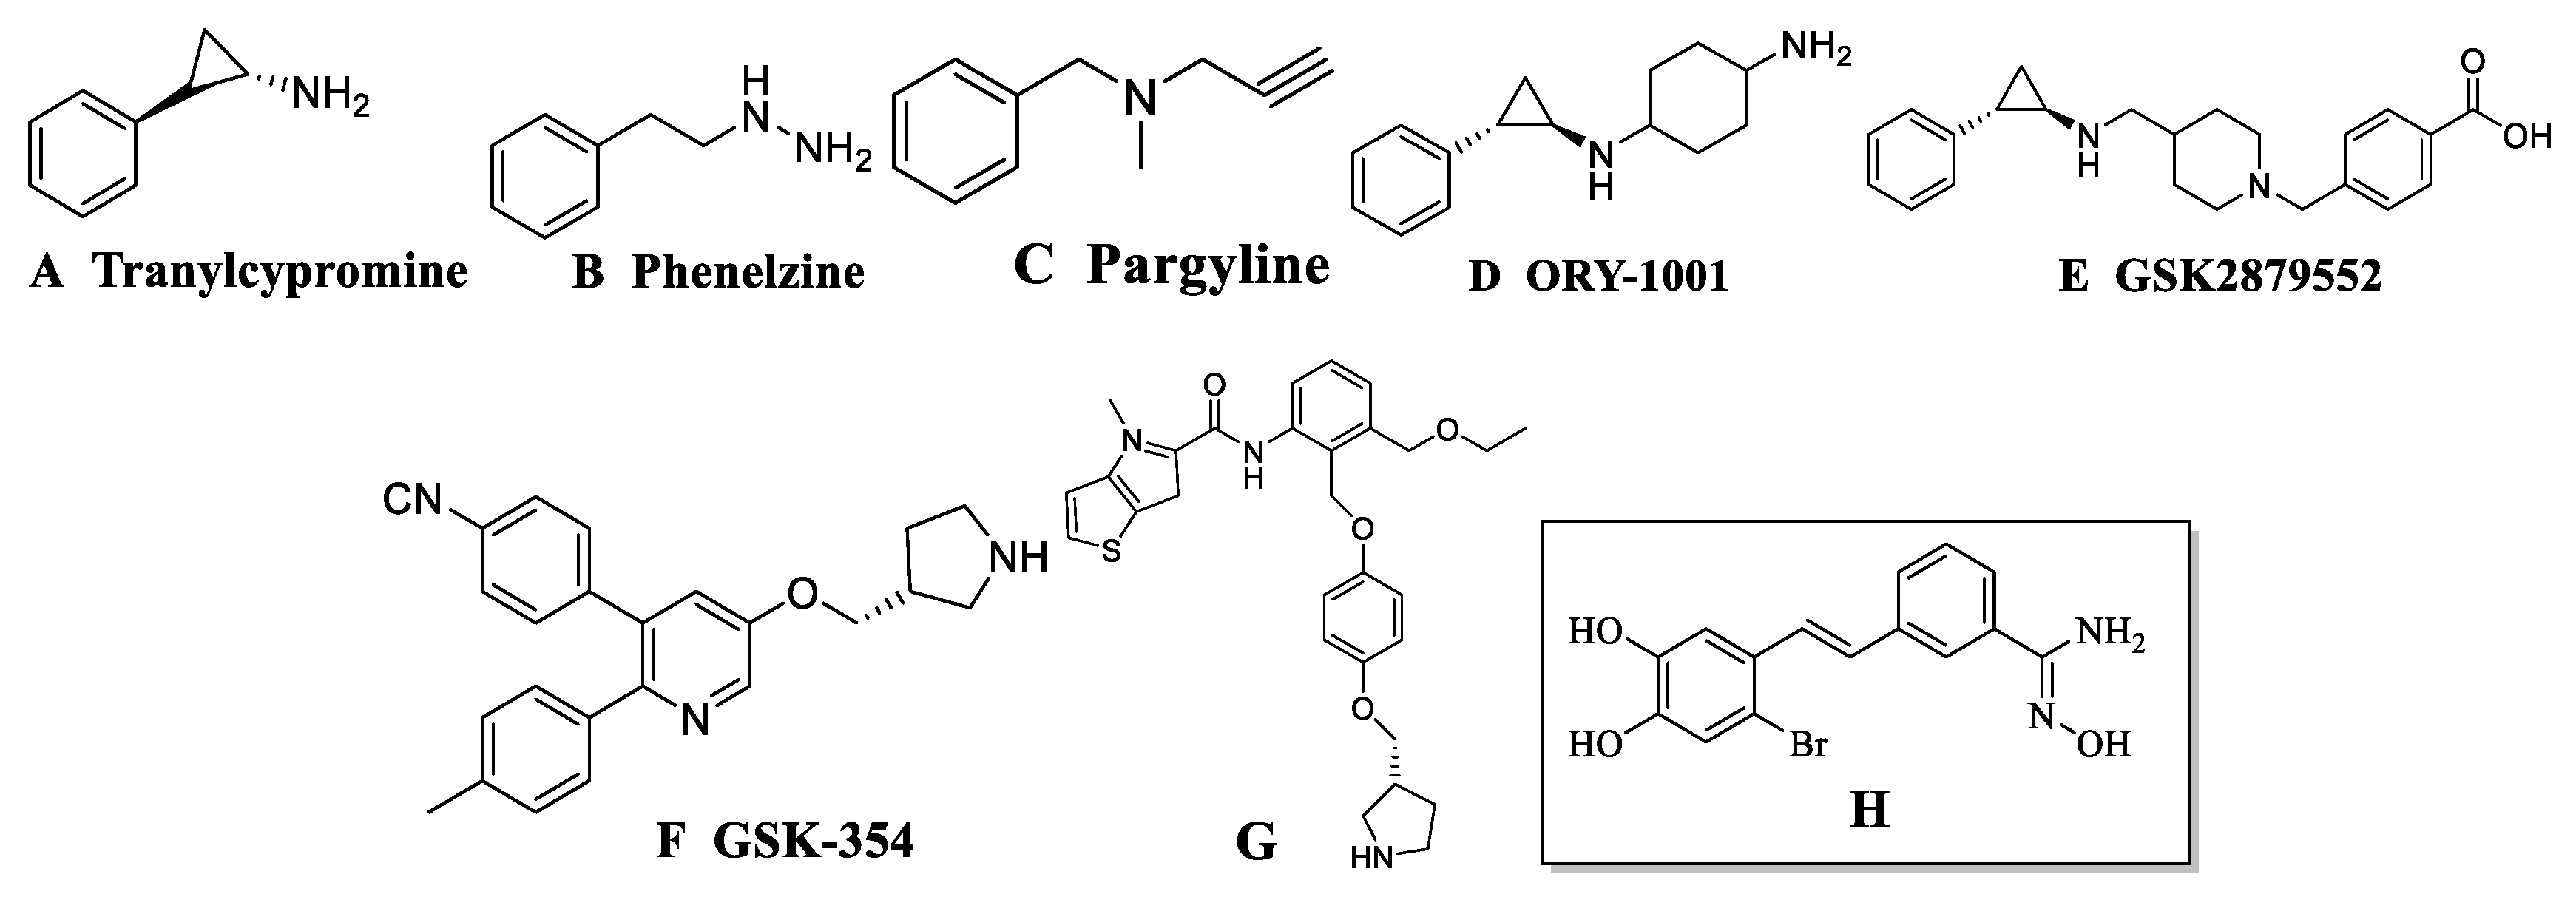
1. Introduction
2. Materials and Methods
2.1. Determination of LSD1 Inhibitor Activity
2.2. Data Sets
2.3. Alignment and Generation of the 3D-QSAR Models
2.4. CoMFA and CoMSIA Statistical Analysis
2.5. Molecular Docking
2.6. Molecular Dynamics Simulations
2.7. Binding Free Energy Calculations
3. Results and Discussion
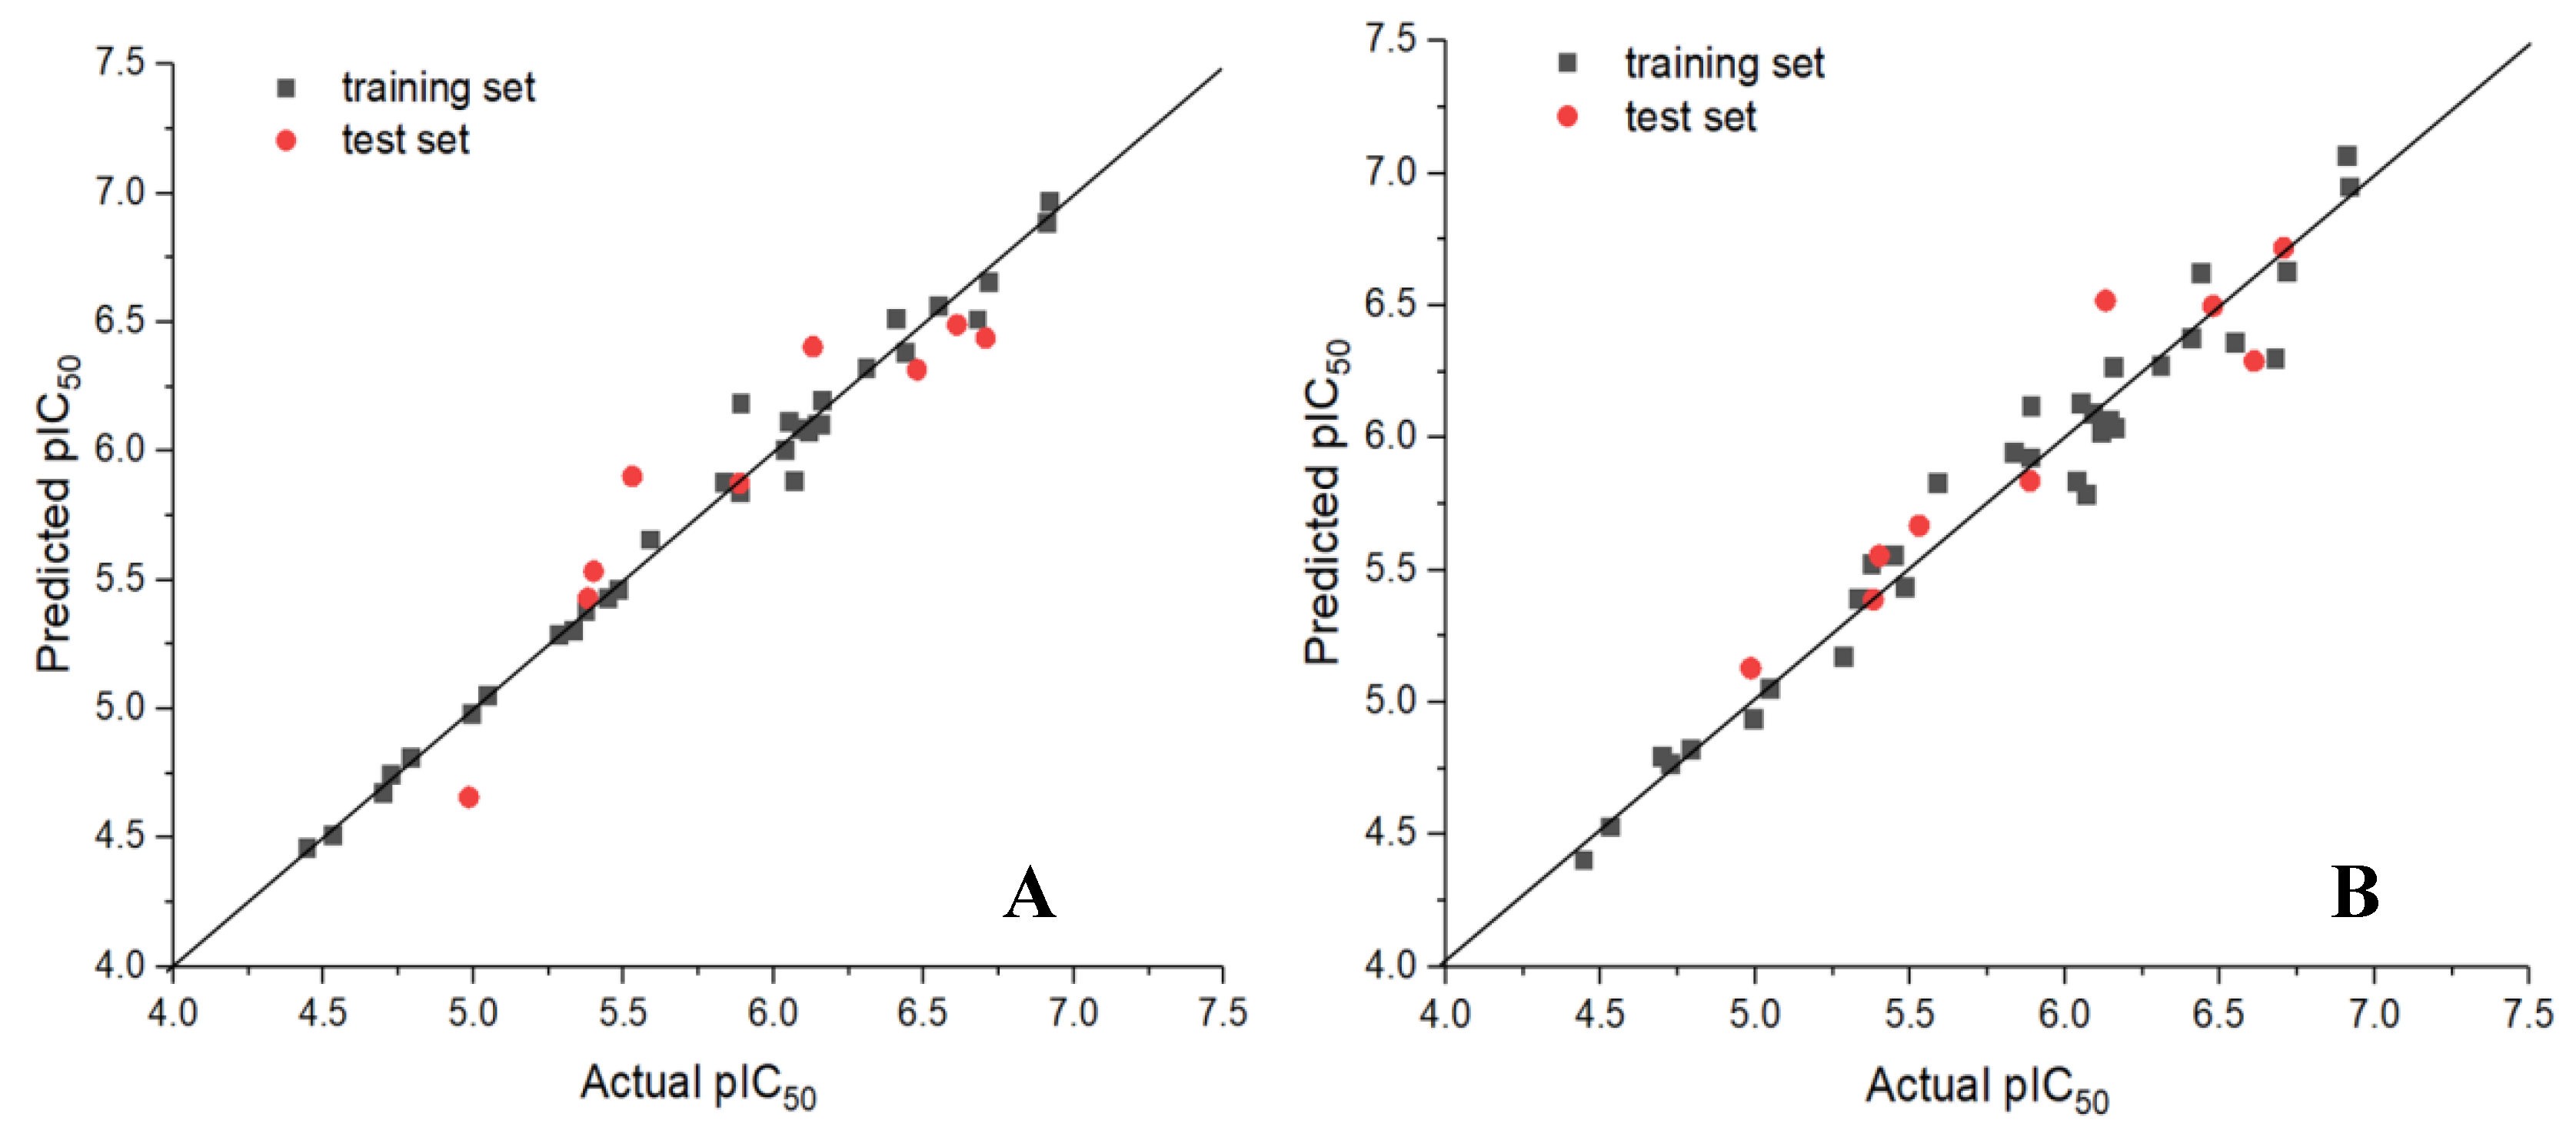
3.1. Statistical Results of CoMFA and CoMSIA
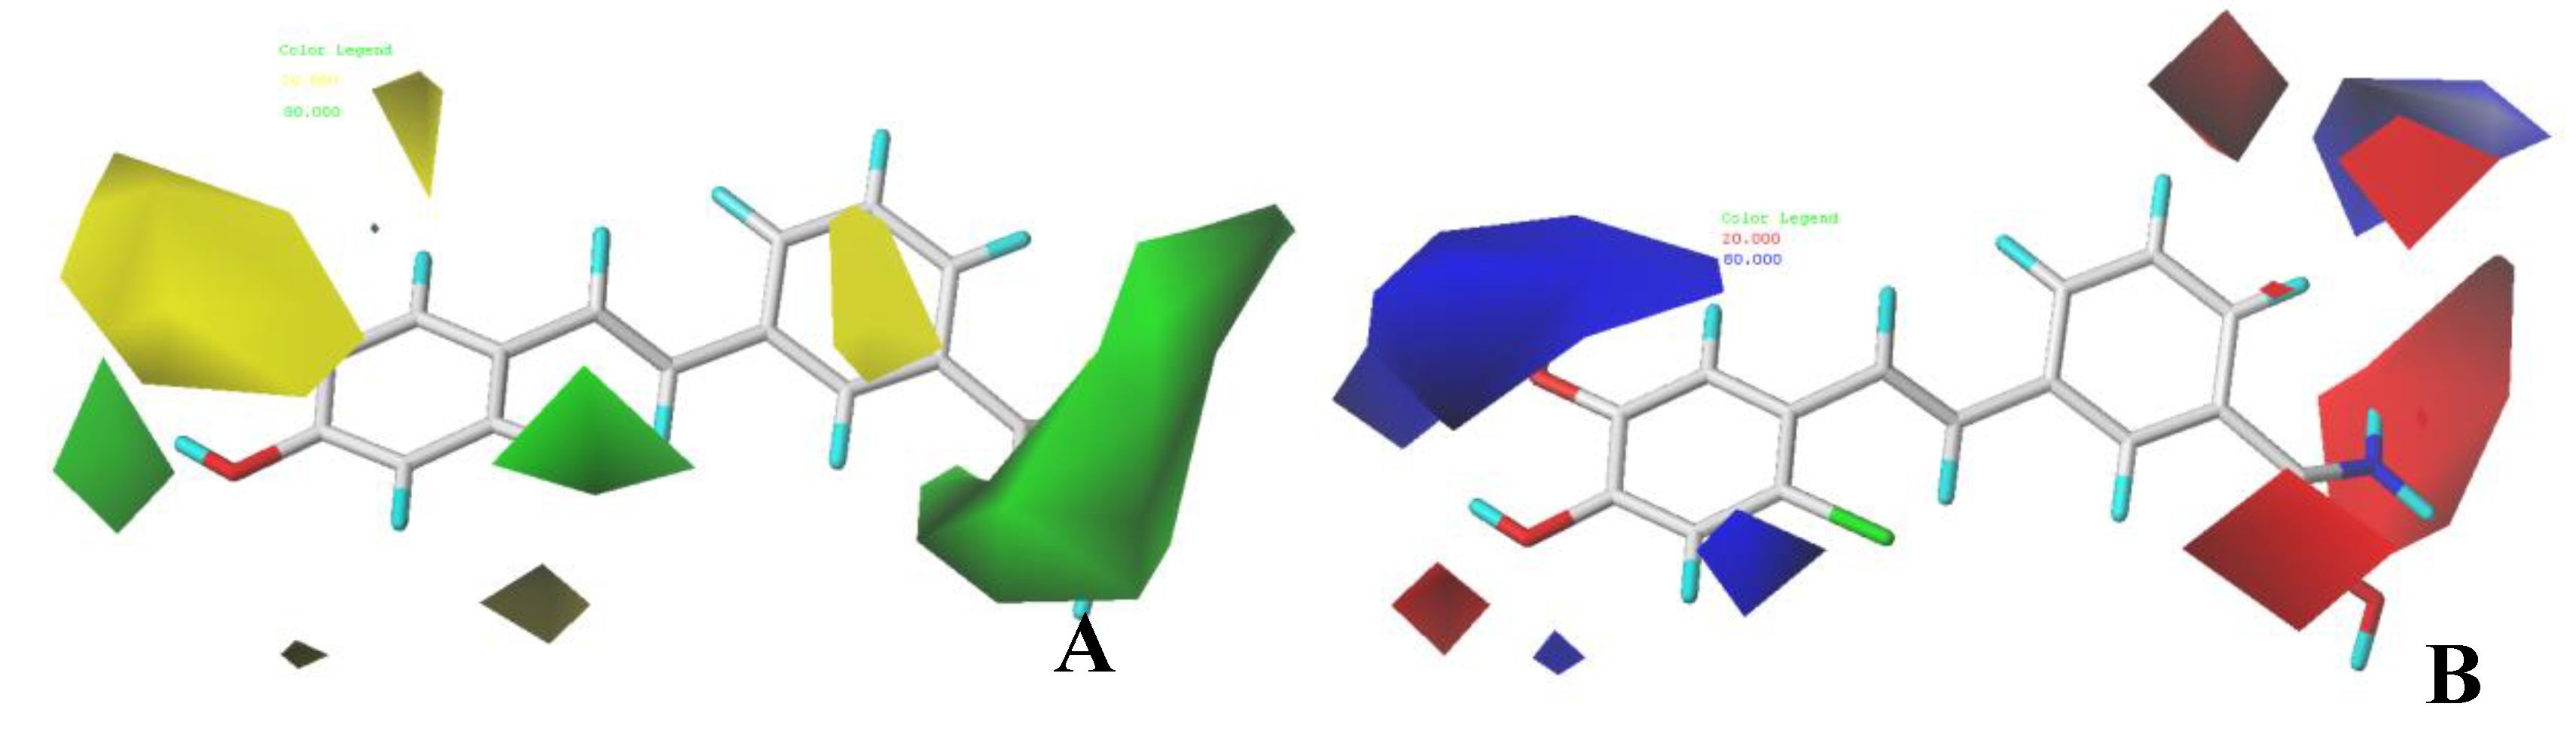
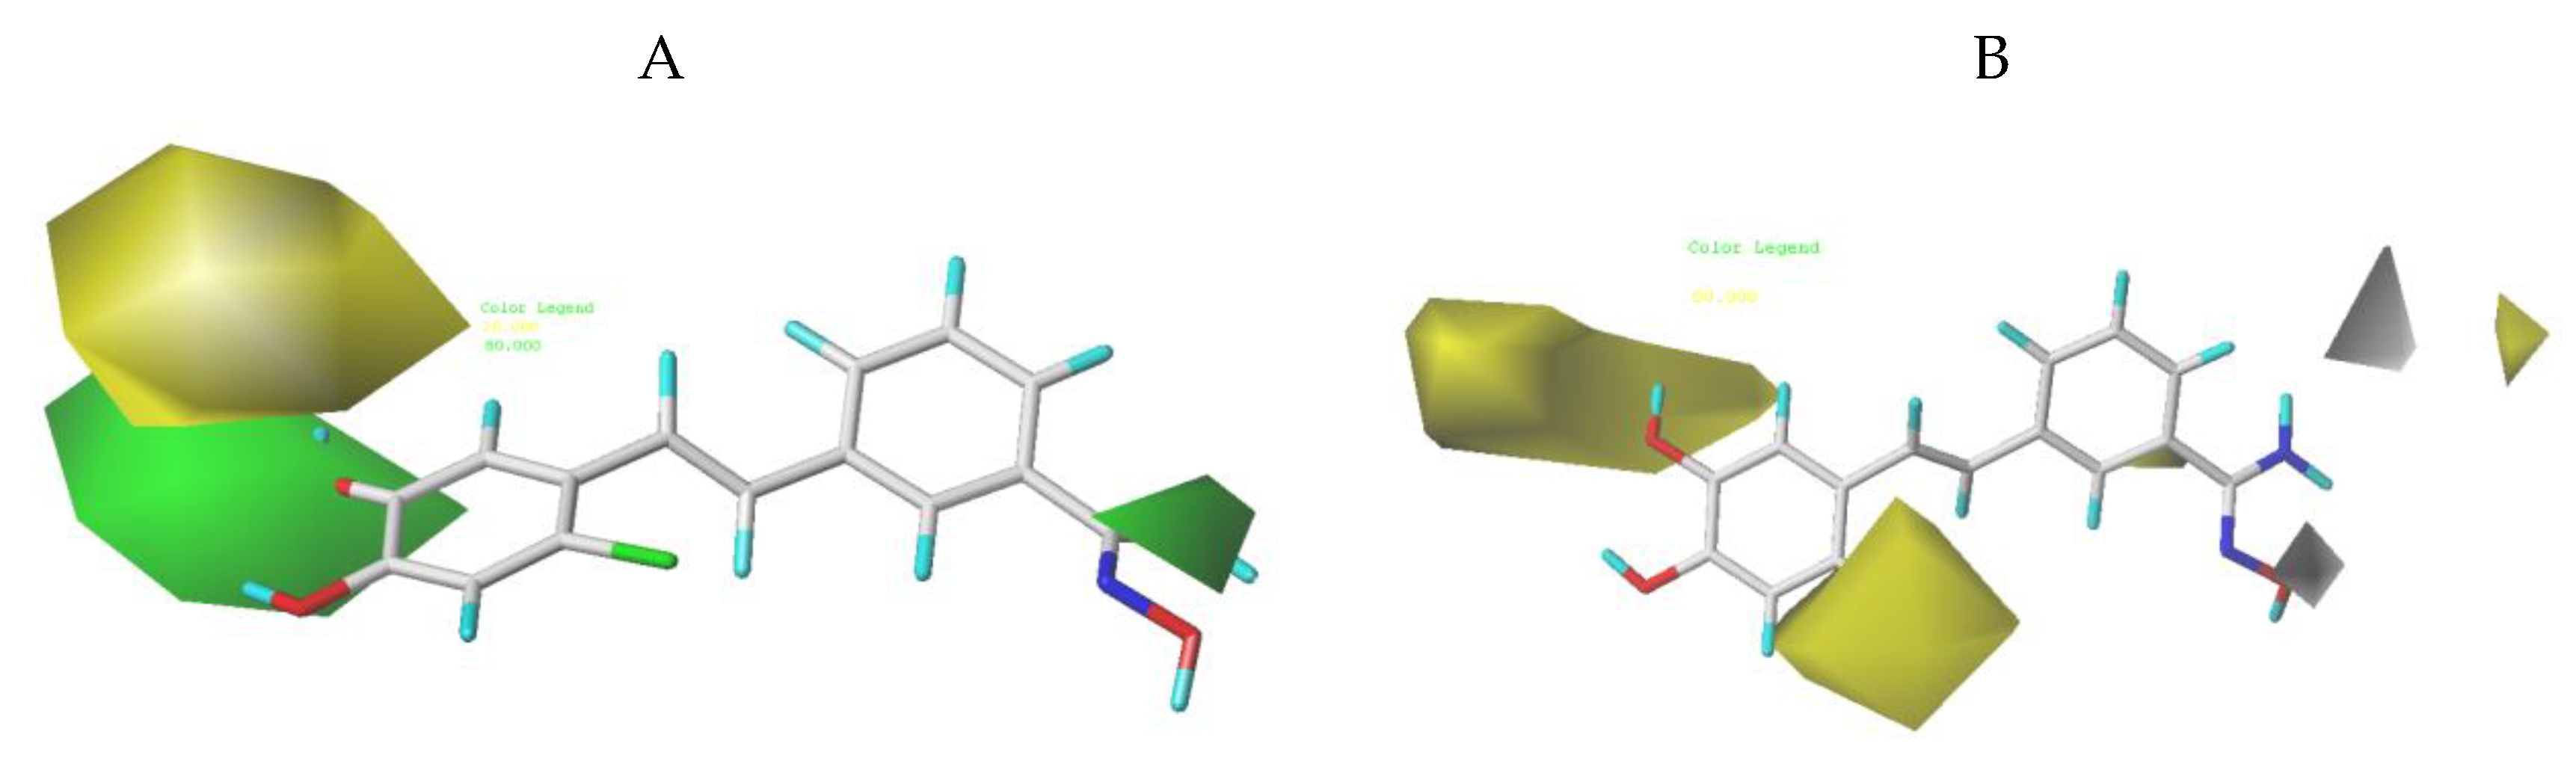
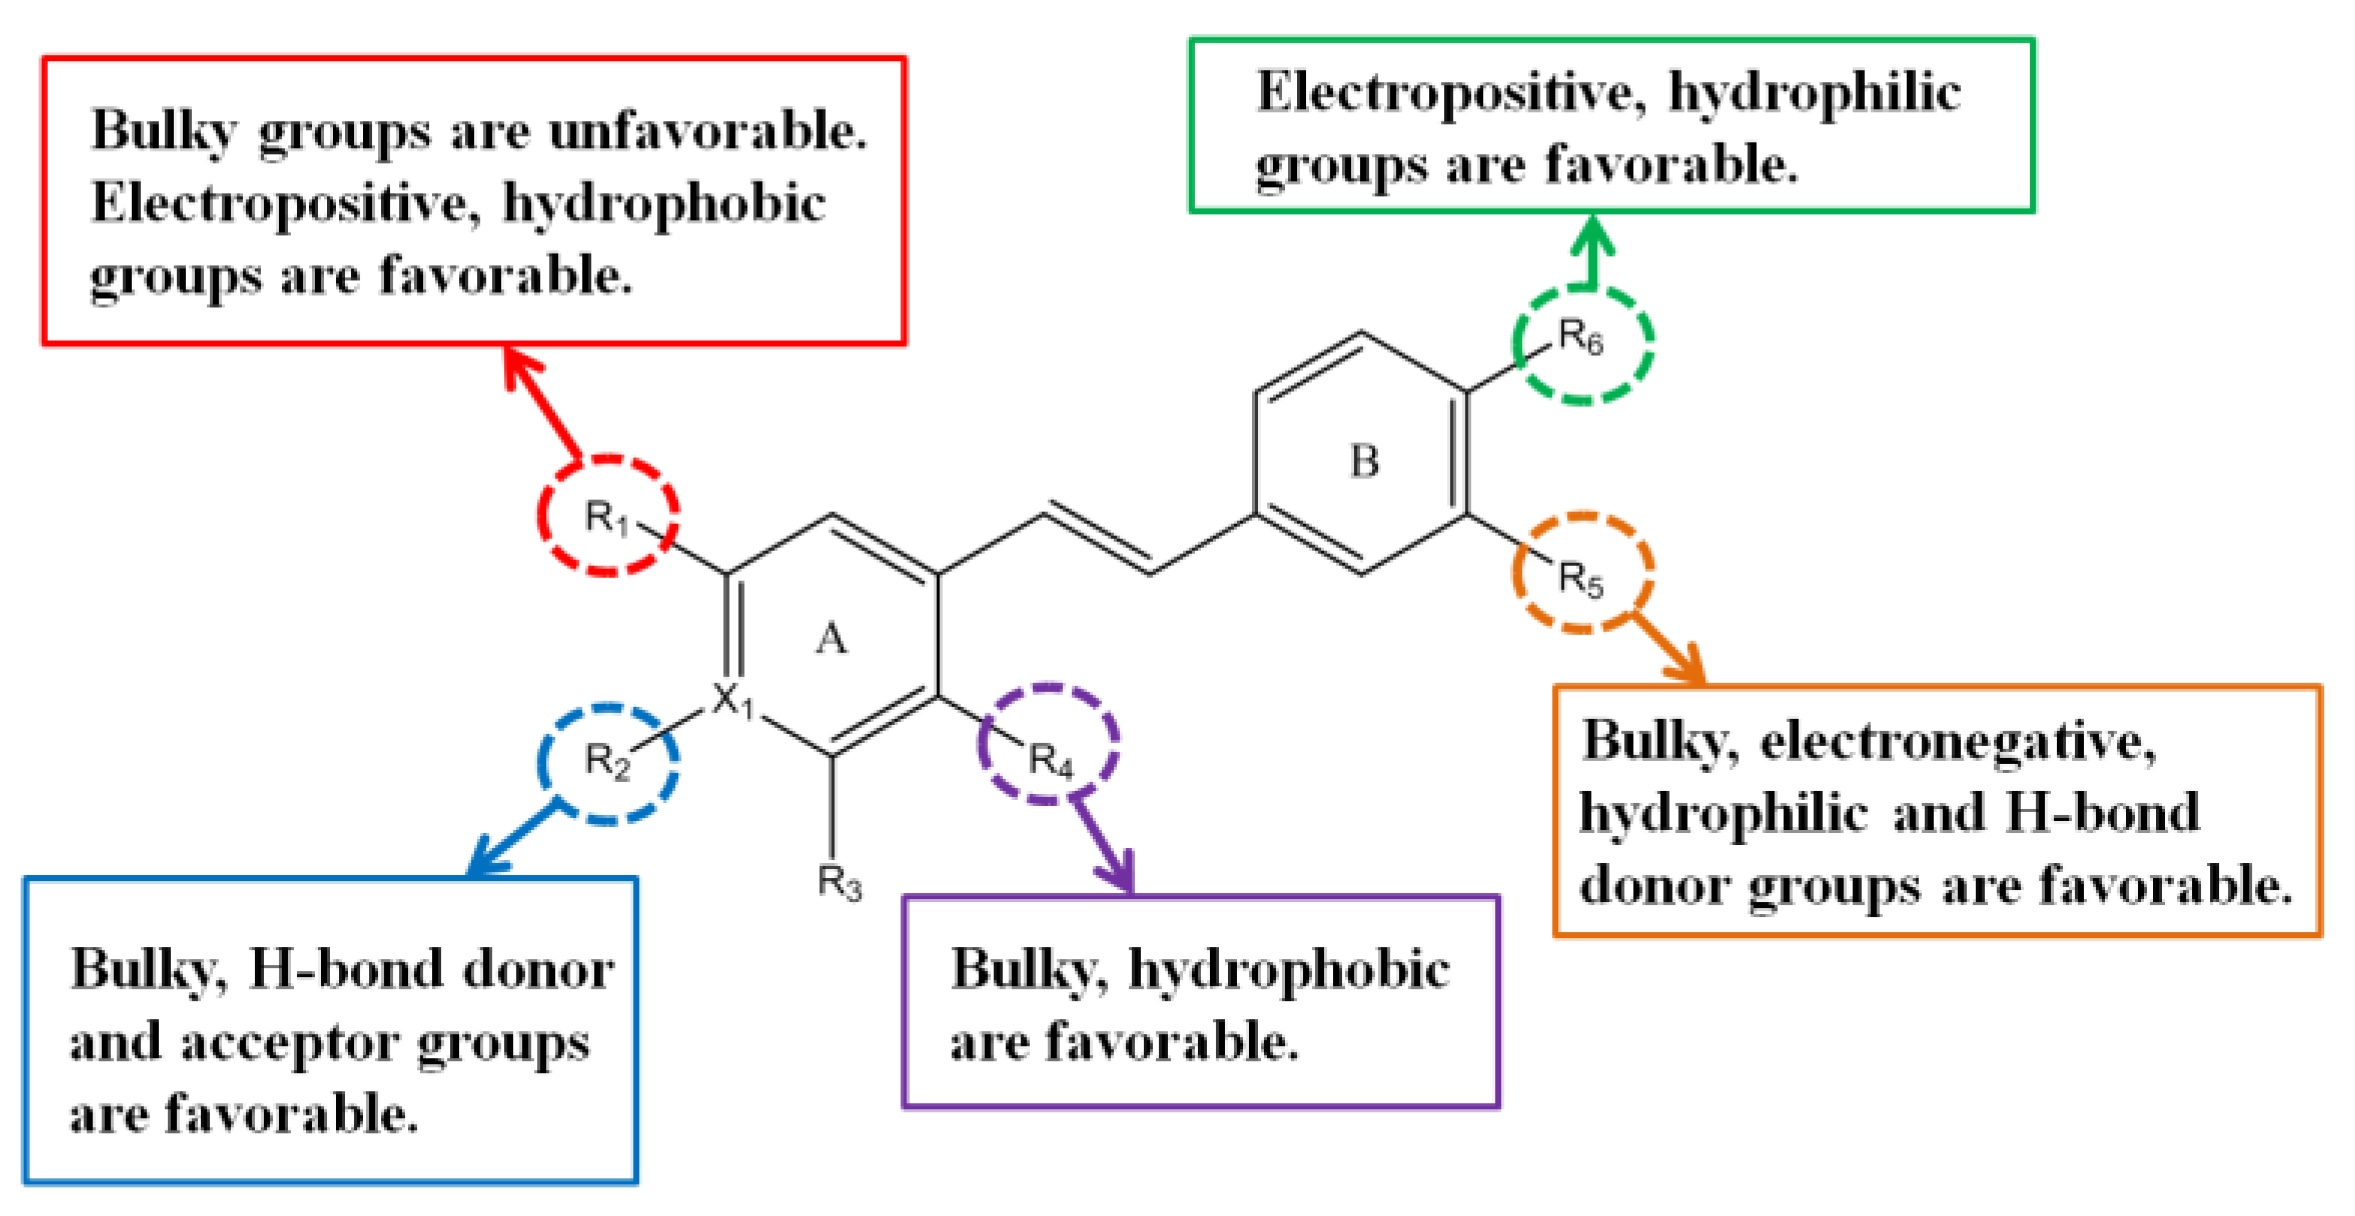
3.2. CoMFA Contour Maps
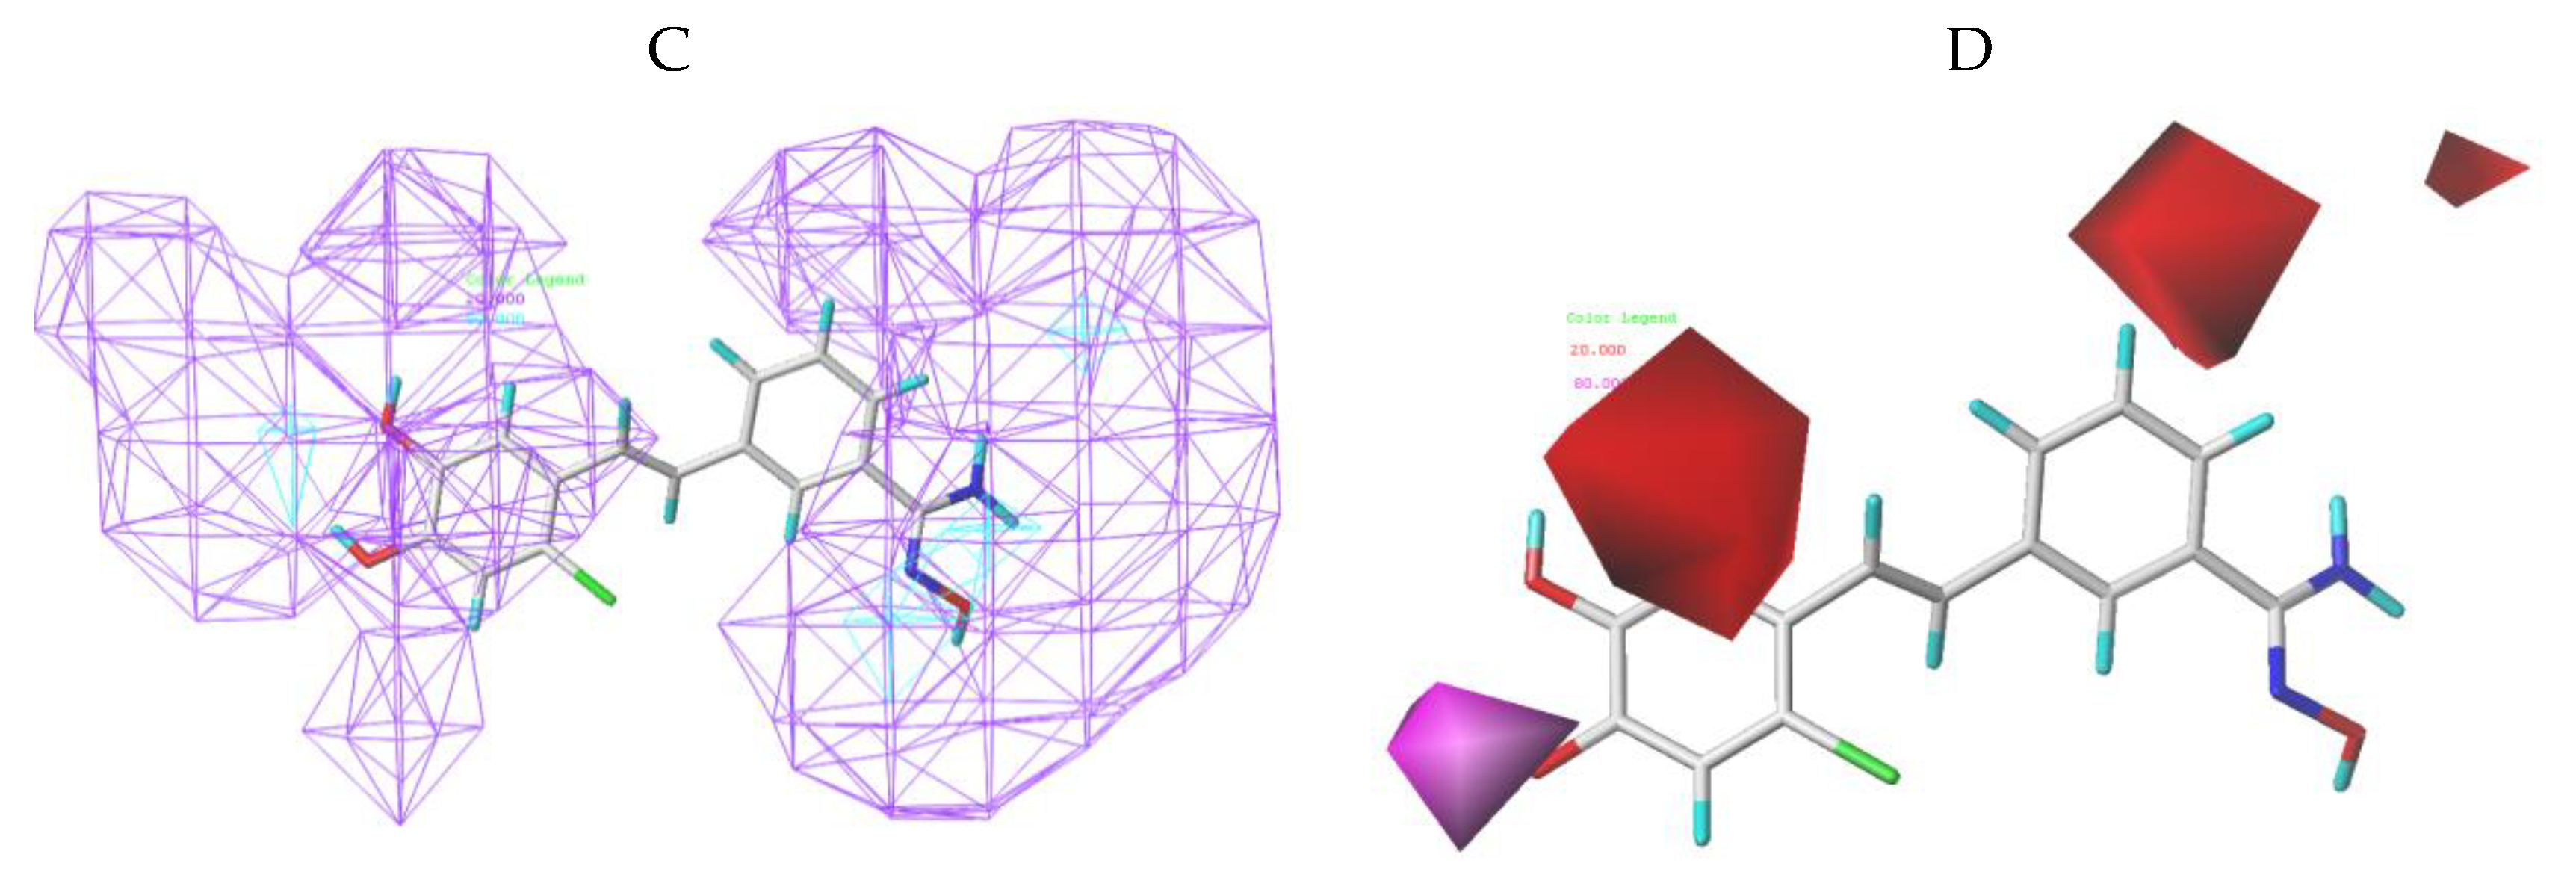
3.3. CoMSIA Contour Maps
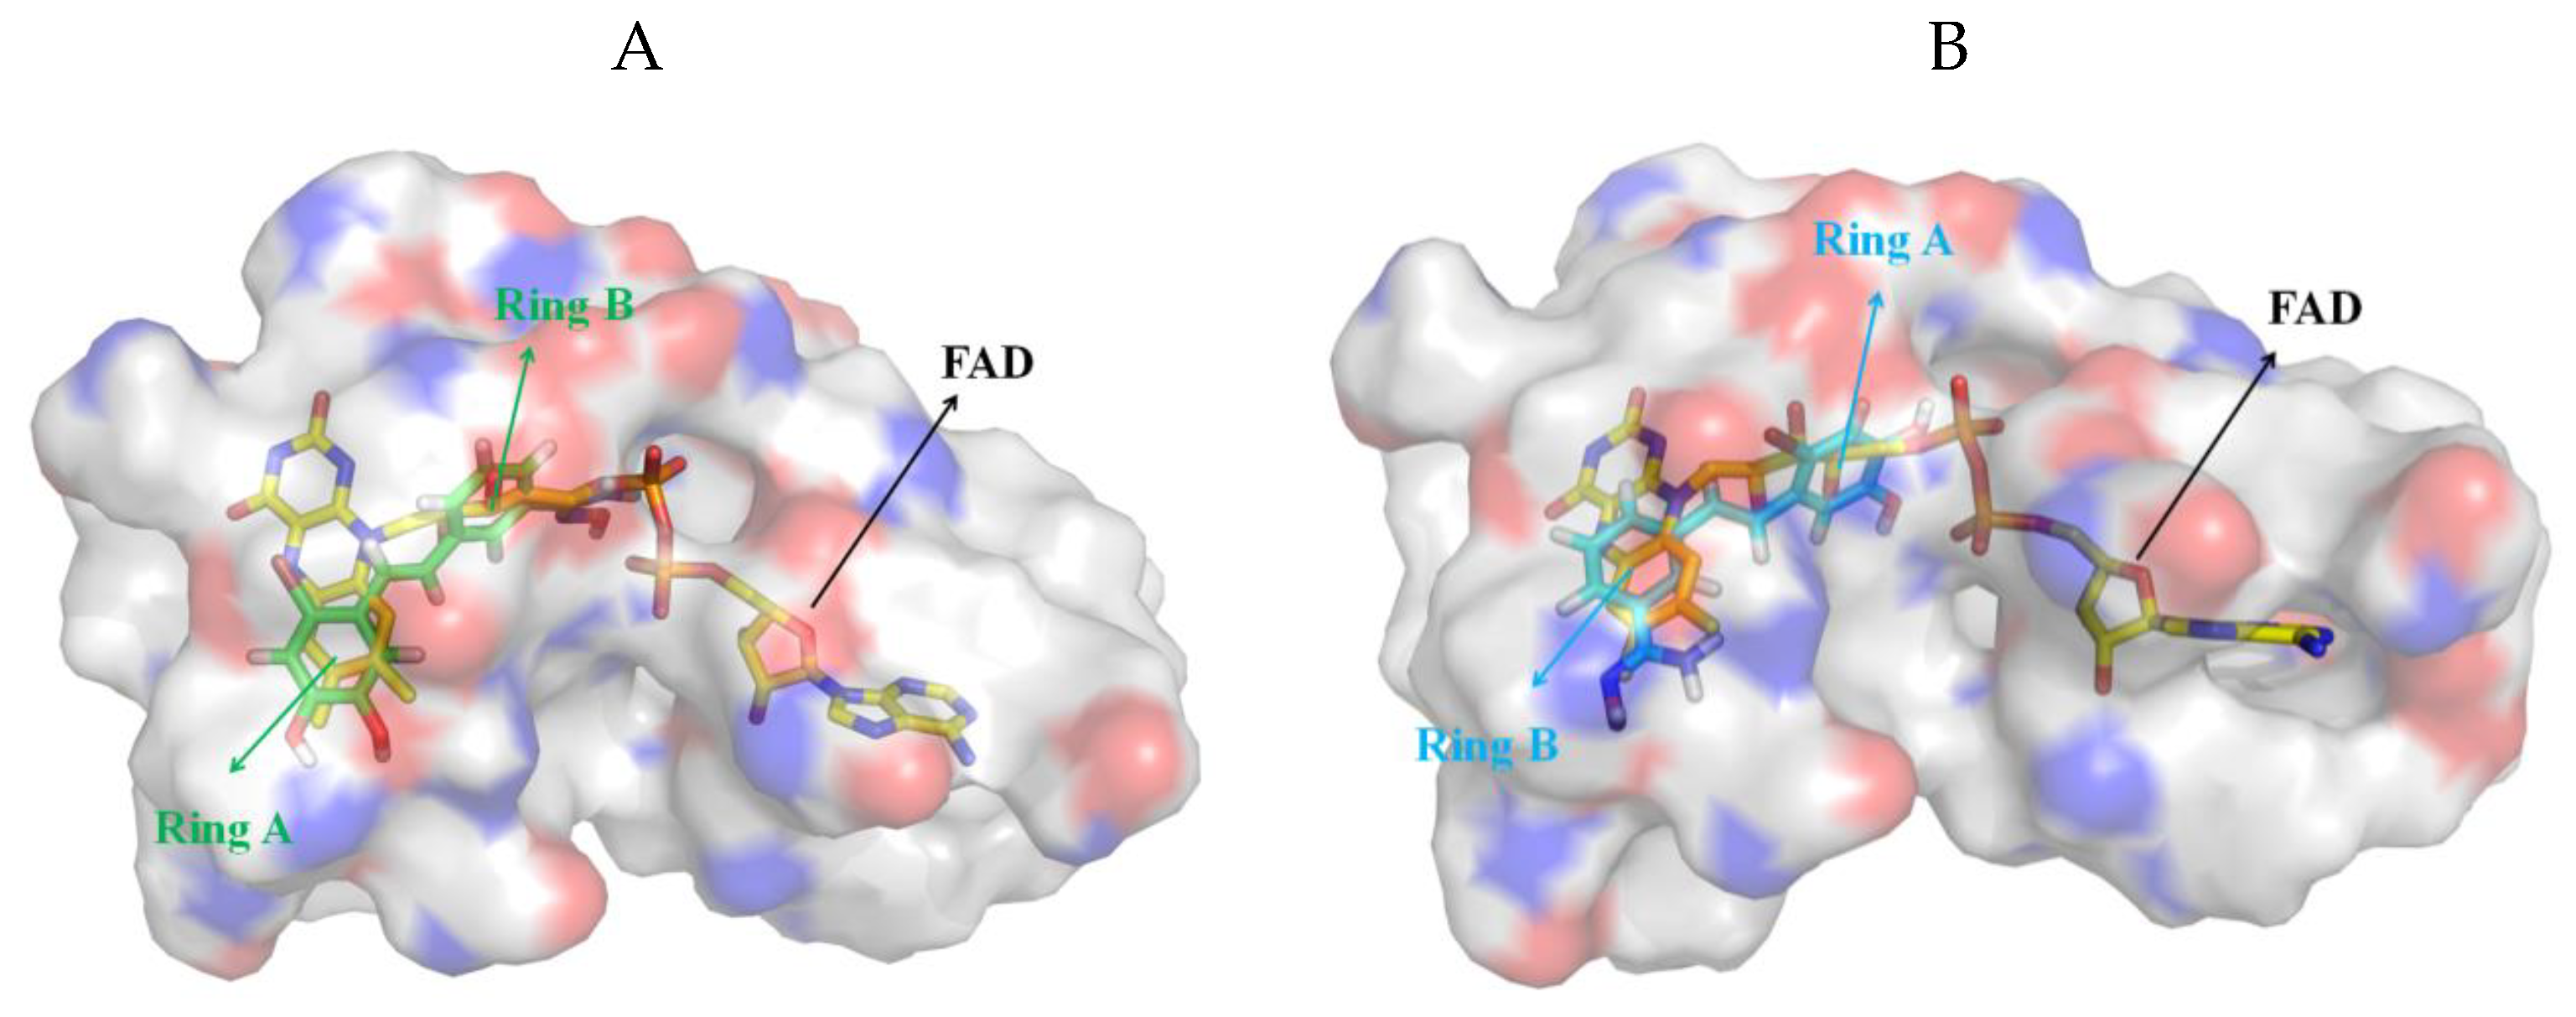
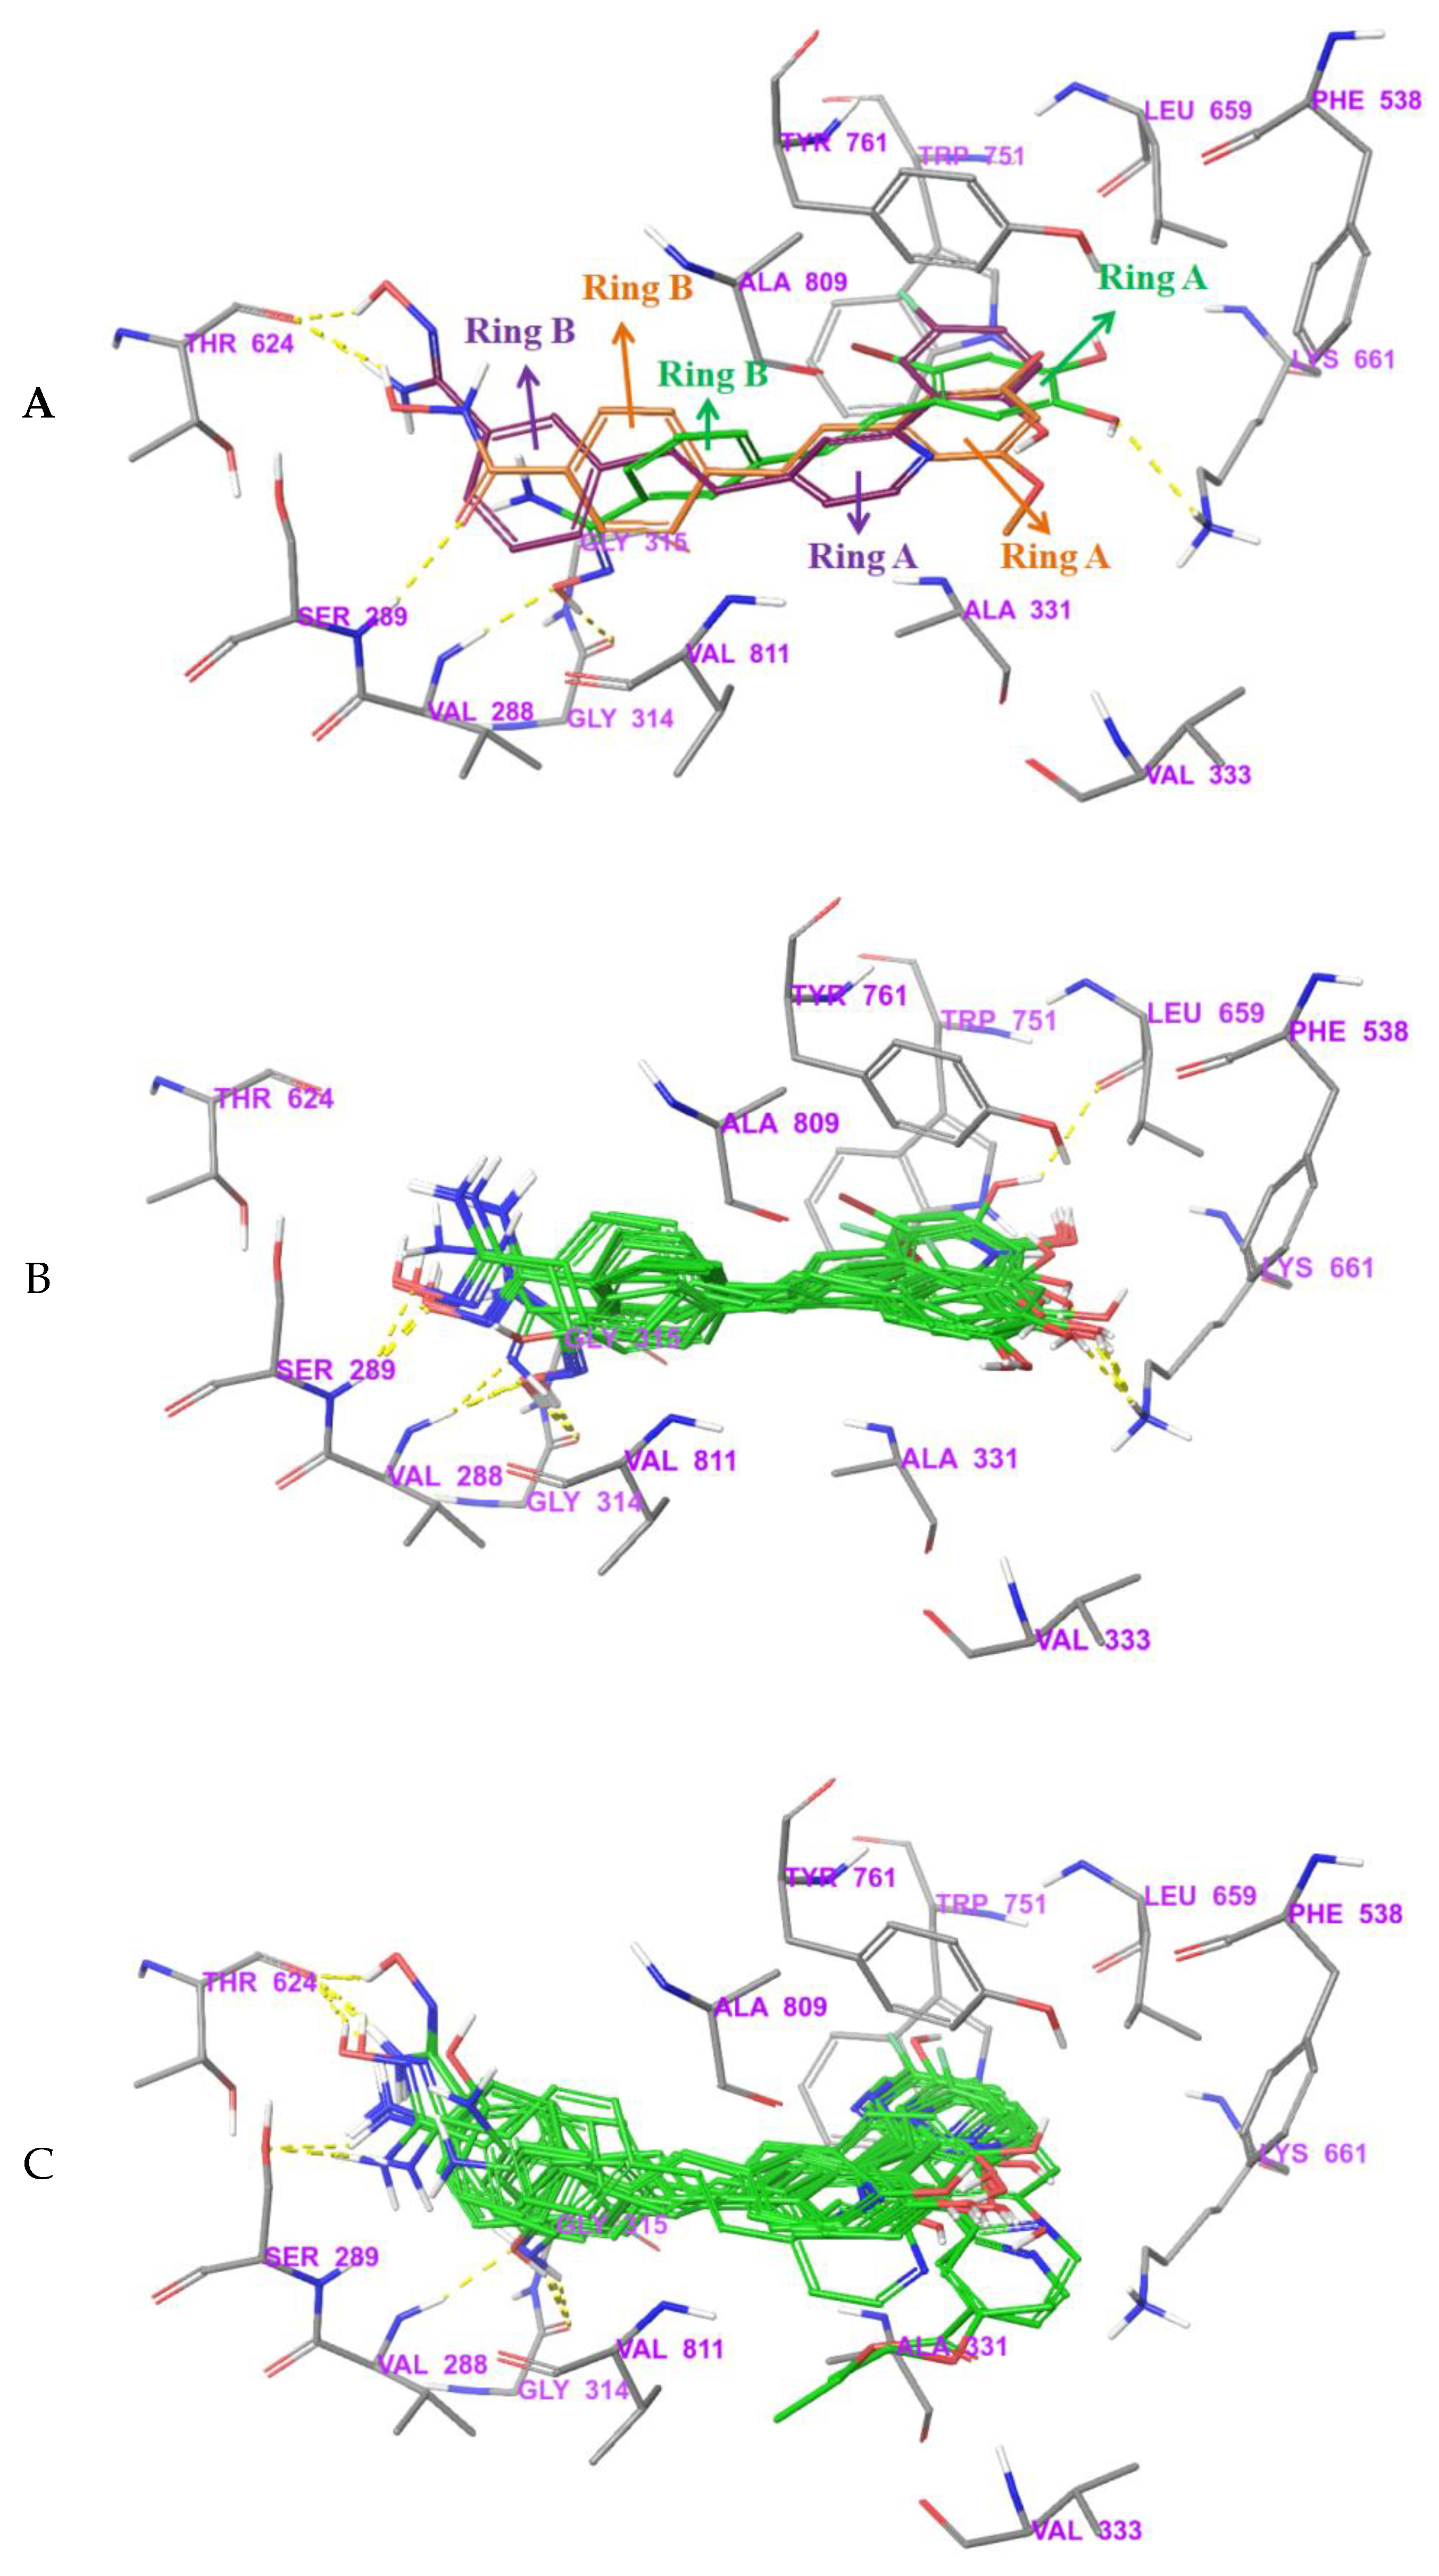
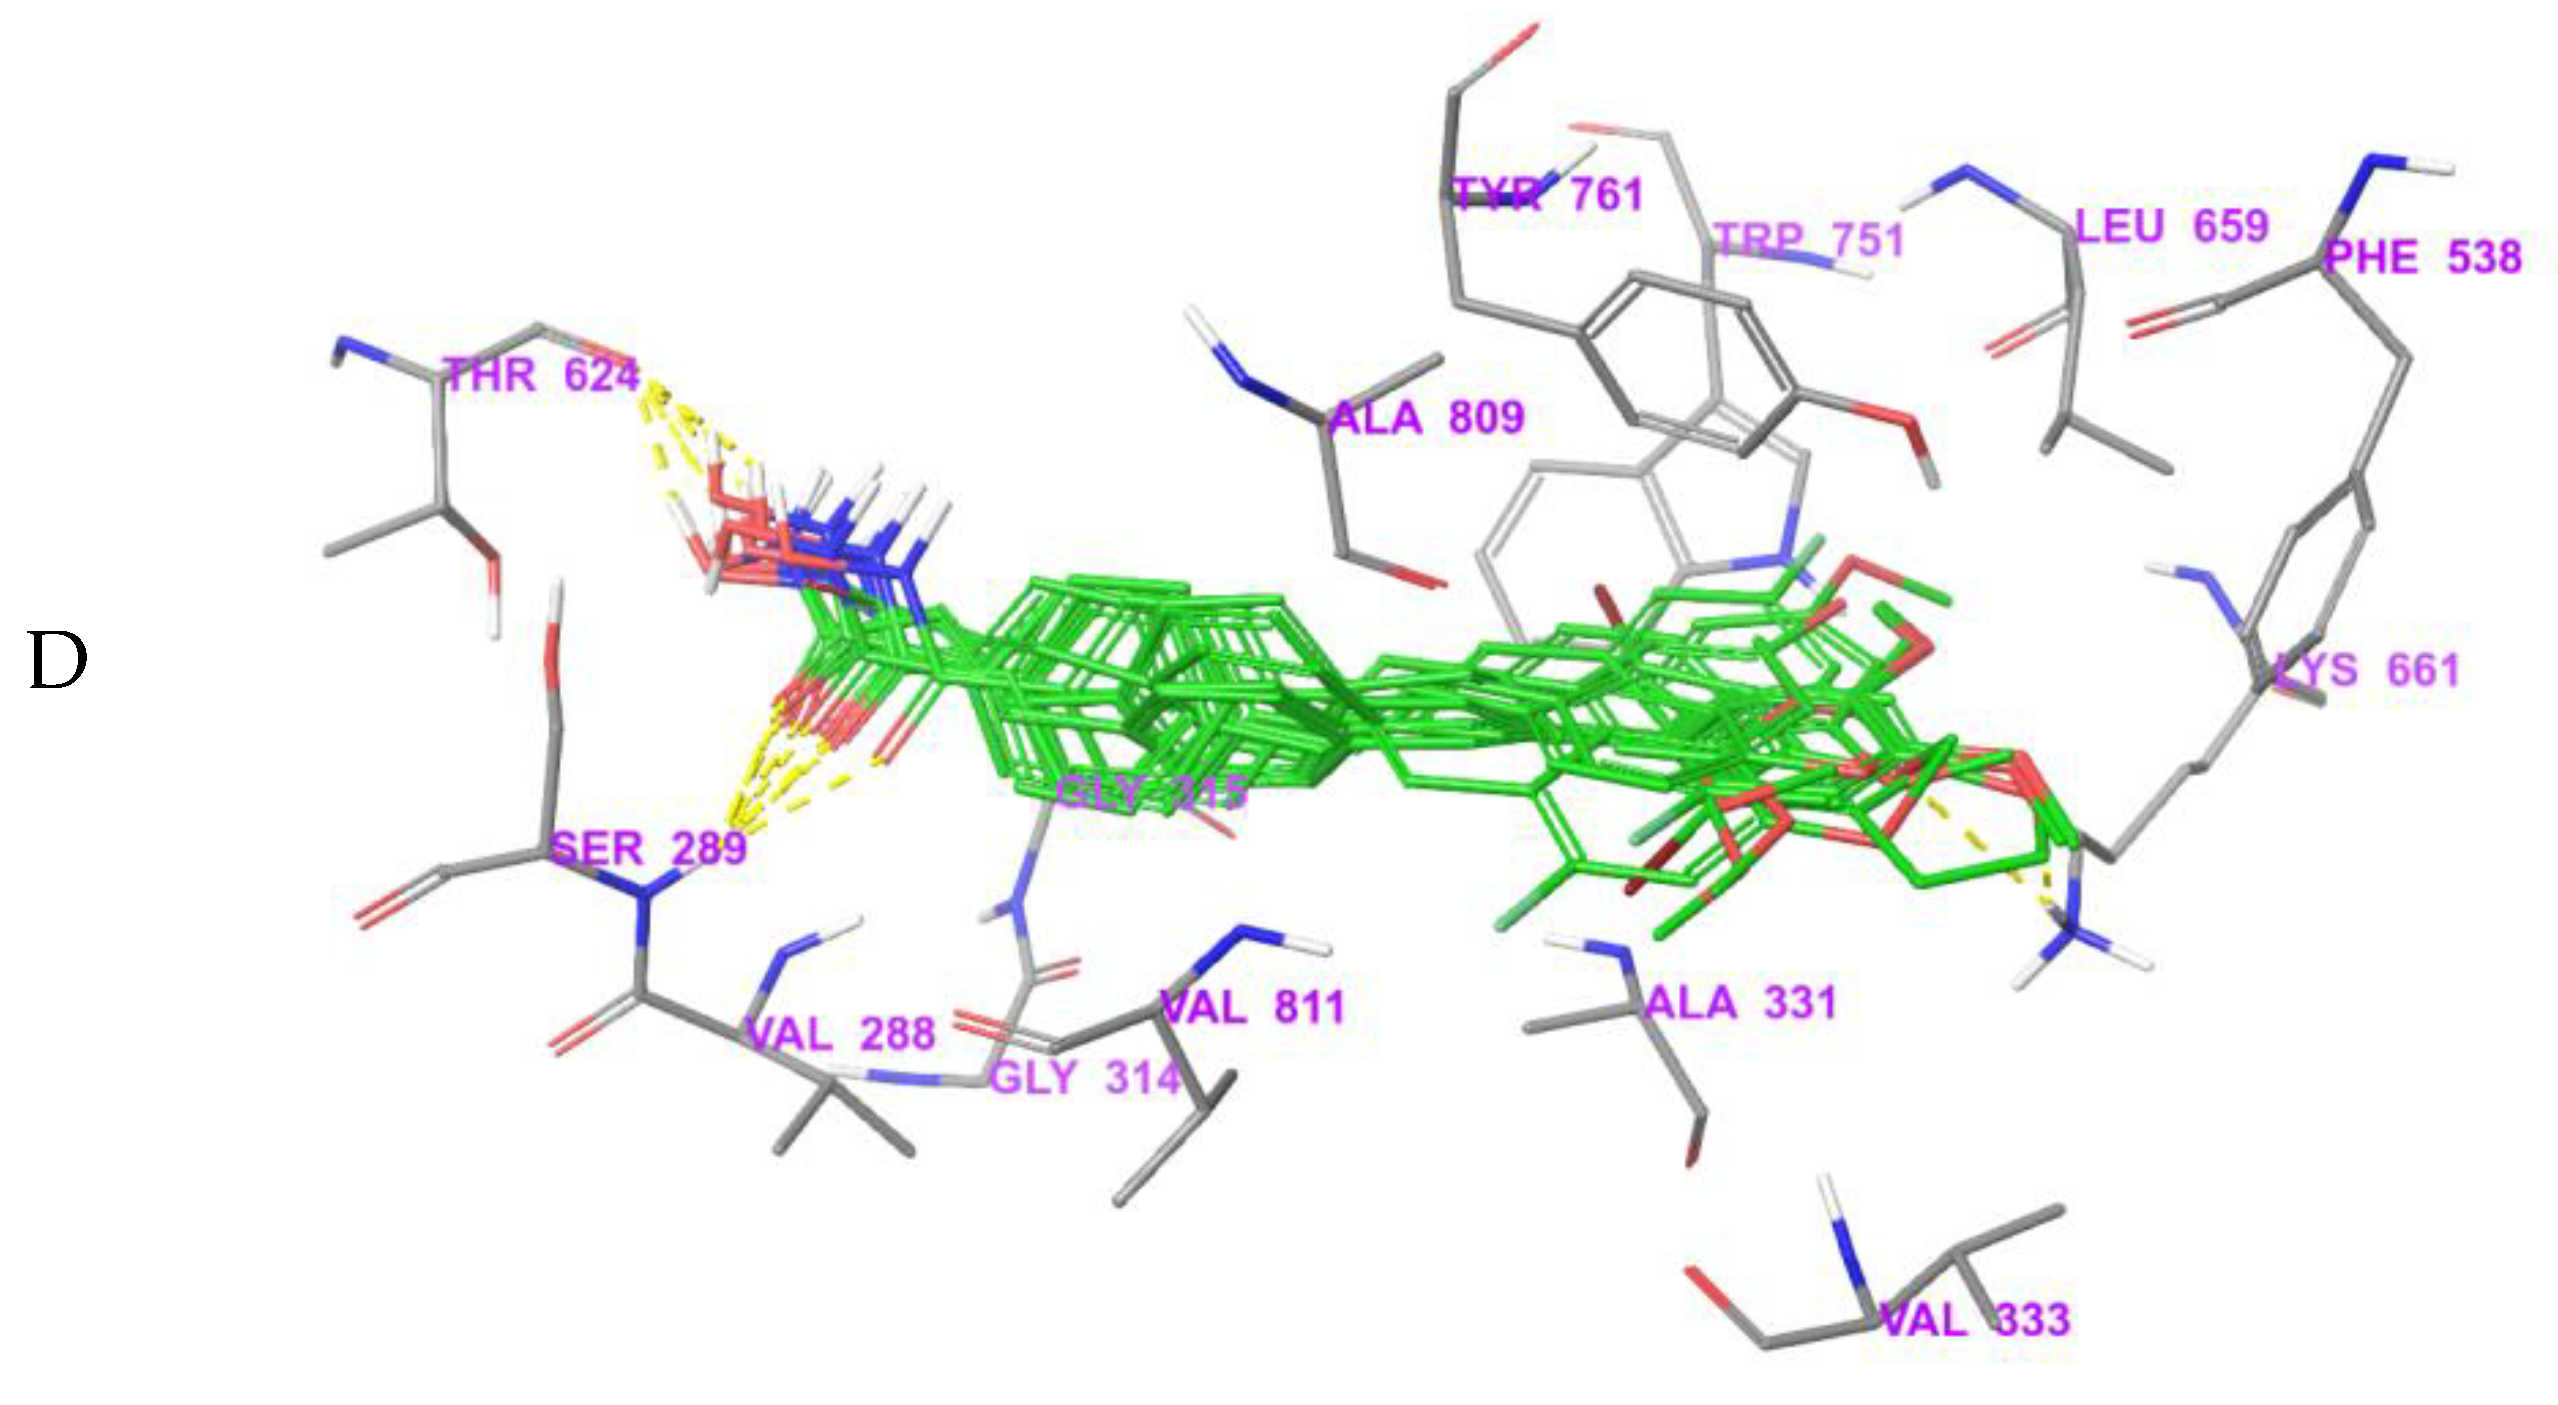
3.4. Bonding Site Prediction
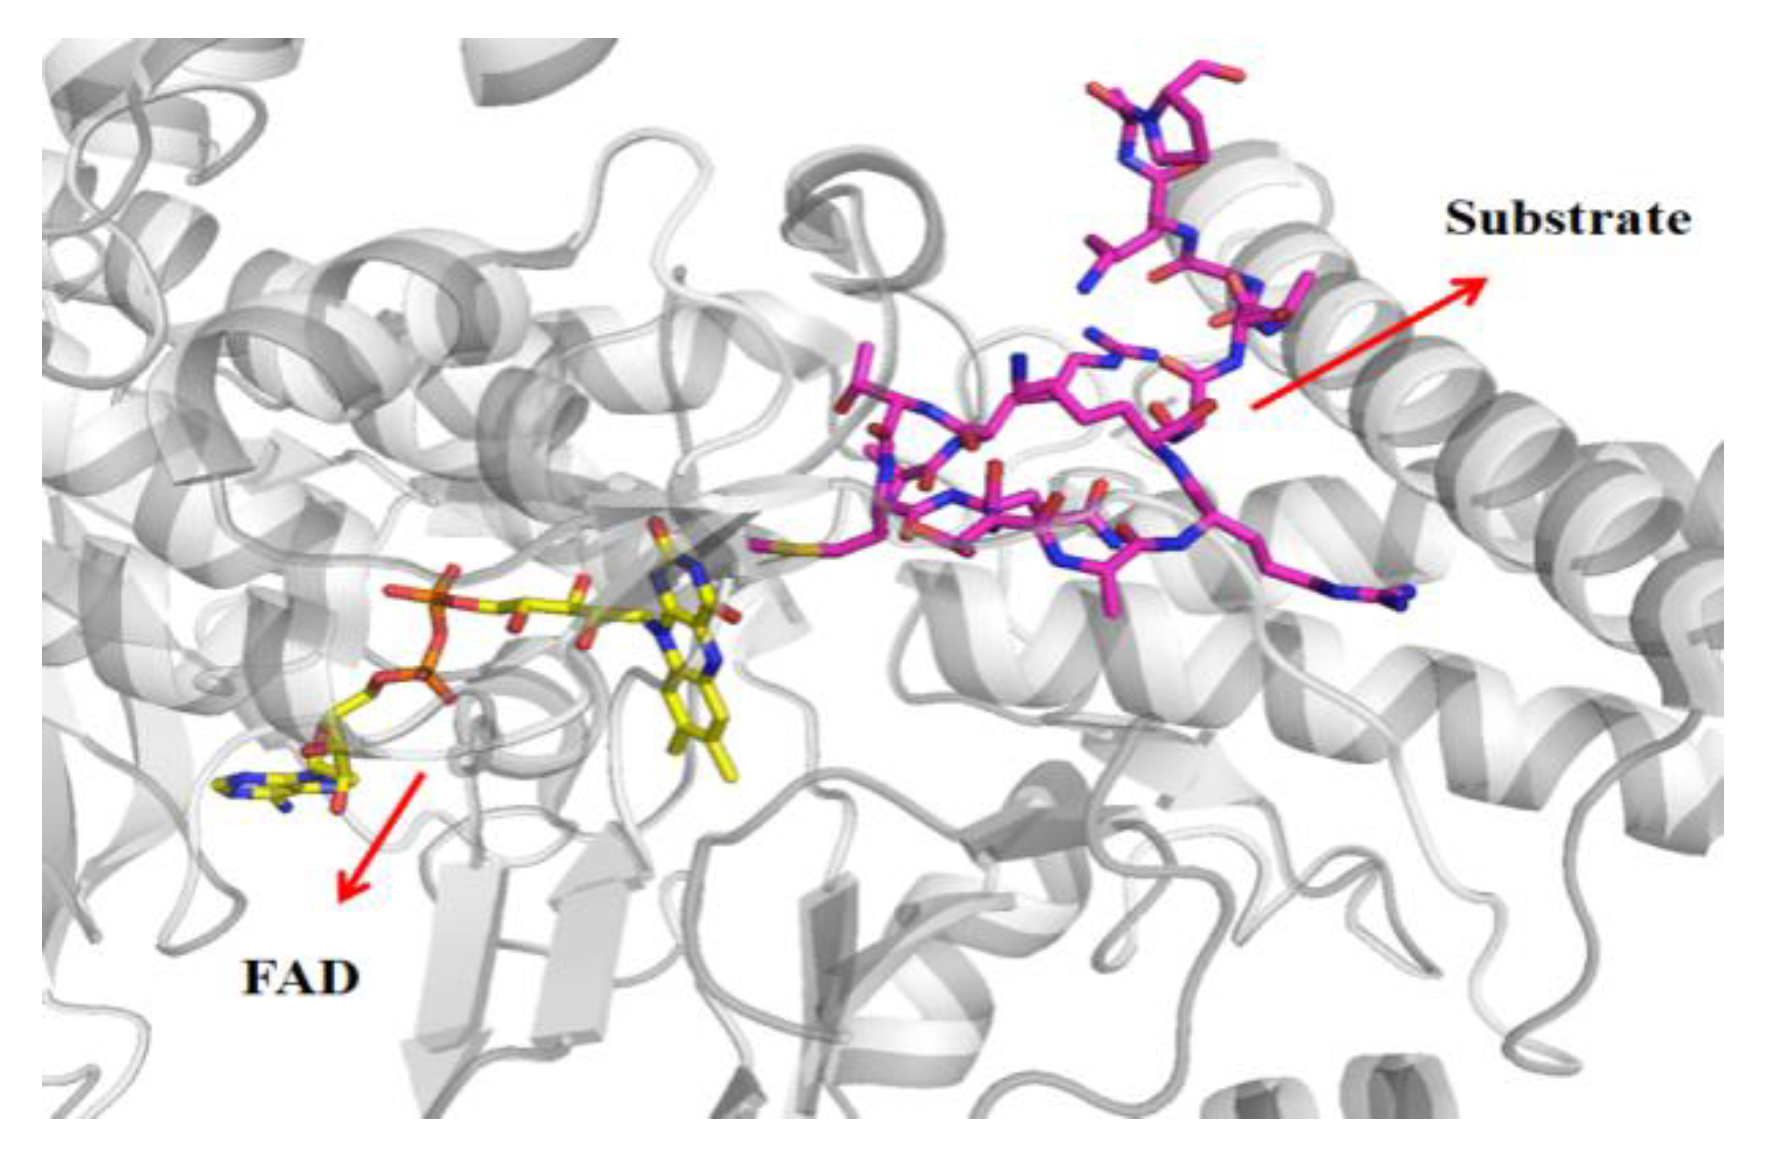
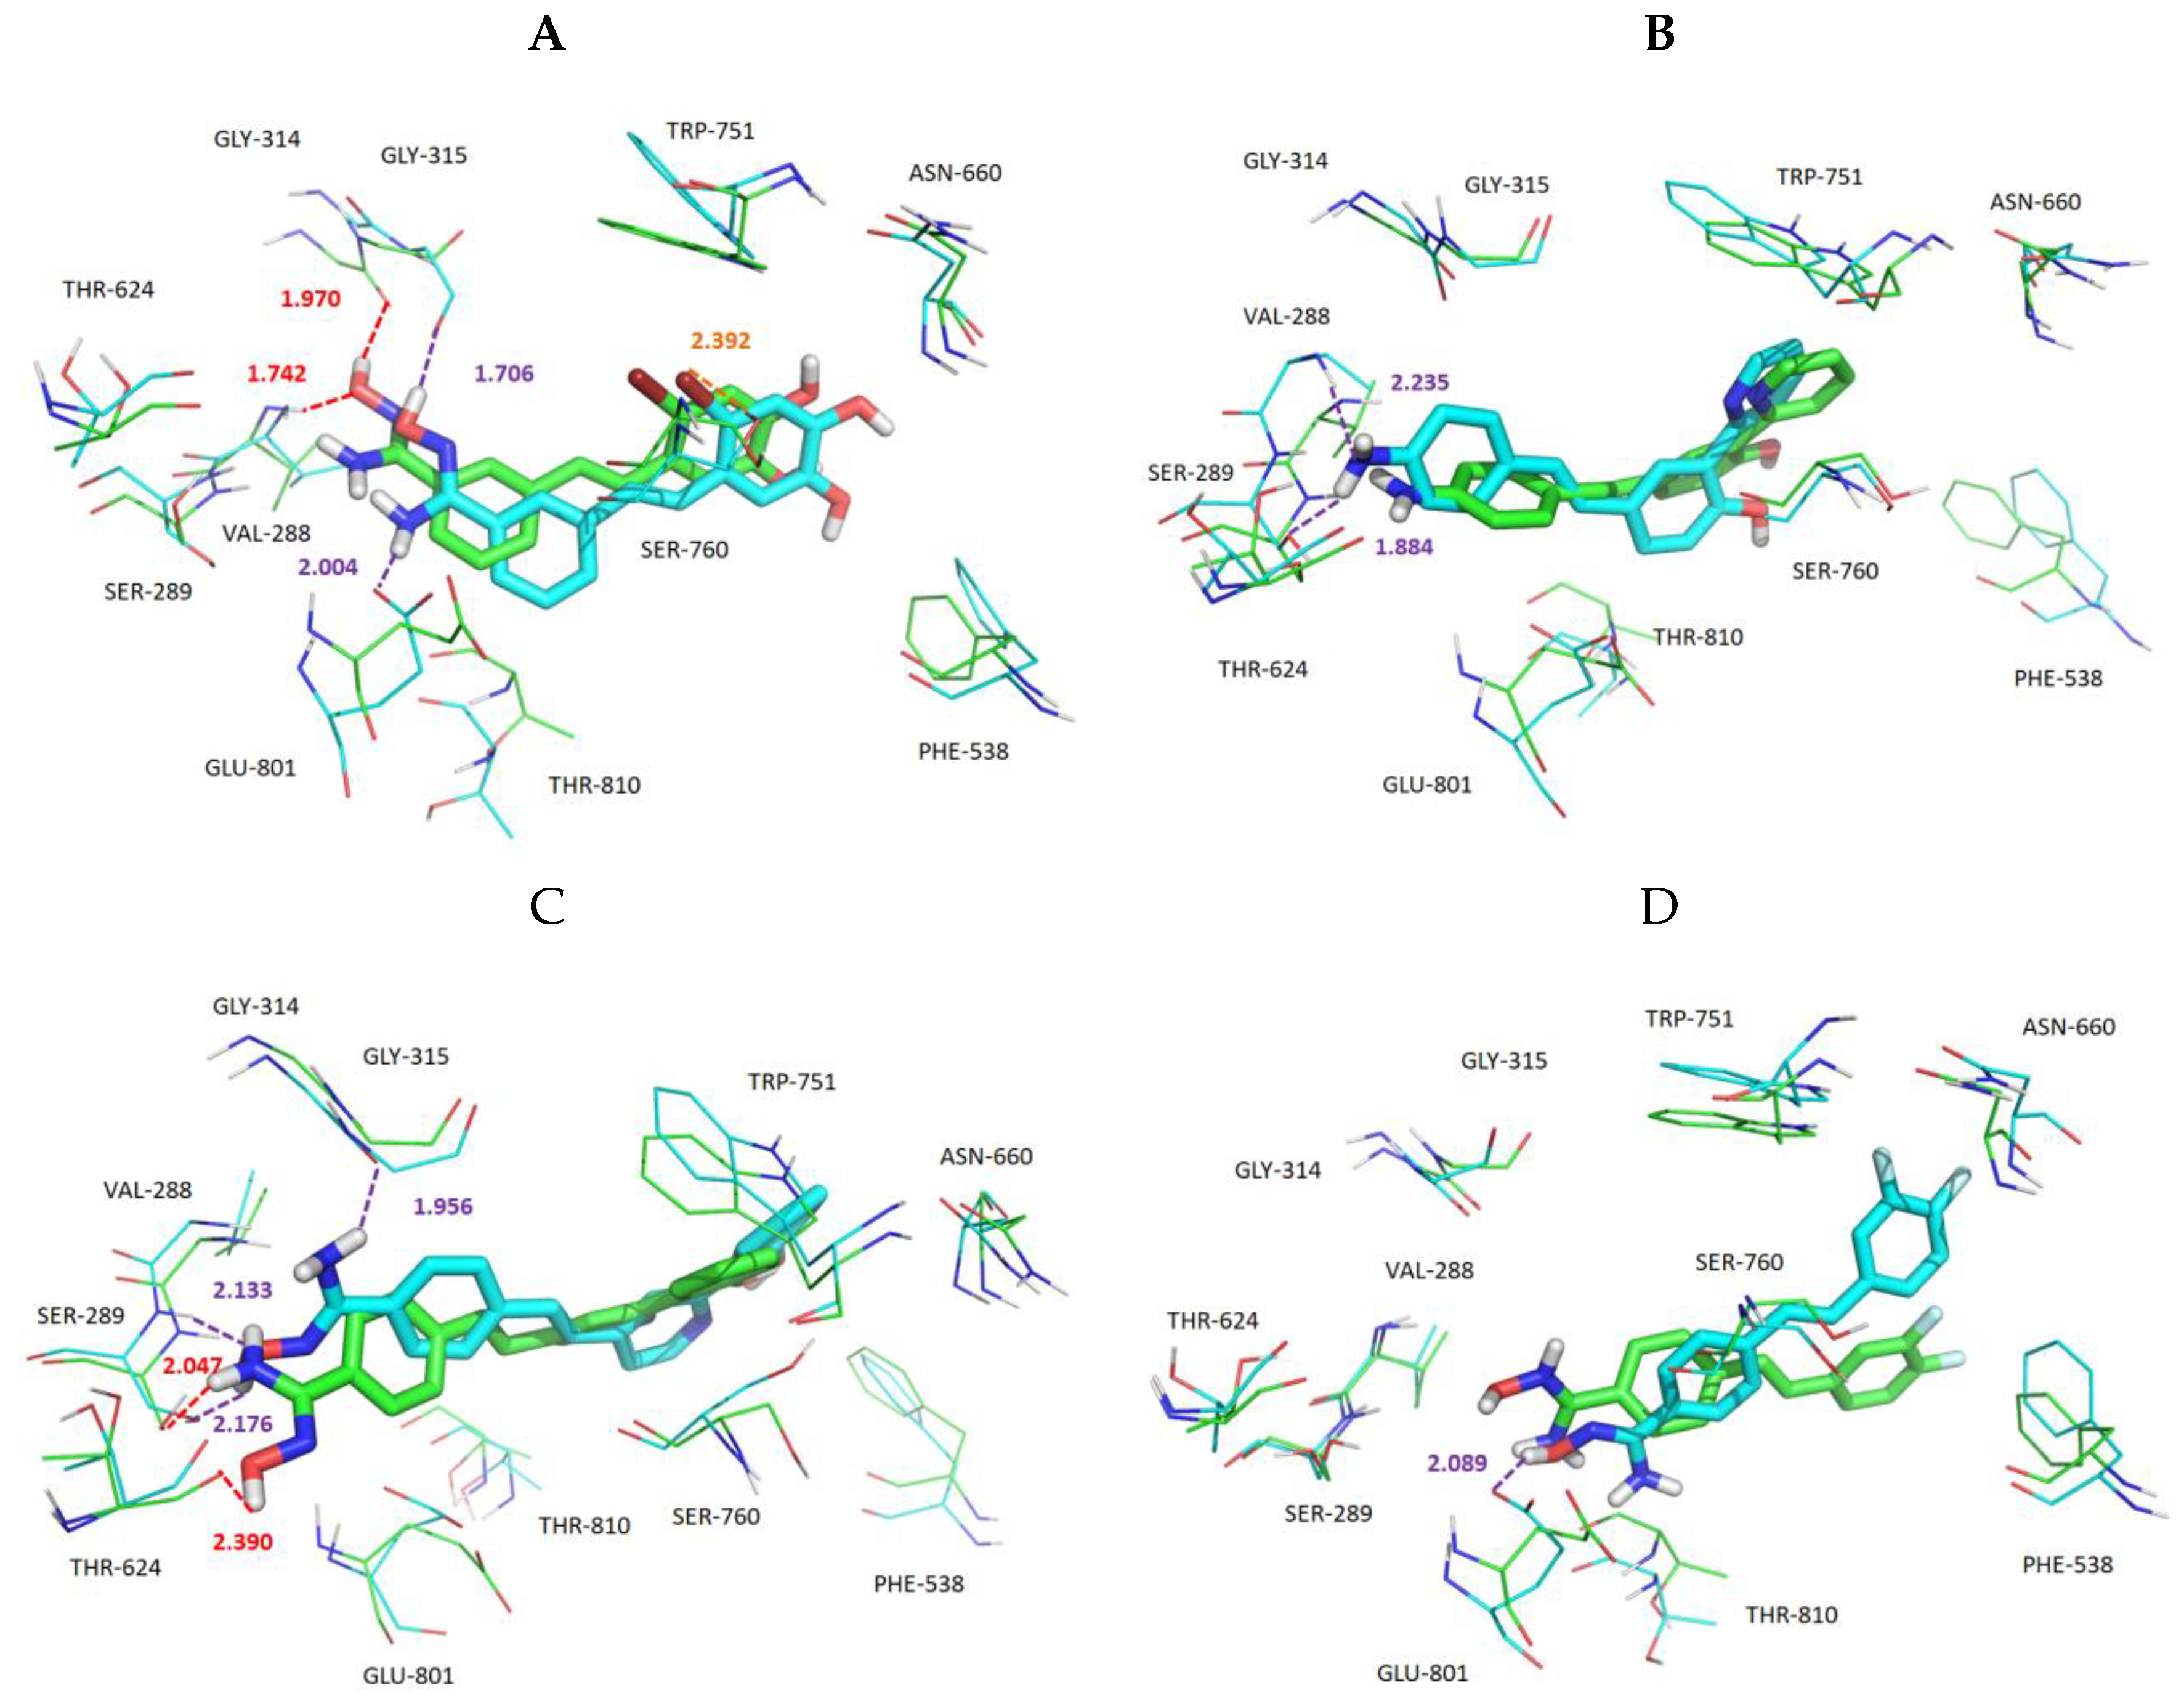
3.5. Exploration of Binding Mode
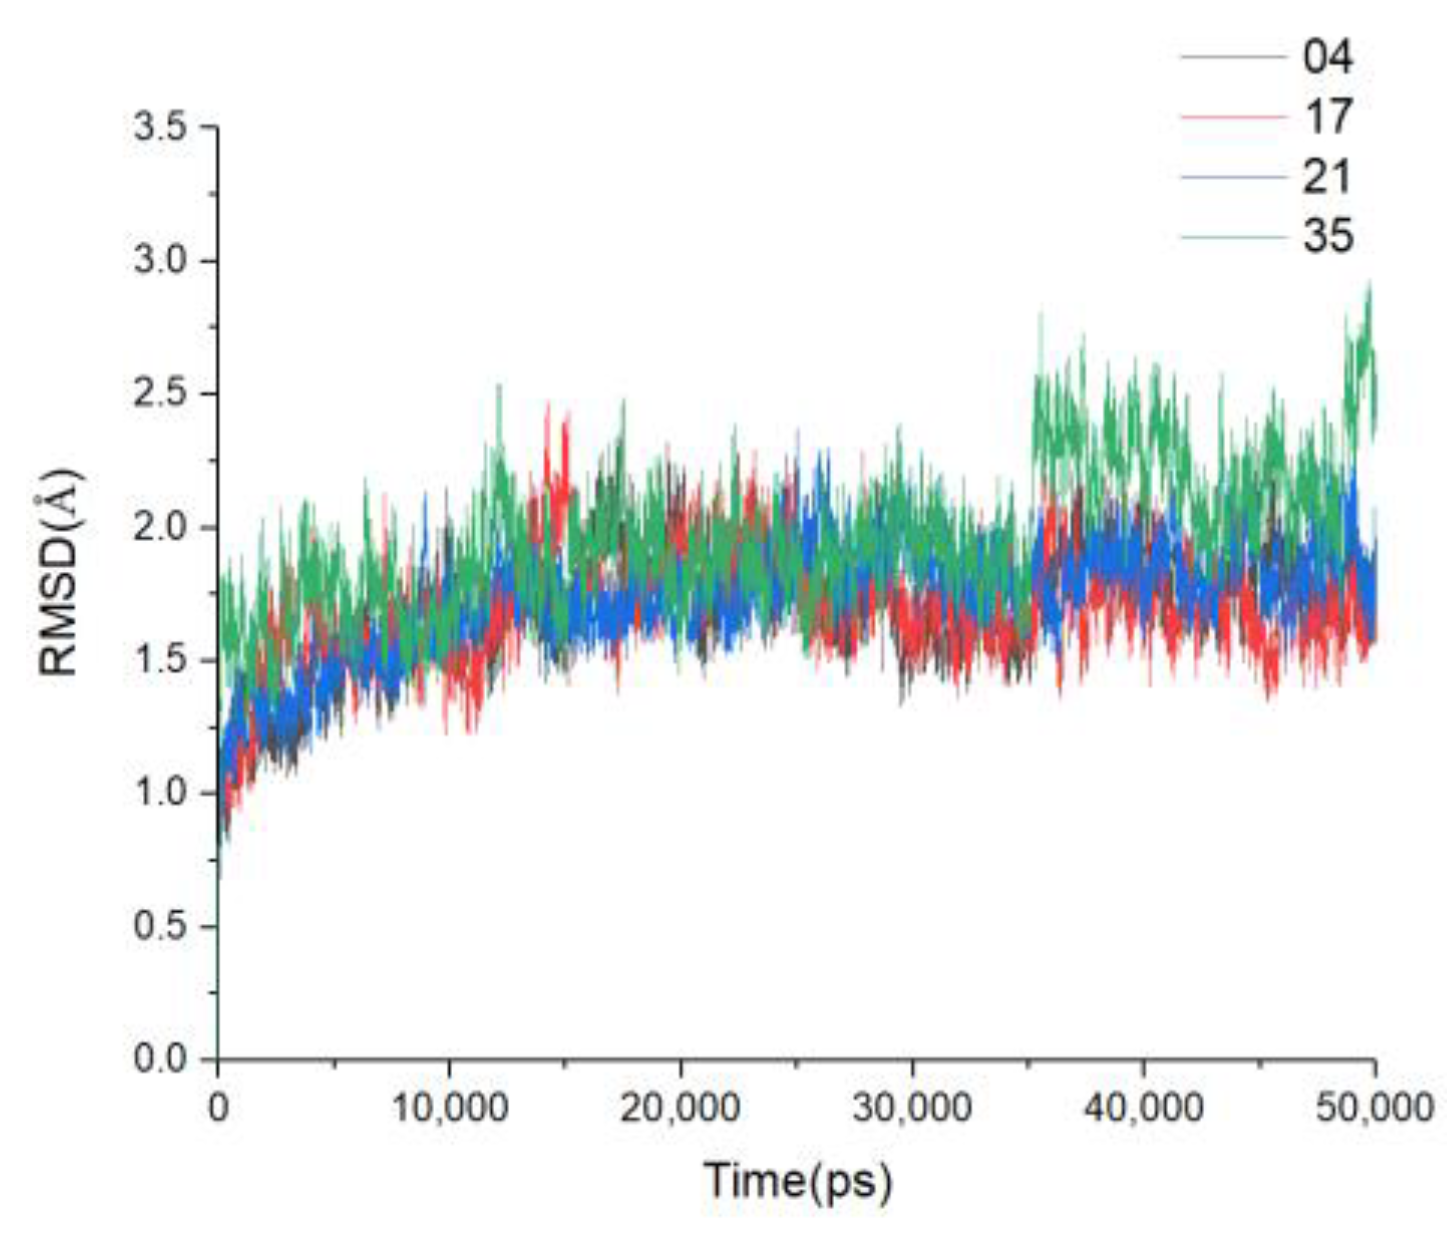
3.6. MD Simulations and Binding Free Energy Calculation
4. Conclusions
Supplementary Materials
Author Contributions
Funding
Acknowledgments
Conflicts of Interest
References
- Cole, P.A. Chemical probes for histone-modifying enzymes. Nat. Chem. Biol. 2008, 4, 590. [Google Scholar] [CrossRef] [PubMed]
- Shi, Y.; Wu, Y.R.; Su, M.B.; Shen, D.H.; Gunosewoyo, H.; Yang, F.; Li, J.; Tang, J.; Zhou, Y.B.; Yu, L.F. Novel spirocyclic tranylcypromine derivatives as lysine-specific demethylase 1 (LSD1) inhibitors. Rsc Adv. 2018, 8, 1666–1676. [Google Scholar] [CrossRef]
- Shi, Y.; Lan, F.; Matson, C.; Mulligan, P.; Whetstine, J.R.; Cole, P.A.; Casero, R.A.; Shi, Y. Histone demethylation mediated by the nuclear amine oxidase homolog LSD1. Cell 2004, 119, 941–953. [Google Scholar] [CrossRef] [PubMed]
- Wang, J.; Hevi, S.; Kurash, J.K.; Lei, H.; Gay, F.; Bajko, J.; Su, H.; Sun, W.; Chang, H.; Xu, G. The lysine demethylase LSD1 (KDM1) is required for maintenance of global DNA methylation. Nat. Genet. 2009, 41, 125–129. [Google Scholar] [CrossRef] [PubMed]
- Lee, M.G.; Wynder, C.; Cooch, N.; Shiekhattar, R. An essential role for CoREST in nucleosomal histone 3 lysine 4 demethylation. Nature 2005, 437, 432–435. [Google Scholar] [CrossRef]
- Garciabassets, I.; Kwon, Y.S.; Telese, F.; Prefontaine, G.G.; Hutt, K.R.; Cheng, C.S.; Ju, B.G.; Ohgi, K.A.; Wang, J.; Escoubetlozach, L. Histone methylation-dependent mechanisms impose ligand dependency for gene activation by nuclear receptors. Cell 2007, 128, 505–518. [Google Scholar] [CrossRef]
- Huang, J.; Sengupta, R.; Espejo, A.B.; Lee, M.G.; Dorsey, J.A.; Richter, M.; Opravil, S.; Shiekhattar, R.; Bedford, M.T.; Jenuwein, T. p53 is regulated by the lysine demethylase LSD1. Nature 2007, 449, 105–108. [Google Scholar] [CrossRef]
- Jing, W.; Sarah, H.; Kurash, J.K.; Hong, L.; Frédérique, G.; Jeffrey, B.; Hui, S.; Weitao, S.; Hua, C.; Guoliang, X. The lysine demethylase LSD1 (KDM1) is required for maintenance of global DNA methylation. Nat. Genet. 2009, 41, 125–129. [Google Scholar]
- Qidong, H.; Young-Soo, K.; Esperanza, N.; Maria Dafne, C.; Hutt, K.R.; Ohgi, K.A.; Ivan, G.B.; Rose, D.W.; Glass, C.K.; Rosenfeld, M.G. Enhancing nuclear receptor-induced transcription requires nuclear motor and LSD1-dependent gene networking in interchromatin granules. Cell 2008, 105, 19199–19204. [Google Scholar]
- Shi, Y.J.; Matson, C.; Lan, F.; Iwase, S.; Baba, T.; Shi, Y. Regulation of LSD1 histone demethylase activity by its associated factors. Mol. Cell 2005, 19, 857. [Google Scholar] [CrossRef]
- Yokoyama, A.; Takezawa, S.; Schüle, R.; Kitagawa, H.; Kato, S. Transrepressive function of TLX requires the histone demethylase LSD1. Mol. Cell. Biol. 2008, 28, 3995–4003. [Google Scholar] [CrossRef] [PubMed]
- Lv, T.; Yuan, D.; Miao, X.; Lv, Y.; Zhan, P.; Shen, X.; Song, Y. Over-expression of LSD1 promotes proliferation, migration and invasion in non-small cell lung cancer. Plos One 2012, 7, e35065. [Google Scholar] [CrossRef] [PubMed]
- Wissmann, M.; Yin, N.; Müller, J.M.; Greschik, H.; Fodor, B.D.; Jenuwein, T.; Vogler, C.; Schneider, R.; Günther, T.; Buettner, R. Cooperative demethylation by JMJD2C and LSD1 promotes androgen receptor-dependent gene expression. Nat. Cell Biol. 2007, 9, 347–353. [Google Scholar] [CrossRef] [PubMed]
- Hayami, S.; Kelly, J.D.; Cho, H.S.; Yoshimatsu, M.; Unoki, M.; Tsunoda, T.; Field, H.I.; Neal, D.E.; Yamaue, H.; Ponder, B.A. Overexpression of LSD1 contributes to human carcinogenesis through chromatin regulation in various cancers. Int. J. Cancer J. Int. Du Cancer 2015, 128, 574–586. [Google Scholar] [CrossRef] [PubMed]
- Wang, Y.; Zhang, H.; Chen, Y.; Sun, Y.; Yang, F.; Yu, W.; Liang, J.; Sun, L.; Yang, X.; Shi, L. LSD1 is a subunit of the NuRD complex and targets the metastasis programs in breast cancer. Cell 2009, 138, 660–672. [Google Scholar] [CrossRef] [PubMed]
- Harris, W.J.; Huang, X.; Lynch, J.T.; Spencer, G.J.; Hitchin, J.R.; Li, Y.; Ciceri, F.; Blaser, J.G.; Greystoke, B.F.; Jordan, A.M. The histone demethylase KDM1A sustains the oncogenic potential of MLL-AF9 leukemia stem cells. Cancer Cell 2012, 21, 473–487. [Google Scholar] [CrossRef] [PubMed]
- Schmidt, D.M.Z.; Mccafferty, D.G. trans-2-Phenylcyclopropylamine is a mechanism-based inactivator of the histone demethylase LSD1. Biochemistry 2007, 46, 4408–4416. [Google Scholar] [CrossRef]
- Mohammad, H.; Smitheman, K.; Aller, G.V.; Cusan, M.; Kamat, S.; Liu, Y.; Johnson, N.; Hann, C.; Armstrong, S.; Kruger, R. 212 Novel anti-tumor activity of targeted LSD1 inhibition by GSK2879552. Eur. J. Cancer 2014, 50, 72. [Google Scholar] [CrossRef]
- Maes, T.; Mascaró, C.; Tirapu, I.; Estiarte, A.; Ciceri, F.; Lunardi, S.; Guibourt, N.; Perdones, A.; Lufino, M.; Somervaille, T. ORY-1001, a Potent and selective covalent KDM1A inhibitor, for the treatment of acute leukemia. Cancer Cell 2018, 33, S1535610818300230. [Google Scholar] [CrossRef]
- Wu, F.; Zhou, C.; Yao, Y.; Wei, L.; Feng, Z.; Deng, L.; Song, Y. 3-(Piperidin-4-ylmethoxy)pyridine containing compounds are potent inhibitors of lysine specific demethylase 1. J. Med. Chem. 2016, 59, 253–263. [Google Scholar] [CrossRef]
- Vianello, P.; Sartori, L.; Amigoni, F.; Cappa, A.; Fagá, G.; Fattori, R.; Legnaghi, E.; Ciossani, G.; Mattevi, A.; Meroni, G. Thieno [3,2-b]pyrrole-5-carboxamides as new reversible inhibitors of histone lysine demethylase KDM1A/LSD1. Part 2: Structure-based drug design and structure–activity relationship. J. Med. Chem. 2017, 60, 1693. [Google Scholar] [CrossRef] [PubMed]
- Duan, Y.C.; Guan, Y.Y.; Zhai, X.Y.; Ding, L.N.; Qin, W.P.; Shen, D.D.; Liu, X.Q.; Sun, X.D.; Zheng, Y.C.; Liu, H.M. Discovery of resveratrol derivatives as novel LSD1 inhibitors: Design, synthesis and their biological evaluation. Eur. J. Med. Chem. 2017, 126, 246–258. [Google Scholar] [CrossRef] [PubMed]
- Duan, Y.; Qin, W.; Suo, F.; Zhai, X.; Guan, Y.; Wang, X.; Zheng, Y.; Liu, H. Design, synthesis and in vitro evaluation of stilbene derivatives as novel LSD1 inhibitors for AML therapy. Bioorganic Med.Chem. 2018, 26, 6000–60147. [Google Scholar] [CrossRef] [PubMed]
- Ouyang, S.; Lu, J.; Kong, X.; Liang, Z.; Luo, C.; Jiang, H. Computational drug discovery. Acta Pharmacol. Sin. 2012, 33, 1131–1140. [Google Scholar] [CrossRef] [PubMed]
- Jitender Verma, V.M.K.; Coutinho, E.C. 3D-QSAR in drug design—A review. Curr. Top. Med. Chem. 2010, 10. [Google Scholar]
- Cerqueira, N.; Bras, N.; Ramos, M. MADAMM: A multistaged docking with an automated molecular modeling protocol. Proteins-Struct. Funct. Bioinform. 2010, 74, 192–206. [Google Scholar] [CrossRef]
- Mortier, J.; Rakers, C.; Bermudez, M.; Murgueitio, M.S.; Riniker, S.; Wolber, G. The impact of molecular dynamics on drug design: Applications for the characterization of ligand–macromolecule complexes. Drug Discov. Today 2015, 20, 686–702. [Google Scholar] [CrossRef]
- Ping, P.Q.; Shuai, W.; Kai, R.F.; Yu, J.R. Molecular modeling studies of 1,2,4-triazine derivatives as novel h-DAAO inhibitors by 3D-QSAR, docking and dynamics simulations. Rsc Adv. 2018, 8, 14311–14327. [Google Scholar]
- Wang, Z.Z.; Ma, C.Y.; Yang, J.; Gao, Q.B.; Liu, H.M. Investigating the binding mechanism of (4-Cyanophenyl)glycine derivatives as reversible LSD1 by 3D-QSAR, molecular docking and molecular dynamics simulations. J. Mol. Struct. 2018, 1175, 698–707. [Google Scholar] [CrossRef]
- Balasubramanian, P.K.; Balupuri, A.; Gadhe, C.G.; Cho, S.J. 3D QSAR modeling study on 7-aminofuro [2,3-c] pyridine derivatives as TAK1 inhibitors using CoMFA and COMSIA. Med. Chem. Res. 2015, 24, 2347–2365. [Google Scholar] [CrossRef]
- Clark, M.; Iii, R.D.C.; Opdenbosch, N.V. Validation of the general purpose tripos 5.2 force field. J. Comput. Chem. 2010, 10, 982–1012. [Google Scholar] [CrossRef]
- Viviana, C.; Davide, B.; Roberto, T. Comments on the definition of the Q2 parameter for QSAR validation. J. Chem. Inf. Modeling 2009, 49, 1669–1678. [Google Scholar]
- Kunal, R.; Pratim, C.; Indrani, M.; Probir Kumar, O.; Supratik, K.; Rudra Narayan, D. Some case studies on application of “r(m)2” metrics for judging quality of quantitative structure–activity relationship predictions: Emphasis on scaling of response data. J. Comput. Chem. 2013, 34, 1071–1082. [Google Scholar]
- Rucker, C.; Rucker, G.; Meringer, M. y-Randomization and its variants in QSPR/QSAR. J. Chem. Inf. Modeling 2007, 47, 2345–2357. [Google Scholar] [CrossRef] [PubMed]
- Vilar, S.; Cozza, G.S. Medicinal chemistry and the molecular operating environment (MOE): Application of QSAR and molecular docking to drug discovery. Curr. Top. Med. Chem. 2008, 8, 1555–1572. [Google Scholar] [CrossRef]
- Laskowski, R.A.; Macarthur, M.W.; Moss, D.S.; Thornton, J.M. PROCHECK: A program to check the stereochemical quality of protein structures. J. Appl. Crystallogr. 1993, 26, 283–291. [Google Scholar] [CrossRef]
- Eisenberg, D.; Lüthy, R.; Bowie, J.U. [20] VERIFY3D: Assessment of protein models with three-dimensional profiles. Nature 1992, 356, 83–85. [Google Scholar]
- Hasan, M.A.; Khan, M.A.; Datta, A.; Mazumder, M.H.; Hossain, M.U. A comprehensive immunoinformatics and target site study revealed the corner-stone toward Chikungunya virus treatment. Mol. Immunol. 2015, 65, 189–204. [Google Scholar] [CrossRef]
- Case, D.A.B.V.; Berryman, J.; Betz, R.; Cai, Q.; Cerutti, D.; Cheatham Iii, T.; Darden, T.; Duke, R.; Gohlke, H. Amber 14. 2014. [Google Scholar]
- Hou, T.; Wang, J.; Li, Y.; Wang, W. Assessing the performance of the MM/PBSA and MM/GBSA methods. 1. The accuracy of binding free energy calculations based on molecular dynamics simulations. J. Chem. Inf. Modeling 2011, 51, 69–82. [Google Scholar] [CrossRef]
- Julio, C.; Michael, F.; Mario, S.; González-Nilo, F.D. 2D Autocorrelation, CoMFA, and CoMSIA modeling of protein tyrosine kinases’ inhibition by substituted pyrido[2,3-d]pyrimidine derivatives. Bioorganic Med. Chem. 2008, 16, 810–821. [Google Scholar]
- Tropsha, A. Best practices for qsar model development, validation, and exploitation. Mol. Inform. 2010, 29, 476–488. [Google Scholar] [CrossRef] [PubMed]
- Dariusz, P.; Micha, A.N.; Rafa, A.; Krzysztof, G. Can we trust docking results? Evaluation of seven commonly used programs on PDBbind database. J. Comput. Chem. 2011, 32, 742–755. [Google Scholar]
- Fukunishi, Y.; Nakamura, H. Prediction of ligand-binding sites of proteins by molecular docking calculation for a random ligand library. Protein Sci. 2011, 20, 95–106. [Google Scholar] [CrossRef] [PubMed]
- Greenidge, P.A.; Christian, K.; Jean-Christophe, M.; Wolf, R.M. MM/GBSA binding energy prediction on the PDBbind data set: Successes, failures, and directions for further improvement. J. Chem. Inf. Modeling 2013, 53, 201–209. [Google Scholar] [CrossRef]
Sample Availability: Samples of all compounds involved in this paper are available from the authors. |


| No. | X1 | R1 | R2 | R3 | R4 | R5 | R6 | IC50 (μM) | pIC50 | CoMFA | CoMSIA | Binding Mode | ||
| pred | res | pred | res | |||||||||||
| 1 * | C | OH | OH | H | H |  | H | 0.333 | 6.478 | 6.315 | 0.163 | 6.497 | −0.019 | I |
| 2 * | C | F | OH | H | H | | H | 0.245 | 6.611 | 6.490 | 0.121 | 6.289 | 0.322 | I |
| 3 | C | OH | H | OH | H | | H | 2.59 | 5.587 | 5.658 | −0.071 | 5.831 | −0.244 | I |
| 4 | C | OH | OH | H | Br | | H | 0.121 | 6.917 | 6.968 | −0.051 | 6.95 | −0.033 | I |
| 5 | C | OH | OH | H | F | | H | 0.192 | 6.717 | 6.655 | 0.062 | 6.632 | 0.085 | I |
| 6 | C | H | OH | H | H | | H | 0.210 | 6.678 | 6.512 | 0.166 | 6.299 | 0.379 | I |
| 7 * | C | OH | OH | H | H | H |  | 0.739 | 6.131 | 6.404 | −0.273 | 6.518 | −0.387 | I |
| 8 | C | F | OH | H | H | H | | 0.492 | 6.308 | 6.322 | −0.014 | 6.275 | 0.033 | I |
| 9 | C | H | OH | H | H | H | | 0.391 | 6.408 | 6.514 | −0.106 | 6.38 | 0.028 | I |
| 10 * | C | OH | OH | H | F | H | | 0.197 | 6.706 | 6.438 | 0.268 | 6.717 | −0.011 | I |
| 11 | C | OH | OH | H | Br | H | | 0.123 | 6.910 | 6.886 | 0.024 | 7.07 | −0.160 | I |
| 12 | C | OH | H | OH | H | H | OH | 10.2 | 4.991 | 4.982 | 0.009 | 4.94 | 0.051 | I |
| 13 | C |  | OH | H | H | OH | H | 4.24 | 5.373 | 5.383 | −0.010 | 5.526 | −0.153 | II |
| 14 | C | | OH | H | H | | H | 0.72 | 6.143 | 6.107 | 0.036 | 6.065 | 0.078 | II |
| 15 | C |  | OH | H | H | | H | 1.29 | 5.889 | 6.188 | −0.299 | 6.121 | −0.232 | II |
| 16 | C | | OH | H | H | H |  | 0.92 | 6.036 | 6.006 | 0.030 | 5.838 | 0.198 | II |
| 17 | C | | OH | H | H | H | NH2 | 3.57 | 5.447 | 5.432 | 0.015 | 5.557 | −0.110 | II |
| 18 | C | | OH | H | H | NH2 | H | 0.859 | 6.066 | 5.884 | 0.182 | 5.788 | 0.278 | II |
| 19 | C |  | OH | H | H | NH2 | H | 1.47 | 5.833 | 5.88 | −0.047 | 5.945 | −0.112 | II |
| 20 | N |  | - | H | H | | H | 0.364 | 6.439 | 6.382 | 0.057 | 6.622 | −0.183 | II |
| 21 | N |  | - | H | H | H | | 0.764 | 6.117 | 6.078 | 0.039 | 6.022 | 0.095 | II |
| 22 | N |  | - | H | H | | H | 0.283 | 6.548 | 6.566 | −0.018 | 6.361 | 0.187 | II |
| 23 * | N | | - | H | H | H | NH2 | 2.96 | 5.529 | 5.901 | −0.372 | 5.667 | −0.138 | II |
| 24 * | C | OMe | OMe | H | H | H |  | 4.161 | 5.381 | 5.429 | −0.048 | 5.388 | −0.007 | III |
| 25 | C | OMe | OMe | H | F | H | | 3.315 | 5.480 | 5.466 | 0.014 | 5.438 | 0.042 | III |
| 26 | C | OMe | H | OMe | H | H | | 5.185 | 5.285 | 5.288 | −0.003 | 5.176 | 0.109 | III |
| 27 * | C | OMe | OMe | H | Br | H | | 3.979 | 5.400 | 5.534 | −0.134 | 5.553 | −0.153 | III |
| 29 | C | OMe | H | OMe | H | H |  | 0.692 | 6.160 | 6.195 | −0.035 | 6.038 | 0.122 | III |
| 30 | C | OMe | OMe | H | H | H | | 0.816 | 6.088 | 6.089 | −0.001 | 6.095 | −0.007 | III |
| 31 * | C | F | H | F | H | H | | 1.298 | 5.887 | 5.875 | 0.012 | 5.837 | 0.050 | III |
| 32 | C | OMe | OMe | H | Br | H | | 0.701 | 6.154 | 6.105 | 0.049 | 6.271 | −0.117 | III |
| 34 | C | OMe | OMe | H | F | H | | 0.891 | 6.050 | 6.117 | −0.067 | 6.13 | −0.080 | III |
| 35 | C | F | F | H | H | H | | 16.21 | 4.790 | 4.812 | −0.022 | 4.825 | −0.035 | I |
| 36 | C | OH | OH | H | H | H |  | 29.58 | 4.529 | 4.513 | 0.016 | 4.531 | −0.002 | I |
| 38 | C |  | OH | H | H | OH | H | 36.09 | 4.443 | 4.464 | −0.021 | 4.405 | 0.038 | II |
| 39 | C |  | OH | H | H | -H | NH2 | 20.14 | 4.696 | 4.674 | 0.022 | 4.796 | −0.100 | II |
| 40 | C |  | - | OH | H | NH2 | H | 18.96 | 4.722 | 4.747 | −0.025 | 4.769 | −0.047 | II |
| 41 | N | | - | H | H | H | NH2 | 9.03 | 5.044 | 5.052 | −0.008 | 5.052 | −0.008 | II |
 | ||||||||||||||
| No. | IC50 (μM) | pIC50 | CoMFA | CoMSIA | Binding Mode | |||||||||
| pred | res | pred | Res | |||||||||||
| 28 | 4.666 | 5.331 | 5.304 | 0.027 | 5.395 | −0.0635 | III | |||||||
| 33 | 1.93 | 5.888 | 5.84 | 0.0482 | 5.927 | −0.0386 | III | |||||||
| 37 * | 10.36 | 4.985 | 4.657 | 0.3282 | 5.128 | −0.1426 | I | |||||||
| ONC | SEE | F Value | Contributions | ||||||||
|---|---|---|---|---|---|---|---|---|---|---|---|
| S | E | H | A | D | |||||||
| CoMFA-S | 0.547 | 2 | 0.781 | 0.77 | 0.342 | 51.718 | 1 | - | - | - | - |
| CoMFA-E | 0.33 | 9 | 0.993 | 0.692 | 0.071 | 340.959 | - | 1 | - | - | - |
| CoMFA-SE | 0.623 | 7 | 0.987 | 0.857 | 0.091 | 265.466 | 0.386 | 0.614 | - | - | - |
| CoMSIA-EHAD | 0.674 | 5 | 0.962 | 0.800 | 0.151 | 129.944 | - | 0.276 | 0.214 | 0.226 | 0.283 |
| CoMSIA-SHAD | 0.728 | 5 | 0.960 | 0.899 | 0.154 | 126.052 | 0.097 | - | 0.266 | 0.299 | 0.339 |
| CoMSIA-SEAD | 0.639 | 4 | 0.942 | 0.803 | 0.182 | 110.417 | 0.094 | 0.326 | - | 0.254 | 0.325 |
| CoMSIA-SEHD | 0.700 | 4 | 0.937 | 0.819 | 0.190 | 100.367 | 0.090 | 0.329 | 0.239 | - | 0.342 |
| CoMSIA-SEHA | 0.726 | 6 | 0.977 | 0.835 | 0.120 | 174.365 | 0.098 | 0.325 | 0.258 | 0.319 | - |
| CoMSIA-ALL | 0.704 | 4 | 0.945 | 0.820 | 0.178 | 114.875 | 0.075 | 0.262 | 0.193 | 0.206 | 0.264 |
| Condition | Parameters | Threshold Value | CoMFA | CoMSIA |
|---|---|---|---|---|
| 1 | >0.6 | 0.855 | 0.861 | |
| 2a | Close to value of R2 | 0.851 | 0.857 | |
| 2b | Close to value of R2 | 0.847 | 0.755 | |
| 3a | 0.85 < k < 1.15 | 1.001 | 0.983 | |
| 3b | 0.85 < k` < 1.15 | 0.998 | 1.010 | |
| 4a | <0.1 | 0.005 | 0.005 | |
| 4b | <0.1 | 0.009 | 0.123 | |
| 5 | <0.3 | 0.004 | 0.102 | |
| 6 | >0.5 | 0.799 | 0.804 |
| CoMFA | CoMSIA | |||
|---|---|---|---|---|
| Iteration | ||||
| Random_1 | 0.040 | 0.436 | −0.052 | 0.466 |
| Random_2 | 0.158 | 0.49 | −0.003 | 0.435 |
| Random_3 | 0.258 | 0.475 | 0.163 | 0.419 |
| Random_4 | 0.086 | 0.401 | 0.071 | 0.35 |
| Random_5 | −0.113 | 0.484 | −0.227 | 0.465 |
| Random_6 | 0.262 | 0.484 | 0.317 | 0.505 |
| Random_7 | 0.003 | 0.364 | 0.093 | 0.459 |
| Random_8 | −0.206 | 0.459 | −0.271 | 0.497 |
| Random_9 | −0.131 | 0.423 | −0.178 | 0.377 |
| Random_10 | −0.425 | 0.382 | −0.627 | 0.454 |
| Glide Top 5 | FAD | Substrate | ||
| 04 | 22 | 04 | 22 | |
| 1 | −9.132 | −11.070 | −6.364 | −6.514 |
| 2 | −9.108 | −9.503 | −5.691 | −6.406 |
| 3 | −8.967 | −9.125 | −5.459 | −6.249 |
| 4 | −8.775 | −9.102 | −5.389 | −6.234 |
| 5 | −8.724 | −9.037 | −5.315 | −6.233 |
| MOE2015 Top 5 | FAD | Substrate | ||
| 04 | 22 | 04 | 22 | |
| 1 | −7.738 | −9.143 | −5.481 | −6.224 |
| 2 | −7.680 | −8.922 | −5.475 | −6.040 |
| 3 | −7.611 | −8.905 | −5.434 | −5.898 |
| 4 | −7.571 | −8.894 | −5.341 | −5.856 |
| 5 | −7.547 | −8.704 | −5.259 | −5.844 |
| No. | Type A | Type B | Best Score |
|---|---|---|---|
| 1 | 3 | 7 | B −9.220 |
| 2 | 2 | 8 | A −9.400 |
| 3 | 2 | 8 | B −9.658 |
| 4 | 7 | 3 | A −9.454 |
| 5 | 4 | 6 | A −9.490 |
| 6 | 6 | 4 | A −9.093 |
| 7 | 6 | 4 | B −9.237 |
| 8 | 6 | 4 | B −9.137 |
| 9 | 6 | 4 | B −8.444 |
| 10 | 6 | 4 | B −9.333 |
| 11 | 9 | 1 | A −9.093 |
| 12 | 4 | 5 | B −9.173 |
| 13 | 10 | 0 | A −9.995 |
| 14 | 9 | 1 | A −10.978 |
| 15 | 8 | 2 | A −10.873 |
| 16 | 10 | 0 | A −10.325 |
| 17 | 10 | 0 | A −9.473 |
| 18 | 4 | 6 | A −9.370 |
| 19 | 2 | 8 | B −9.784 |
| 20 | 8 | 0 | A −11.204 |
| 21 | 10 | 0 | A −10.870 |
| 22 | 7 | 3 | A −11.07 |
| 23 | 9 | 0 | A −9.919 |
| 24 | 10 | 0 | A −9.153 |
| 25 | 10 | 0 | A −10.109 |
| 26 | 10 | 0 | A −9.887 |
| 27 | 10 | 0 | A −9.427 |
| 28 | 10 | 0 | A −9.223 |
| 29 | 10 | 0 | A −9.147 |
| 30 | 10 | 0 | A −9.538 |
| 31 | 9 | 1 | A −8.953 |
| 32 | 10 | 0 | A −9.461 |
| 33 | 9 | 1 | A −9.628 |
| 34 | 10 | 0 | A −9.741 |
| 35 | 10 | 0 | A −8.568 |
| 36 | 5 | 5 | B −8.977 |
| 37 | 10 | 0 | A −9.563 |
| 38 | 10 | 0 | A −9.709 |
| 39 | 1 | 9 | B −9.164 |
| 40 | 5 | 5 | B −8.675 |
| 41 | 10 | 0 | A −9.281 |
| No. | ΔEele kcal mol−1 | ΔEvdw kcal mol−1 | ΔGGB kcal mol−1 | ΔGSA kcal mol−1 | ΔGsol kcal mol−1 | ΔGbind kcal mol−1 | pIC50 |
|---|---|---|---|---|---|---|---|
| LSD1-04 | −28.5803 | −51.8392 | 45.2379 | −6.0145 | 39.2235 | −41.1960 | 6.917 |
| LSD1-17 | −14.5346 | −45.4670 | 34.5108 | −5.5613 | 28.9496 | −31.0520 | 5.447 |
| LSD1-21 | −16.5911 | −50.1944 | 37.4930 | −6.2235 | 31.2696 | −35.5160 | 6.117 |
| LSD1-35 | −15.5150 | −38.2128 | 30.7264 | −5.0611 | 25.6653 | −28.0625 | 4.790 |
© 2019 by the authors. Licensee MDPI, Basel, Switzerland. This article is an open access article distributed under the terms and conditions of the Creative Commons Attribution (CC BY) license (http://creativecommons.org/licenses/by/4.0/).
Share and Cite
Xu, Y.; He, Z.; Yang, M.; Gao, Y.; Jin, L.; Wang, M.; Zheng, Y.; Lu, X.; Zhang, S.; Wang, C.; et al. Investigating the Binding Mode of Reversible LSD1 Inhibitors Derived from Stilbene Derivatives by 3D-QSAR, Molecular Docking, and Molecular Dynamics Simulation. Molecules 2019, 24, 4479. https://doi.org/10.3390/molecules24244479
Xu Y, He Z, Yang M, Gao Y, Jin L, Wang M, Zheng Y, Lu X, Zhang S, Wang C, et al. Investigating the Binding Mode of Reversible LSD1 Inhibitors Derived from Stilbene Derivatives by 3D-QSAR, Molecular Docking, and Molecular Dynamics Simulation. Molecules. 2019; 24(24):4479. https://doi.org/10.3390/molecules24244479
Chicago/Turabian StyleXu, Yongtao, Zihao He, Min Yang, Yunlong Gao, Linfeng Jin, Meiting Wang, Yichao Zheng, Xiaoyuan Lu, Songjie Zhang, Chang Wang, and et al. 2019. "Investigating the Binding Mode of Reversible LSD1 Inhibitors Derived from Stilbene Derivatives by 3D-QSAR, Molecular Docking, and Molecular Dynamics Simulation" Molecules 24, no. 24: 4479. https://doi.org/10.3390/molecules24244479
APA StyleXu, Y., He, Z., Yang, M., Gao, Y., Jin, L., Wang, M., Zheng, Y., Lu, X., Zhang, S., Wang, C., Zhao, Z., Zhao, J., Gao, Q., & Duan, Y. (2019). Investigating the Binding Mode of Reversible LSD1 Inhibitors Derived from Stilbene Derivatives by 3D-QSAR, Molecular Docking, and Molecular Dynamics Simulation. Molecules, 24(24), 4479. https://doi.org/10.3390/molecules24244479