Simultaneous Determination of Etomidate and Its Major Metabolite, Etomidate Acid, in Urine Using Dilute and Shoot Liquid Chromatography–Tandem Mass Spectrometry


Abstract
:
1. Introduction
2. Results and Discussion
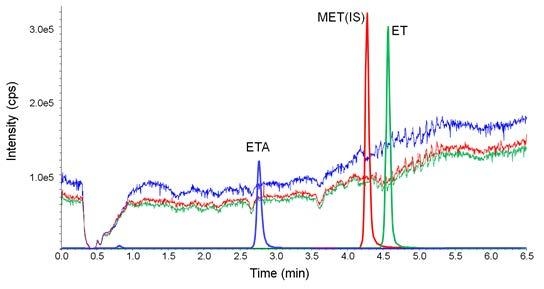
2.1. Separation Condition
2.1.1. Column Selection
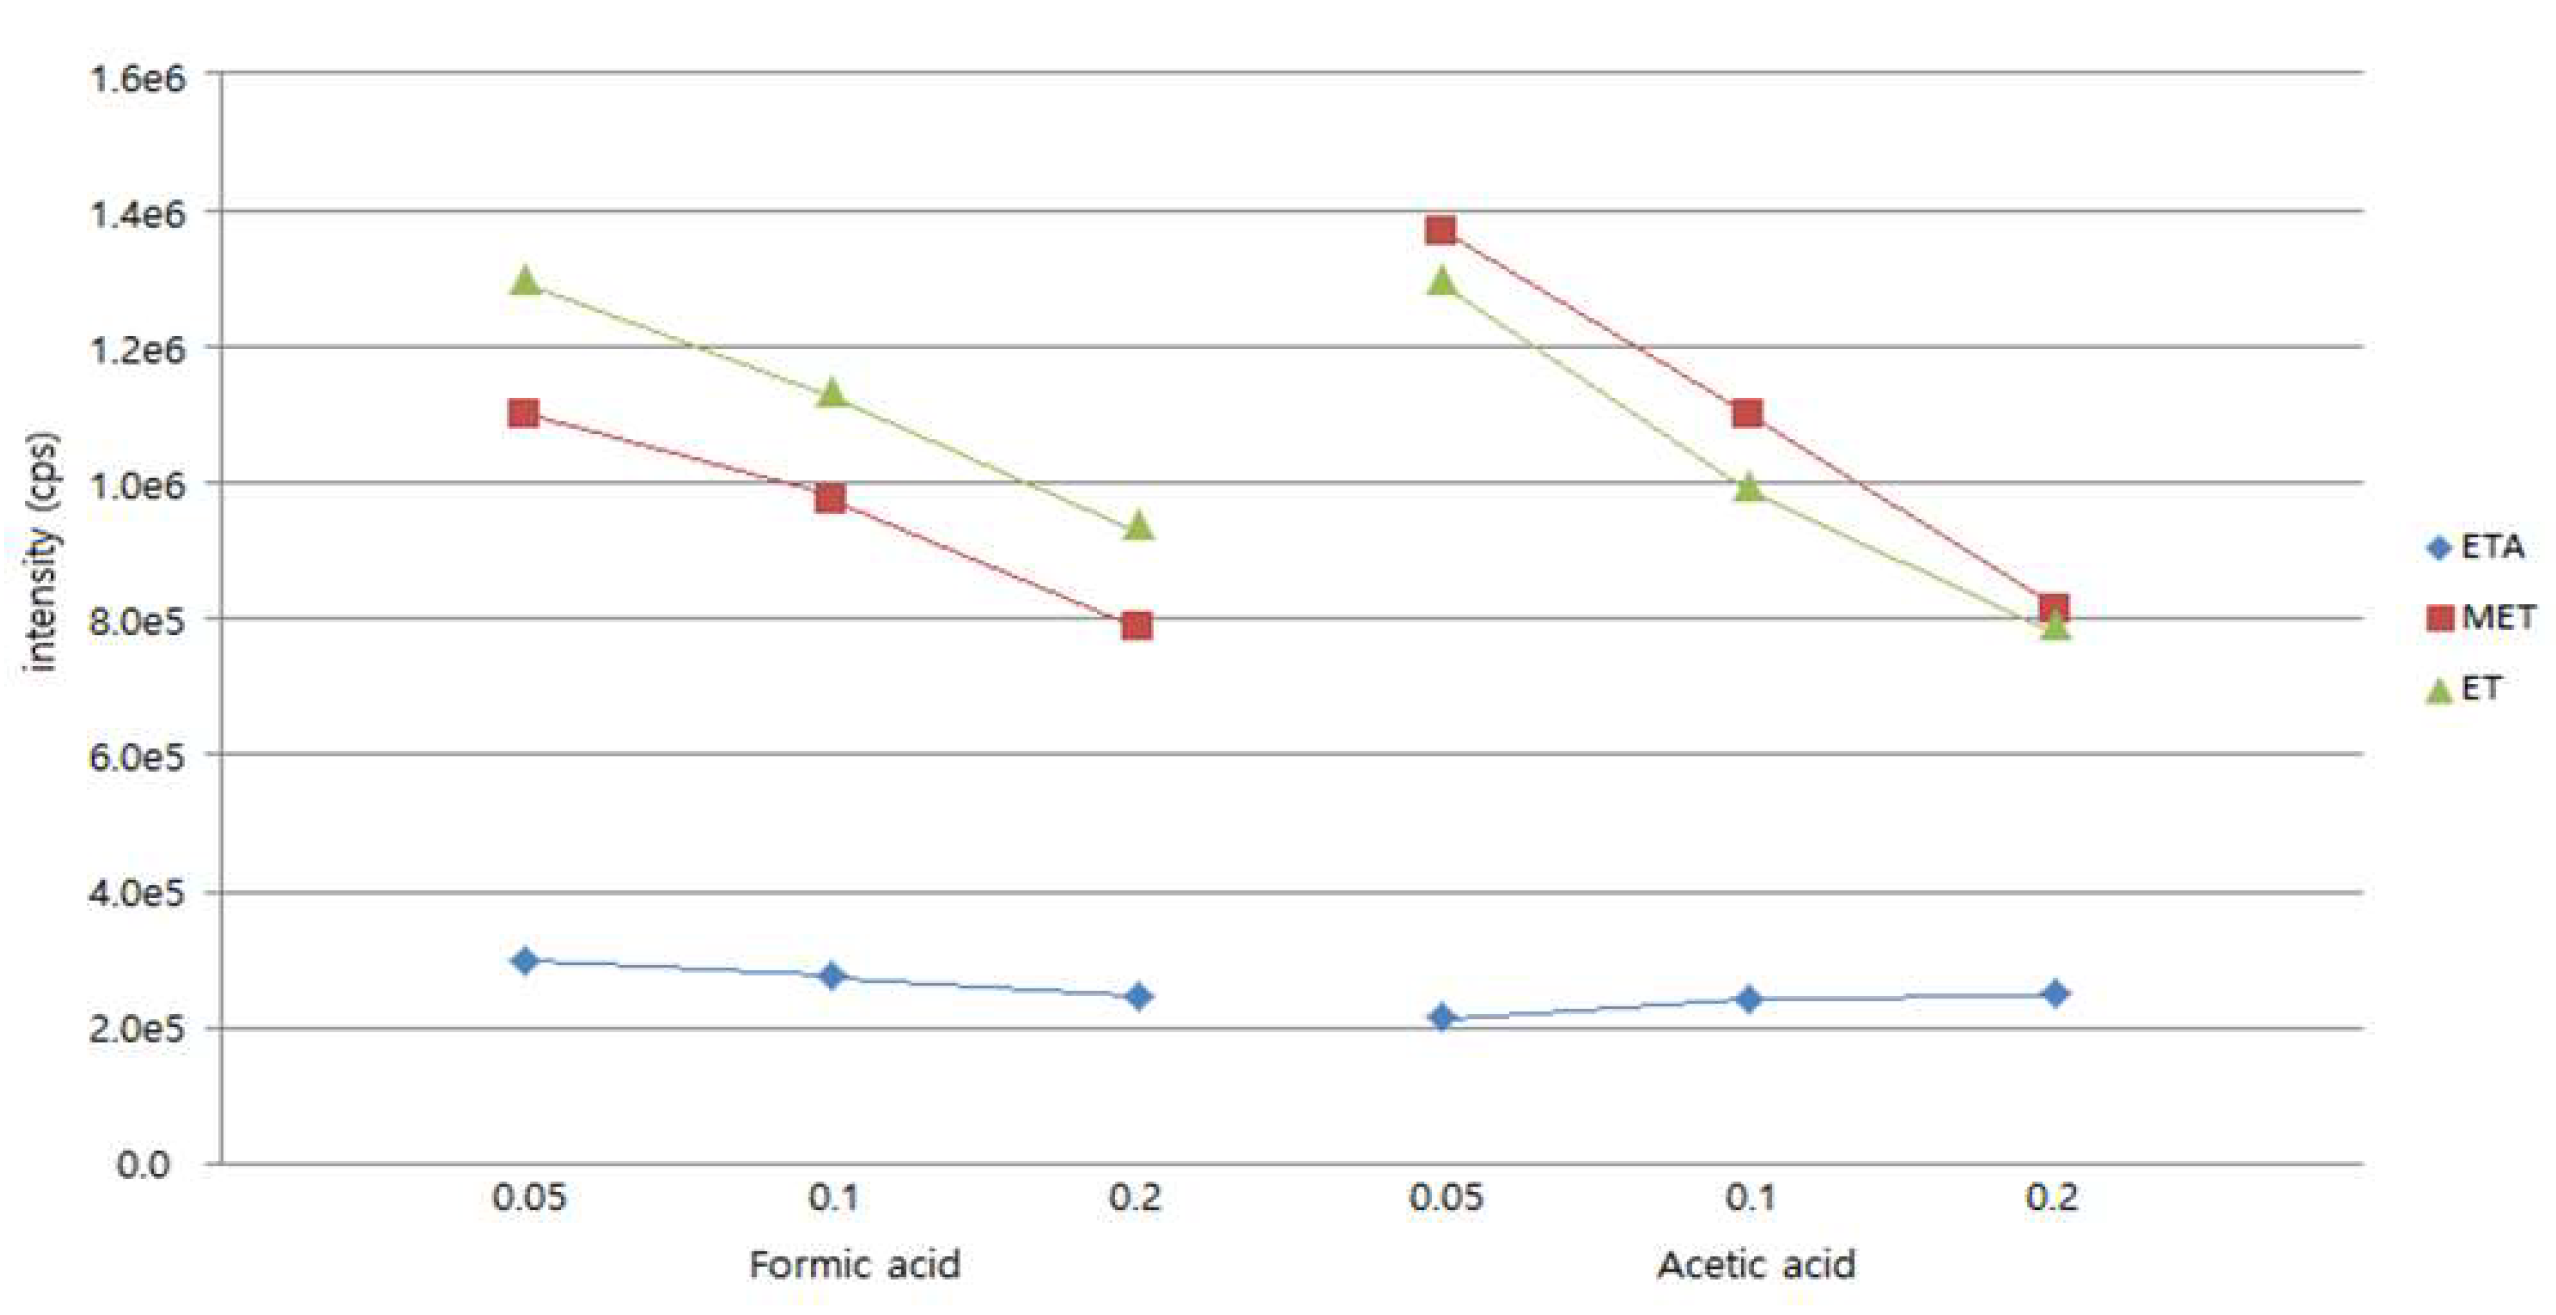
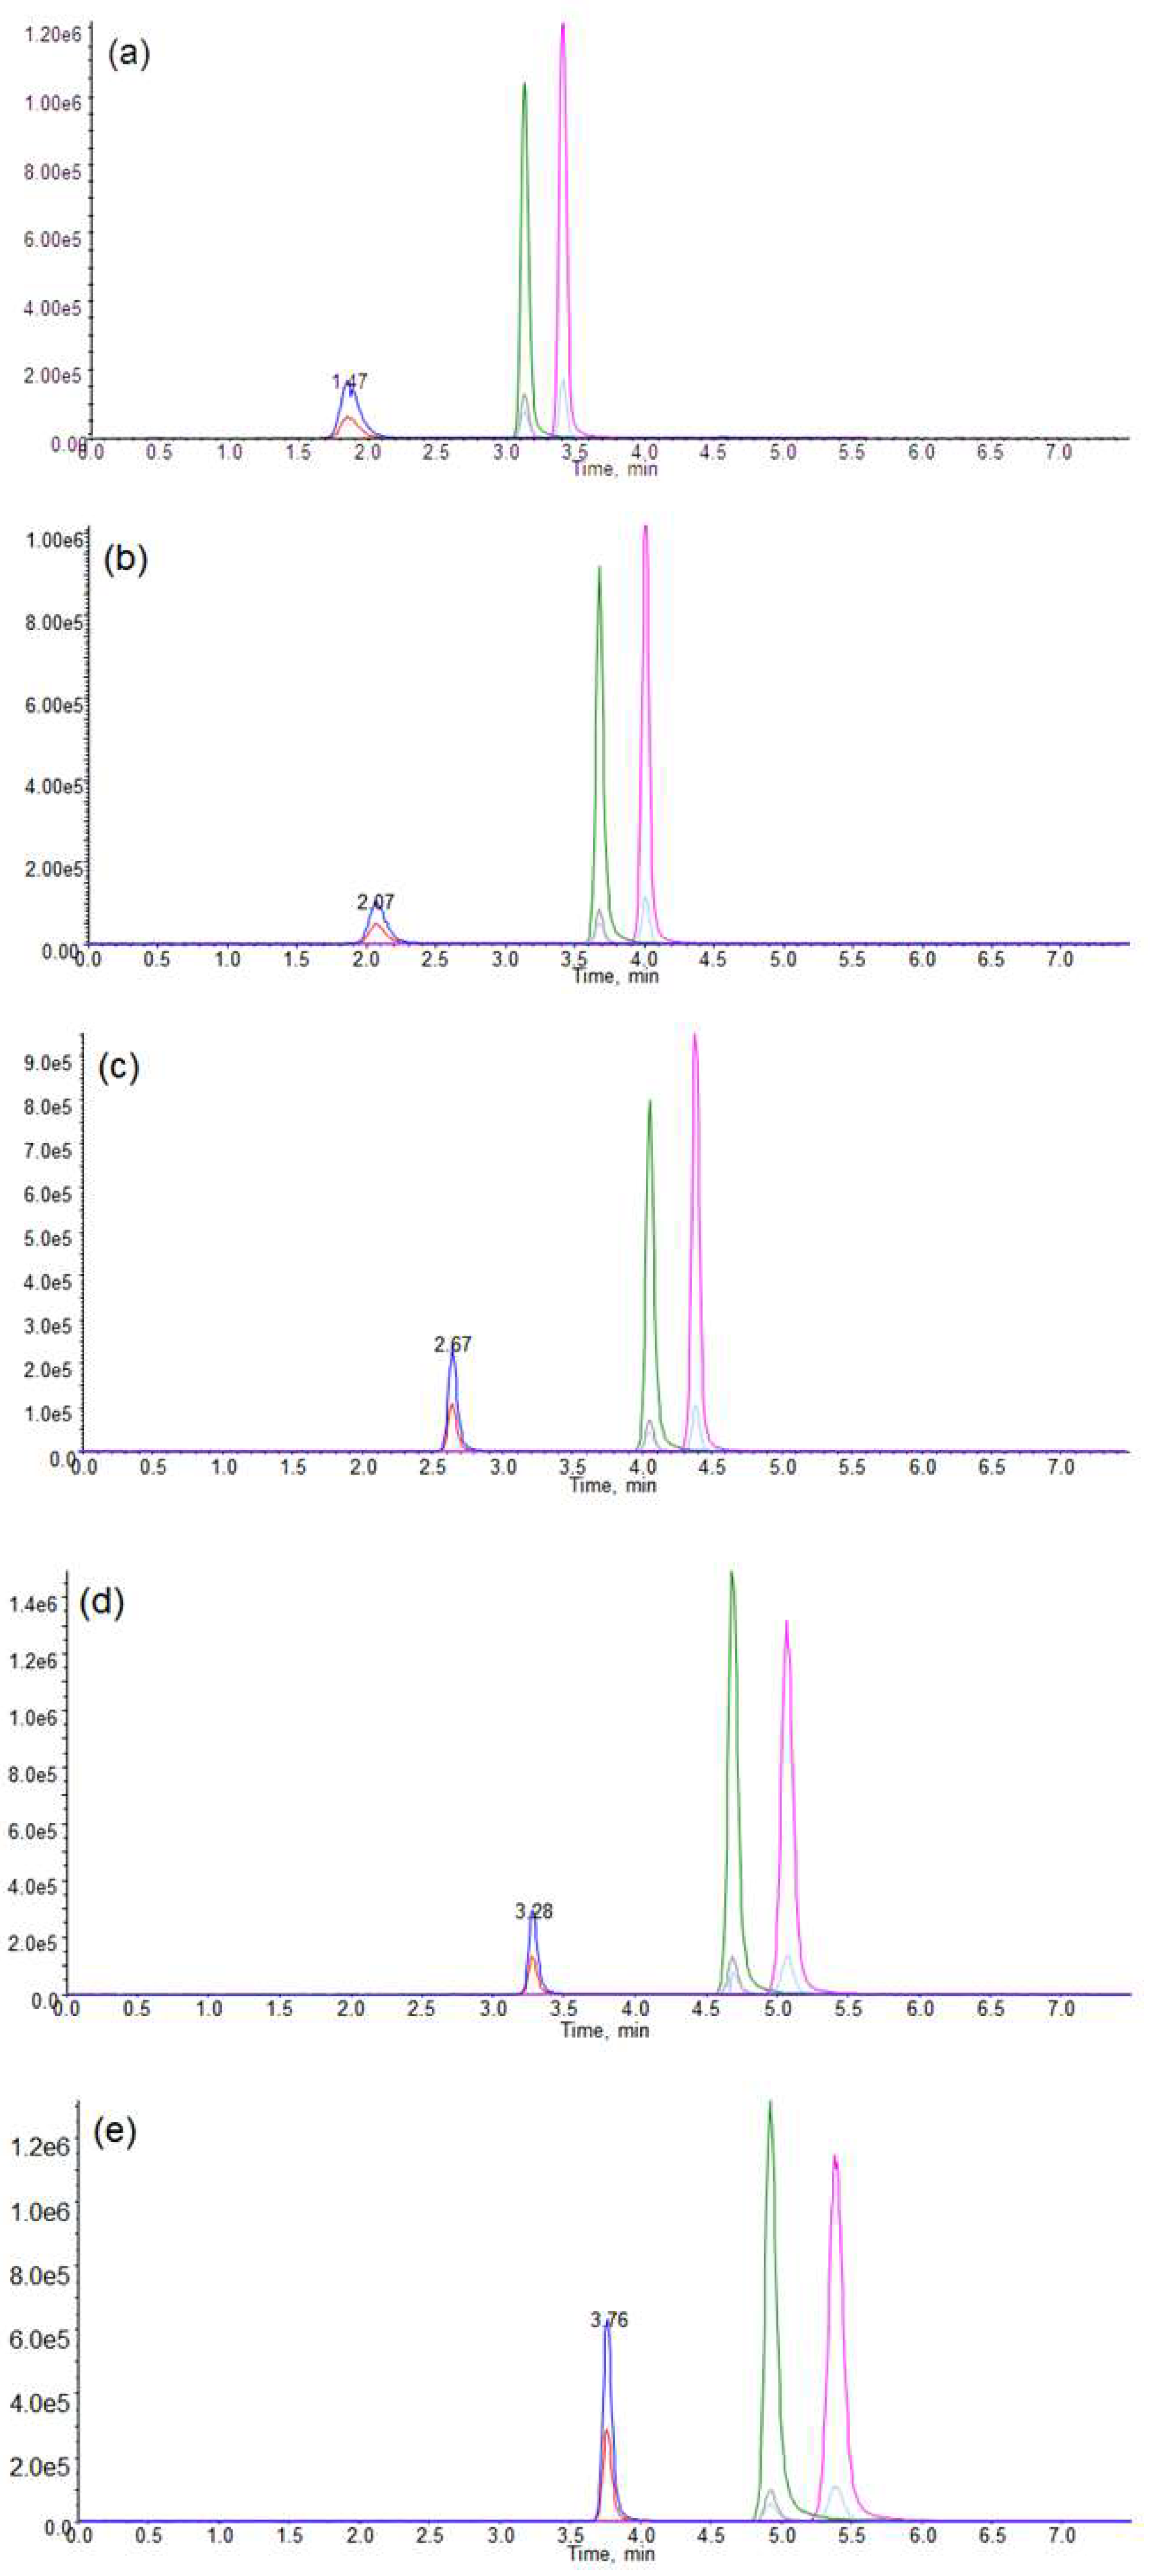
2.1.2. Mobile-Phase Optimization
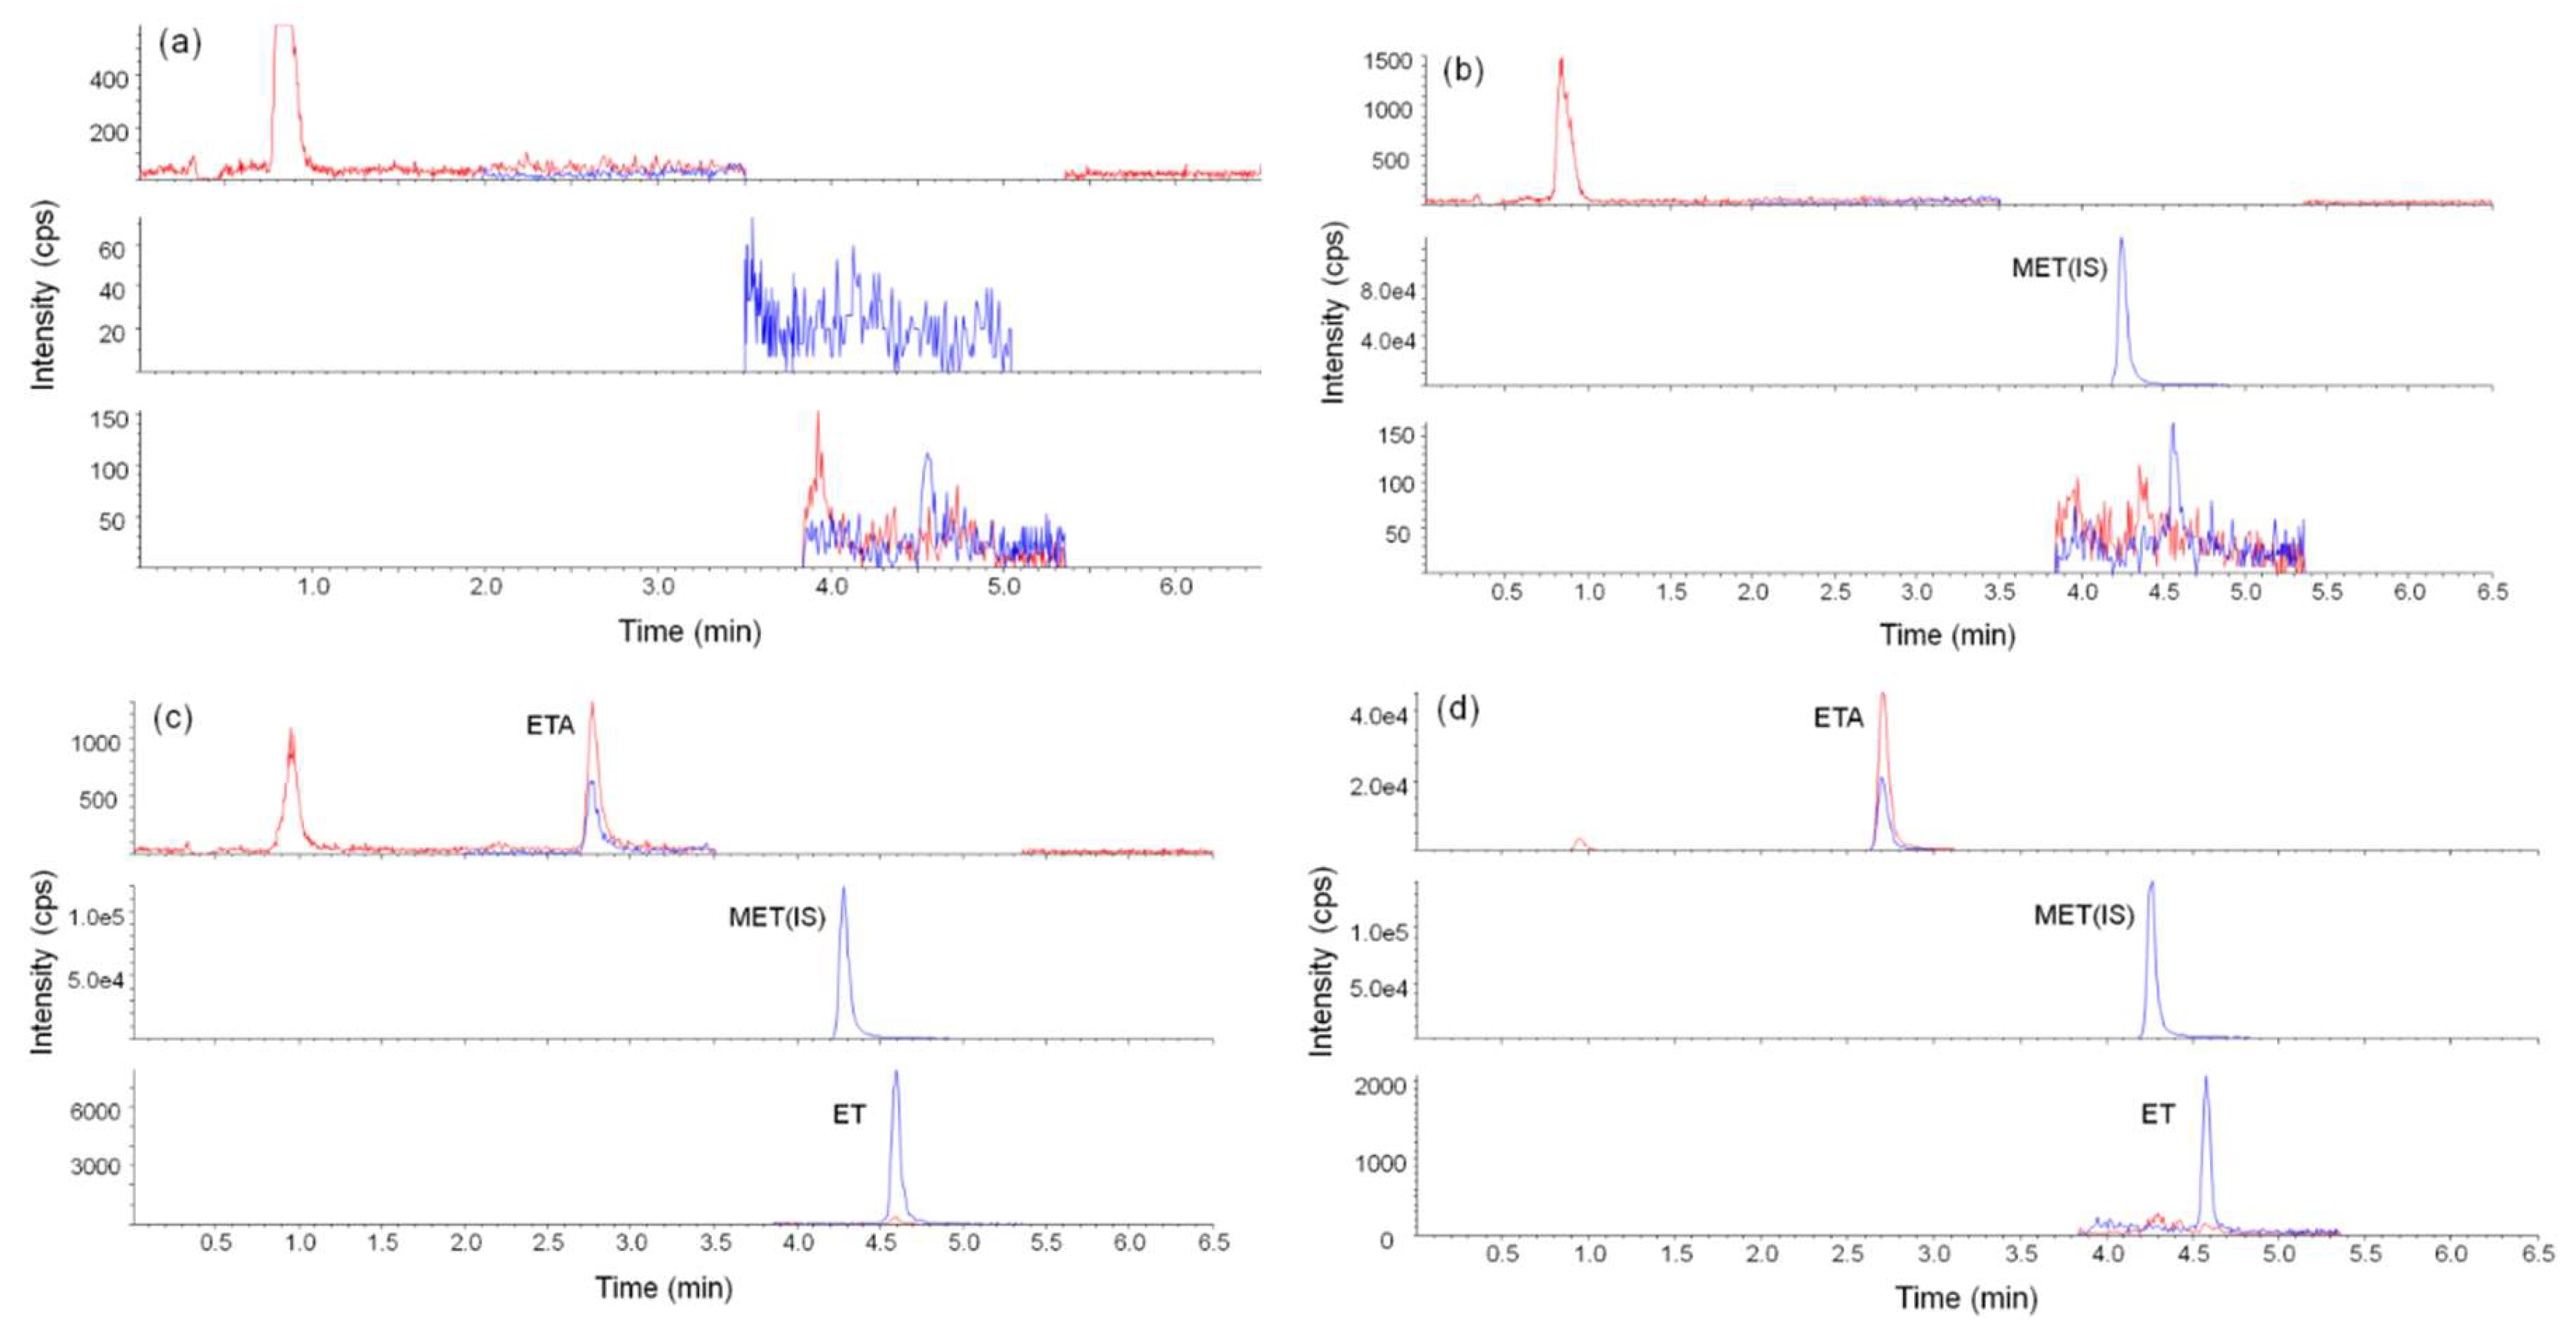
2.2. Matrix Effect
2.3. Validation
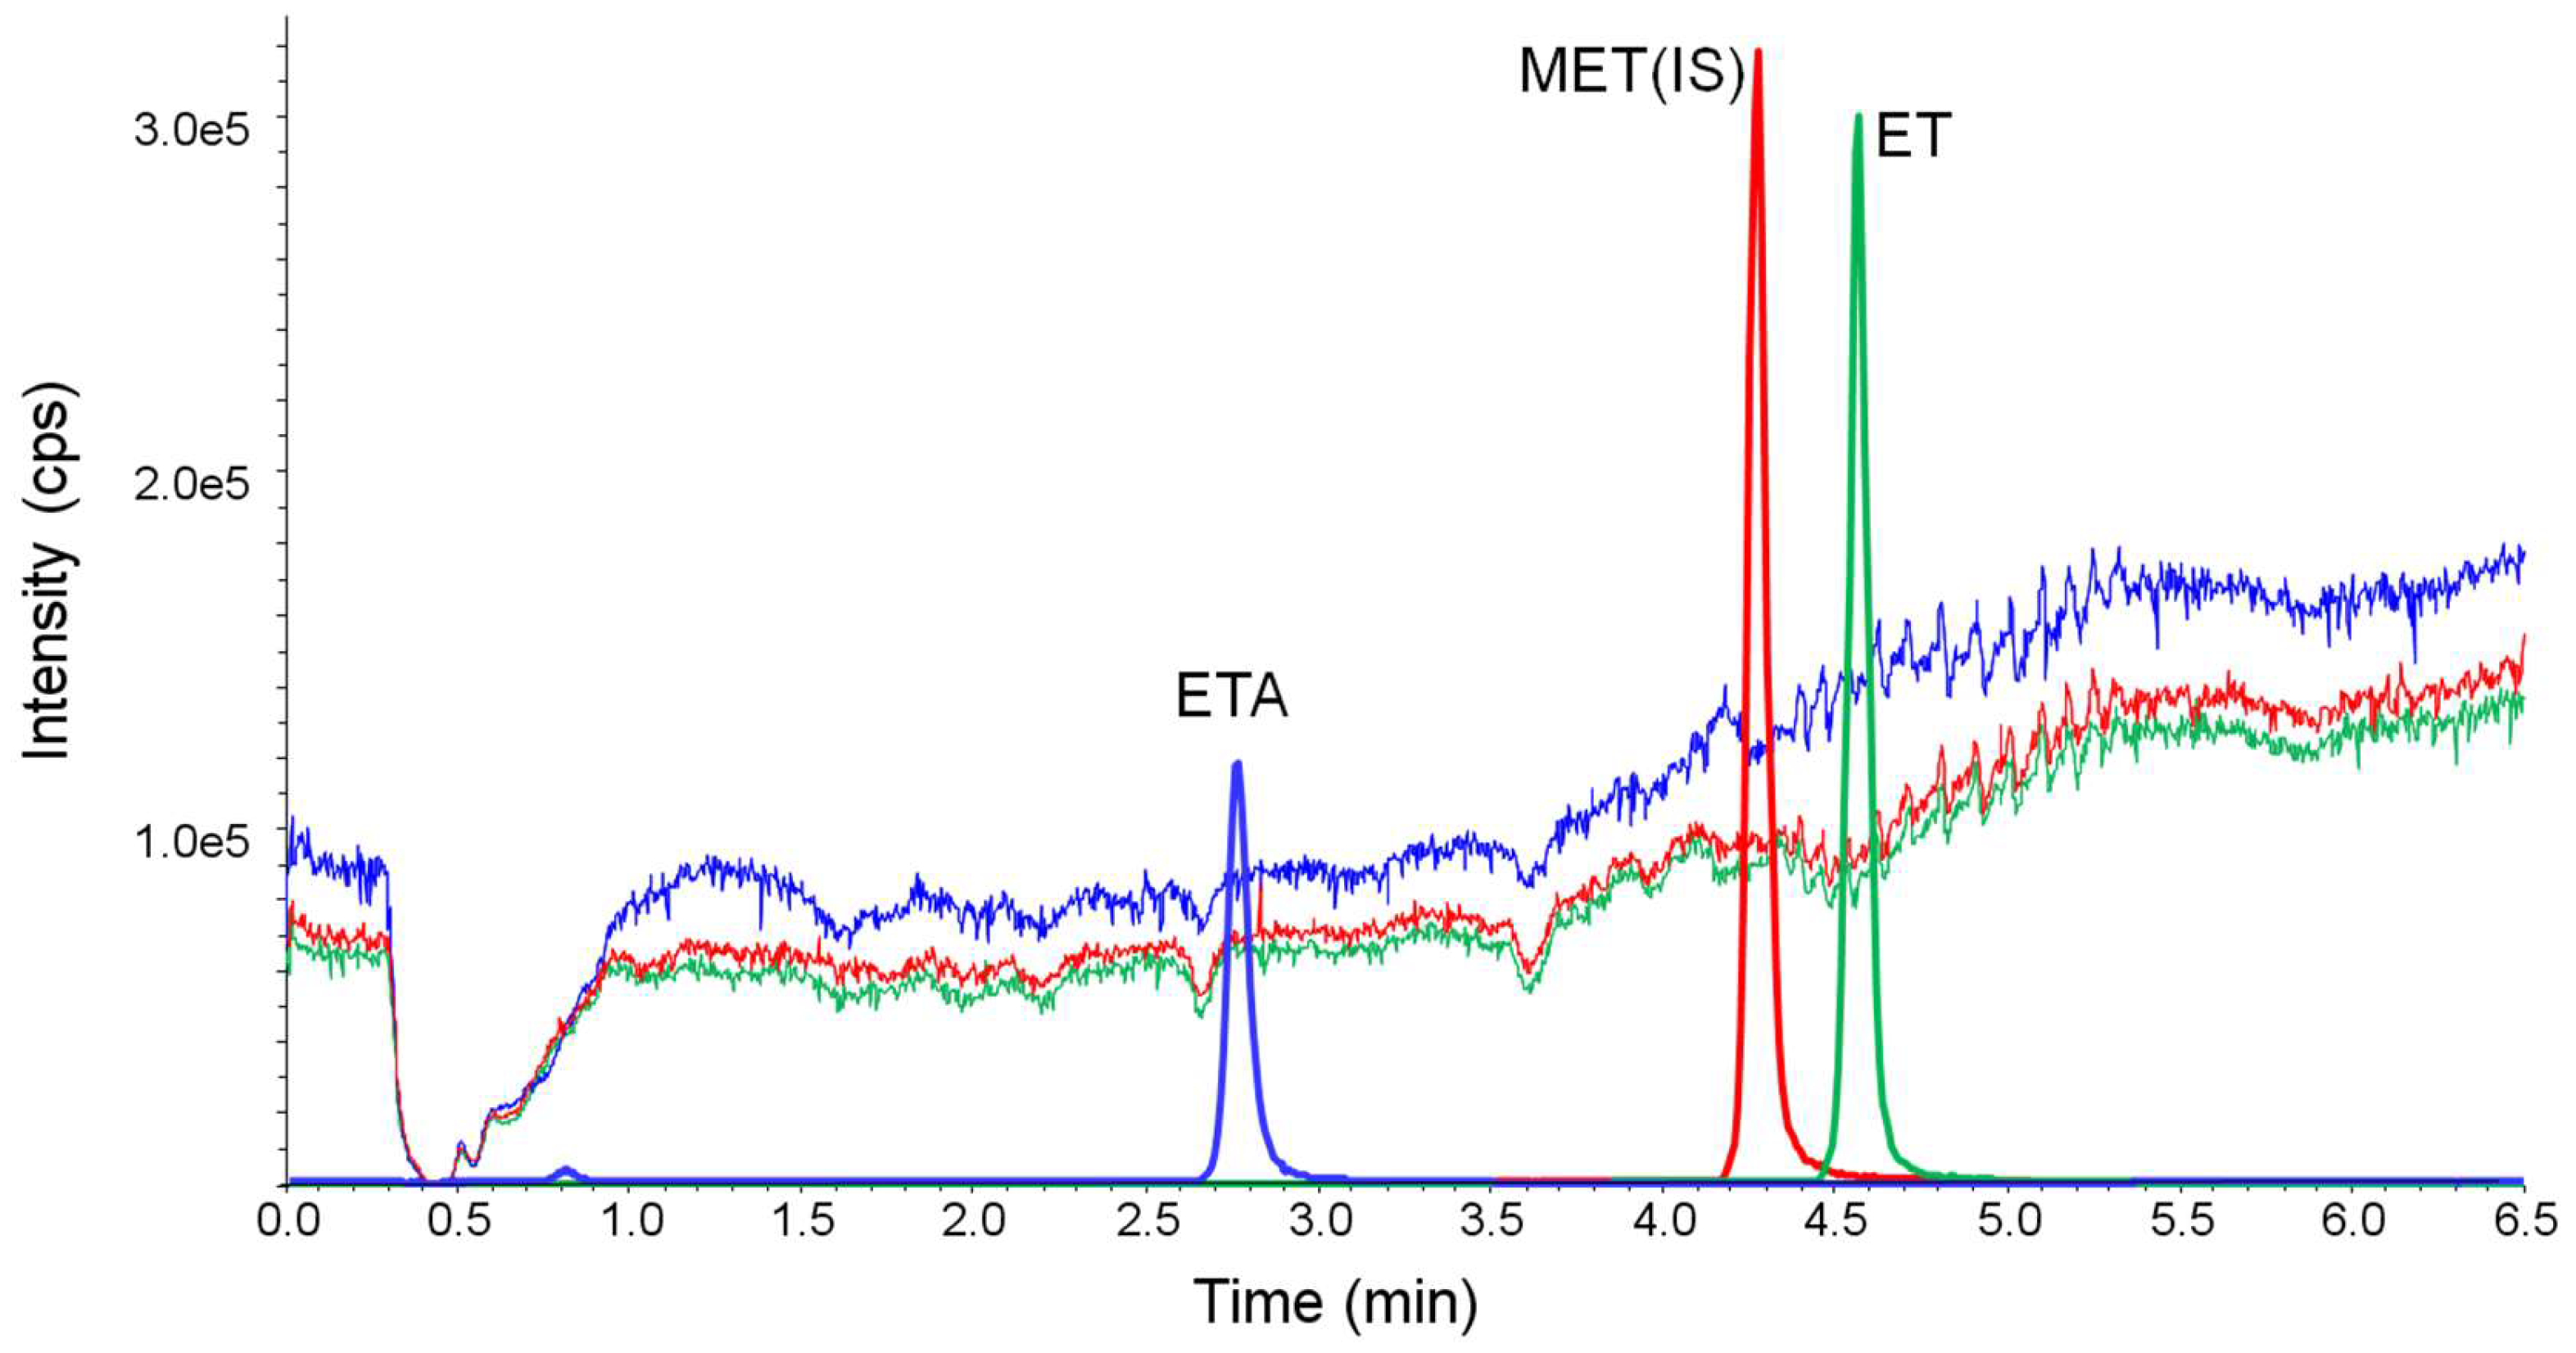
2.3.1. Selectivity, Linearity, Limit of Detection (LOD) and Limit of Quantitation (LOQ)
2.3.2. Precision and Accuracy
2.3.3. Process Efficiency
2.4. Method Feasibility
3. Materials and Methods
3.1. Reagents
3.2. Urine Specimens
3.3. Analytical Instrument and Conditions
3.3.1. Liquid Chromatography
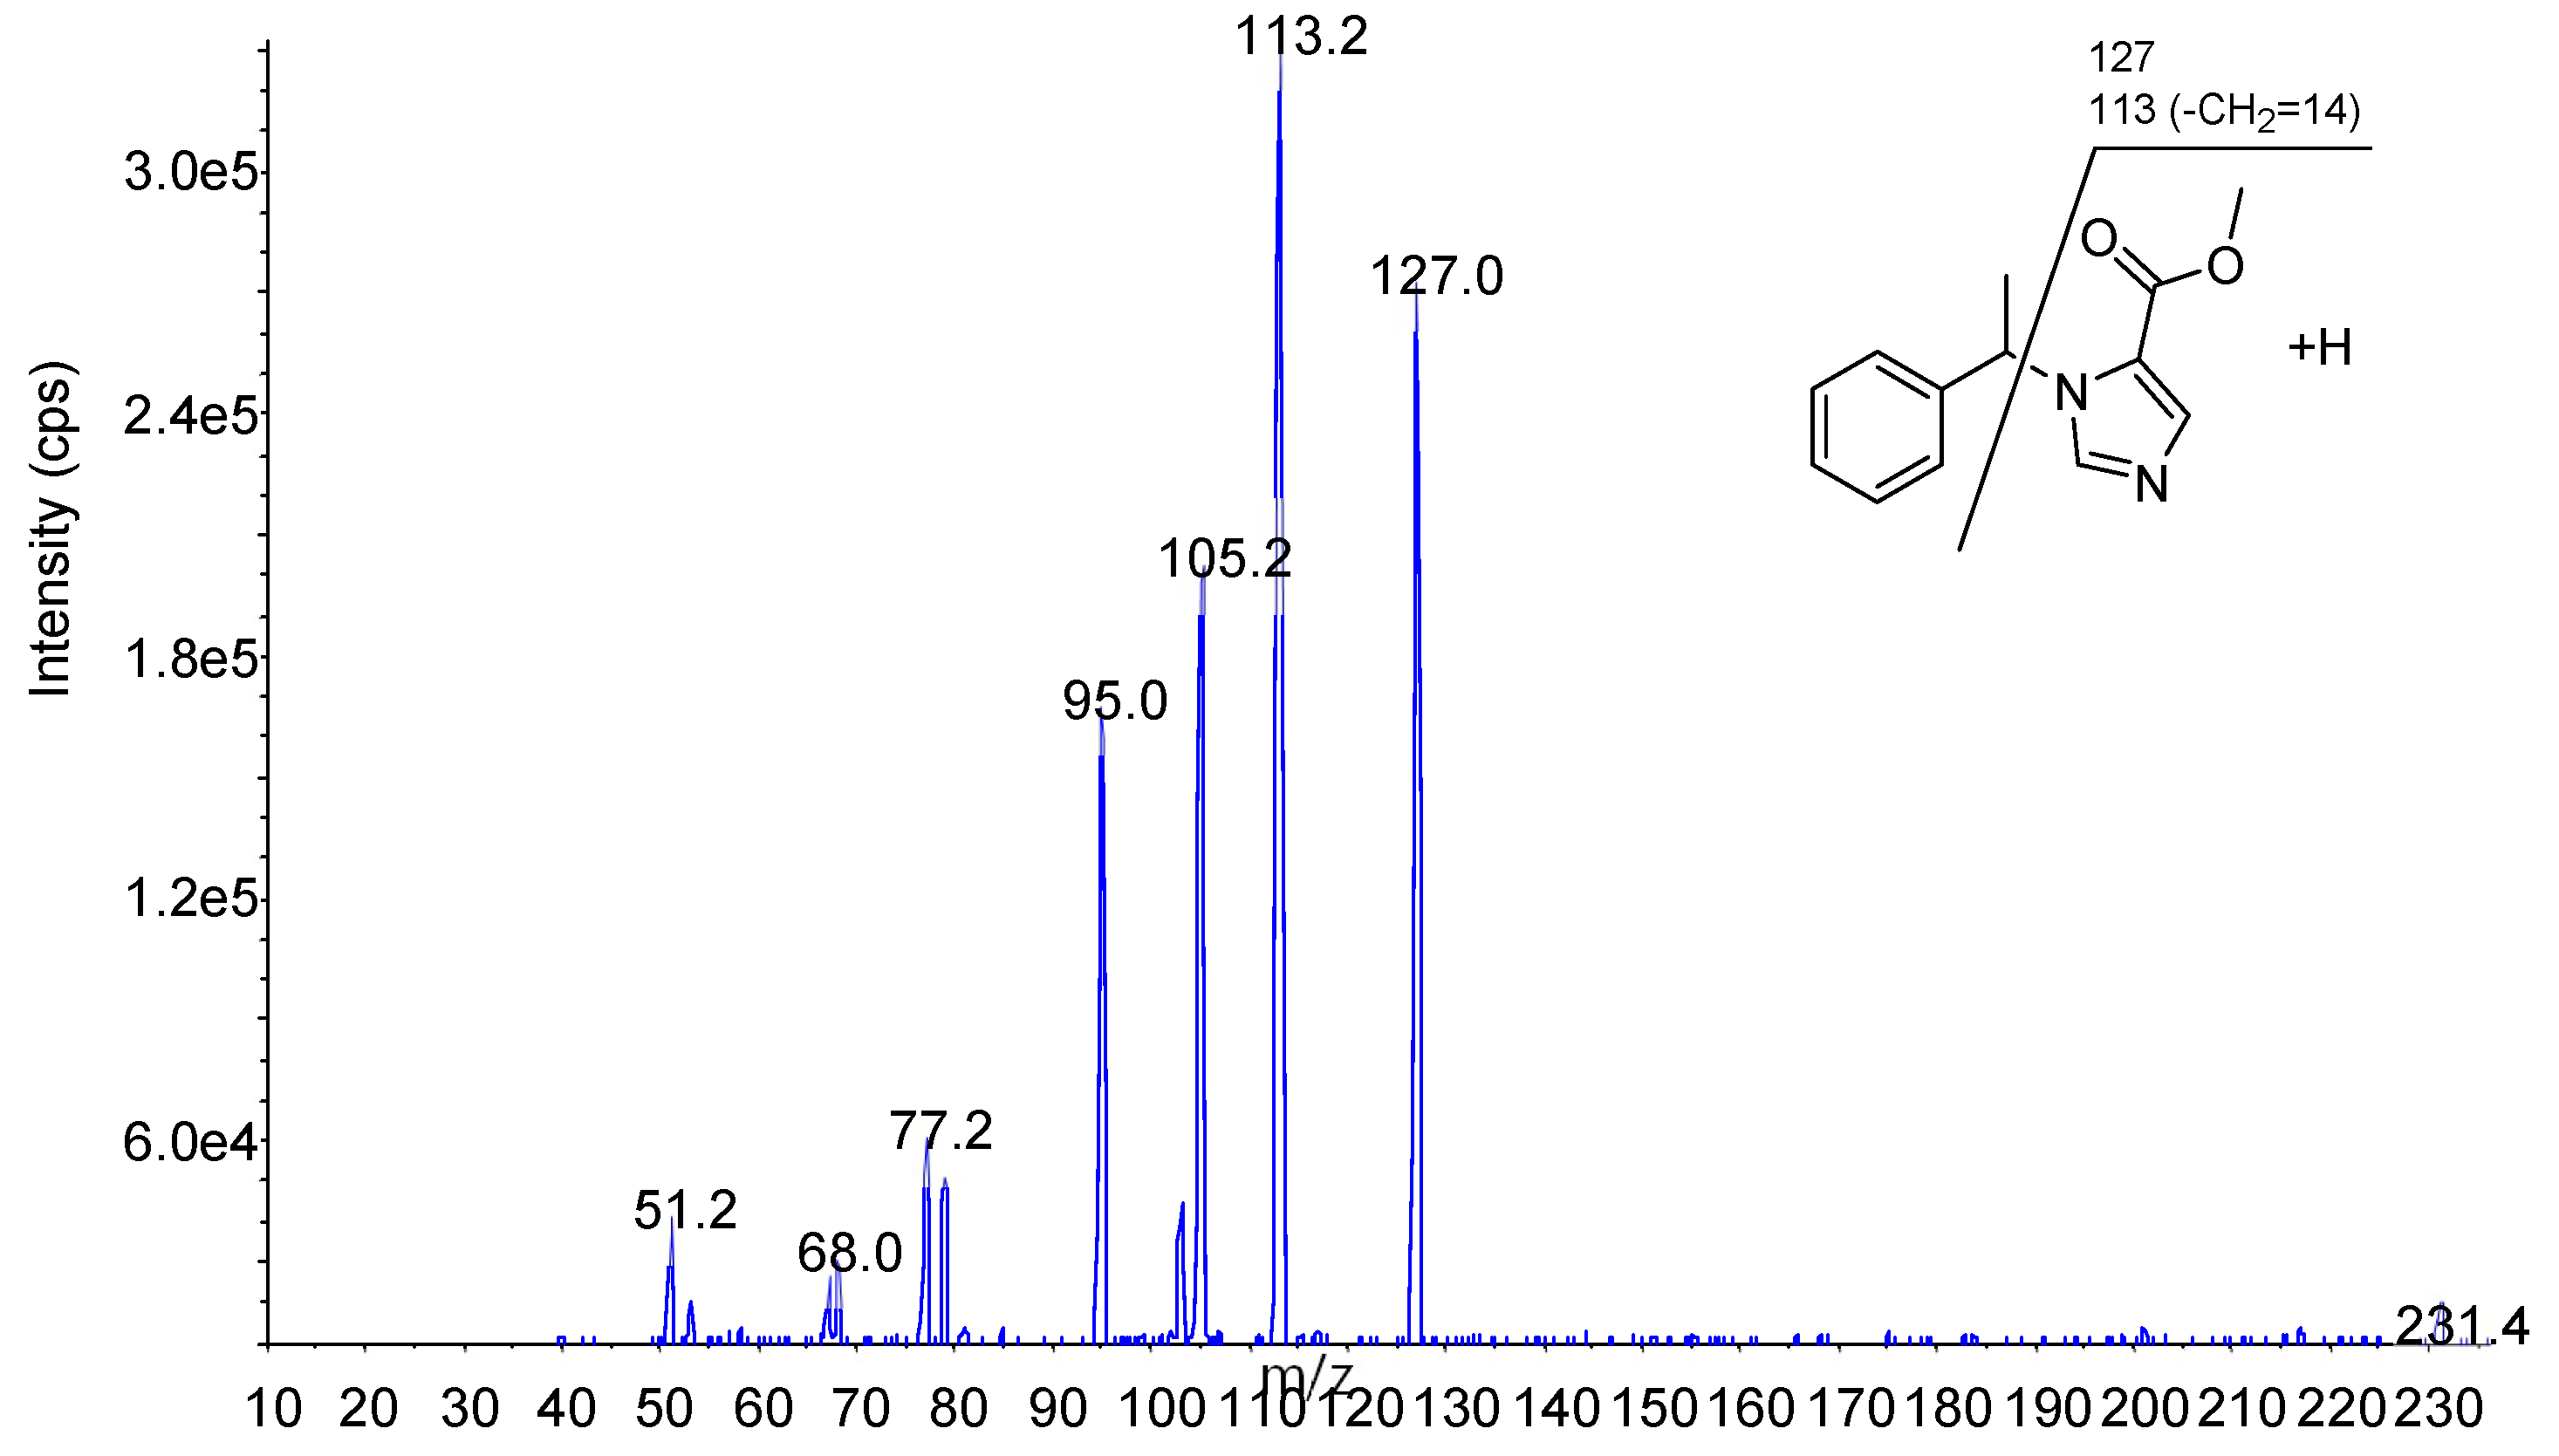
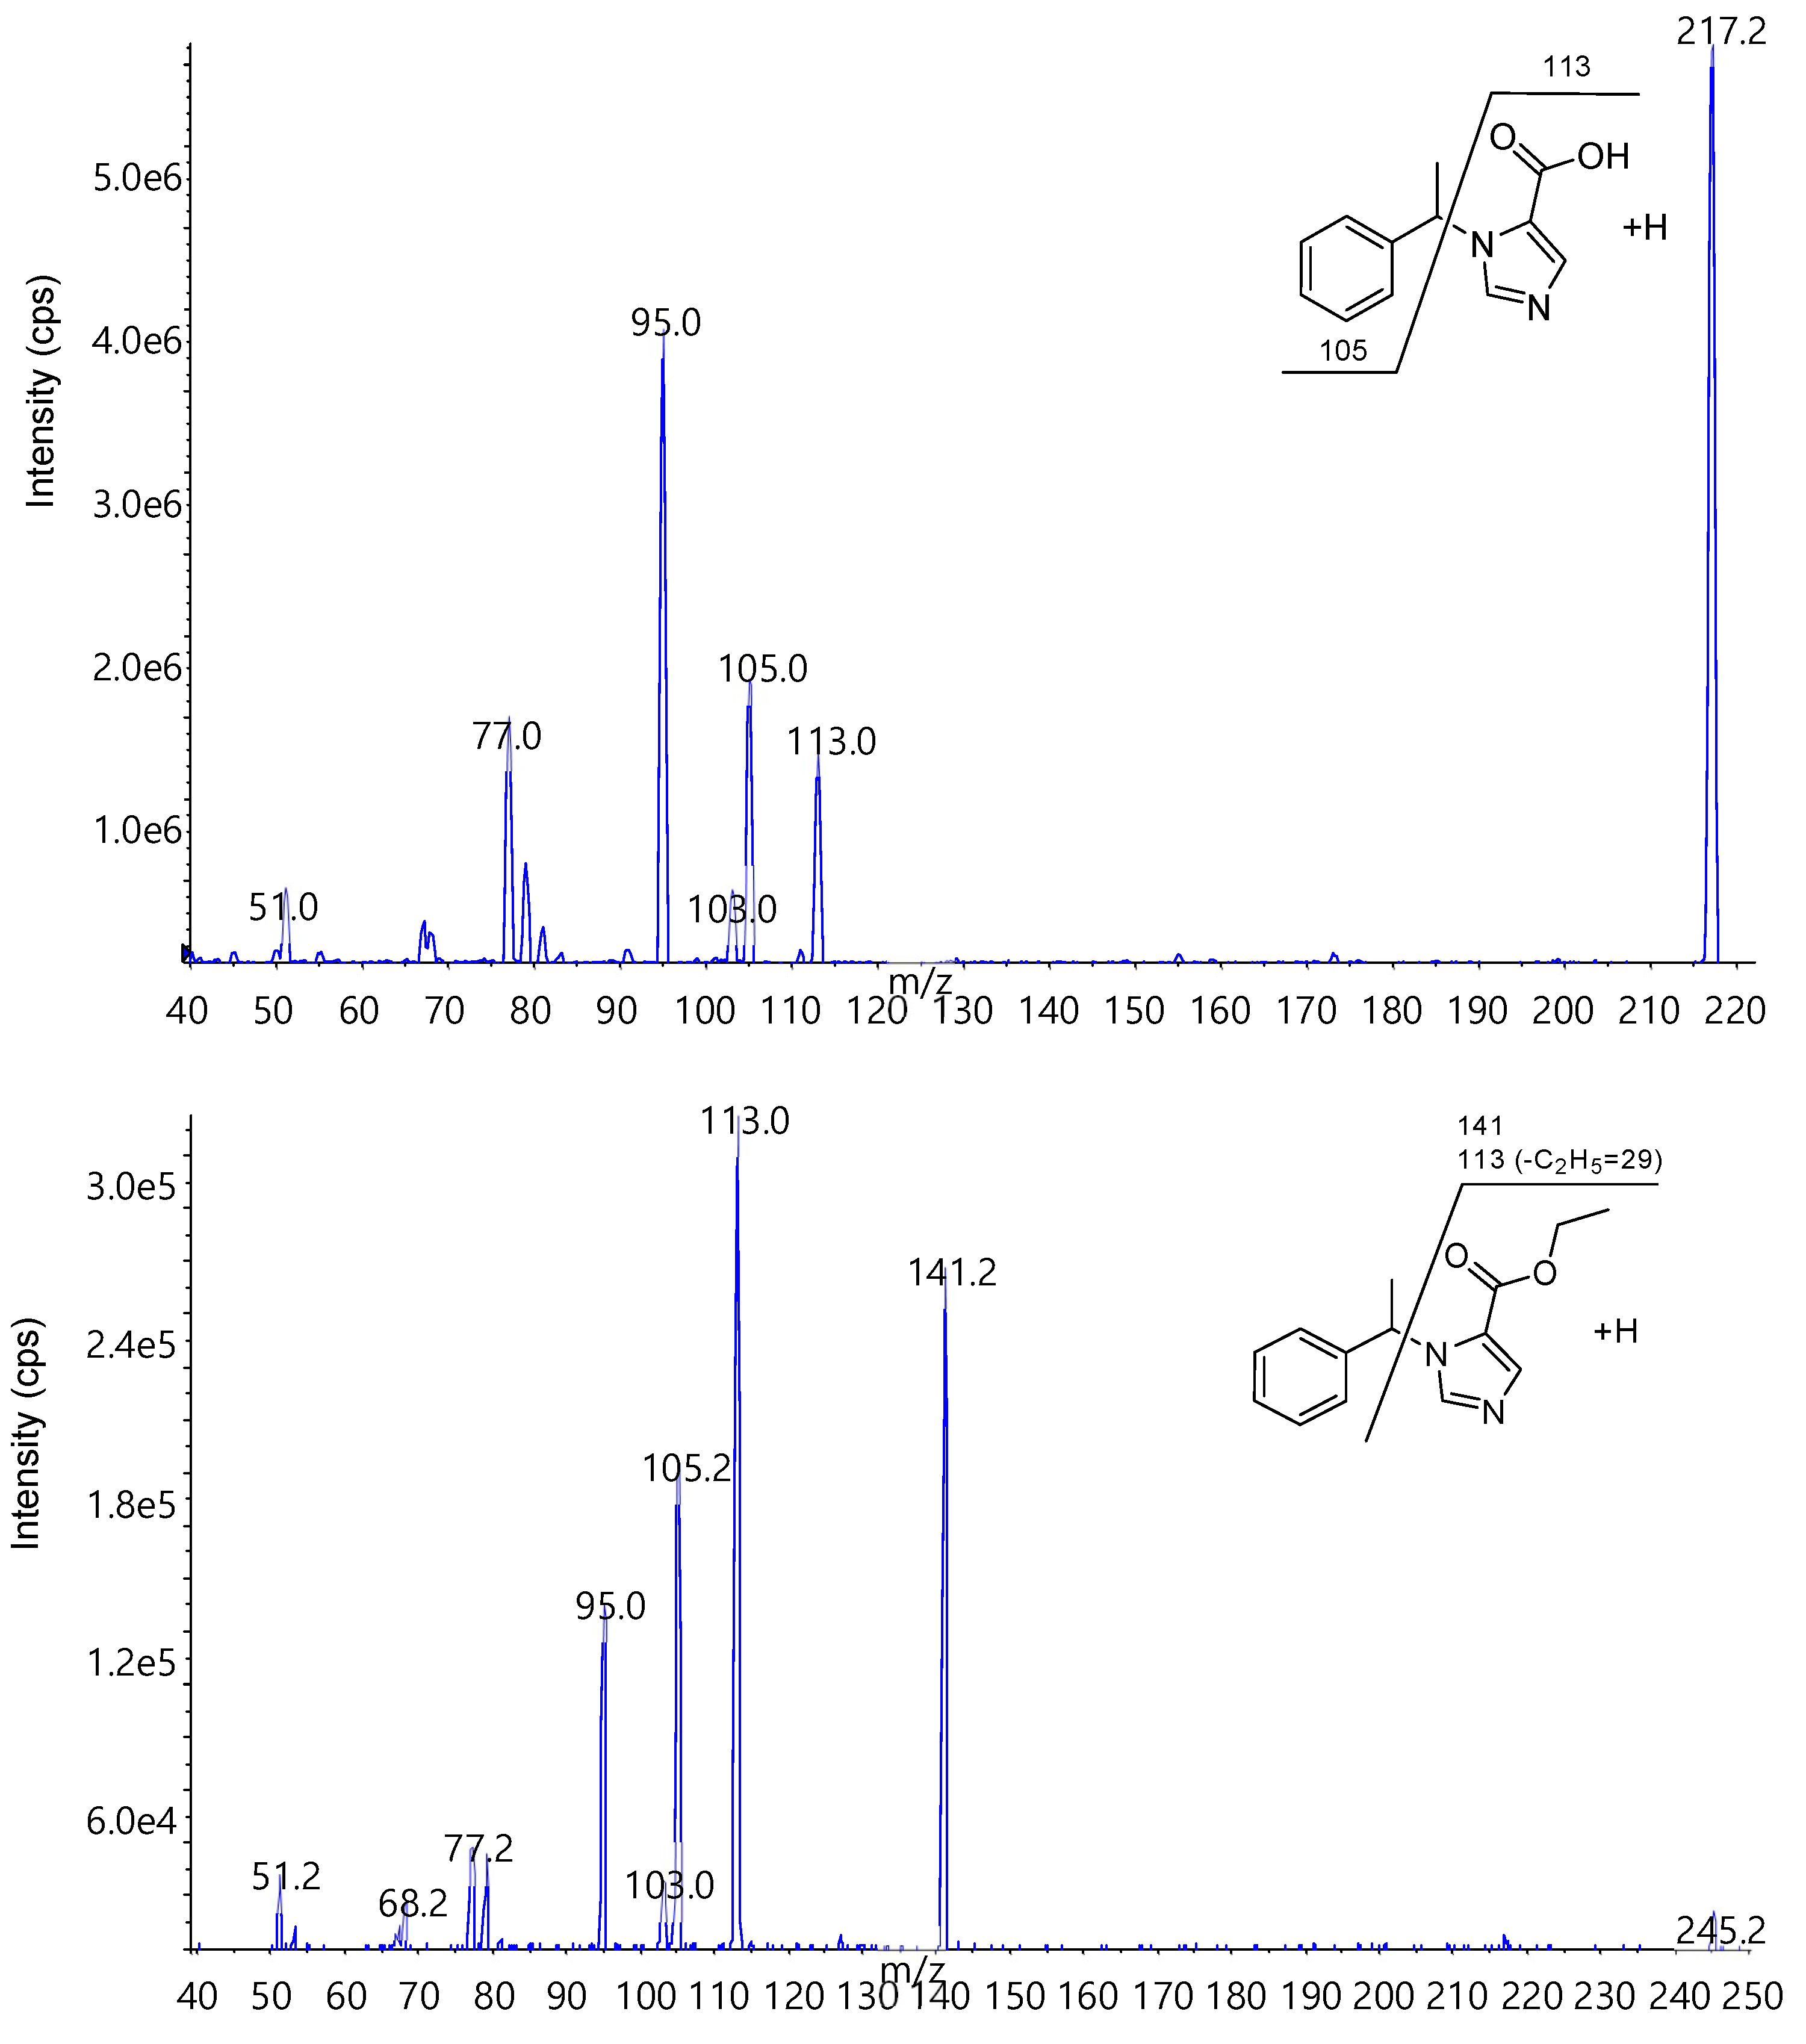
3.3.2. Tandem Mass Spectrometry (MS/MS)
3.4. Sample Preparation
3.5. Matrix Effect
3.6. Validation
4. Conclusion
Author Contributions
Funding
Conflicts of Interest
References
- Lee, S.Y. A Drug-Crime White Paper; Supreme Prosecutors’ Office: Seoul, Korea, 2017. [Google Scholar]
- Jeon, Y.-S.; Kim, S.-K.; Bae, S.-K.; Joo, H.-K. Current Status and Control Policies of Crimes Related to New Psychoactive Substances. J. Res. Korea Ins. Criminol. 2017, 12, 1–407. [Google Scholar]
- Avram, M.J.; Fragen, R.J.; Linde, H.W. High-performance liquid chromatographic assay for etomidate in human plasma: Results of preliminary clinical studies using etomidate for hypnosis in total intravenous anesthesia. J. Pharm. Sci. 1983, 72, 1424–1426. [Google Scholar] [CrossRef] [PubMed]
- Le Moing, J.P.I.; Levron, J.C. High-performance liquid chromatographic determination of etomidate in plasma. J. Chromatogr. 1990, 529, 217–222. [Google Scholar] [CrossRef]
- Ellis, E.O.; Beck, P.R. Determination of etomidate in human plasma by high-performance liquid chromatography. J. Chromatogr. 1982, 232, 207–211. [Google Scholar] [CrossRef]
- McIntosh, M.P.; Rajewski, R.A. A simple and efficient high-performance liquid chromatographic assay for etomidate in plasma. J. Pharm. Biomed. Anal. 2001, 24, 689–694. [Google Scholar] [CrossRef]
- Remane, D.; Monthenarch, D.; Meyer, M.R.; Maurer, H.H. Application of a UHPLC MS/MS-based multianalyte approach for screening and validated quantification of drugs in human blood plasma often requested in the context of brain death diagnosis. Ther. Drug Monit. 2014, 36, 257–260. [Google Scholar] [CrossRef] [PubMed]
- Haring, C.M.; Dijkhuis, I.C.; van Dijk, B. A rapid method of determining serum levels of etomidate by gas chromatography with the aid of a nitrogen detector. Acta Anaesthesiol. Belg. 1980, 31, 107–112. [Google Scholar] [PubMed]
- de Boer, A.G.; Smeekens, J.B.; Breimer, D.D. Assay of etomidate in plasma by capillary gas chromatography with nitrogen-selective detection. J. Chromatogr. 1979, 162, 591–595. [Google Scholar] [CrossRef]
- Deng, X.; Simpson, V.J. Gas chromatographic-mass spectrometric determination of etomidate in mouse brain. J. Pharmcol. Toxicol. Methods 2000, 43, 73–77. [Google Scholar] [CrossRef]
- Molina, D.K.; Hargrove, V.M.; Rodriguez, R.G. Distribution of Etomidate in a Fatal Intoxication. J. Anal. Toxicol. 2008, 32, 715–718. [Google Scholar] [CrossRef] [PubMed] [Green Version]
- Bjoernstad, K.; Beck, O.; Helander, A. A multi-component LC-MS/MS method for detection of ten plant-derived psychoactive substances in urine. J. Chromatogr. B 2009, 877, 1162–1168. [Google Scholar] [CrossRef] [PubMed]
- Jeong, Y.; Kim, M.K.; Suh, S.; In, M.K.; Kim, J.Y.; Paeng, K.-J. Rapid determination of benzodiazepines, zolpidem and their metabolites in urine using direct injection liquid chromatography-tandem mass spectrometry. Forensic Sci. Int. 2015, 257, 84–92. [Google Scholar]
- Food and Drug Administration. Bioanalytical Method Validation Guidance for Industry; U.S. Department of Health and Human Services: Washington, DC, USA, 2018.
Sample Availability: Not available. |


| Total Time (min) | Flow Rate (μL/min) | Mobile Phase | |
|---|---|---|---|
| Solvent A (%) a | Solvent B (%) b | ||
| 1 | 400 | 85 | 15 |
| 0.4 | 400 | 85 | 15 |
| 3 | 450 | 15 | 85 |
| 5 | 450 | 15 | 85 |
| 5.1 | 400 | 85 | 15 |
| 7.5 | 400 | 85 | 15 |
| Analyte | Concentration Range (ng/mL) | Slope (mean ± SD) | y-Intercept (mean) | Linearity a (R2) | LOD b (ng/mL) | LLOQ c (ng/mL) |
|---|---|---|---|---|---|---|
| Etomidate acid | 1.0–300.0 | 0.0124 ± 0.0008 | 0.0004 | 0.9958 | 0.03 | 1.0 |
| Etomidate | 0.4–120.0 | 0.1148 ± 0.0098 | 0.0051 | 0.9963 | 0.01 | 0.4 |
| Analyte | Nominal Concentration (ng/mL) | Intra-Day (n = 18) | Inter-Day (n = 24) | ||
|---|---|---|---|---|---|
| Precision a (% CV) | Accuracy b (% bias) | Precision (% CV) | Accuracy (% bias) | ||
| Etomidate acid | 1.0 | 10.2 | 2.9 | 8.4 | −6.4 |
| 3.0 | 4.7 | 2.4 | 6.0 | −4.1 | |
| 30.0 | 2.5 | −0.2 | 2.3 | −1.3 | |
| 90.0 | 1.7 | −7.4 | 2.7 | −7.0 | |
| Etomidate | 0.4 | 6.3 | −9.9 | 4.1 | −5.5 |
| 1.2 | 3.3 | −3.7 | 3.3 | 0.6 | |
| 12.0 | 2.0 | −4.0 | 4.0 | 1.3 | |
| 36.0 | 4.2 | −8.6 | 3.0 | −6.1 | |
| Compound | Concentration (ng/mL) | Bench-Top Stability (%) | Long-Term Stability (%) | Auto-Sampler Stability (%) | |
|---|---|---|---|---|---|
| (Room Temperature for 6 h) | (4 °C for 7 days) | (4 °C for 14 days) | (4 °C for 12 h) | ||
| Etomidate acid | 3.0 | −11.0 | −13.3 | −20.9 | −12.5 |
| 90.0 | −10.5 | −8.3 | −11.8 | −9.3 | |
| Etomidate | 1.2 | −0.5 | −7.5 | −9.7 | −7.0 |
| 36.0 | −4.7 | −5.3 | −5.7 | −4.5 | |
| Sample# | Etomidate Acid Concentration (ng/mL) | Etomidate Concentration (ng/mL) |
|---|---|---|
| # 1 | 23.79 | < LLOQ |
| # 2 | 31.38 | < LLOQ |
| Analyte | RT a (min) | MRM Transition | DP b | EP c | CEP d | CE e | CXP f | |
|---|---|---|---|---|---|---|---|---|
| Q1 | Q3 | |||||||
| Etomidate acid | 2.75 | 217.1 | 113.1 | 24 | 8.5 | 12 | 18 | 6 |
| 105.2 | 24 | 8.5 | 12 | 37 | 6 | |||
| Metomidate (IS) | 4.29 | 231.2 | 127.1 | 26 | 4 | 12 | 15 | 4 |
| 113.2 | 26 | 4 | 12 | 31 | 4 | |||
| Etomidate | 4.6 | 245.2 | 113.2 | 26 | 4.5 | 12 | 27 | 4 |
| 141.2 | 26 | 4.5 | 12 | 15 | 6 | |||
© 2019 by the authors. Licensee MDPI, Basel, Switzerland. This article is an open access article distributed under the terms and conditions of the Creative Commons Attribution (CC BY) license (http://creativecommons.org/licenses/by/4.0/).
Share and Cite
Jung, Y.-K.; You, S.Y.; Kim, S.-Y.; Kim, J.Y.; Paeng, K.-J. Simultaneous Determination of Etomidate and Its Major Metabolite, Etomidate Acid, in Urine Using Dilute and Shoot Liquid Chromatography–Tandem Mass Spectrometry. Molecules 2019, 24, 4459. https://doi.org/10.3390/molecules24244459
Jung Y-K, You SY, Kim S-Y, Kim JY, Paeng K-J. Simultaneous Determination of Etomidate and Its Major Metabolite, Etomidate Acid, in Urine Using Dilute and Shoot Liquid Chromatography–Tandem Mass Spectrometry. Molecules. 2019; 24(24):4459. https://doi.org/10.3390/molecules24244459
Chicago/Turabian StyleJung, Yu-Kyung, Soo Young You, Seon-Yeong Kim, Jin Young Kim, and Ki-Jung Paeng. 2019. "Simultaneous Determination of Etomidate and Its Major Metabolite, Etomidate Acid, in Urine Using Dilute and Shoot Liquid Chromatography–Tandem Mass Spectrometry" Molecules 24, no. 24: 4459. https://doi.org/10.3390/molecules24244459
APA StyleJung, Y.-K., You, S. Y., Kim, S.-Y., Kim, J. Y., & Paeng, K.-J. (2019). Simultaneous Determination of Etomidate and Its Major Metabolite, Etomidate Acid, in Urine Using Dilute and Shoot Liquid Chromatography–Tandem Mass Spectrometry. Molecules, 24(24), 4459. https://doi.org/10.3390/molecules24244459