Quantification of Water, Protein and Soluble Sugar in Mulberry Leaves Using a Handheld Near-Infrared Spectrometer and Multivariate Analysis

Abstract
:1. Introduction
2. Results and Discussion
2.1. Spectral Characteristics
2.2. Reference Values
2.3. Spectral Pretreatment
2.4. Wavelength Optimization
2.5. Validation for Unknown Samples
3. Conclusions
4. Materials and Methods
4.1. Mulberry Leaves
4.2. Methods
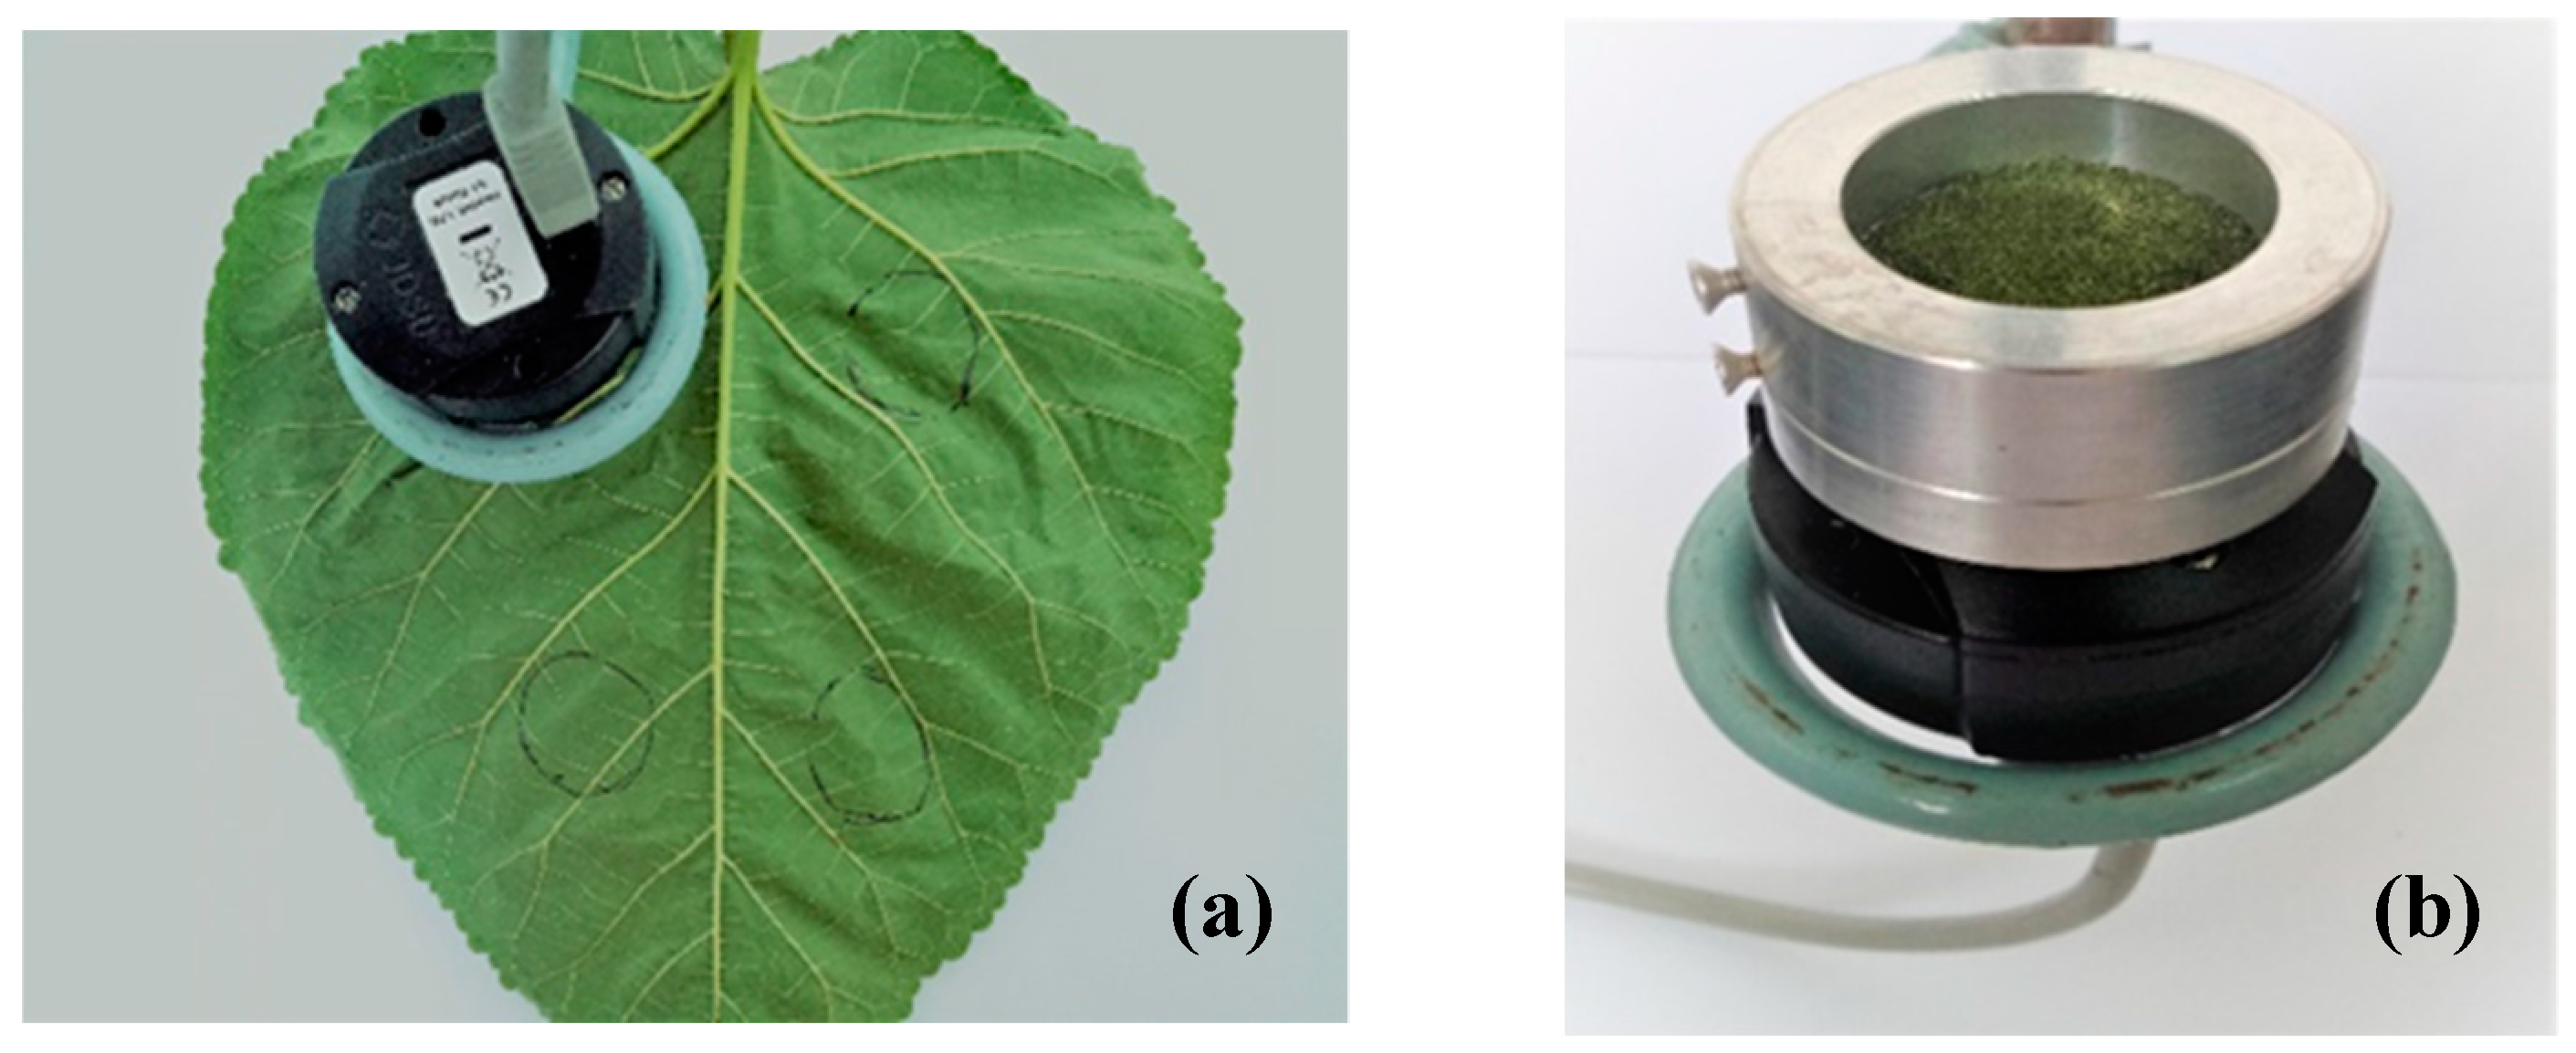
4.2.1. NIR Spectra Collection
4.2.2. Reference Determination
4.2.3. Spectra Pretreatment
4.2.4. Wavelength Selection
4.2.5. PLS Calibration
4.2.6. Evaluation Method
4.2.7. Validation With Unknown Samples
4.2.8. Software
Author Contributions
Funding
Conflicts of Interest
References
- Al-Kirshi, R.A.; Alimon, A.; Zulkifli, I.; Atefeh, S.; Zahari, M.W.; Ivan, M. Nutrient digestibility of mulberry leaves (Morus Alba). Ital. J. Anim. Sci. 2013, 12, 381–388. [Google Scholar] [CrossRef] [Green Version]
- Panja, P. The effects of dietary mulberry leaves (Morus alba L.) on chicken performance, carcass, egg quality and cholesterol content of meat and egg. Walailak J. Sci. Technol. 2013, 10, 121–129. [Google Scholar]
- Huyen, N.T.; Wanapat, M.; Navanukraw, C. Effect of mulberry leaf pellet (MUP) supplementation on rumen fermentation and nutrient digestibility in beef cattle fed on rice straw-based diets. Anim. Feed Sci. Technol. 2012, 175, 8–15. [Google Scholar] [CrossRef]
- Hiromitsu, N.; Shinji, O.; Eriko, K.; Sukunya, C.; Midori, T.; Hajime, K.; Rensuke, K. Effect of environmental conditions on the α-glucosidase inhibitory activity of mulberry leaves. J. Agric. Chem. Soc. Jpn. 2011, 75, 2293–2296. [Google Scholar]
- Islam, M.; Siddiqui, M.N.; Khatun, A.; Siddiky, M.; Rahman, M.; Bostami, A.; Selim, A. Dietary effect of mulberry leaf (Morus alba) meal on growth performance and serum cholesterol level of broiler chickens. SAARC J. Agric. 2014, 12, 79–89. [Google Scholar] [CrossRef] [Green Version]
- Zhu, Z.; Jiang, J.J.; Jie, Y.U.; Mao, X.B.; Bing, Y.U.; Chen, D.W. Effect of dietary supplementation with mulberry (Morus alba L.) leaves on the growth performance, meat quality and antioxidative capacity of finishing pigs. J. Integr. Agric. 2019, 18, 147–155. [Google Scholar]
- Naranjo, A.A.; García, J.A.; Esperance, M. Partial or total replacement of commercial concentrate with on-farm-grown mulberry forage: Effects on lamb growth and feeding costs. Trop. Anim. Health Prod. 2017, 49, 537–546. [Google Scholar] [CrossRef]
- Dasappa, D.; Ramaswamy, S. Efficacy of cyanobacterial biofertilizer (CBB) on leaf yield and quality of mulberry and its impact on silkworm cocoon characters. Int. J. Ind. Entomol. 2006, 13, 15–22. [Google Scholar]
- Li-chan, E.C.Y.; Griffiths, P.R.; Chalmers, J.M. Applications of Vibrational Spectroscopy in Food Science: Volume I: Instrumentation and Fundamental Applications; John Wiley & Sons: Hoboken, NJ, USA, 2010. [Google Scholar]
- Osborne, B.G.; Kays, S.E.; Barton, F.E.; Cozzolino, D.; Cattaneo, T.M.P. Near-Infrared Spectroscopy in Food Science and Technology; John Wiley & Sons: Hoboken, NJ, USA, 2006. [Google Scholar]
- Zhang, Y.; Dong, Y.; Xiang, B.; Xu, J. Feasibility research on rapid detection of prochloraz in green tea soft drink by near-infrared spectroscopy. Food Anal. Method 2015, 8, 343–351. [Google Scholar] [CrossRef]
- Toledo-Martín, E.; García-García, M.; Font, R.; Moreno-Rojas, J.; Salinas-Navarro, M.; Gómez, P.; del Río-Celestino, M. Quantification of total phenolic and carotenoid content in blackberries (Rubus Fructicosus L.) using near infrared spectroscopy (NIRS) and multivariate analysis. Molecules 2018, 23, 3191. [Google Scholar] [CrossRef] [Green Version]
- Yang, Z.; Nie, G.; Pan, L.; Zhang, Y.; Huang, L.; Ma, X.; Zhang, X. Development and validation of near-infrared spectroscopy for the prediction of forage quality parameters in Lolium multiflorum. PeerJ 2017, 5, e3867. [Google Scholar] [CrossRef] [Green Version]
- Yan, H.; Han, B.X.; Wu, Q.Y.; Jiang, M.Z.; Gui, Z.Z. Rapid detection of Rosa laevigata polysaccharide content by near-infrared spectroscopy. Spectrochim. Acta Part A 2011, 79, 179–184. [Google Scholar] [CrossRef]
- Yan, H.; Siesler, H.W. Quantitative analysis of a pharmaceutical formulation: Performance comparison of different handheld near-infrared spectrometers. J. Pharm. Biomed. Anal. 2018, 160, 179–186. [Google Scholar] [CrossRef]
- Swart, E.; Brand, T.; Engelbrecht, J. The use of near infrared spectroscopy (NIRS) to predict the chemical composition of feed samples used in ostrich total mixed rations. S. Afr. J. Anim. Sci. 2012, 42, 550–554. [Google Scholar] [CrossRef] [Green Version]
- Tahir, M.; Shim, M.Y.; Ward, N.E.; Westerhaus, M.O.; Pesti, G.M. Evaluation of near-infrared reflectance spectroscopy (NIRS) techniques for total and phytate phosphorus of common poultry feed ingredients. Poult. Sci. 2012, 91, 2540–2547. [Google Scholar] [CrossRef]
- Cozzolino, D.; Labandera, M. Determination of dry matter and crude protein contents of undried forages by near-infrared reflectance spectroscopy. J. Sci. Food Agric. 2002, 82, 380–384. [Google Scholar] [CrossRef]
- Neves, M.D.G.; Poppi, R.J.; Siesler, H.W. Rapid Determination of nutritional parameters of pasta/sauce blends by handheld near-infrared spectroscopy. Molecules 2019, 24, 2029. [Google Scholar] [CrossRef] [Green Version]
- Li, H.; Liang, Y.; Xu, Q.; Cao, D. Key wavelengths screening using competitive adaptive reweighted sampling method for multivariate calibration. Anal. Chim. Acta 2009, 648, 77–84. [Google Scholar] [CrossRef]
- Li, X.; Sun, C.; Luo, L.; He, Y. Determination of tea polyphenols content by infrared spectroscopy coupled with iPLS and random frog techniques. Comput. Electron. Agric. 2015, 112, 28–35. [Google Scholar] [CrossRef]
- Ni, C.; Zhang, Y.; Wang, D. Moisture content quantization of masson pine seedling leaf based on stacked autoencoder with near-infrared spectroscopy. J. Electr. Comput. Eng. 2018, 2018, 8696202. [Google Scholar] [CrossRef]
- Quentin, A.; Rodemann, T.; Doutreleau, M.; Moreau, M.; Davies, N. Application of near-infrared spectroscopy for estimation of non-structural carbohydrates in foliar samples of Eucalyptus globulus Labilladière. Tree Physiol. 2017, 37, 131–141. [Google Scholar]
- Granados-Chinchilla, F.; Rodríguez, C. Bioavailability of in-feed tetracyclines is influenced to a greater extent by crude protein rather than calcium. Anim. Feed Sci. Technol. 2014, 198, 323–332. [Google Scholar] [CrossRef]
- Ibrahim, M.H.; Jaafar, H.Z.; Karimi, E.; Ghasemzadeh, A. Impact of organic and inorganic fertilizers application on the phytochemical and antioxidant activity of kacip fatimah (Labisia pumila Benth). Molecules 2013, 18, 10973–10988. [Google Scholar] [CrossRef] [PubMed] [Green Version]
- Yun, Y.H.; Liang, Y.Z.; Xie, G.X.; Li, H.D.; Cao, D.S.; Xu, Q.S. A perspective demonstration on the importance of variable selection in inverse calibration for complex analytical systems. Analyst 2013, 138, 6412–6421. [Google Scholar] [CrossRef] [PubMed]
- Rady, A.M.; Guyer, D.E. Evaluation of sugar content in potatoes using NIR reflectance and wavelength selection techniques. Postharvest Biol. Technol. 2015, 103, 17–26. [Google Scholar] [CrossRef]
- Li, H.D.; Xu, Q.S.; Liang, Y.Z. libPLS: An integrated library for partial least squares regression and linear discriminant analysis. Chemom. Intell. Lab. Syst. 2018, 176, 34–43. [Google Scholar] [CrossRef]
- Yun, Y.H.; Li, H.D.; Wood, L.R.; Fan, W.; Wang, J.J.; Cao, D.S.; Xu, Q.S.; Liang, Y.Z. An efficient method of wavelength interval selection based on random frog for multivariate spectral calibration. Spectrochim. Acta Part A 2013, 111, 31–36. [Google Scholar] [CrossRef]
- Li, H.D.; Xu, Q.S.; Liang, Y.Z. Random frog: An efficient reversible jump Markov Chain Monte Carlo-like approach for variable selection with applications to gene selection and disease classification. Anal. Chim. Acta 2012, 740, 20–26. [Google Scholar] [CrossRef]
- Xue, J.; Yang, Q.; Yun, J.; Liu, Y.; Wan, G. Rapid determination of puerarin by near-infrared spectroscopy during percolation and concentration process of puerariae lobatae radix. Pharmacogn. Mag. 2016, 12, 188–192. [Google Scholar]
- Katarzyna, W.O.; Igor, K.; Ewa, S. Evaluation of quality parameters of apple juices using near-infrared spectroscopy and chemometrics. J. Spectrosc. 2018, 2018, 5191283. [Google Scholar]
- Nascimento, P.A.M.; Carvalho, L.C.D.; Júnior, L.C.C.; Pereira, F.M.V. Robust PLS models for soluble solids content and firmness determination in low chilling peach using near-infrared spectroscopy (NIR). Postharvest Biol. Technol. 2016, 111, 345–351. [Google Scholar] [CrossRef] [Green Version]
- Martinez-Valdivieso, D.; Font, R.; Gomez, P.; Blanco-Diaz, T.; Del Rio-Celestino, M. Determining the mineral composition in Cucurbita pepo fruit using near infrared reflectance spectroscopy. J. Sci. Food Agric. 2014, 94, 3171–3180. [Google Scholar] [CrossRef] [PubMed]


| Samples | Components (%) | Data Set | Number | Min | Max | Mean | Range | SD |
|---|---|---|---|---|---|---|---|---|
| Fresh mulberry leaves | Water content | Total | 110 | 60.44 | 78.46 | 68.24 | 18.02 | 3.75 |
| Cal | 83 | 60.58 | 77.81 | 68.28 | 17.22 | 3.66 | ||
| Pre | 27 | 60.44 | 78.46 | 68.14 | 18.02 | 4.06 | ||
| Dry mulberry leaves | Crude protein | Total | 101 | 11.10 | 23.50 | 17.41 | 12.40 | 2.27 |
| Cal | 77 | 11.10 | 23.50 | 17.50 | 12.40 | 2.34 | ||
| Pre | 24 | 11.80 | 21.60 | 17.14 | 9.80 | 2.03 | ||
| Soluble sugar | Total | 104 | 8.47 | 31.01 | 19.97 | 22.54 | 3.92 | |
| Cal | 80 | 8.55 | 31.01 | 20.09 | 22.46 | 3.91 | ||
| Pre | 24 | 8.47 | 26.62 | 19.59 | 18.15 | 4.04 |
| Components | Pretreatment Method | LVs | RMSEC (%) | RMSECV (%) | ||
|---|---|---|---|---|---|---|
| Water content | None | 7 | 1.18 | 0.89 | 1.34 | 0.86 |
| 1st Der+ mean center | 7 | 1.09 | 0.91 | 1.32 | 0.87 | |
| SNV+ mean center | 7 | 1.04 | 0.92 | 1.21 | 0.89 | |
| autoscaling | 7 | 1.23 | 0.89 | 1.46 | 0.84 | |
| 1st Der+ SNV+ mean center | 7 | 1.06 | 0.92 | 1.25 | 0.88 | |
| 1st Der+ autoscaling | 7 | 1.19 | 0.89 | 1.38 | 0.86 | |
| SNV+ autoscaling | 7 | 1.08 | 0.91 | 1.24 | 0.88 | |
| 1st Der+ SNV+ autoscaling | 7 | 1.00 | 0.92 | 1.17 | 0.90 | |
| Crude protein | None | 9 | 0.89 | 0.85 | 1.11 | 0.78 |
| SNV+ mean center | 8 | 0.82 | 0.88 | 1.00 | 0.82 | |
| 1st Der+ mean center | 9 | 0.85 | 0.87 | 1.08 | 0.79 | |
| autoscaling | 9 | 0.88 | 0.86 | 1.10 | 0.78 | |
| 1st Der+ SNV+ mean center | 8 | 0.80 | 0.88 | 0.97 | 0.83 | |
| 1st Der+ autoscaling | 8 | 0.86 | 0.86 | 1.05 | 0.80 | |
| SNV+ autoscaling | 8 | 0.76 | 0.89 | 0.97 | 0.83 | |
| 1st Der+ SNV+ autoscaling | 8 | 0.74 | 0.90 | 0.97 | 0.83 | |
| Soluble sugar | None | 9 | 2.56 | 0.56 | 3.21 | 0.35 |
| SNV+ mean center | 8 | 2.52 | 0.58 | 3.33 | 0.32 | |
| 1st Der+ mean center | 8 | 2.43 | 0.61 | 3.14 | 0.37 | |
| autoscaling | 9 | 2.53 | 0.57 | 3.30 | 0.33 | |
| 1st Der+ SNV+ mean center | 8 | 2.53 | 0.58 | 3.18 | 0.36 | |
| 1st Der+ autoscaling | 8 | 2.52 | 0.58 | 3.09 | 0.40 | |
| SNV+ autoscaling | 7 | 2.54 | 0.57 | 3.08 | 0.39 | |
| 1st Der+ SNV+ autoscaling | 7 | 2.45 | 0.60 | 2.90 | 0.45 |
| Components | Methods | LVs | RMSEC (%) | RMSECV (%) | RMSEP (%) | RPDCV | RPDR | RER | |||
|---|---|---|---|---|---|---|---|---|---|---|---|
| Water content | PLS | 7 | 1.00 | 0.92 | 1.17 | 0.90 | 1.22 | 0.91 | 3.14 | 3.33 | 14.80 |
| CARS-PLS | 7 | 0.95 | 0.93 | 1.11 | 0.91 | 1.21 | 0.91 | 3.30 | 3.36 | 14.93 | |
| UVE-PLS | 7 | 0.94 | 0.93 | 1.10 | 0.91 | 1.19 | 0.91 | 3.34 | 3.41 | 15.12 | |
| RF-PLS | 7 | 0.96 | 0.93 | 1.13 | 0.90 | 1.18 | 0.91 | 3.25 | 3.43 | 15.21 | |
| Crude protein | PLS | 8 | 0.74 | 0.90 | 0.97 | 0.83 | 0.67 | 0.89 | 2.42 | 3.02 | 14.56 |
| CARS-PLS | 9 | 0.71 | 0.91 | 0.97 | 0.83 | 0.61 | 0.92 | 2.43 | 3.34 | 16.11 | |
| UVE-PLS | 7 | 0.73 | 0.90 | 0.86 | 0.86 | 0.64 | 0.91 | 2.74 | 3.19 | 15.39 | |
| RF-PLS | 7 | 0.74 | 0.90 | 0.88 | 0.86 | 0.65 | 0.90 | 2.67 | 3.11 | 14.99 | |
| Soluble sugar | PLS | 7 | 2.45 | 0.60 | 2.90 | 0.45 | 2.57 | 0.64 | 1.35 | 1.19 | 4.54 |
| CARS-PLS | 9 | 2.32 | 0.64 | 2.84 | 0.48 | 2.37 | 0.72 | 1.38 | 1.28 | 4.92 | |
| UVE-PLS | 8 | 2.33 | 0.64 | 2.73 | 0.51 | 2.36 | 0.71 | 1.43 | 1.29 | 4.93 | |
| RF-PLS | 10 | 2.27 | 0.66 | 2.84 | 0.48 | 2.40 | 0.71 | 1.38 | 1.27 | 4.86 |
| Comp Onents | No. | Measured Value | Predicted Value | Absolute Error | Relative Error | No. | Measured Value | Predicted Value | Absolute Error | Relative Error |
|---|---|---|---|---|---|---|---|---|---|---|
| Water content (n = 27) | W1 | 60.44 | 61.94 | 1.50 | 2.48 | W15 | 68.32 | 70.48 | 2.16 | 3.16 |
| W2 | 63.22 | 63.19 | −0.03 | −0.04 | W16 | 68.53 | 67.19 | −1.35 | −1.97 | |
| W3 | 63.84 | 63.98 | 0.14 | 0.21 | W17 | 68.95 | 69.83 | 0.88 | 1.28 | |
| W4 | 64.07 | 64.43 | 0.37 | 0.57 | W18 | 69.14 | 69.78 | 0.65 | 0.93 | |
| W5 | 64.44 | 65.42 | 0.98 | 1.53 | W19 | 69.62 | 71.12 | 1.50 | 2.15 | |
| W6 | 65.06 | 65.52 | 0.46 | 0.71 | W20 | 70.00 | 69.99 | 0.00 | 0.00 | |
| W7 | 65.18 | 66.80 | 1.62 | 2.49 | W21 | 70.23 | 69.46 | −0.77 | −1.10 | |
| W8 | 65.48 | 65.69 | 0.21 | 0.33 | W22 | 71.04 | 69.88 | −1.16 | −1.63 | |
| W9 | 65.87 | 65.21 | −0.66 | −1.00 | W23 | 71.50 | 72.71 | 1.21 | 1.69 | |
| W10 | 66.01 | 66.54 | 0.53 | 0.80 | W24 | 72.22 | 73.45 | 1.23 | 1.70 | |
| W11 | 66.26 | 66.30 | 0.04 | 0.05 | W25 | 74.88 | 76.41 | 1.53 | 2.04 | |
| W12 | 66.64 | 65.27 | −1.37 | −2.05 | W26 | 75.49 | 73.74 | −1.75 | −2.32 | |
| W13 | 66.97 | 67.95 | 0.99 | 1.48 | W27 | 78.46 | 75.89 | −2.58 | −3.28 | |
| W14 | 67.86 | 66.75 | −1.11 | −1.63 | ||||||
| Crude protein (n = 20) | P1 | 11.80 | 12.29 | 0.49 | 4.13 | P13 | 17.10 | 16.98 | −0.12 | −0.70 |
| P2 | 14.90 | 14.41 | −0.49 | −3.29 | P14 | 17.40 | 17.94 | 0.54 | 3.12 | |
| P3 | 15.10 | 14.58 | −0.52 | −3.43 | P15 | 17.60 | 16.67 | −0.93 | −5.28 | |
| P4 | 15.20 | 15.52 | 0.32 | 2.08 | P16 | 17.90 | 17.87 | −0.03 | −0.19 | |
| P5 | 15.50 | 15.94 | 0.44 | 2.85 | P17 | 18.20 | 18.08 | −0.12 | −0.63 | |
| P6 | 15.70 | 15.79 | 0.09 | 0.60 | P18 | 18.40 | 19.37 | 0.97 | 5.26 | |
| P7 | 16.10 | 15.48 | −0.62 | -3.83 | P19 | 18.70 | 20.06 | 1.36 | 7.30 | |
| P8 | 16.20 | 16.63 | 0.43 | 2.63 | P20 | 18.90 | 17.59 | −1.31 | −6.95 | |
| P9 | 16.40 | 16.45 | 0.05 | 0.33 | P21 | 19.10 | 19.39 | 0.29 | 1.52 | |
| P10 | 16.40 | 16.48 | 0.08 | 0.51 | P22 | 19.50 | 19.92 | 0.42 | 2.16 | |
| P11 | 16.80 | 16.24 | −0.56 | −3.34 | P23 | 19.80 | 20.74 | 0.94 | 4.73 | |
| P12 | 17.00 | 16.82 | −0.18 | −1.04 | P24 | 21.60 | 21.85 | 0.25 | 1.16 | |
| Soluble sugar (n = 21) | S1 | 14.97 | 17.58 | 2.61 | 17.43 | S12 | 20.35 | 23.35 | 3.00 | 14.74 |
| S2 | 15.79 | 19.12 | 3.33 | 21.09 | S13 | 20.52 | 17.48 | −3.04 | −14.81 | |
| S3 | 17.15 | 17.14 | −0.01 | −0.06 | S14 | 20.84 | 20.53 | −0.31 | −1.49 | |
| S4 | 17.69 | 18.69 | 1.00 | 5.65 | S15 | 21.31 | 20.20 | −1.11 | −5.21 | |
| S5 | 18.02 | 17.75 | −0.27 | −1.50 | S16 | 22.32 | 20.21 | −2.11 | −9.45 | |
| S6 | 18.32 | 20.26 | 1.94 | 10.59 | S17 | 22.88 | 22.84 | −0.04 | −0.17 | |
| S7 | 18.44 | 17.76 | −0.68 | −3.69 | S18 | 23.05 | 21.72 | −1.33 | −5.77 | |
| S8 | 18.73 | 19.20 | 0.47 | 2.51 | S19 | 23.56 | 22.69 | −0.87 | −3.69 | |
| S9 | 18.87 | 21.29 | 2.42 | 12.82 | S20 | 24.08 | 23.28 | −0.80 | −3.32 | |
| S10 | 19.73 | 21.55 | 1.82 | 9.22 | S21 | 25.52 | 25.58 | 0.06 | 0.24 | |
| S11 | 19.91 | 21.34 | 1.43 | 7.18 | S22 | 26.62 | 25.98 | −0.64 | −2.40 |
© 2019 by the authors. Licensee MDPI, Basel, Switzerland. This article is an open access article distributed under the terms and conditions of the Creative Commons Attribution (CC BY) license (http://creativecommons.org/licenses/by/4.0/).
Share and Cite
Ma, Y.; Zhang, G.-Z.; Rita-Cindy, S.A.-A. Quantification of Water, Protein and Soluble Sugar in Mulberry Leaves Using a Handheld Near-Infrared Spectrometer and Multivariate Analysis. Molecules 2019, 24, 4439. https://doi.org/10.3390/molecules24244439
Ma Y, Zhang G-Z, Rita-Cindy SA-A. Quantification of Water, Protein and Soluble Sugar in Mulberry Leaves Using a Handheld Near-Infrared Spectrometer and Multivariate Analysis. Molecules. 2019; 24(24):4439. https://doi.org/10.3390/molecules24244439
Chicago/Turabian StyleMa, Yue, Guo-Zheng Zhang, and Sedjoah Aye-Ayire Rita-Cindy. 2019. "Quantification of Water, Protein and Soluble Sugar in Mulberry Leaves Using a Handheld Near-Infrared Spectrometer and Multivariate Analysis" Molecules 24, no. 24: 4439. https://doi.org/10.3390/molecules24244439
APA StyleMa, Y., Zhang, G.-Z., & Rita-Cindy, S. A.-A. (2019). Quantification of Water, Protein and Soluble Sugar in Mulberry Leaves Using a Handheld Near-Infrared Spectrometer and Multivariate Analysis. Molecules, 24(24), 4439. https://doi.org/10.3390/molecules24244439