Figure 1.
Effects of different feed ratios on the entrapment rate of solid dispersions.
Figure 1.
Effects of different feed ratios on the entrapment rate of solid dispersions.
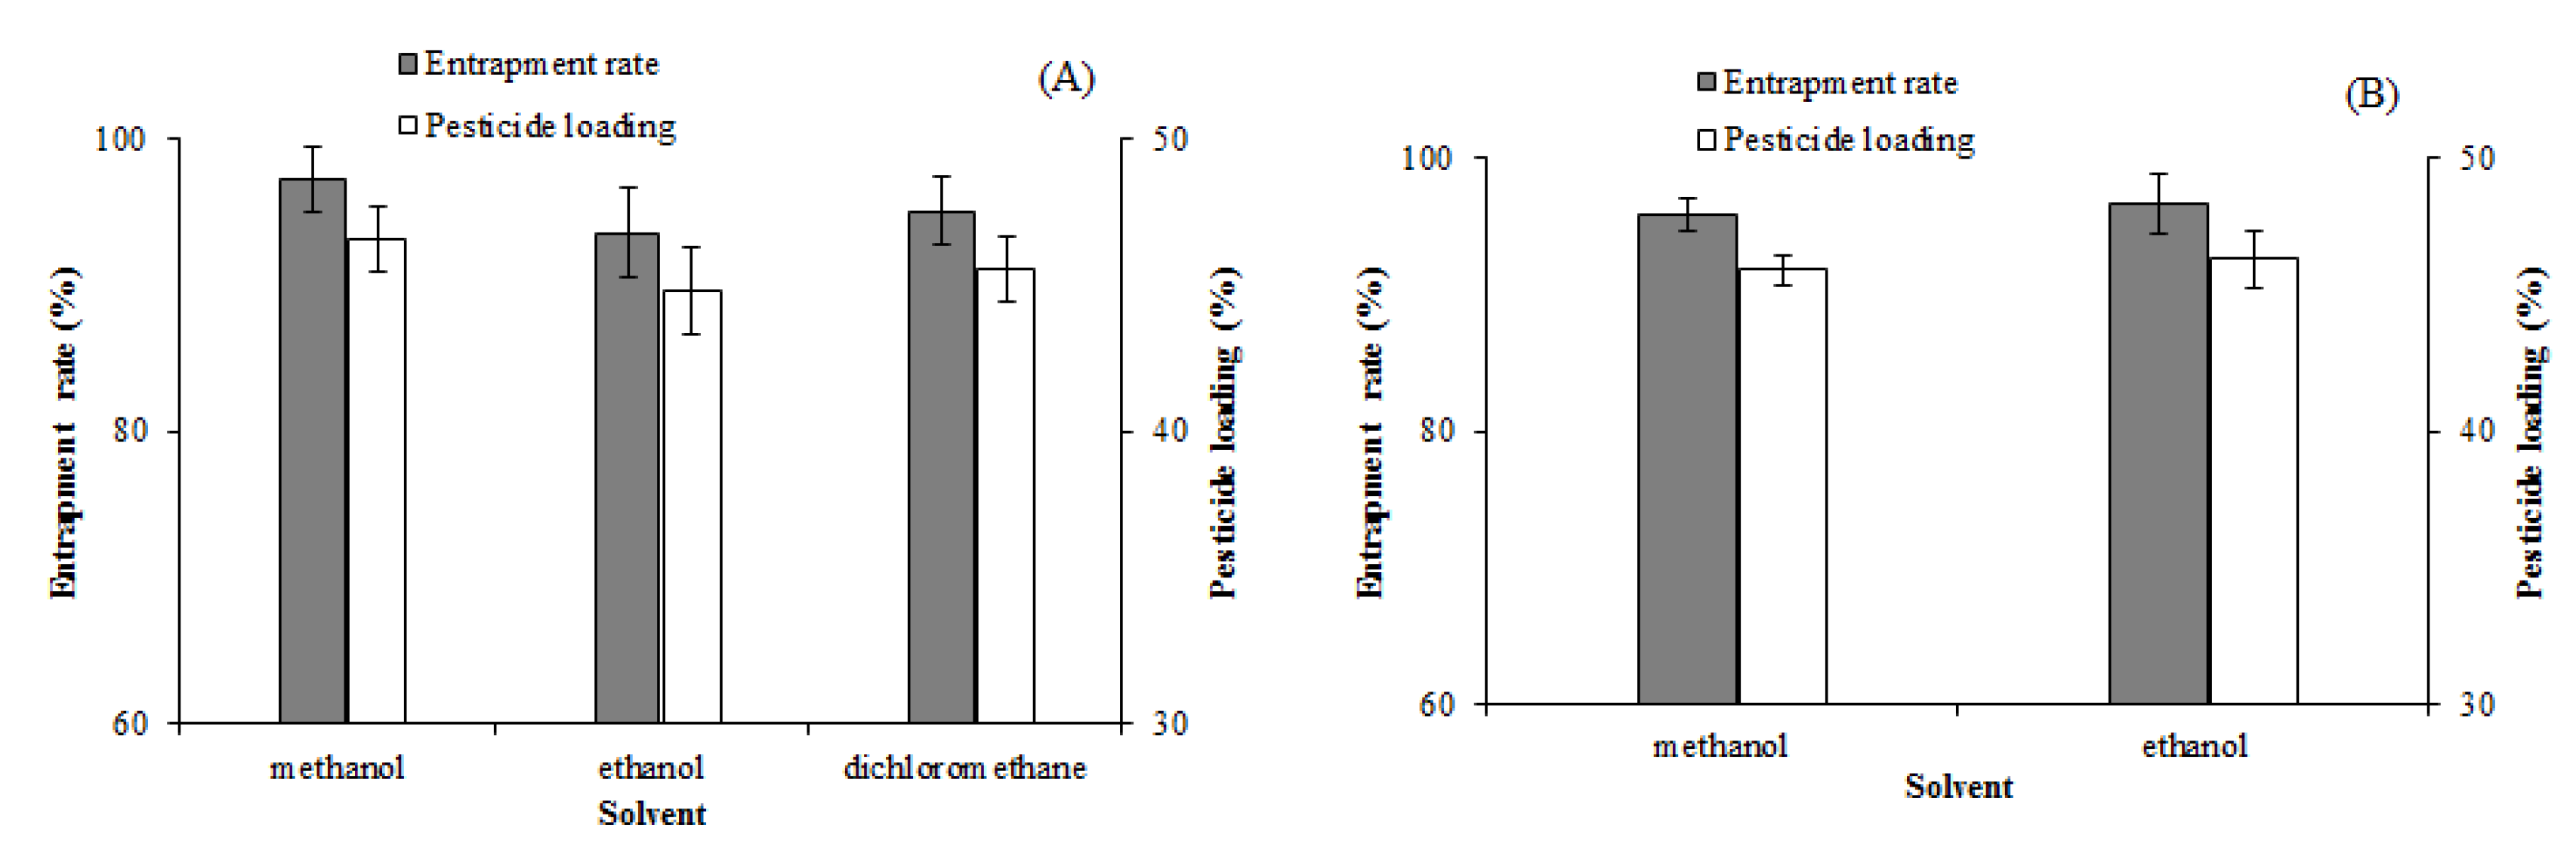
Figure 2.
Effects of different solvents on the entrapment rate and pesticide loading of solid dispersions. (A): EM-PVP-K30 solid dispersions. (B): EM-PRIII solid dispersions.
Figure 2.
Effects of different solvents on the entrapment rate and pesticide loading of solid dispersions. (A): EM-PVP-K30 solid dispersions. (B): EM-PRIII solid dispersions.
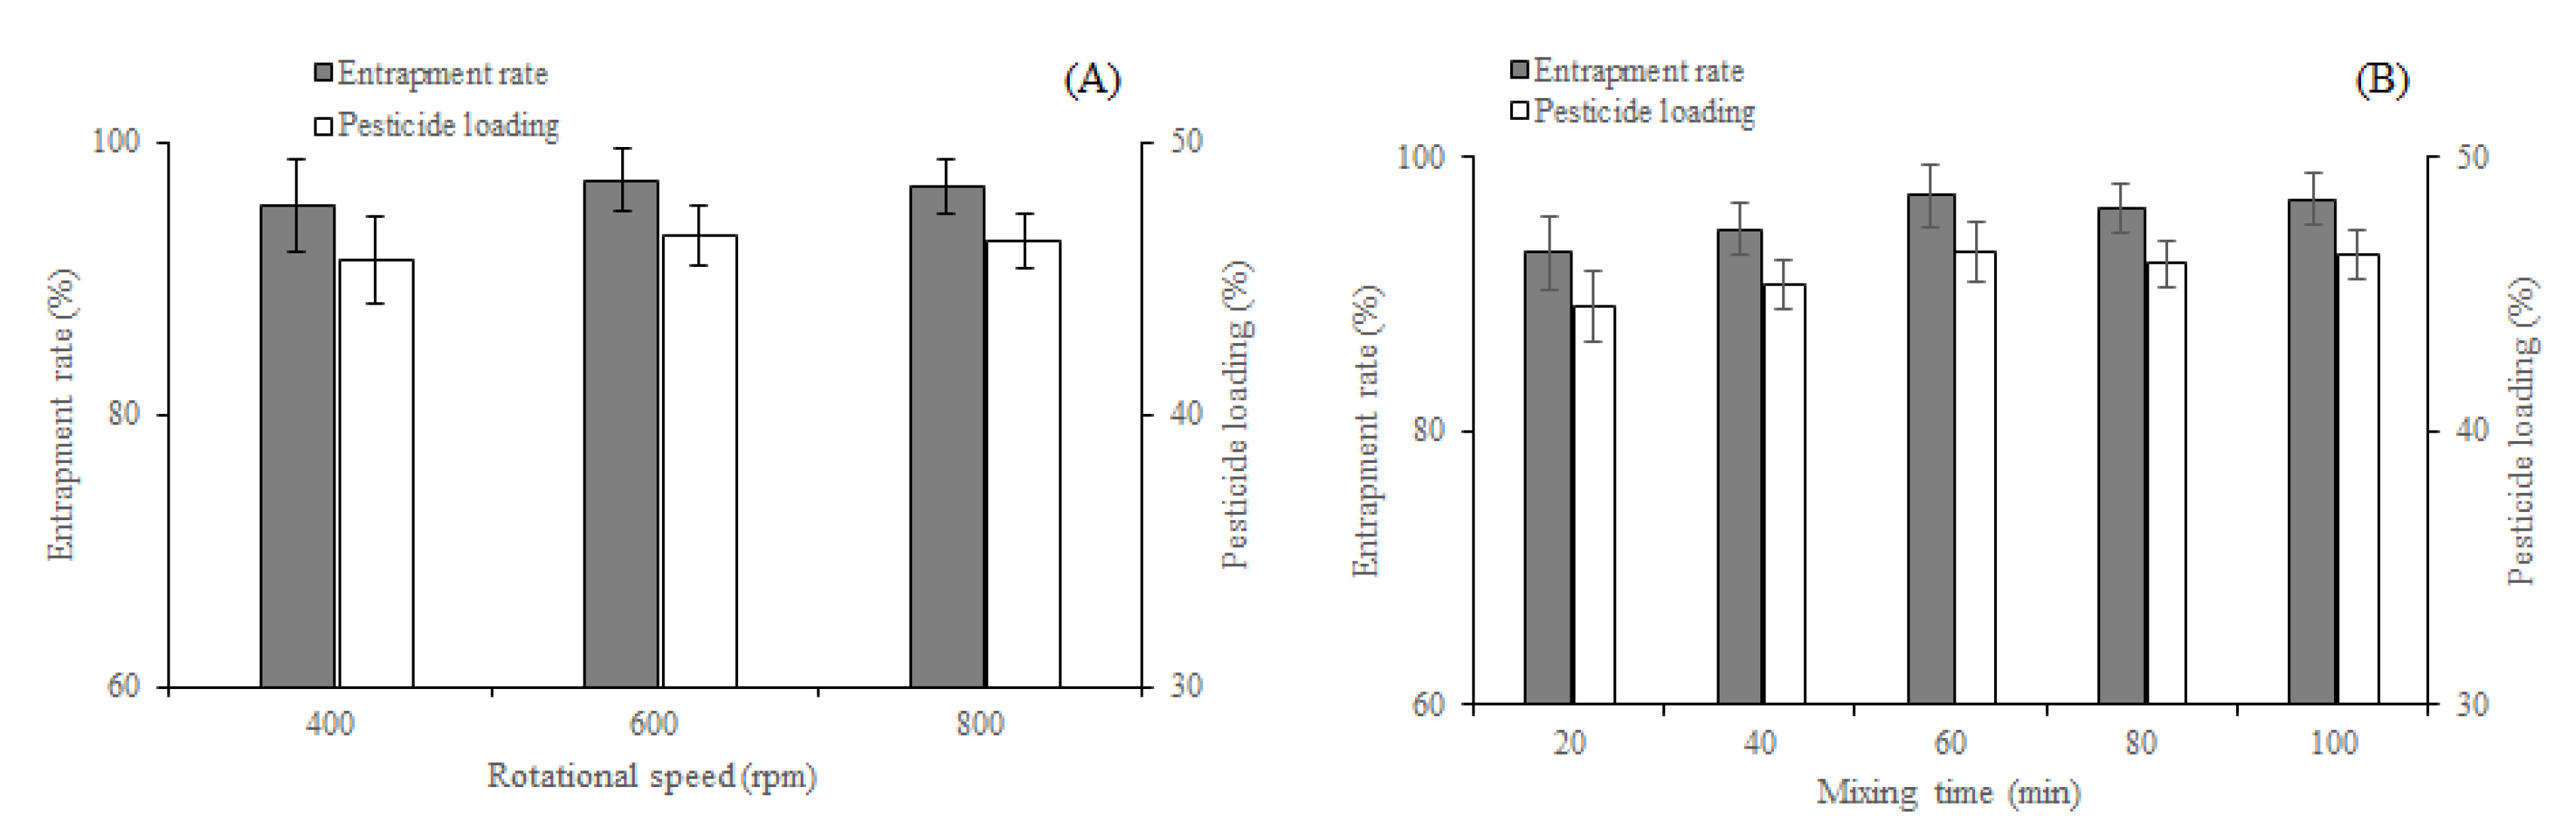
Figure 3.
Effects of (A) rotational speed and (B) mixing time on entrapment rate and pesticide loading of EM-PVP-K30 solid dispersions.
Figure 3.
Effects of (A) rotational speed and (B) mixing time on entrapment rate and pesticide loading of EM-PVP-K30 solid dispersions.
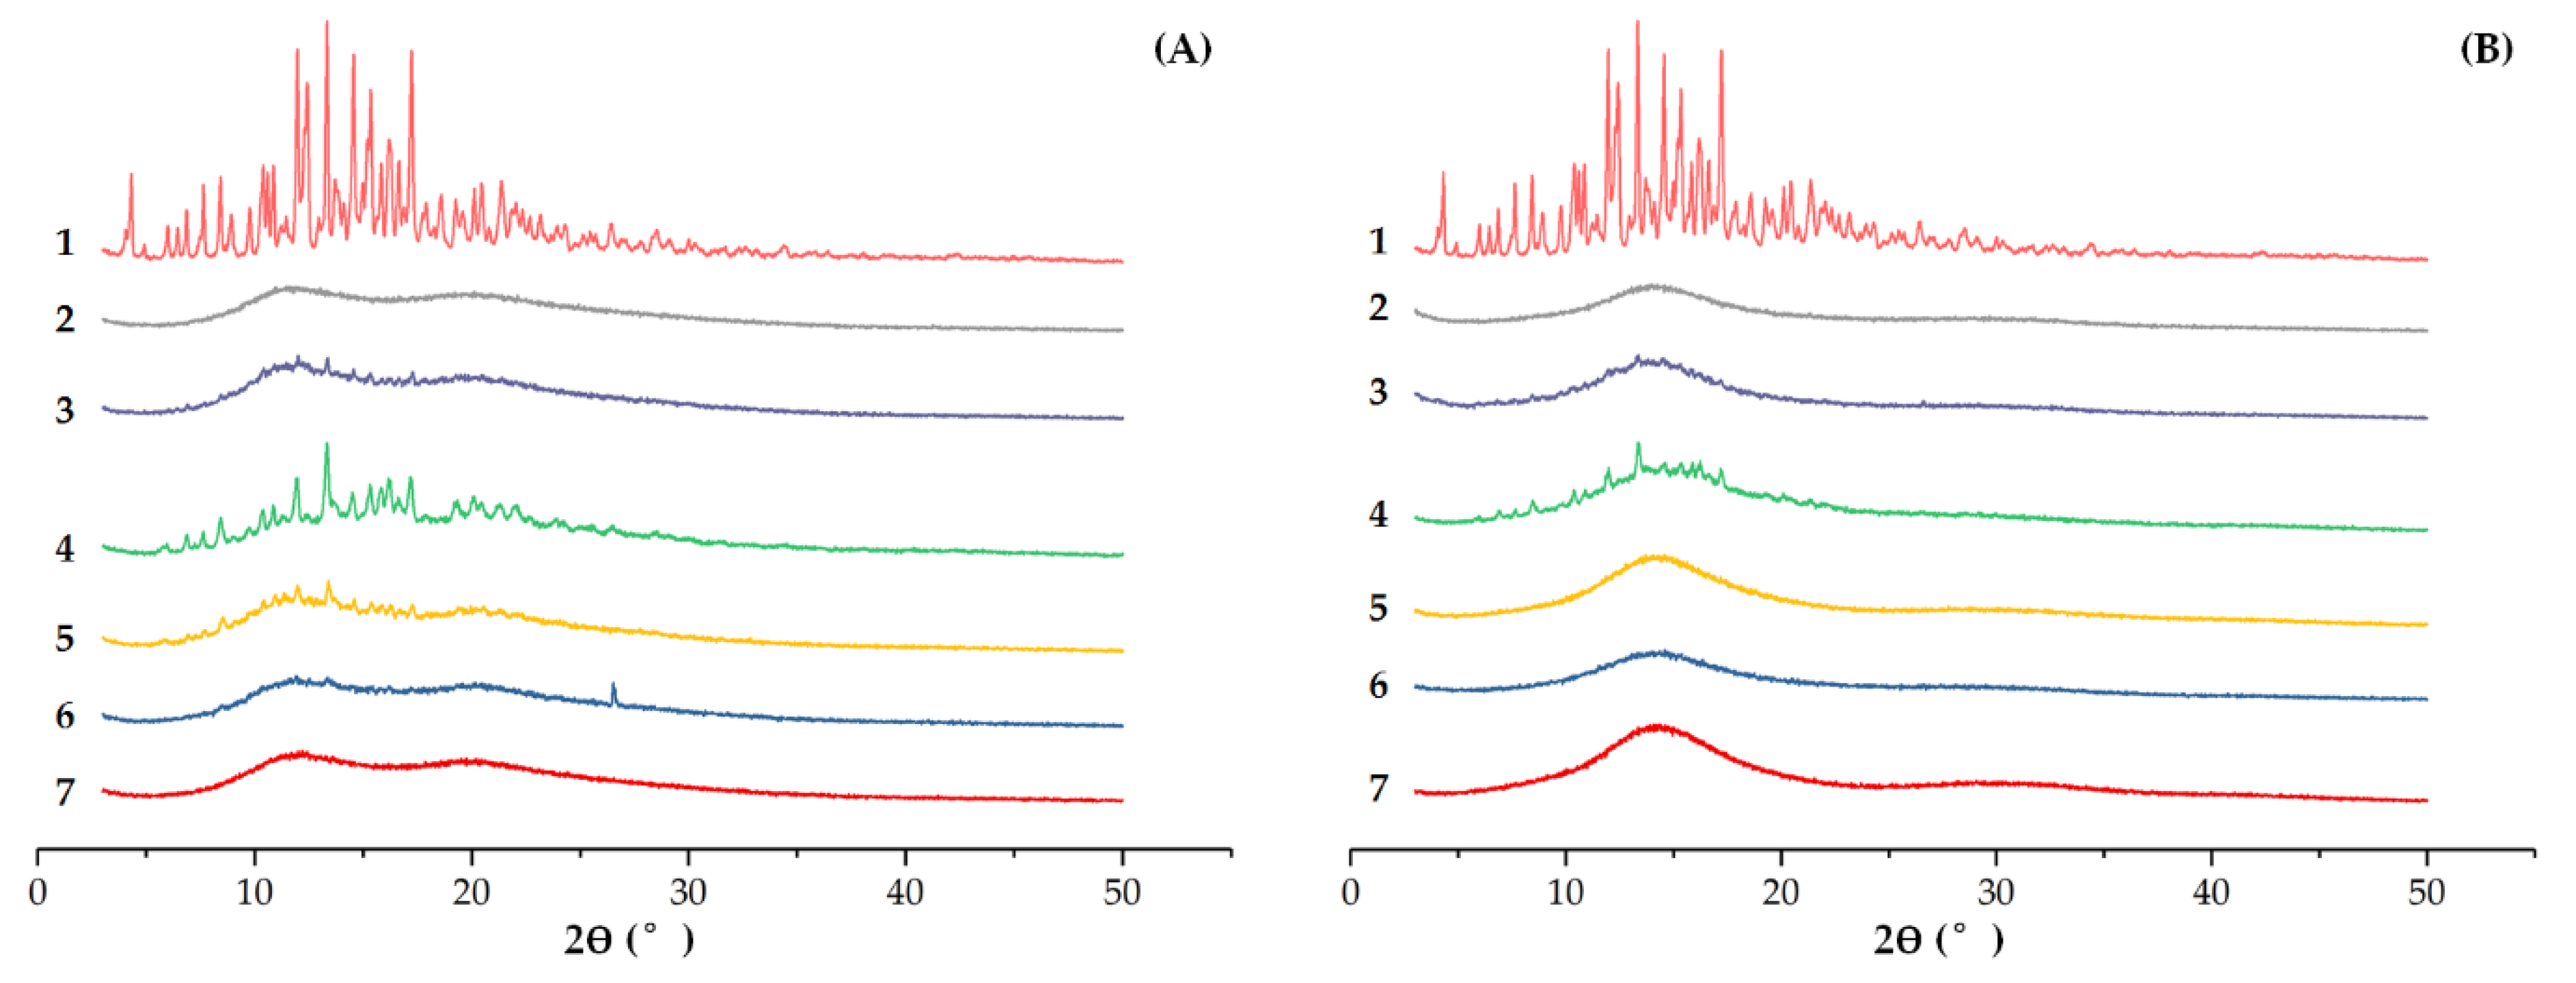
Figure 4.
XRD of (A) EM-PVP-K30 solid dispersions. (B) EM-PRIII solid dispersions. (A): (1) EM, (2) PVP-K30, (3) physical mixture of EM and PVP-K30, (4) 1:1 feed ratio EM-PVP-K30 solid dispersions, (5) 1:4 feed ratio EM-PVP-K30 solid dispersions, (6) 1:10 feed ratio EM-PVP-K30 solid dispersions, (7) 1:50 feed ratio EM-PVP-K30 solid dispersions; (B): (1) EM, (2) PRIII, (3) physical mixture of EM and PRIII, (4) 1:1 feed ratio EM-PRIII solid dispersions, (5) 1:4 feed ratio EM-PRIII solid dispersions, (6) 1:10 feed ratio EM-PRIII solid dispersions, and (7) 1:50 feed ratio EM-PRIII solid dispersions.
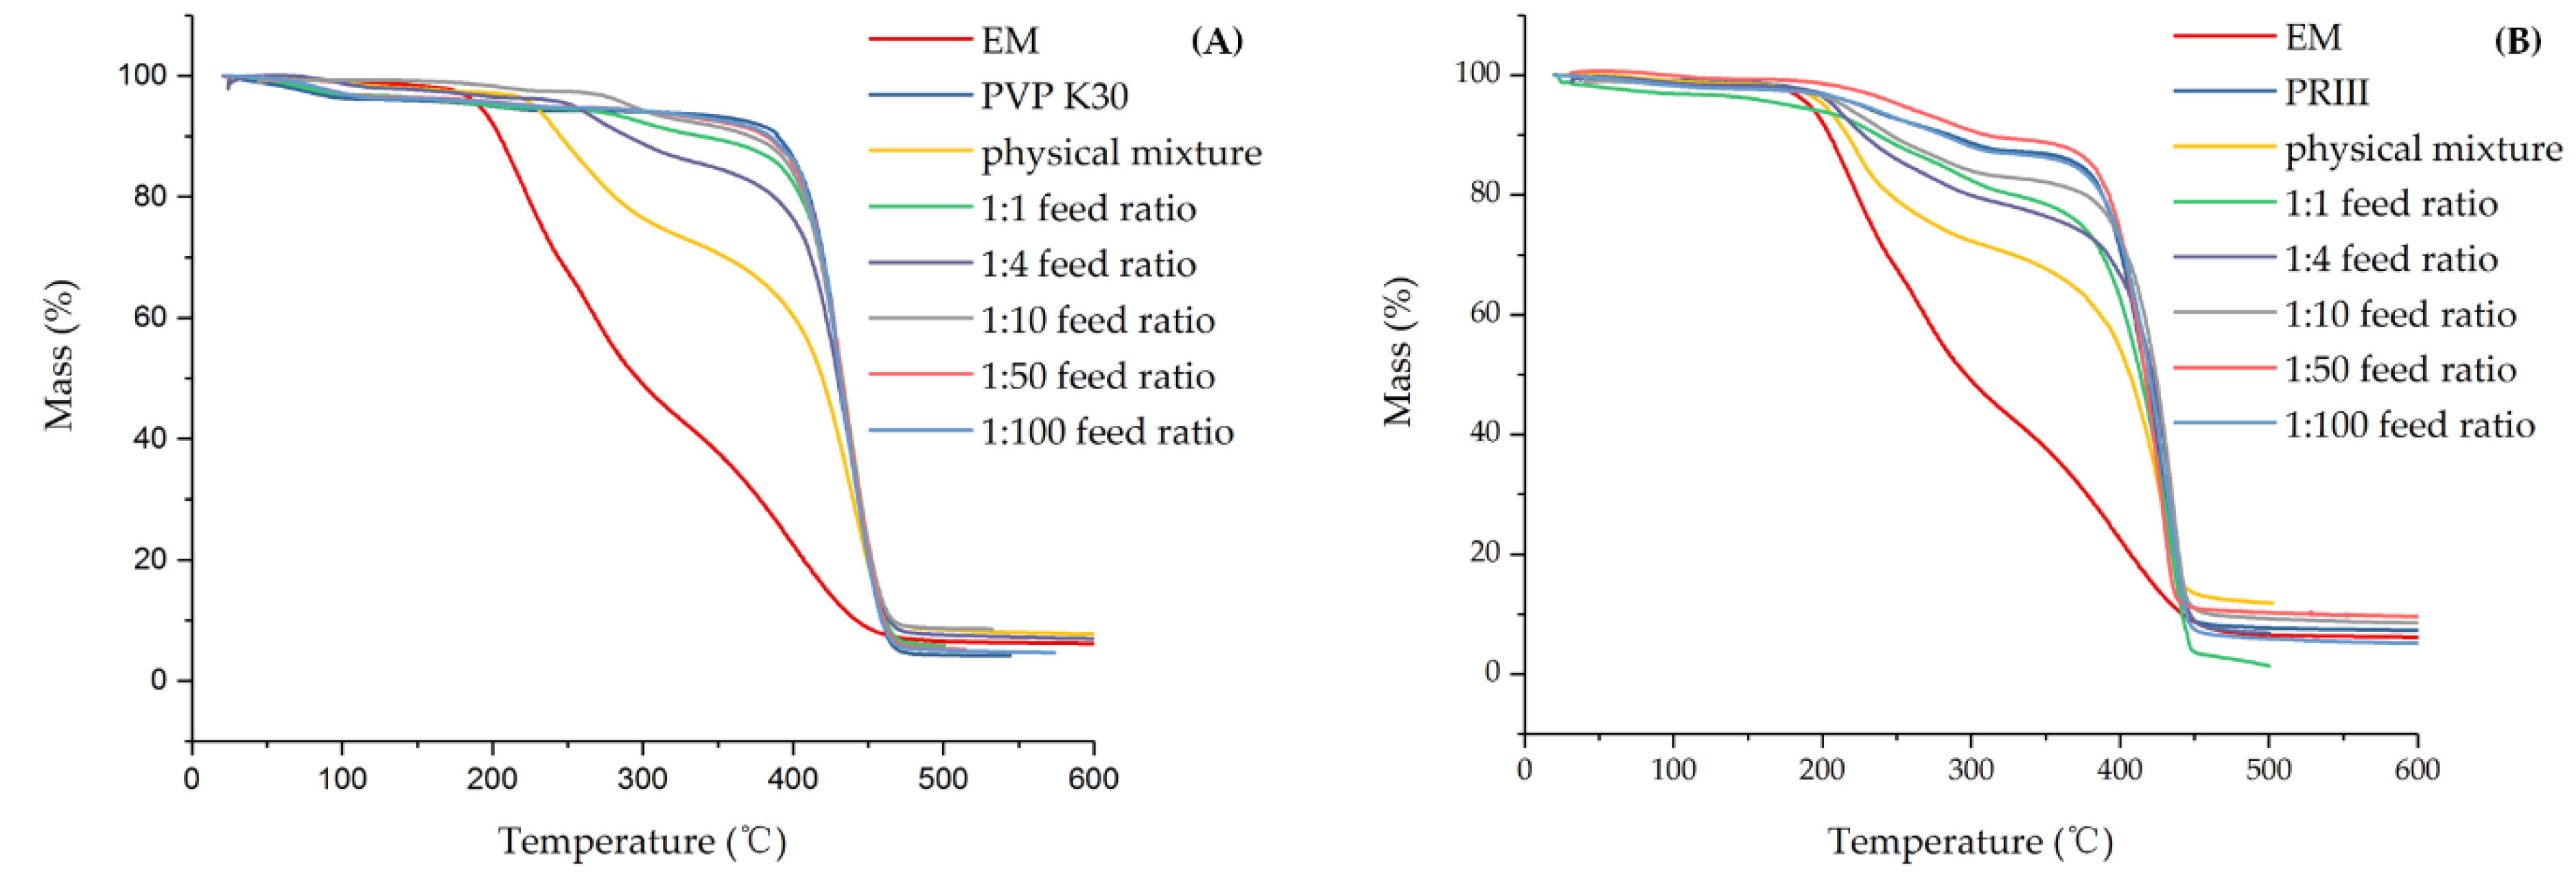
Figure 5.
TG of (A) EM, PVP K30, physical mixture, and EM-PVP-K30 solid dispersions. (B) EM, PRIII, physical mixture, and EM-PRIII solid dispersions.
Figure 5.
TG of (A) EM, PVP K30, physical mixture, and EM-PVP-K30 solid dispersions. (B) EM, PRIII, physical mixture, and EM-PRIII solid dispersions.
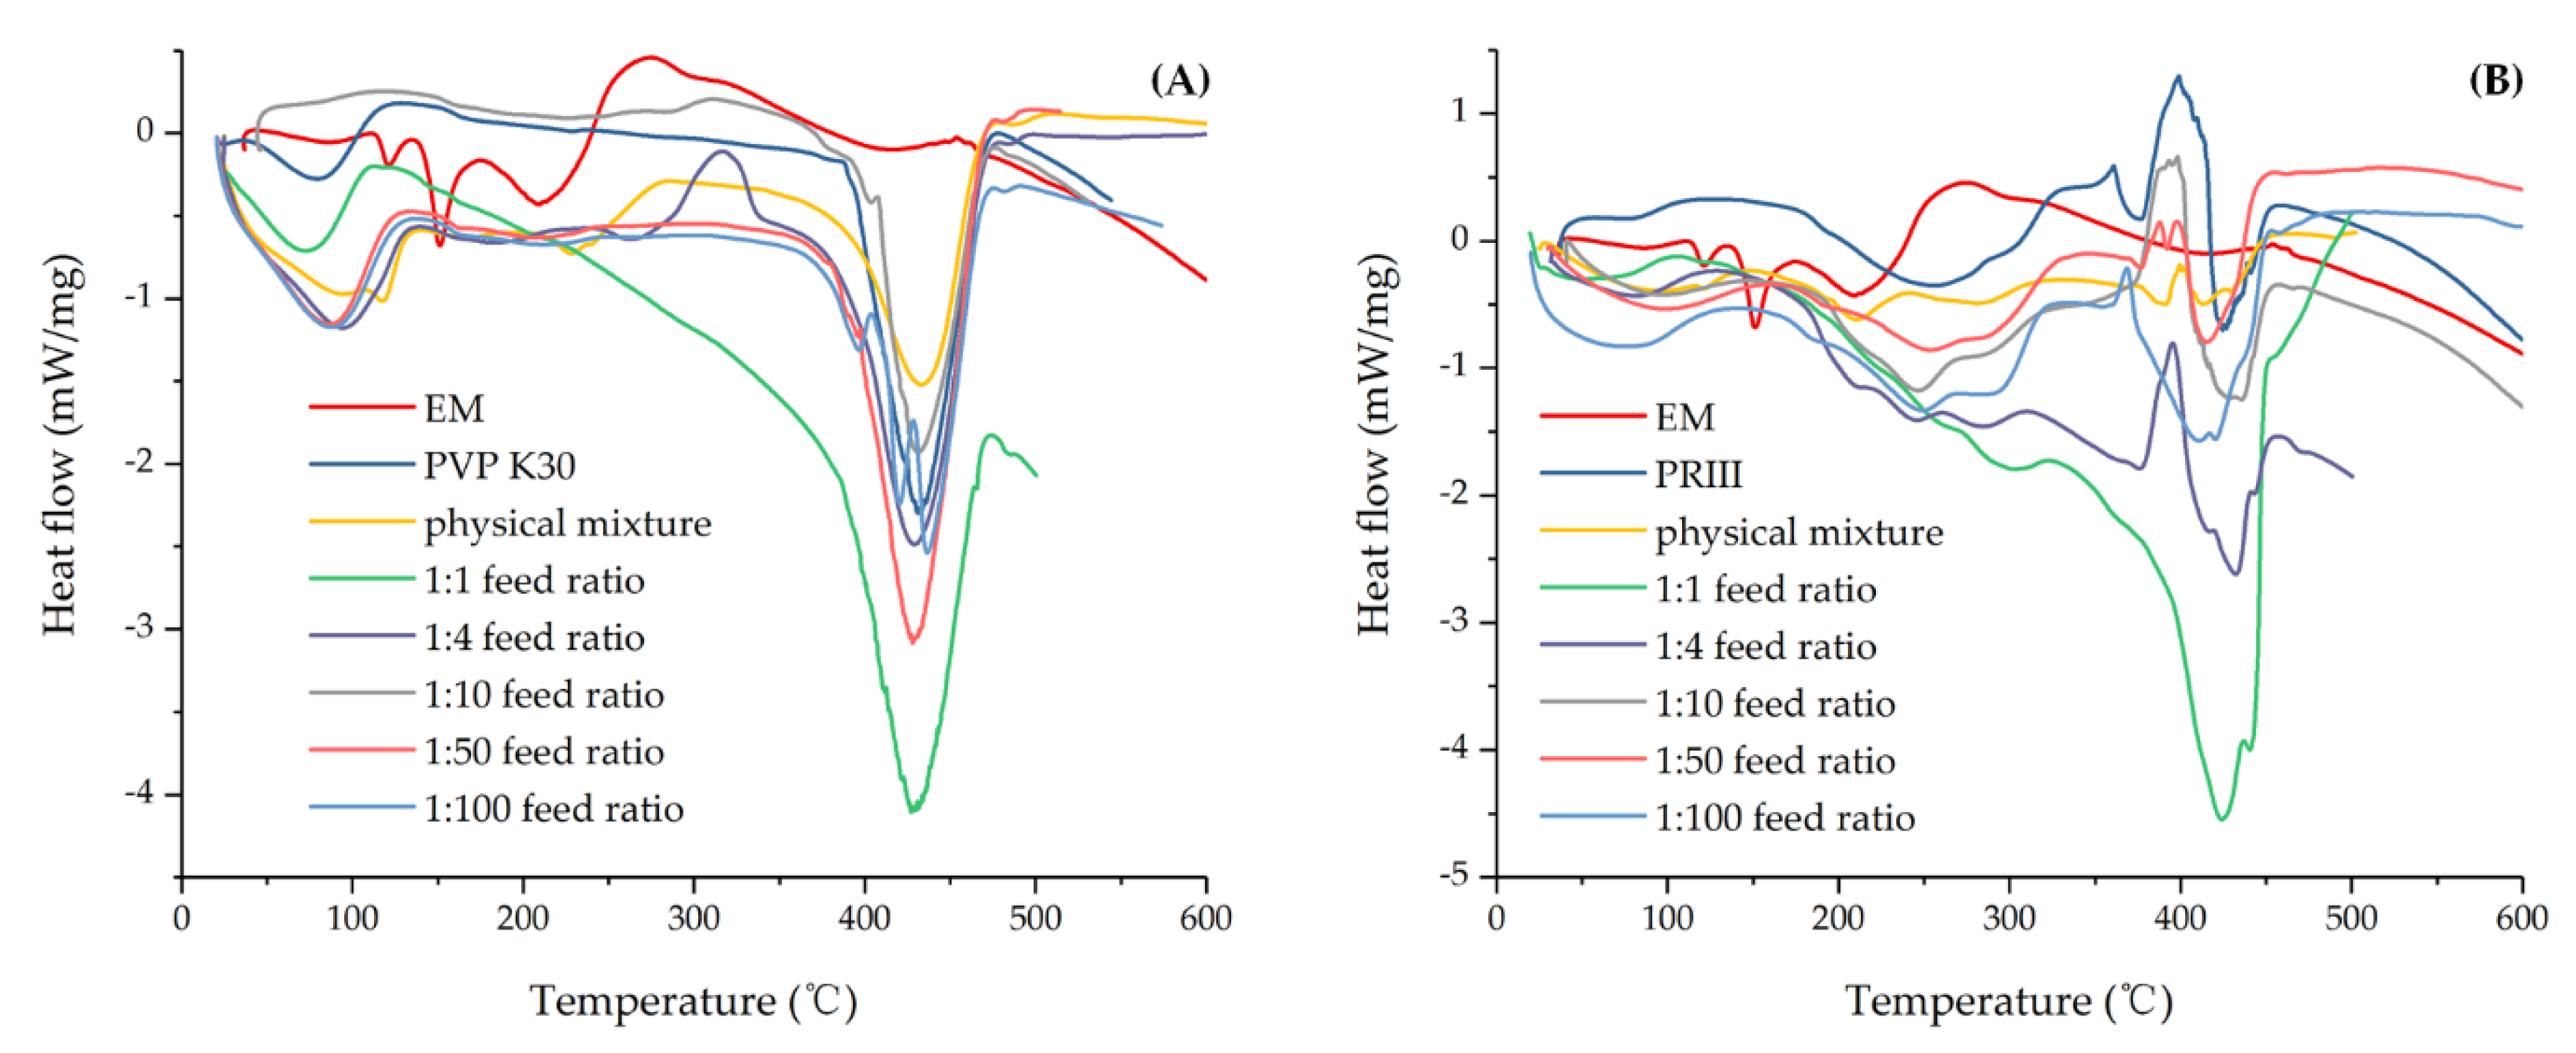
Figure 6.
DSC of (A) EM, PVP K30, physical mixture, and EM-PVP-K30 solid dispersions. (B) EM, PRIII, physical mixture, and EM-PRIII solid dispersions.
Figure 6.
DSC of (A) EM, PVP K30, physical mixture, and EM-PVP-K30 solid dispersions. (B) EM, PRIII, physical mixture, and EM-PRIII solid dispersions.
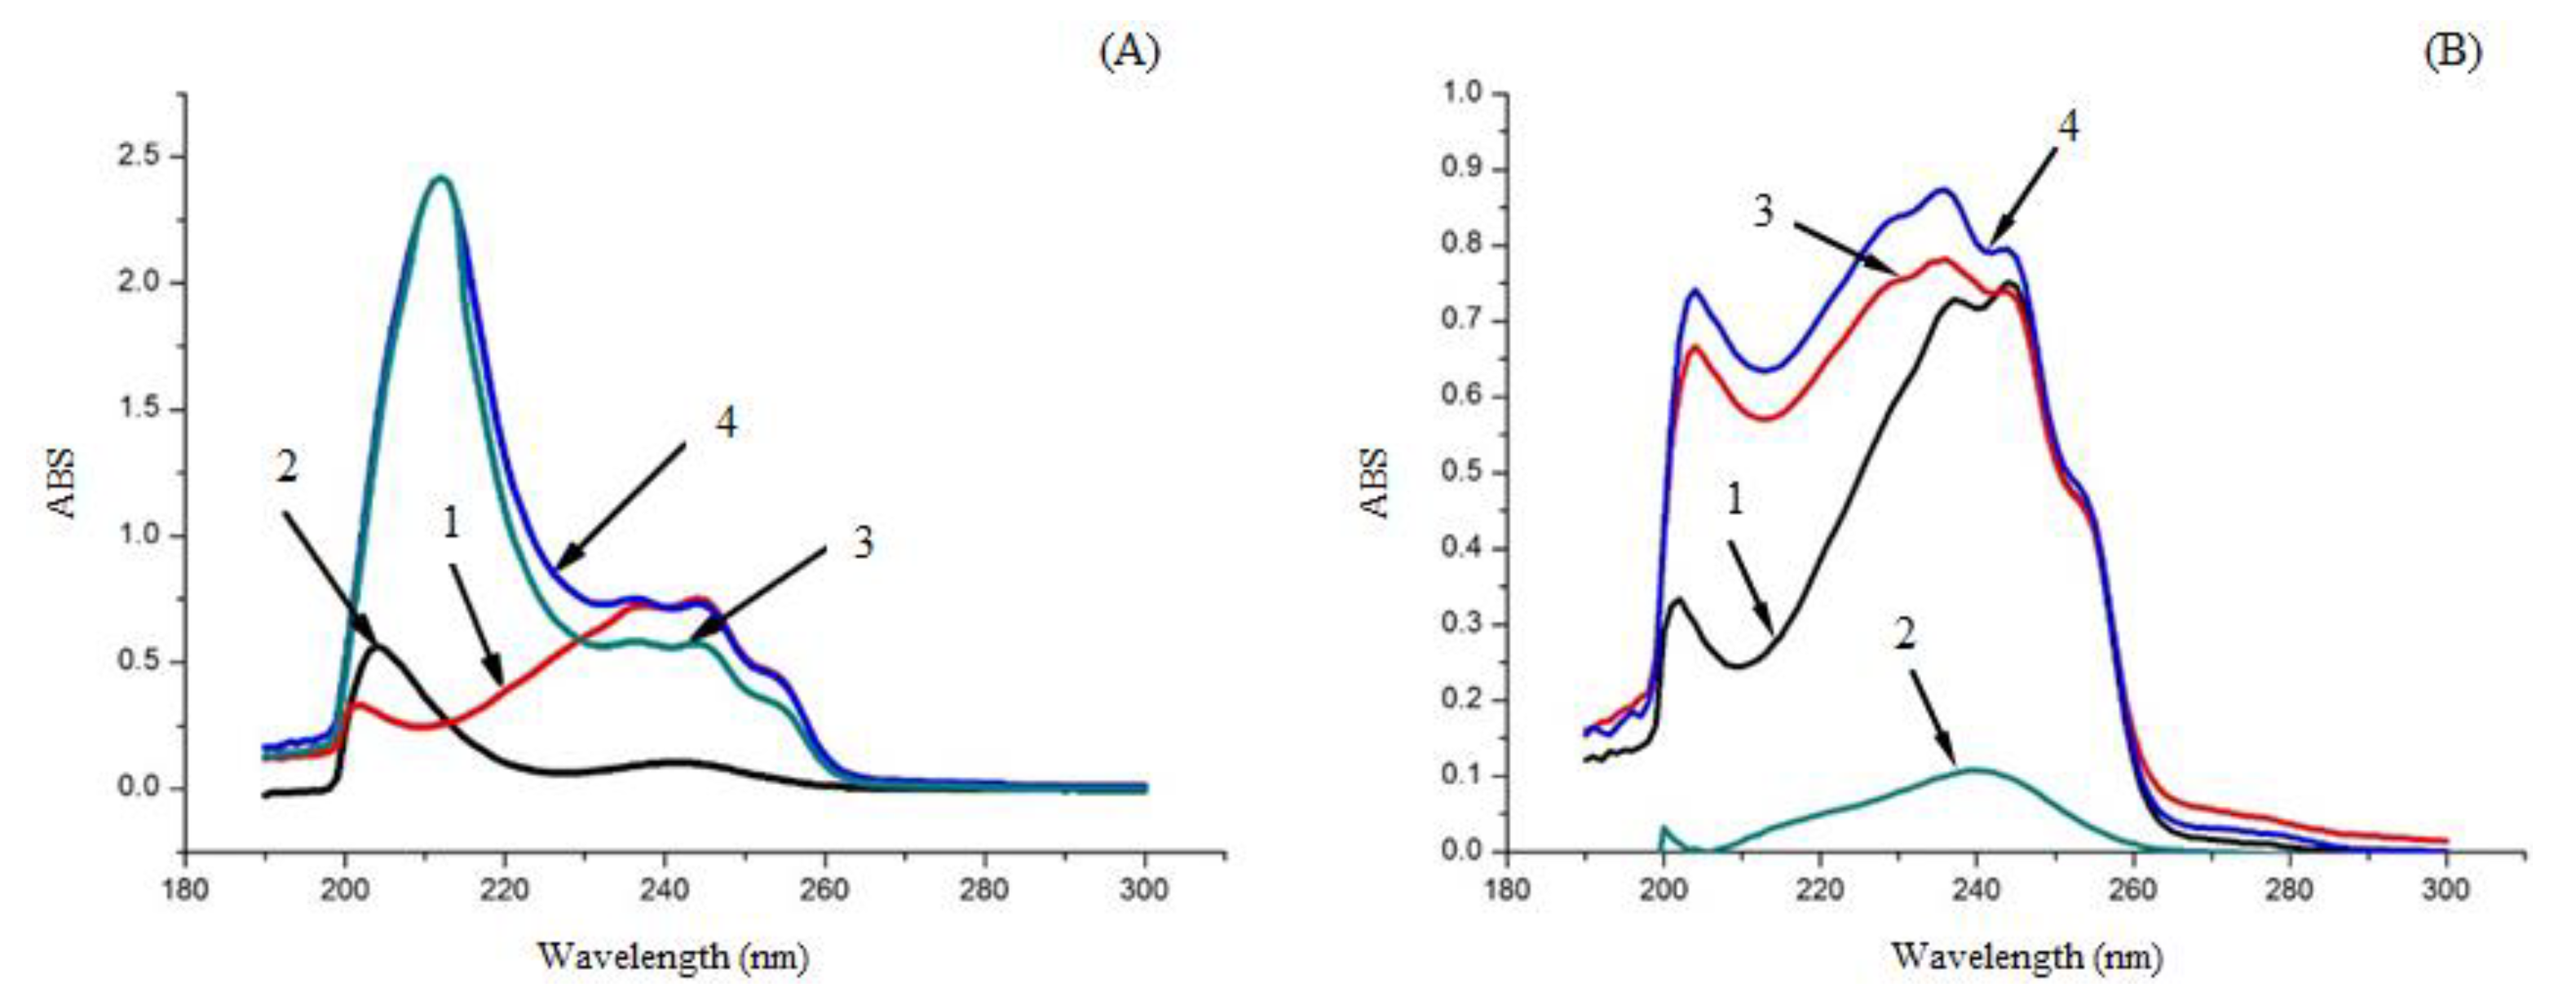
Figure 7.
UV Spectrometry of different samples. (A): 1) EM, 2) PVP-K30, 3) EM-PVP-K30 solid dispersions, 4) physical mixture of EM and PVP-K30; (B): 1) EM, 2) PRIII, 3) EM-PRIII solid dispersions, and 4) physical mixture of EM and PRIII.
Figure 7.
UV Spectrometry of different samples. (A): 1) EM, 2) PVP-K30, 3) EM-PVP-K30 solid dispersions, 4) physical mixture of EM and PVP-K30; (B): 1) EM, 2) PRIII, 3) EM-PRIII solid dispersions, and 4) physical mixture of EM and PRIII.
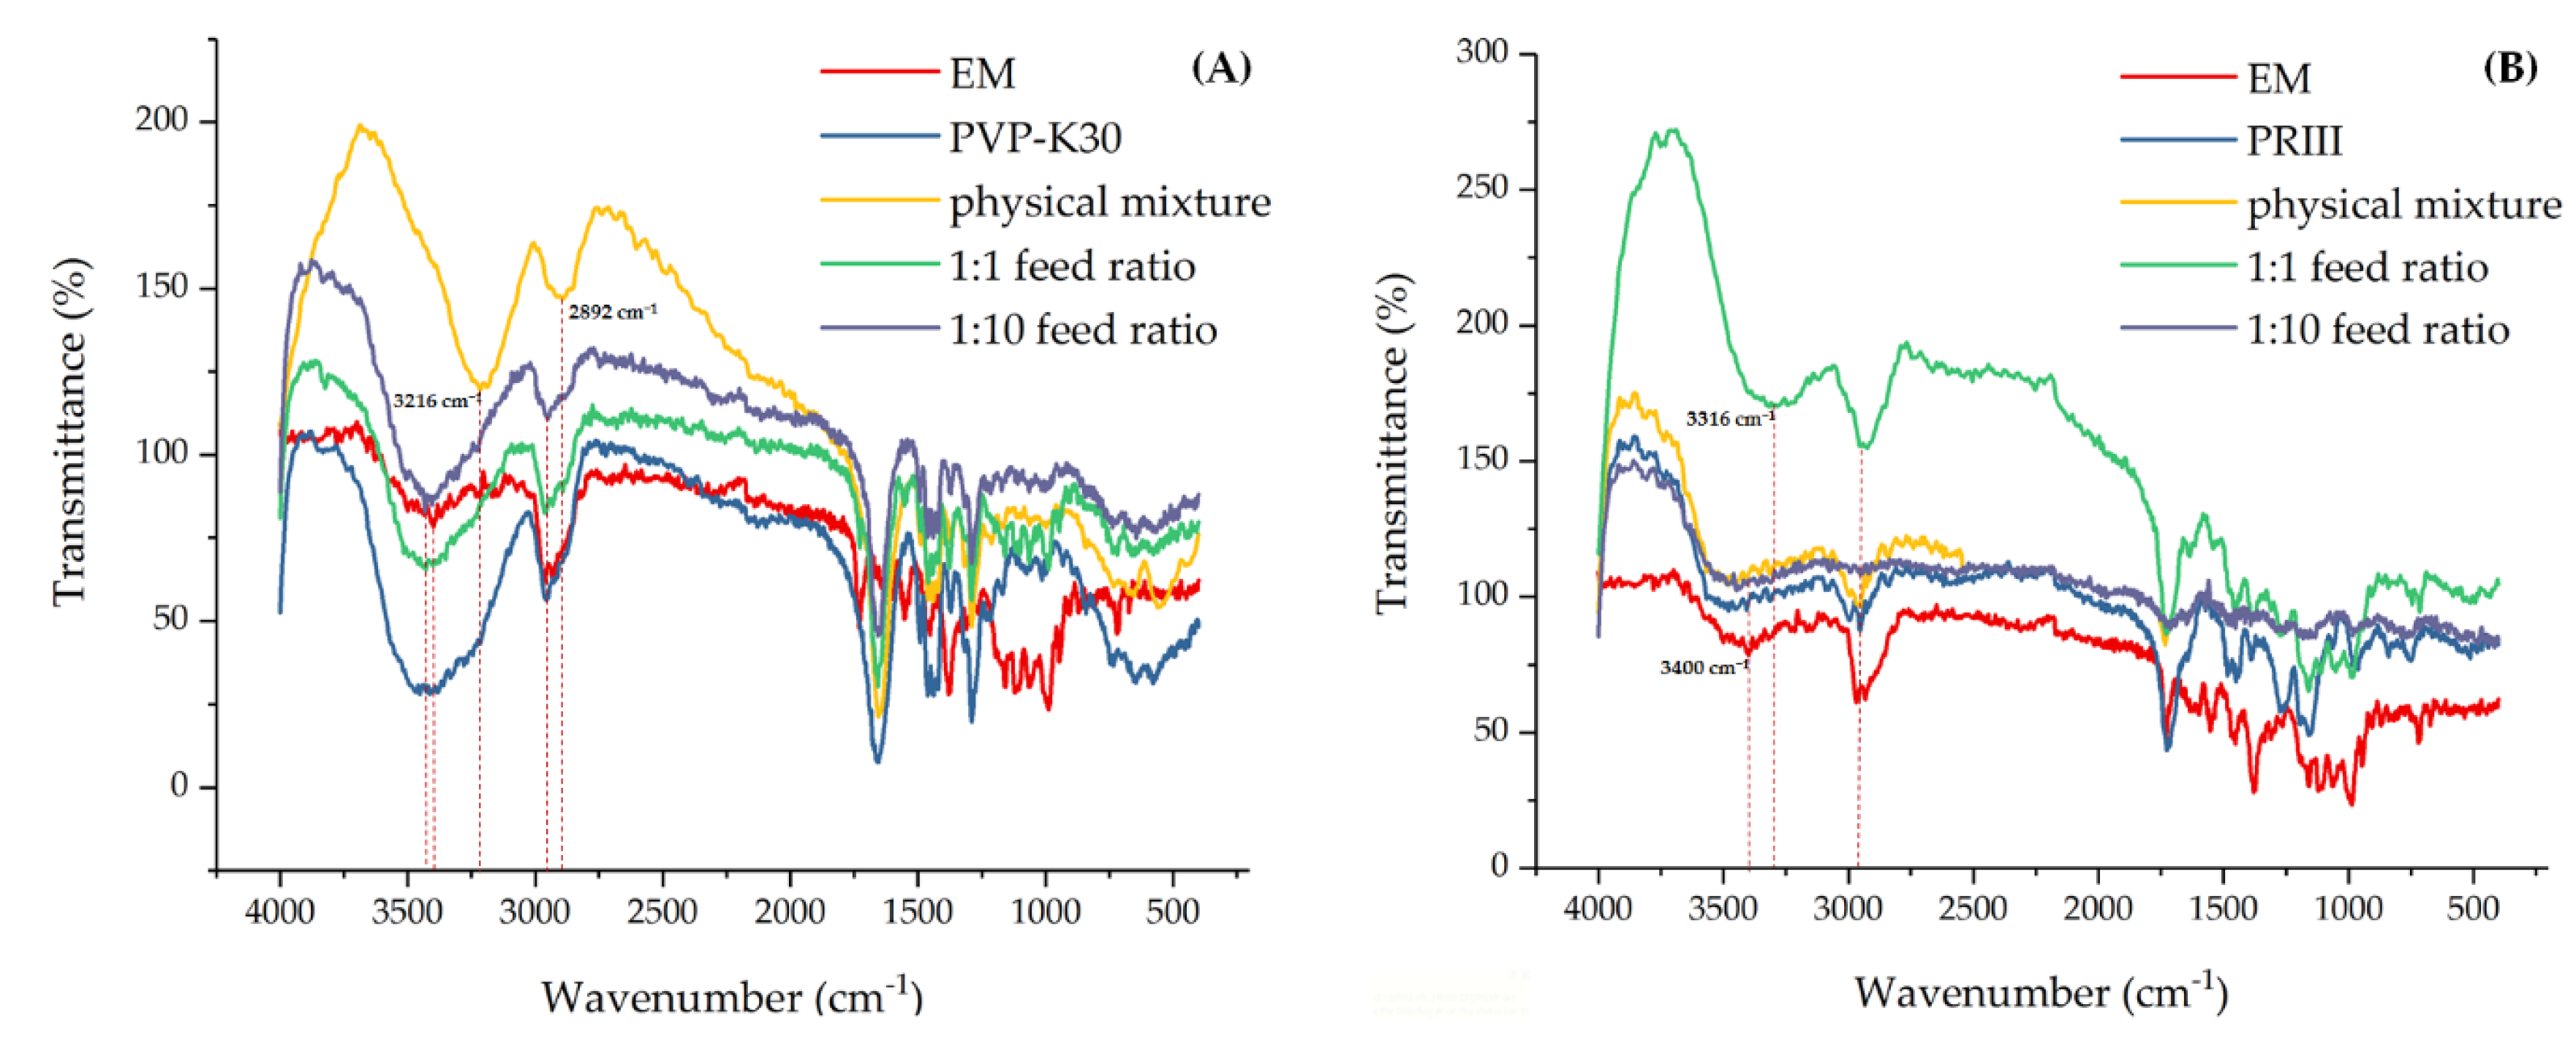
Figure 8.
IR Spectra of (A) EM, PVP K30, physical mixture, and EM-PVP-K30 solid dispersions. (B) EM, PRIII, physical mixture, and EM-PRIII solid dispersions.
Figure 8.
IR Spectra of (A) EM, PVP K30, physical mixture, and EM-PVP-K30 solid dispersions. (B) EM, PRIII, physical mixture, and EM-PRIII solid dispersions.
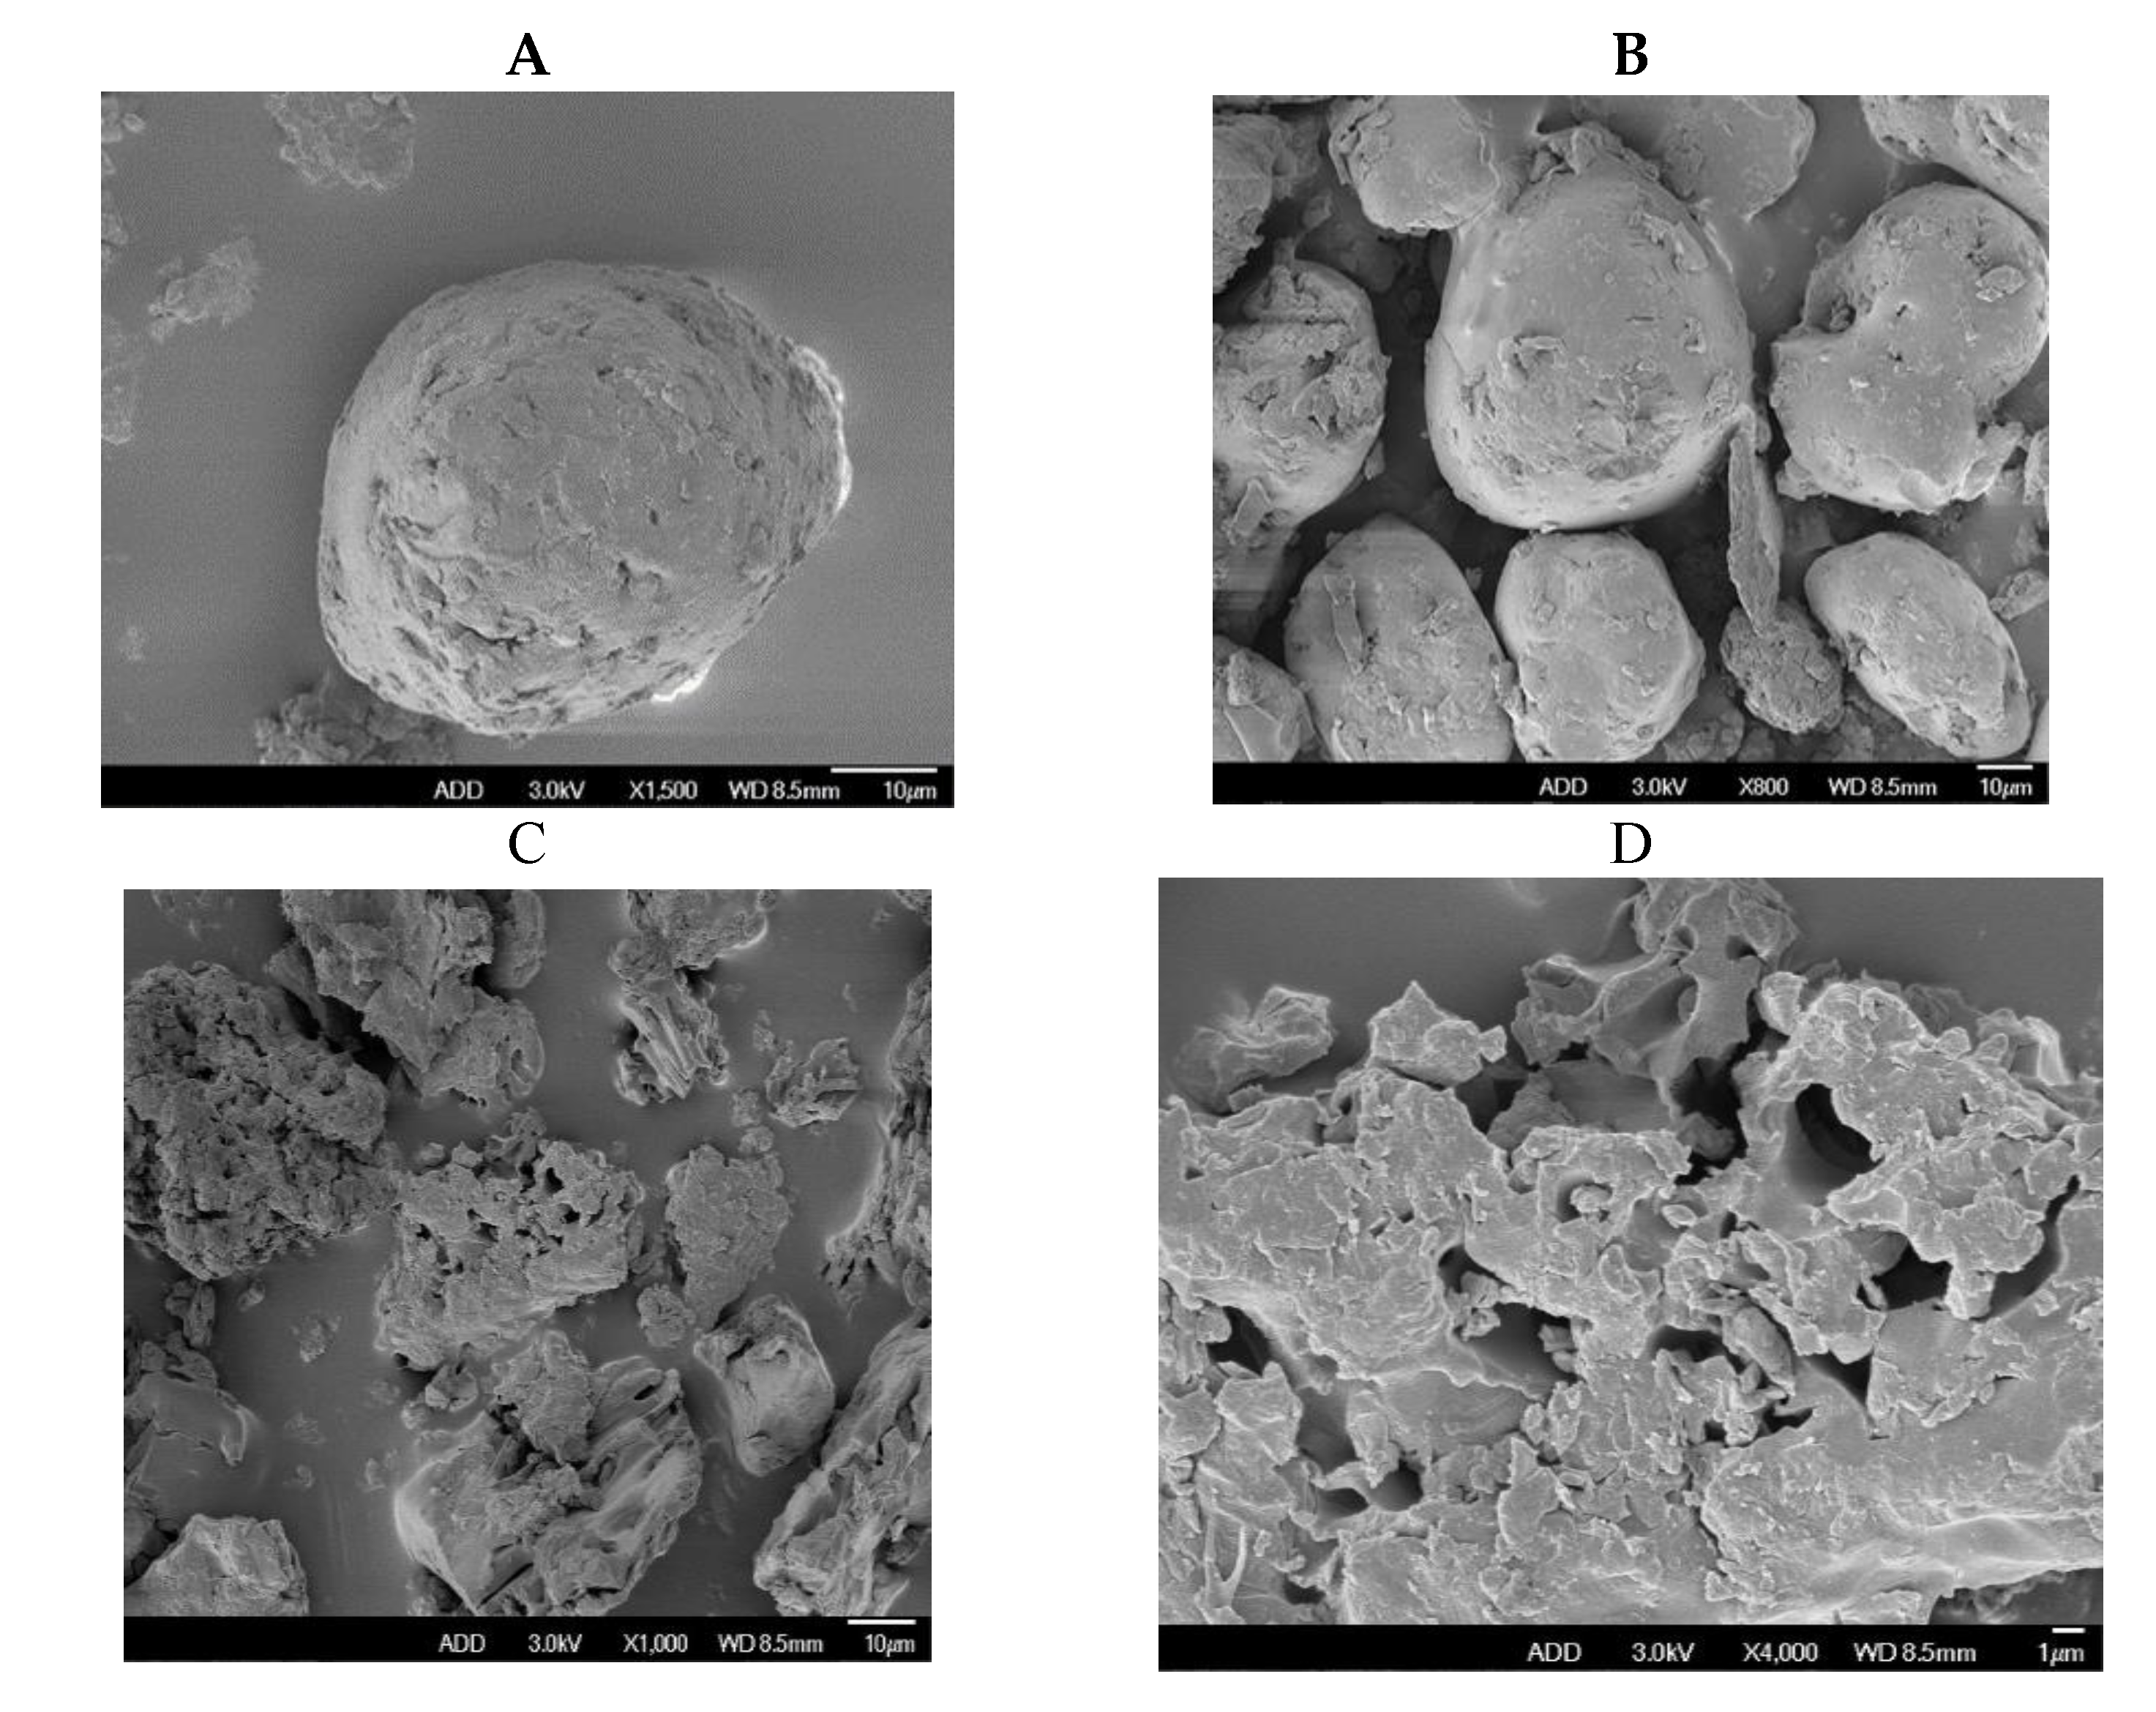
Figure 9.
Scanning electron micrographs of (A + B) EM-PVP-K30 solid dispersions and (C + D) EM-PRIII solid dispersions.
Figure 9.
Scanning electron micrographs of (A + B) EM-PVP-K30 solid dispersions and (C + D) EM-PRIII solid dispersions.
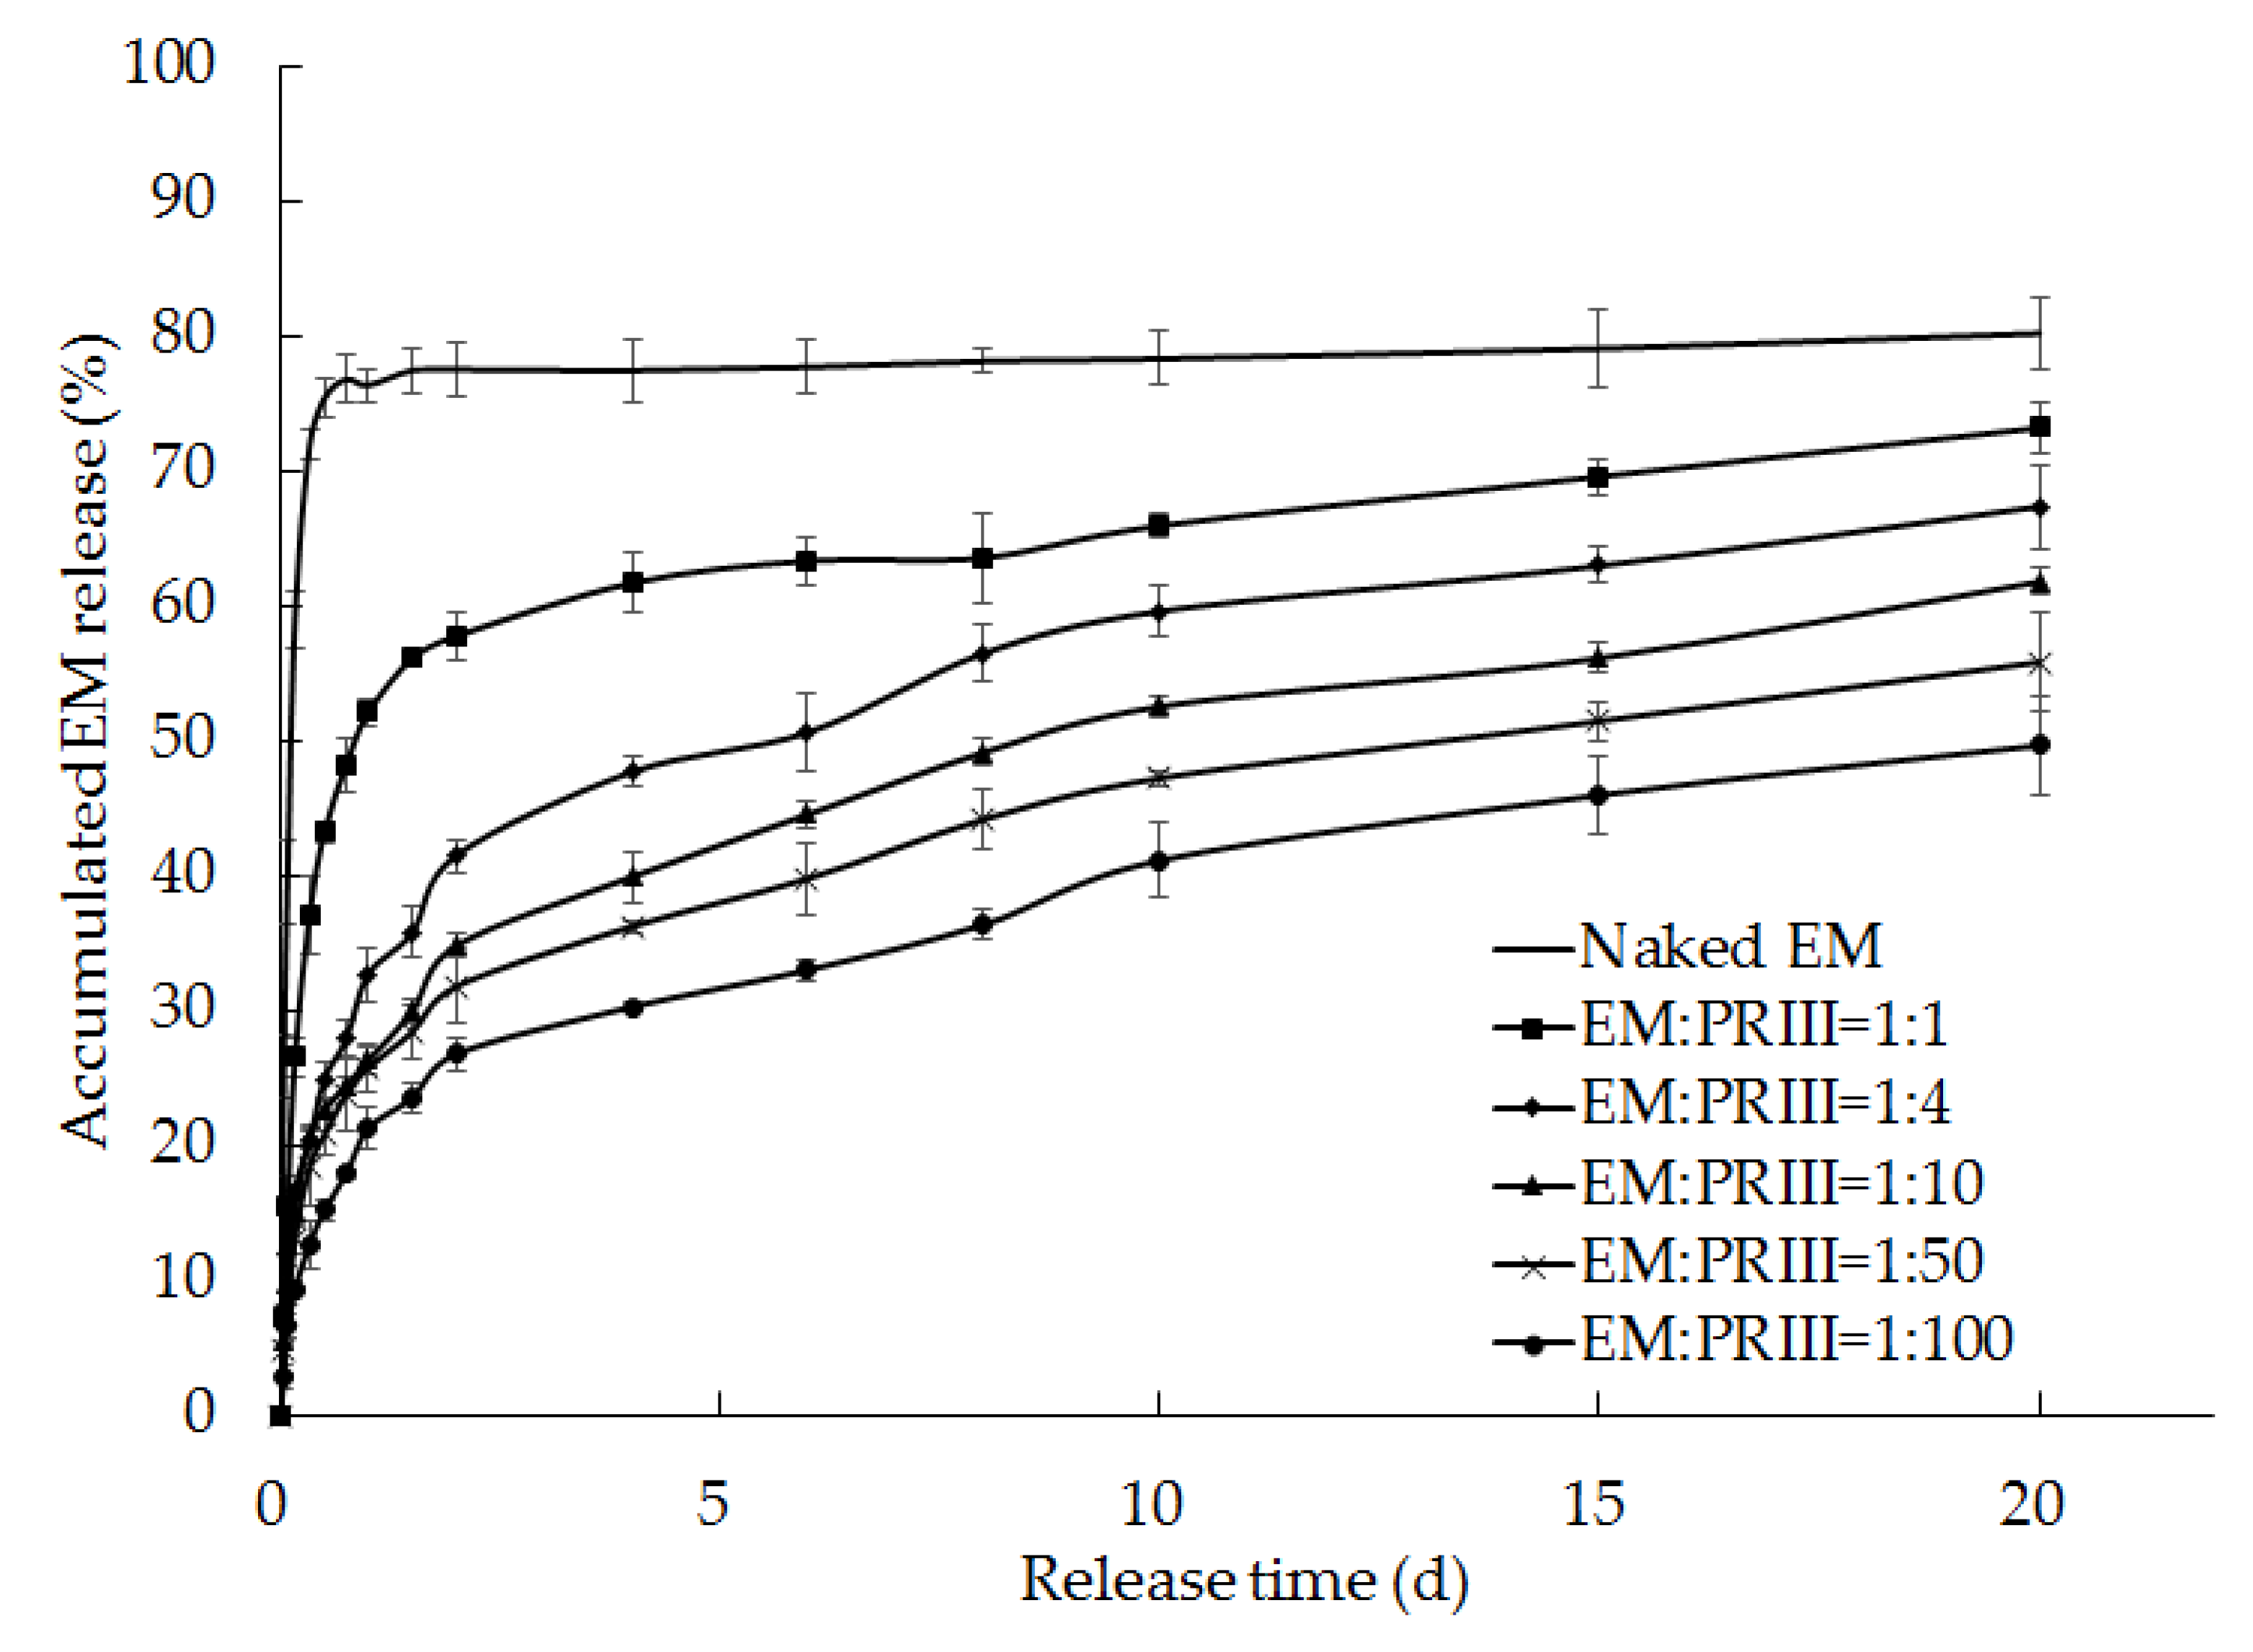
Figure 10.
Release rates of EM from EM-PRIII solid dispersions prepared using varied feed ratios.
Figure 10.
Release rates of EM from EM-PRIII solid dispersions prepared using varied feed ratios.
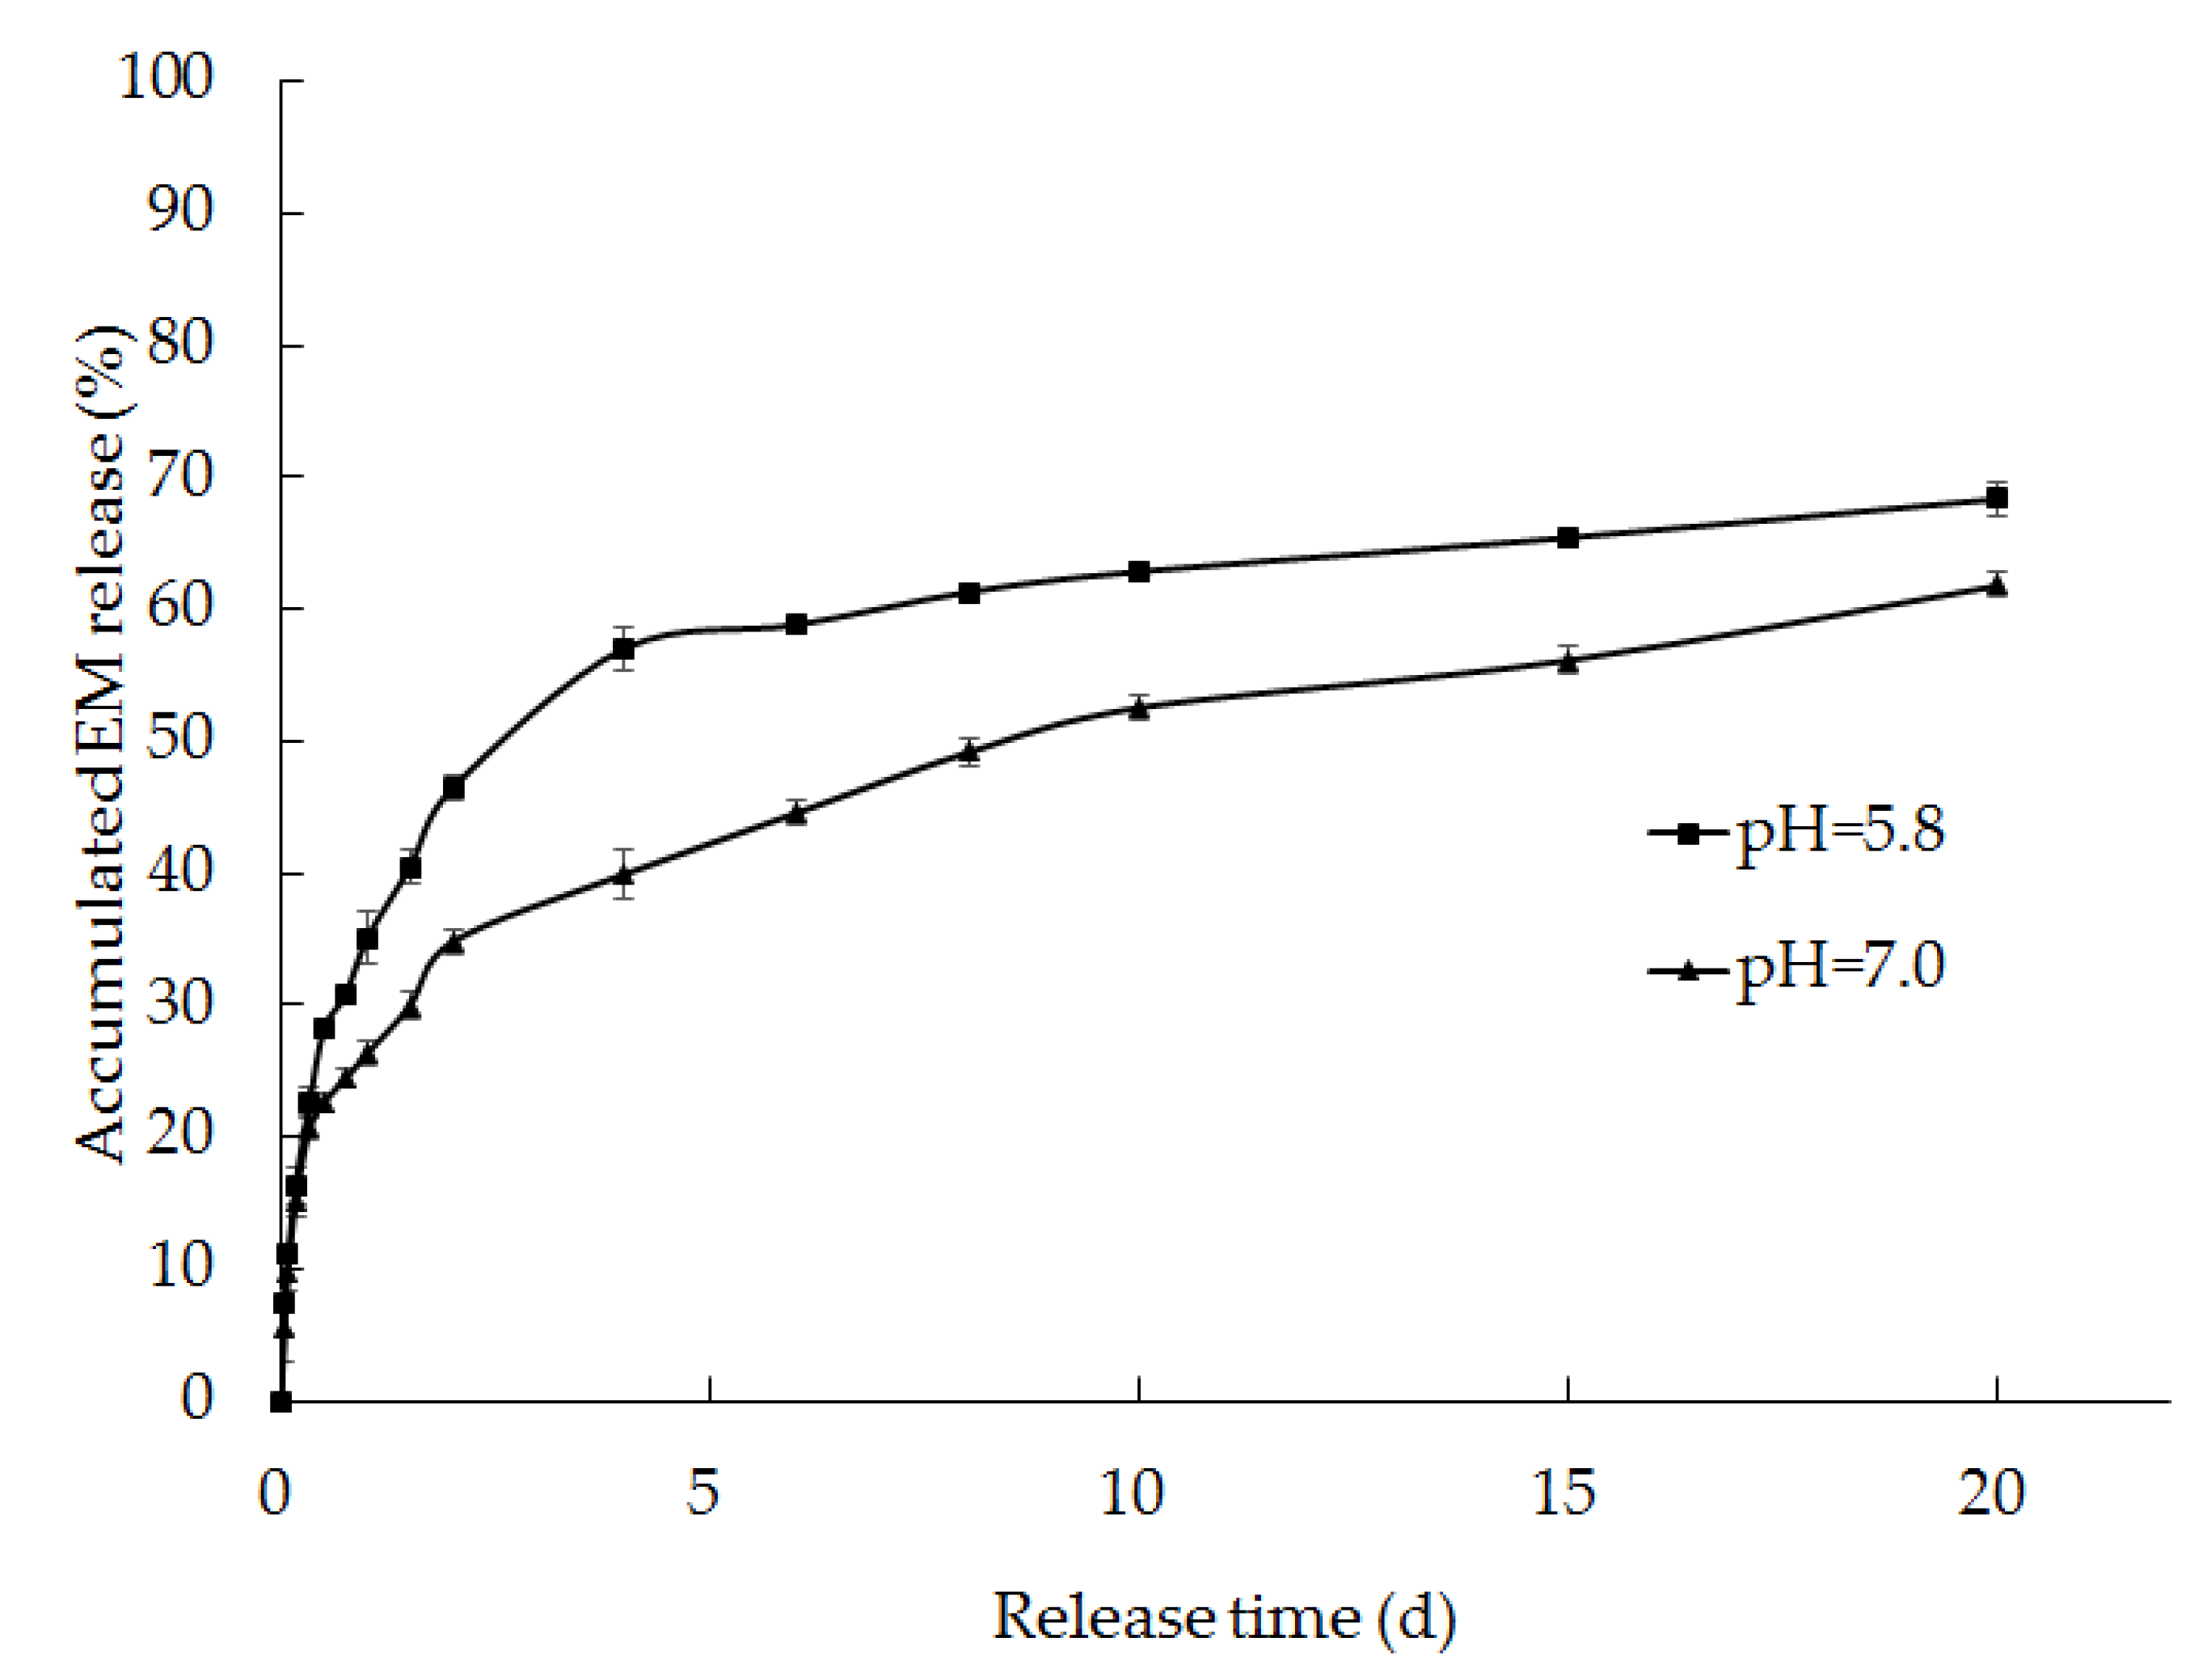
Figure 11.
Release rates of EM from the solid dispersions prepared using a 1:10 feed ratio of EM-PRIII in phosphate buffer solutions of pH 5.8 and 7.0.
Figure 11.
Release rates of EM from the solid dispersions prepared using a 1:10 feed ratio of EM-PRIII in phosphate buffer solutions of pH 5.8 and 7.0.
Table 1.
Dissolution studies of emamectin benzoate (EM) and PVP-K30 with different solvents. Note: The data after “+” indicates the time required for the complete dissolution of EM or PVP-K30 in the solvents by stirring.
Table 1.
Dissolution studies of emamectin benzoate (EM) and PVP-K30 with different solvents. Note: The data after “+” indicates the time required for the complete dissolution of EM or PVP-K30 in the solvents by stirring.
| Solvents | Solute | Dissolution Time (s) |
|---|
| Methanol | EM | 60 + 52 (±9) |
| PVP-K30 | 157 + 0 (±5) |
| Ethanol | EM | 60 + 115 (±11) |
| PVP-K30 | 300 + 67 (±6) |
| Dichloromethane | EM | 60 + 67 (±6) |
| PVP-K30 | 300 + 37 (±5) |
Table 2.
Assignments of IR bands corresponding to vibrations of EM, PVP-K30, and PRIII.
Table 2.
Assignments of IR bands corresponding to vibrations of EM, PVP-K30, and PRIII.
| Samples | Wavenumber (cm−1) | Assigment |
|---|
| EM | 3400 | O–H stretching vibration |
| 2968 | -CH3 stretching vibration |
| 2932 | -CH2 stretching vibration |
| 1730 | C=O stretching vibration |
| 1600 and 1554 | C=C stretching vibration in benzene rings |
| 1452 and 1380 | C-H in-plane bending vibration (saturated bond) |
| 1158 and 1118 | C=O bending vibration in ester groups |
| 1000-650 | Region of C-H out of plane bending vibration (unsaturated bond) |
| PVP-K30 | 3416 | N–H stretching vibration |
| 2956 | C–H stretching vibration (saturated bond) |
| 1654 | C=C stretching vibration in alkene bonds |
| 1462 and1372 | C-H in-plane bending vibration (saturated bond) |
| 1290 | O–H in-plane bending vibration |
| PRIII | 3000 and 2948 | C–H stretching vibration (saturated bond) |
| 1726 | C=O stretching vibration in ester groups |
| 1485, 1454 and 1274 | C–H in-plane bending vibration (saturated bond) |
| 962 and 752 | C–H in-plane bending vibration (unsaturated bond) |
Table 3.
Aqueous solubility results of EM-PVP-K30 solid dispersions prepared using varied feed ratios. Note: Different lower-case letters (such as a, b, c, d, e, f, g, and h) in the same column indicate significant differences in the aqueous solubility of different samples (Duncan’s tests, p ≤ 0.05).
| Samples | Aqueous Solubility (×10−3 mg/mL) | Times of Solubility Improvement |
|---|
| EM technical | 23.36 ± 0.33a | - |
| 1:1 feed ratio EM-PVP-K30 solid dispersions | 81.76 ± 0.95b | 3.5 |
| 1:2 feed ratio EM-PVP-K30 solid dispersions | 167.38 ± 2.16e | 7.2 |
| 1:4 feed ratio EM-PVP-K30 solid dispersions | 238.43 ± 1.04g | 10.2 |
| 1:10 feed ratio EM-PVP-K30 solid dispersions | 876.22 ± 4.27h | 37.5 |
| 1:50 feed ratio EM-PVP-K30 solid dispersions | 223.95 ± 2.59f | 9.6 |
| 1:100 feed ratio EM-PVP-K30 solid dispersions | 117.48 ± 1.26d | 5.0 |
| 1:10 feed ratio physical mixture of EM and PVP-K30 | 99.79 ± 4.15c | 4.3 |
Table 4.
Kinetic equation describing the release rates of EM from EM-PRIII solid dispersions prepared using varied feed ratios. Note: Different lower-case letters (such as a, b, c, d, and e) in the same column indicate significant differences in the half-life of EM in different samples (Duncan’s tests, p ≤ 0.05).
| Samples | Kinetic Equation | Equation Type | Correlation Coefficient | Half-life (d) |
|---|
| EM technical | Q = 77.596 (1 − e−8.672t) | First-order | 0.99 | 0.12 |
| 1:1 feed ratio EM-PRIII solid dispersions | Q = 63.886 (1 − e−2.284t) | First-order | 0.96 | 0.67 |
| 1:4 feed ratio EM-PRIII solid dispersions | Q = 57.624 (1 − e−0.842t) | First-order | 0.91 | 1.81 |
| 1:10 feed ratio EM-PRIII solid dispersions | Q = 12.969t1/2 + 10.173 | Higuchi | 0.93 | 9.43 |
| 1:50 feed ratio EM-PRIII solid dispersions | Q = 11.695t1/2 + 9.410 | Higuchi | 0.91 | 12.05 |
| 1:100 feed ratio EM-PRIII solid dispersions | Q = 10.661t1/2 + 6.249 | Higuchi | 0.94 | 16.76 |
Table 5.
Kinetic equation describing the light degradation of EM from EM-PVP-K30 solid dispersions prepared using varied feed ratios. Note: Different lower-case letters (such as a, b, c, d, e, and f) in the same column indicate significant differences in the half-life of EM in different samples (Duncan’s tests, p ≤ 0.05).
| Samples | Kinetic Equation | Correlation Coefficient | Half-life (h) |
|---|
| EM technical | ct = 88.646e−0.236t | 0.93 | 2.42f |
| 1:1 feed ratio EM-PVP-K30 solid dispersions | ct = 87.348e−0.116t | 0.91 | 4.81e |
| 1:4 feed ratio EM-PVP-K30 solid dispersions | ct = 89.337e−0.096t | 0.92 | 6.07d |
| 1:10 feed ratio EM-PVP-K30 solid dispersions | ct = 89.984e−0.062t | 0.87 | 9.43c |
| 1:50 feed ratio EM-PVP-K30 solid dispersions | ct = 93.383e−0.049t | 0.94 | 12.67b |
| 1:100 feed ratio EM-PVP-K30 solid dispersions | ct = 93.784e−0.038t | 0.93 | 16.47a |
Table 6.
Kinetic equation describing the light degradation of EM from EM-PRIII solid dispersions prepared using varied feed ratios. Note: Different lower-case letters (such as a, b, c, d, e, and f) in the same column indicate significant differences in the half-life of EM in different samples (Duncan’s tests, p ≤ 0.05).
| Samples | Kinetic Equation | Correlation Coefficient | Half-life (h) |
|---|
| EM technical | ct = 88.646e−0.236t | 0.93 | 2.42f |
| 1:1 feed ratio EM-PRIII solid dispersions | ct = 85.096e−0.131t | 0.87 | 4.07e |
| 1:4 feed ratio EM-PRIII solid dispersions | ct = 86.891e−0.099t | 0.89 | 5.55d |
| 1:10 feed ratio EM-PRIII solid dispersions | ct = 89.320e−0.082t | 0.91 | 7.05c |
| 1:50 feed ratio EM-PRIII solid dispersions | ct = 94.038e−0.053t | 0.96 | 11.95b |
| 1:100 feed ratio EM-PRIII solid dispersions | ct = 95.997e−0.033t | 0.96 | 15.98a |
Table 7.
Bioactivity comparison of different formulations against third-instar larvae of P. xylostella (24 h).
Table 7.
Bioactivity comparison of different formulations against third-instar larvae of P. xylostella (24 h).
| Formulation | Toxicity Regression Equation | P Value | LC50 (95% CL) (μg/mL) |
|---|
| EM technical | y = 1.000x − 1.362 | 0.997 | 23.0 (16.3 − 33.9) |
| wettable powder of EM-PVP-K30 solid dispersions | y =1.316x − 1.434 | 0.993 | 12.3 (9.08 − 16.1) |
| wettable powder of EM-PRⅢ solid dispersions | y = 0.858x − 1.283 | 0.996 | 31.3 (21.0 − 53.3) |
Table 8.
Sustained-release effect of the wettable powder of 5% EM-PRIII solid dispersions. Note: Different lower-case letters (such as a, b, c, d, and e) indicate significantly different pest mortalities between insecticide preparations with varying durations of exposure to the natural environment (Duncan’s tests,
p ≤ 0.05). Different capital letters (such as A and B) indicate significantly different pest mortalities between two preparations that underwent the same duration of exposure to the natural environment (
t-test [
29],
p ≤ 0.05).
| Days after Spraying (d) | Mortality (%) (48h) |
|---|
| Wettable Powder of 5 % EM-PRIII Solid Dispersions | 1.5% EM Emulsifiable Concentrate |
|---|
| 0 | 83.19 ± 3.39aA | 94.69 ± 4.57aB |
| 5 | 70.83 ± 5.69bA | 74.17 ± 4.19bA |
| 10 | 58.33 ± 4.30cA | 31.67 ± 4.30cB |
| 15 | 46.67 ± 2.72dA | 14.17 ± 3.19dB |
| 20 | 33.33 ± 4.72eA | 5.00 ± 1.92eB |


