
Methyl Ether-Derivatized Sterols and Coprostanol Produced via Thermochemolysis Using Tetramethylammonium Hydroxide (TMAH)

 ,
,
Abstract
:1. Introduction
2. Materials and Methods
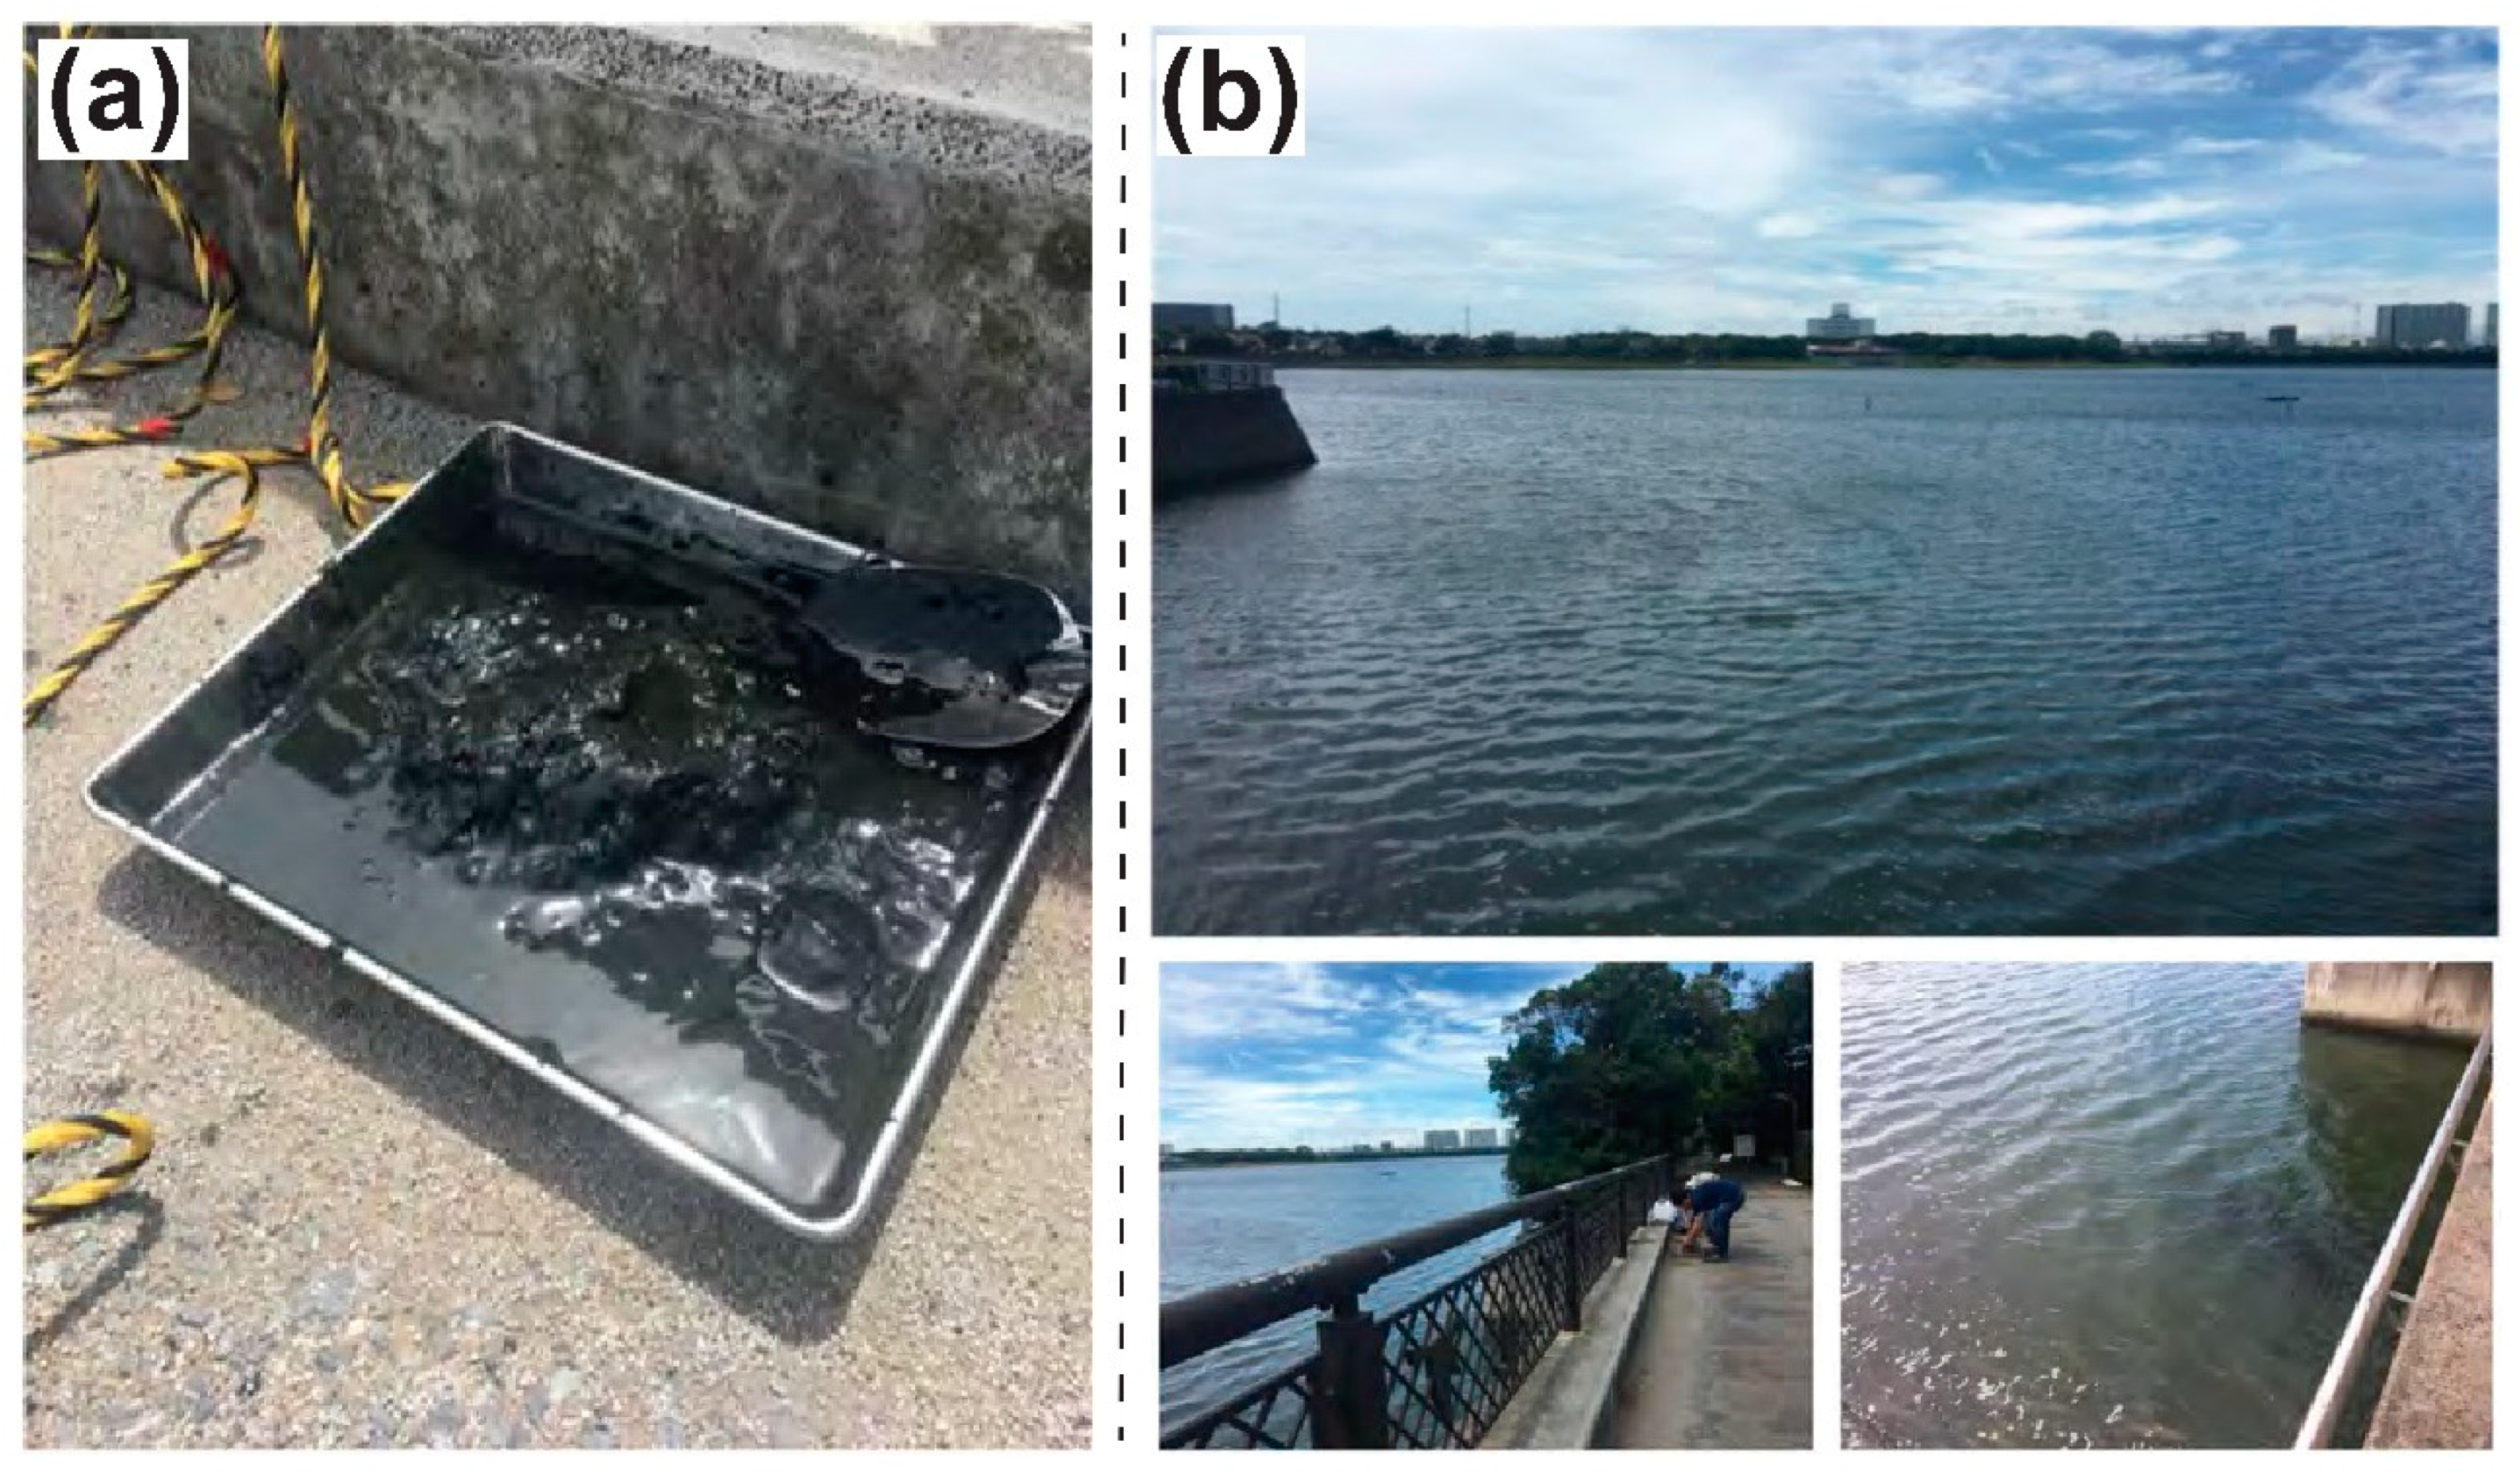
2.1. A Tideland Surface Sediment Sample
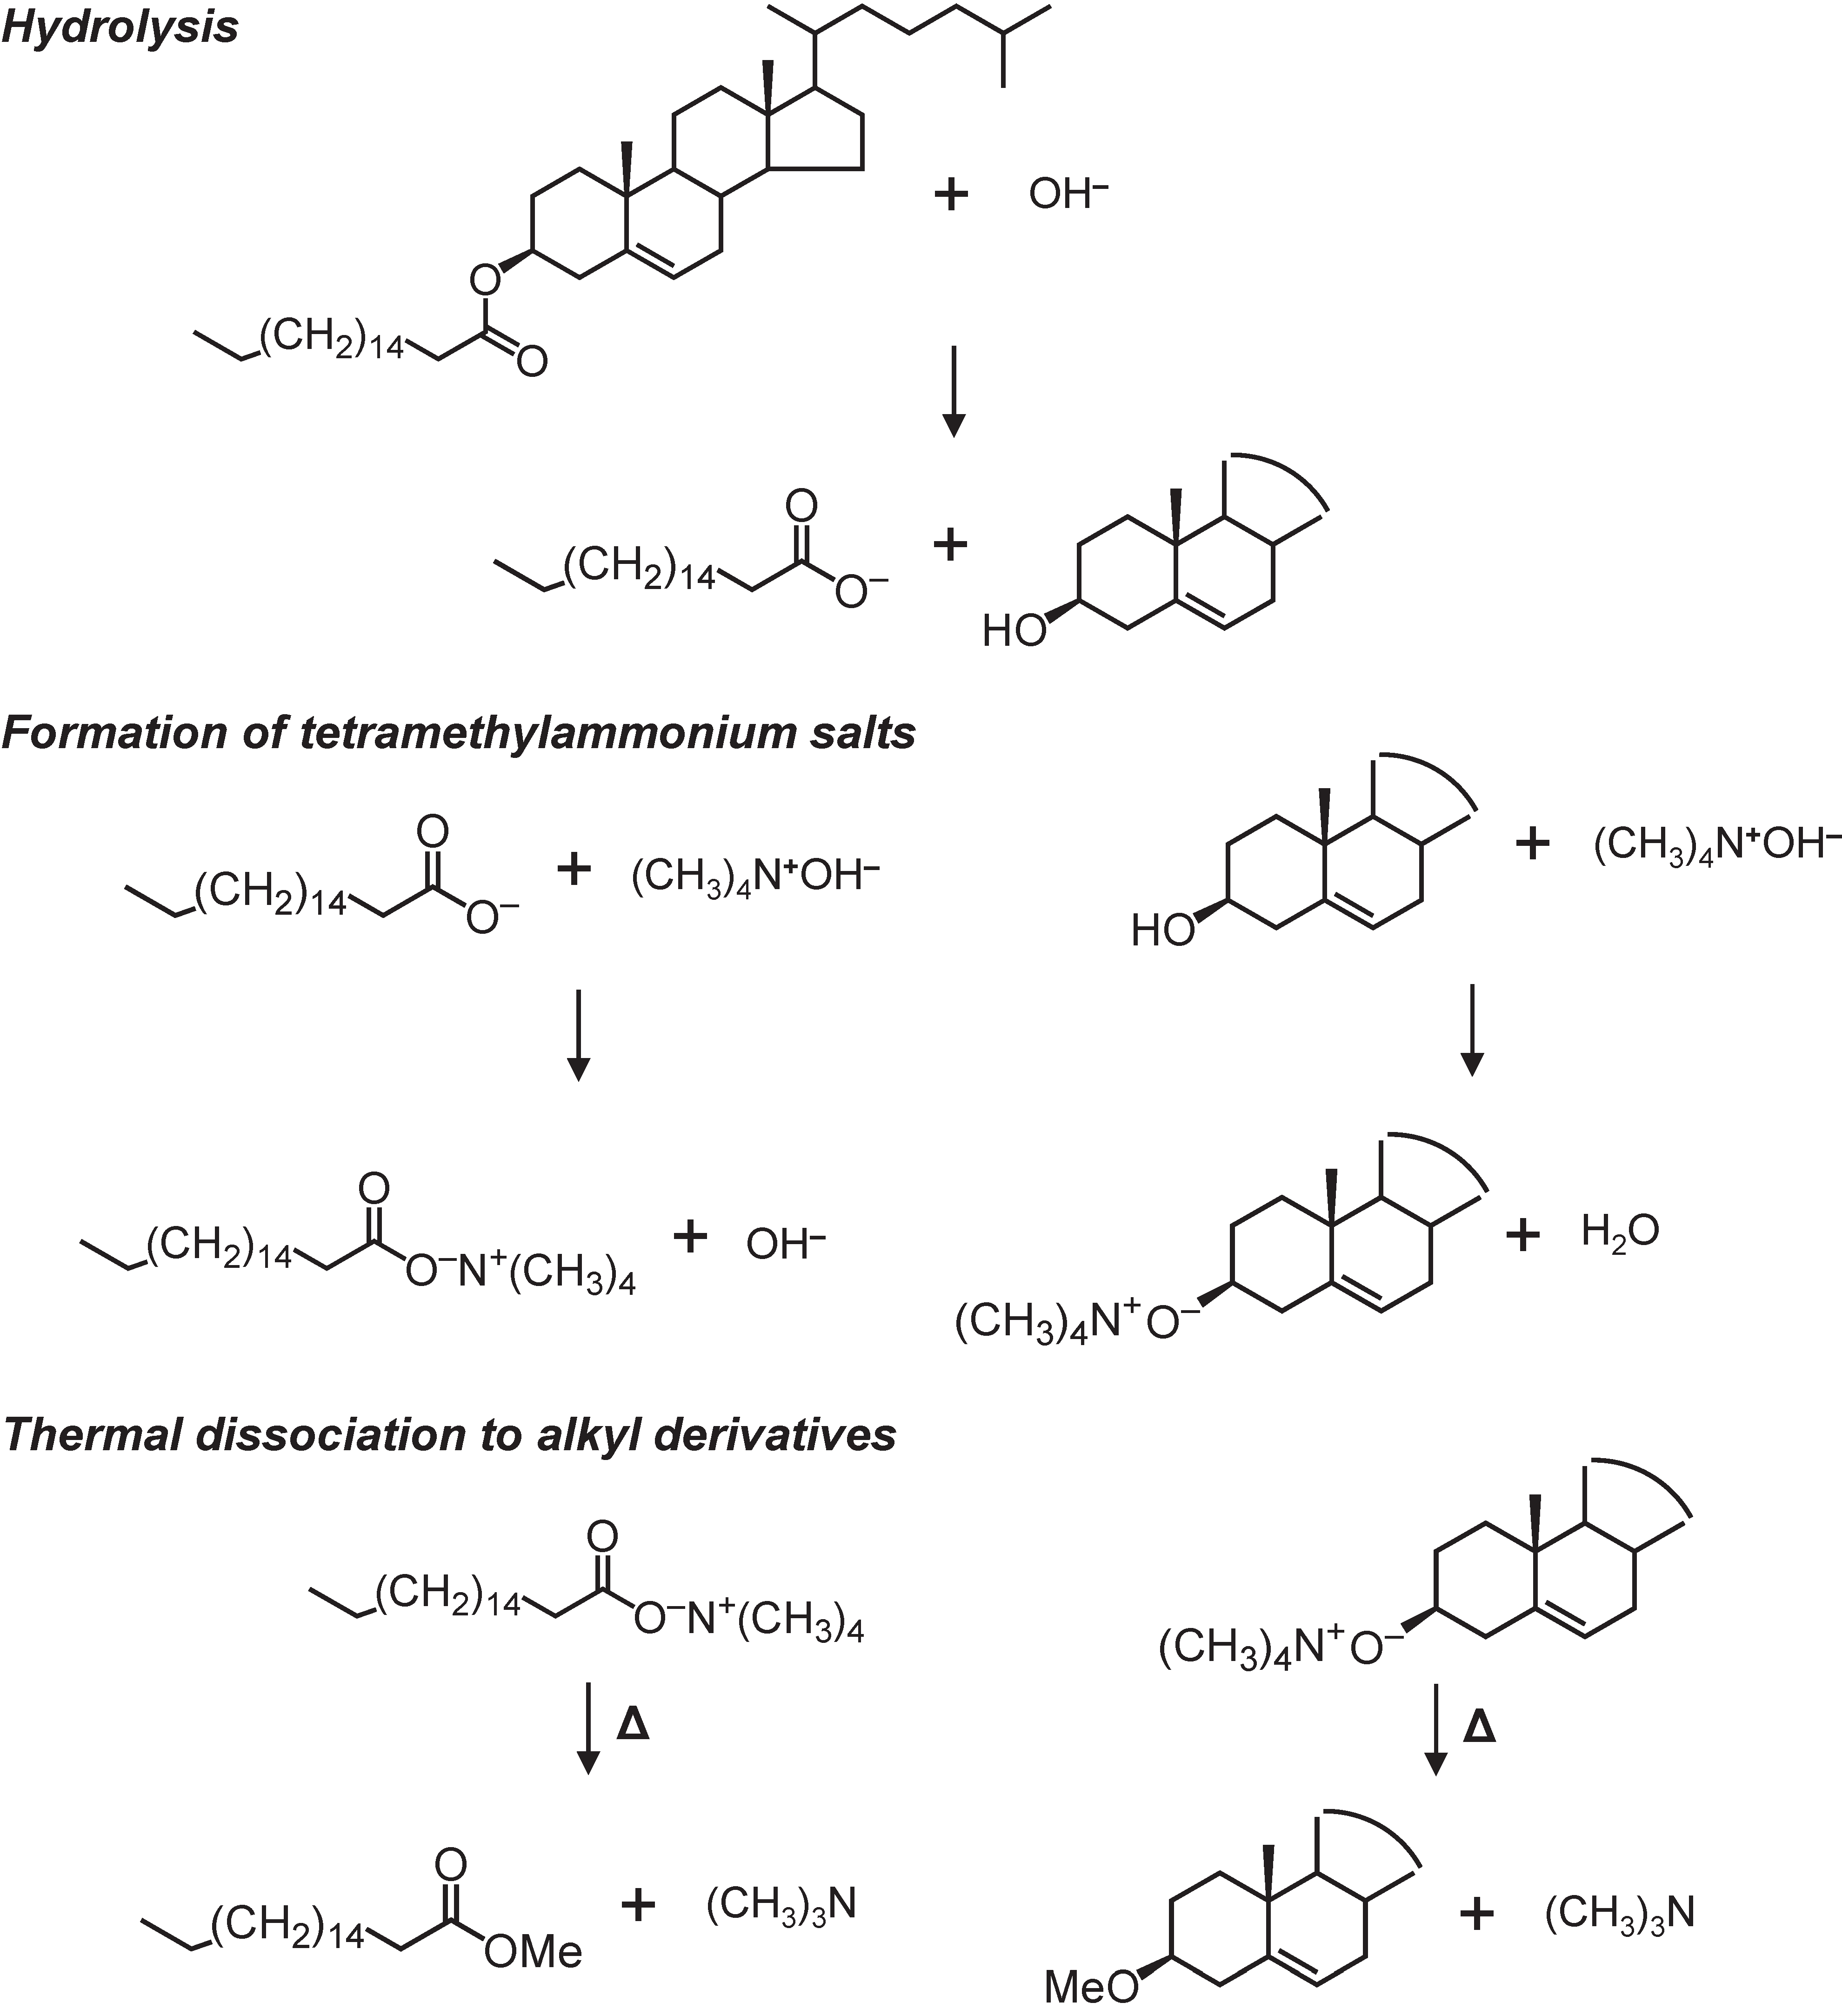
2.2. Thermochemolysis with TMAH
2.3. GC–MS Conditions
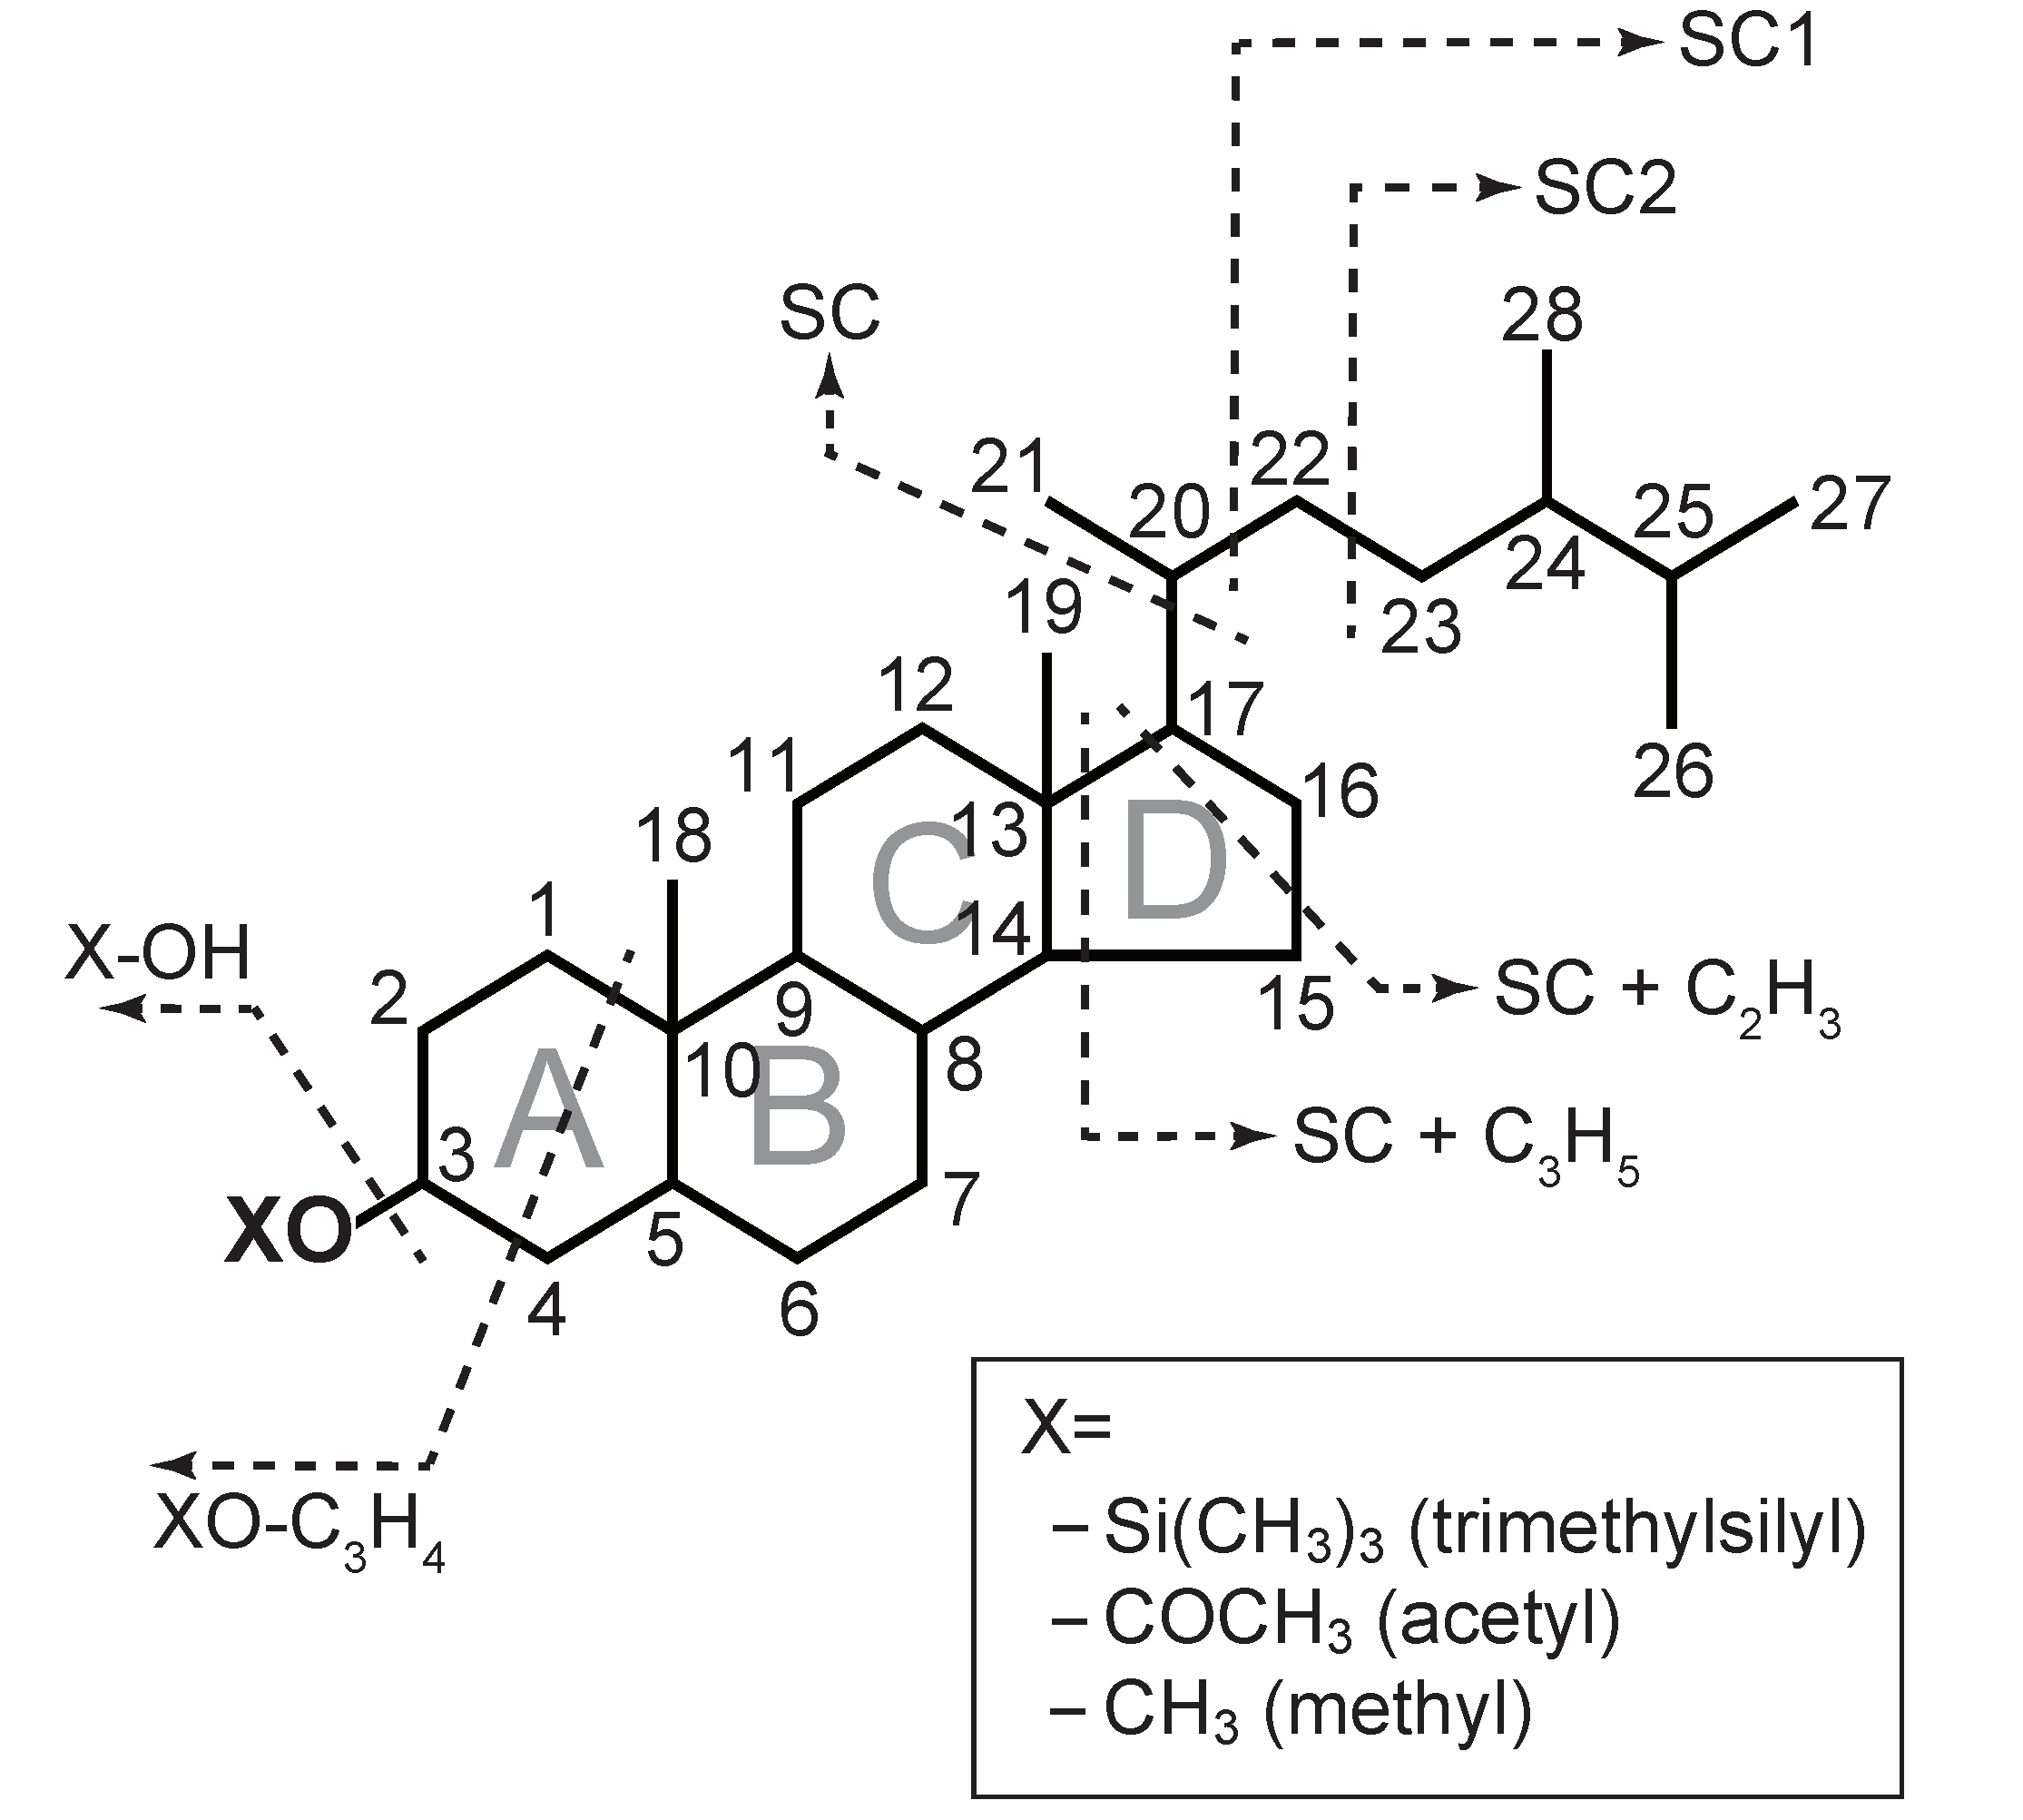
2.4. Identification of Sterols
3. Results and Discussion
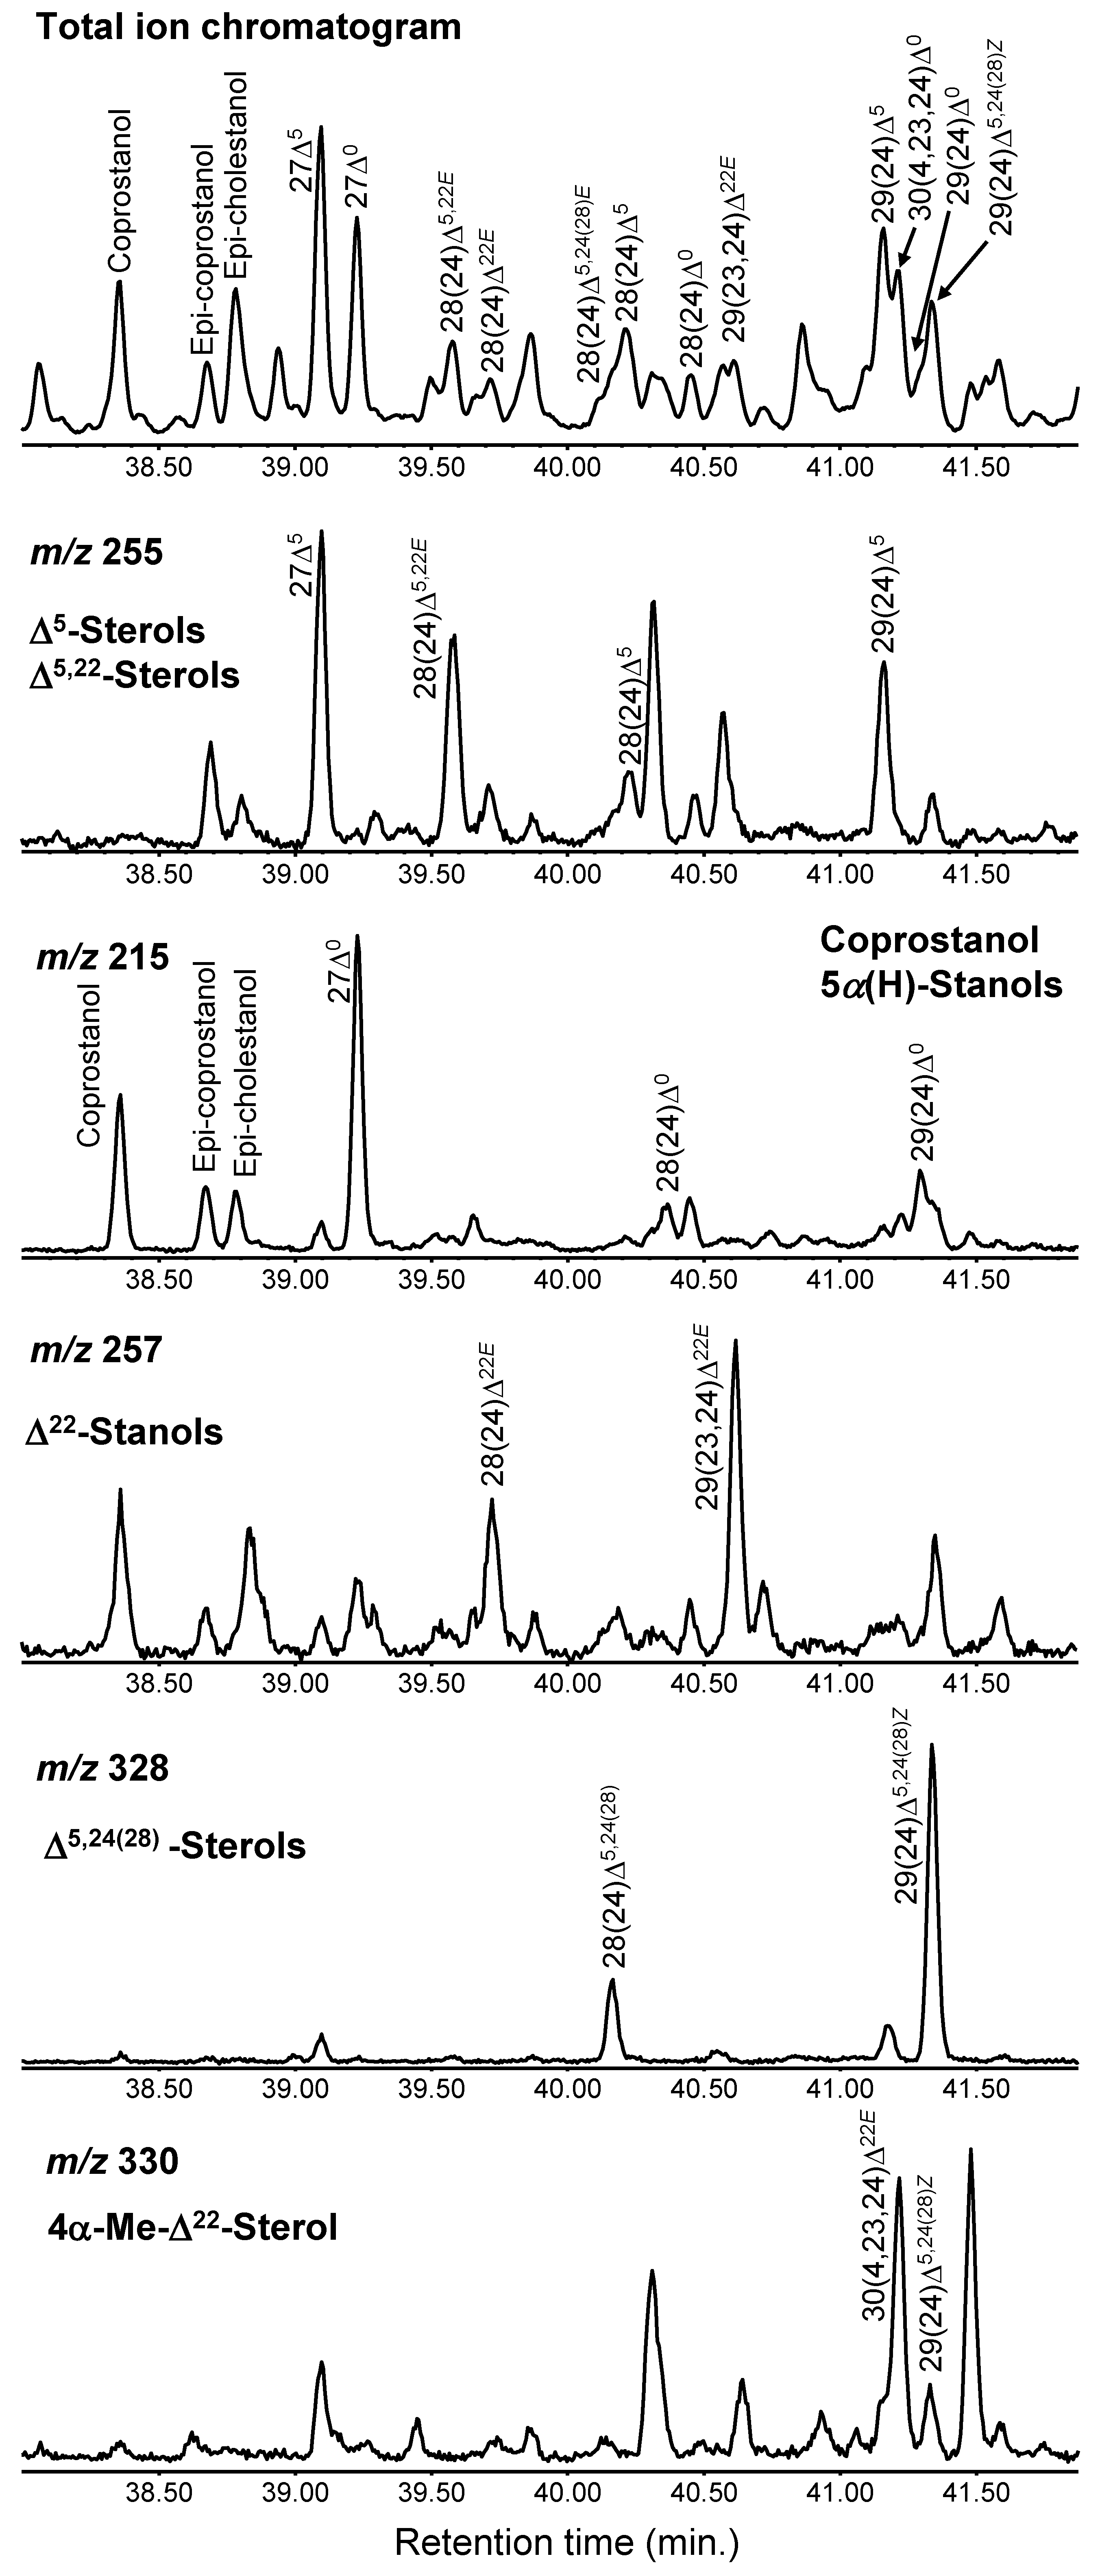
3.1. Identified Sterols in the Samples
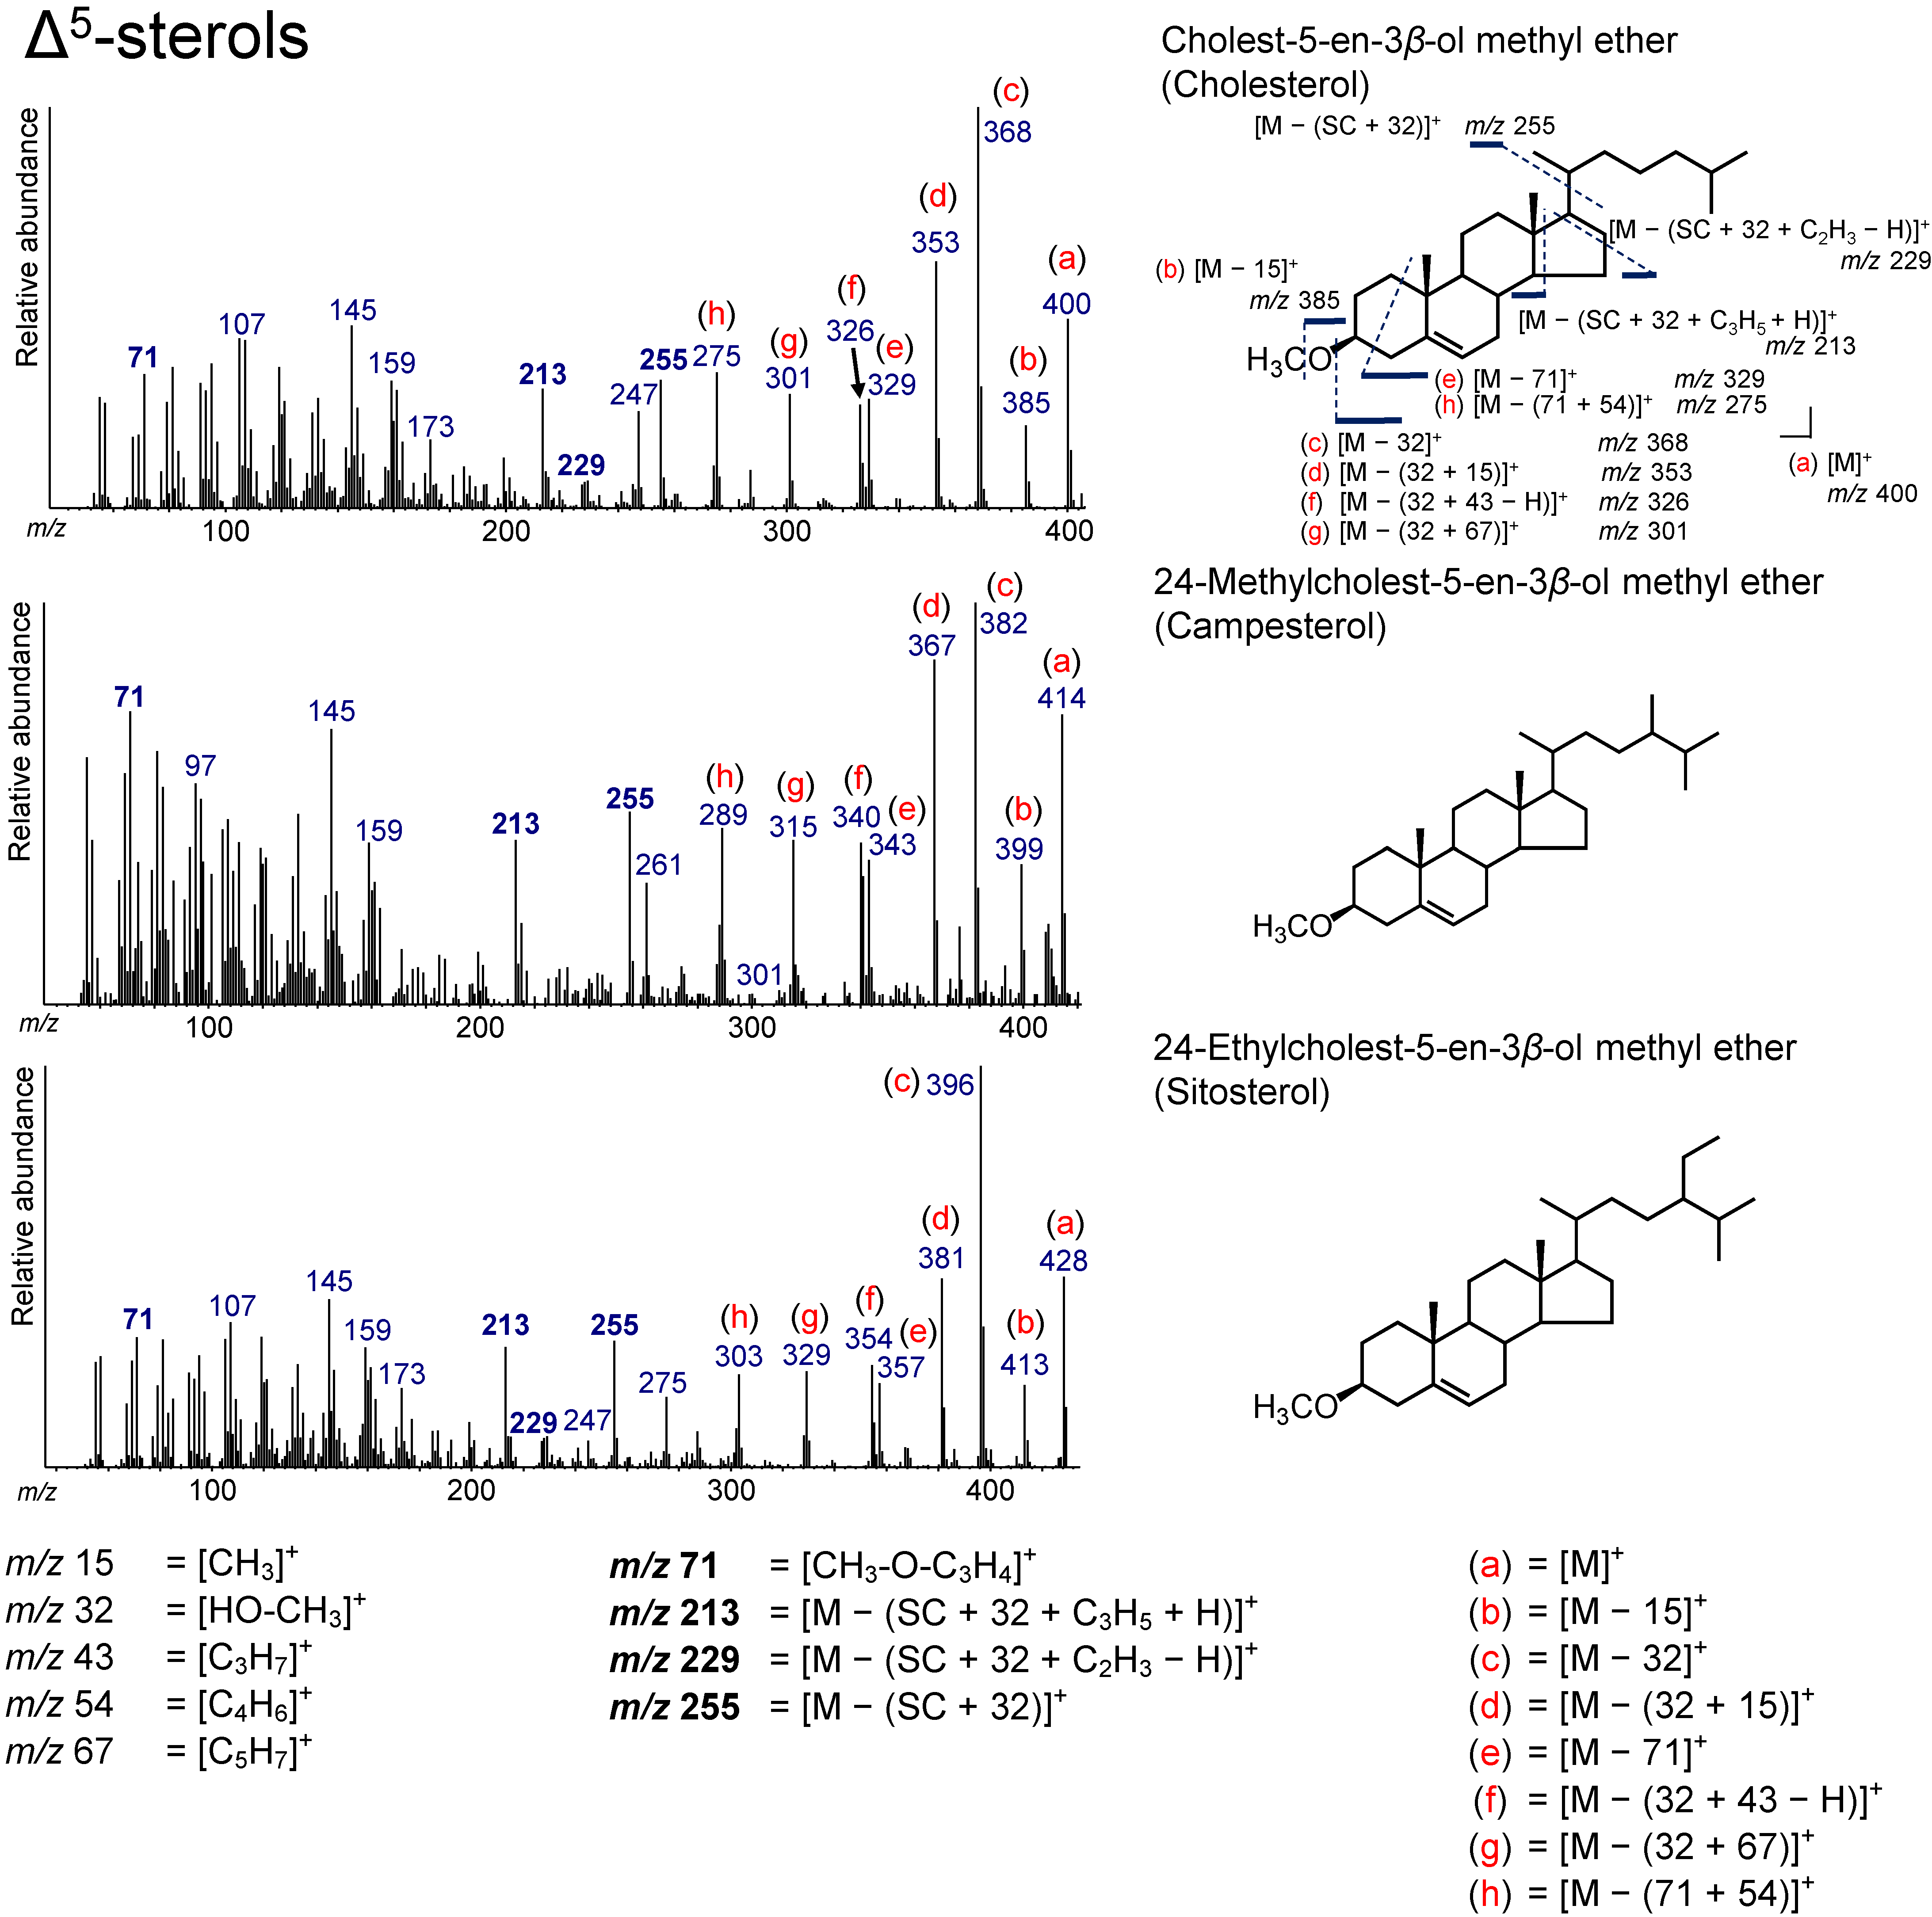
3.2. Δ5-Sterols
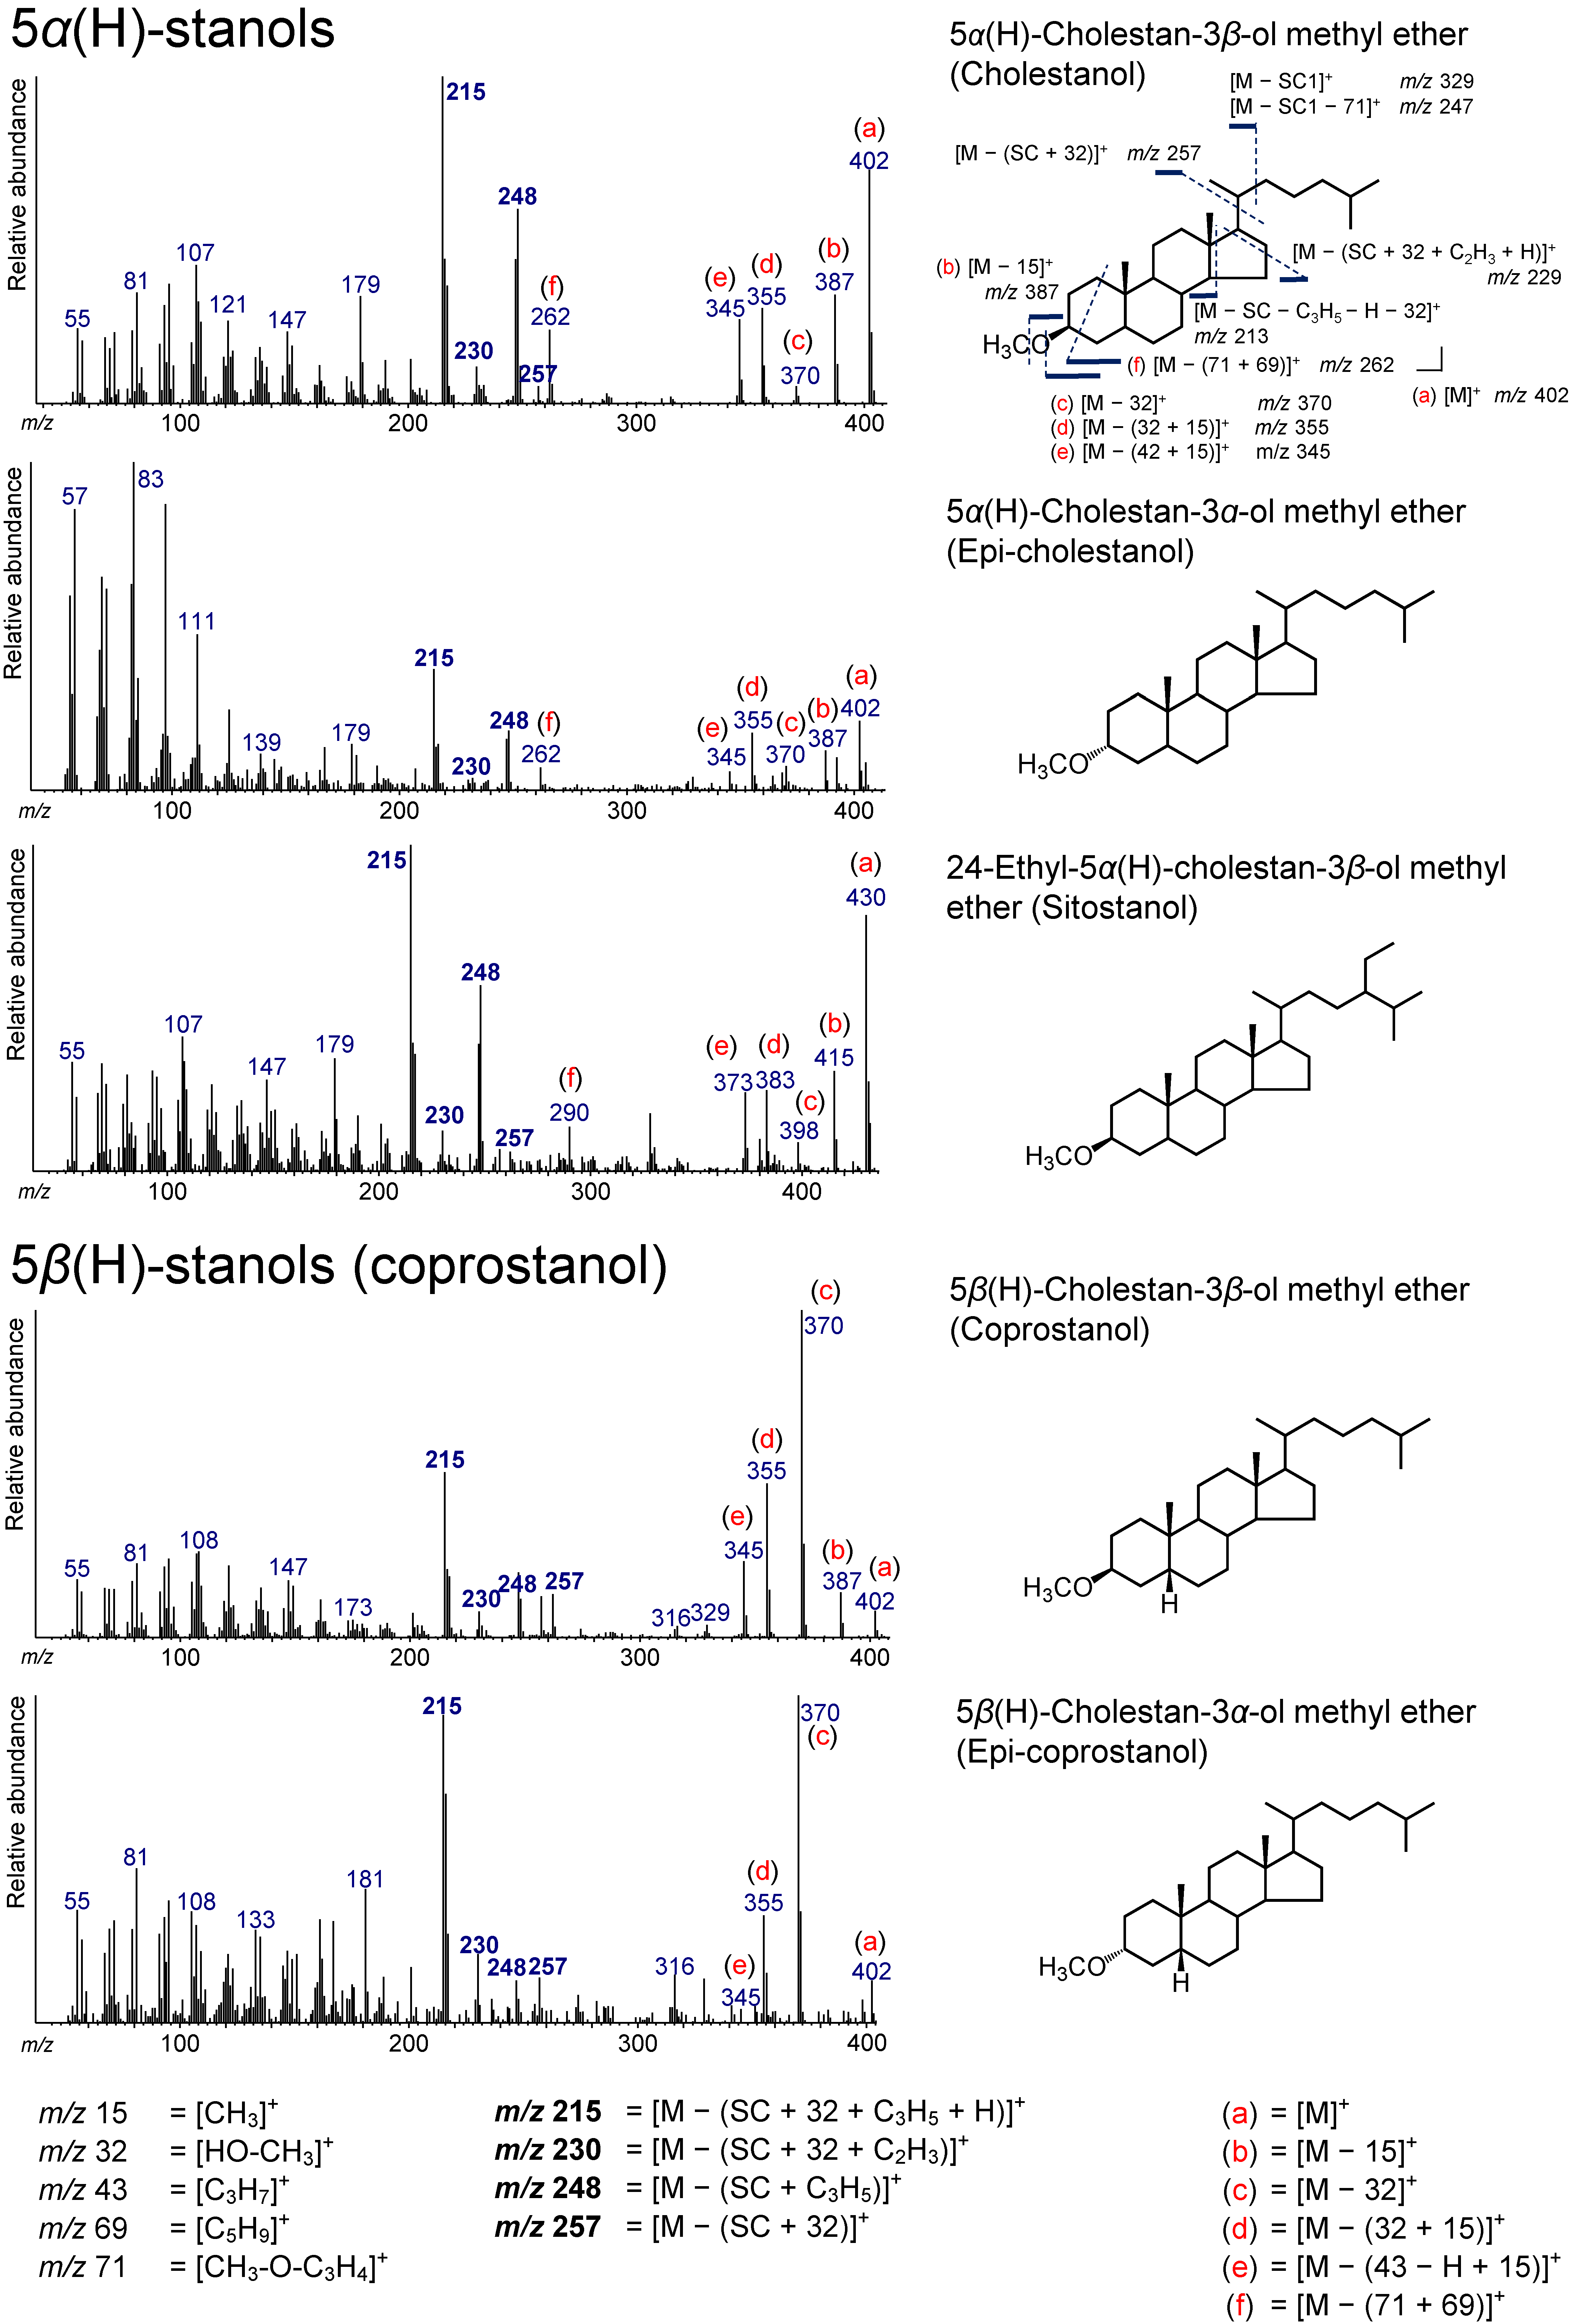
3.3. 5α(H)-Stanols
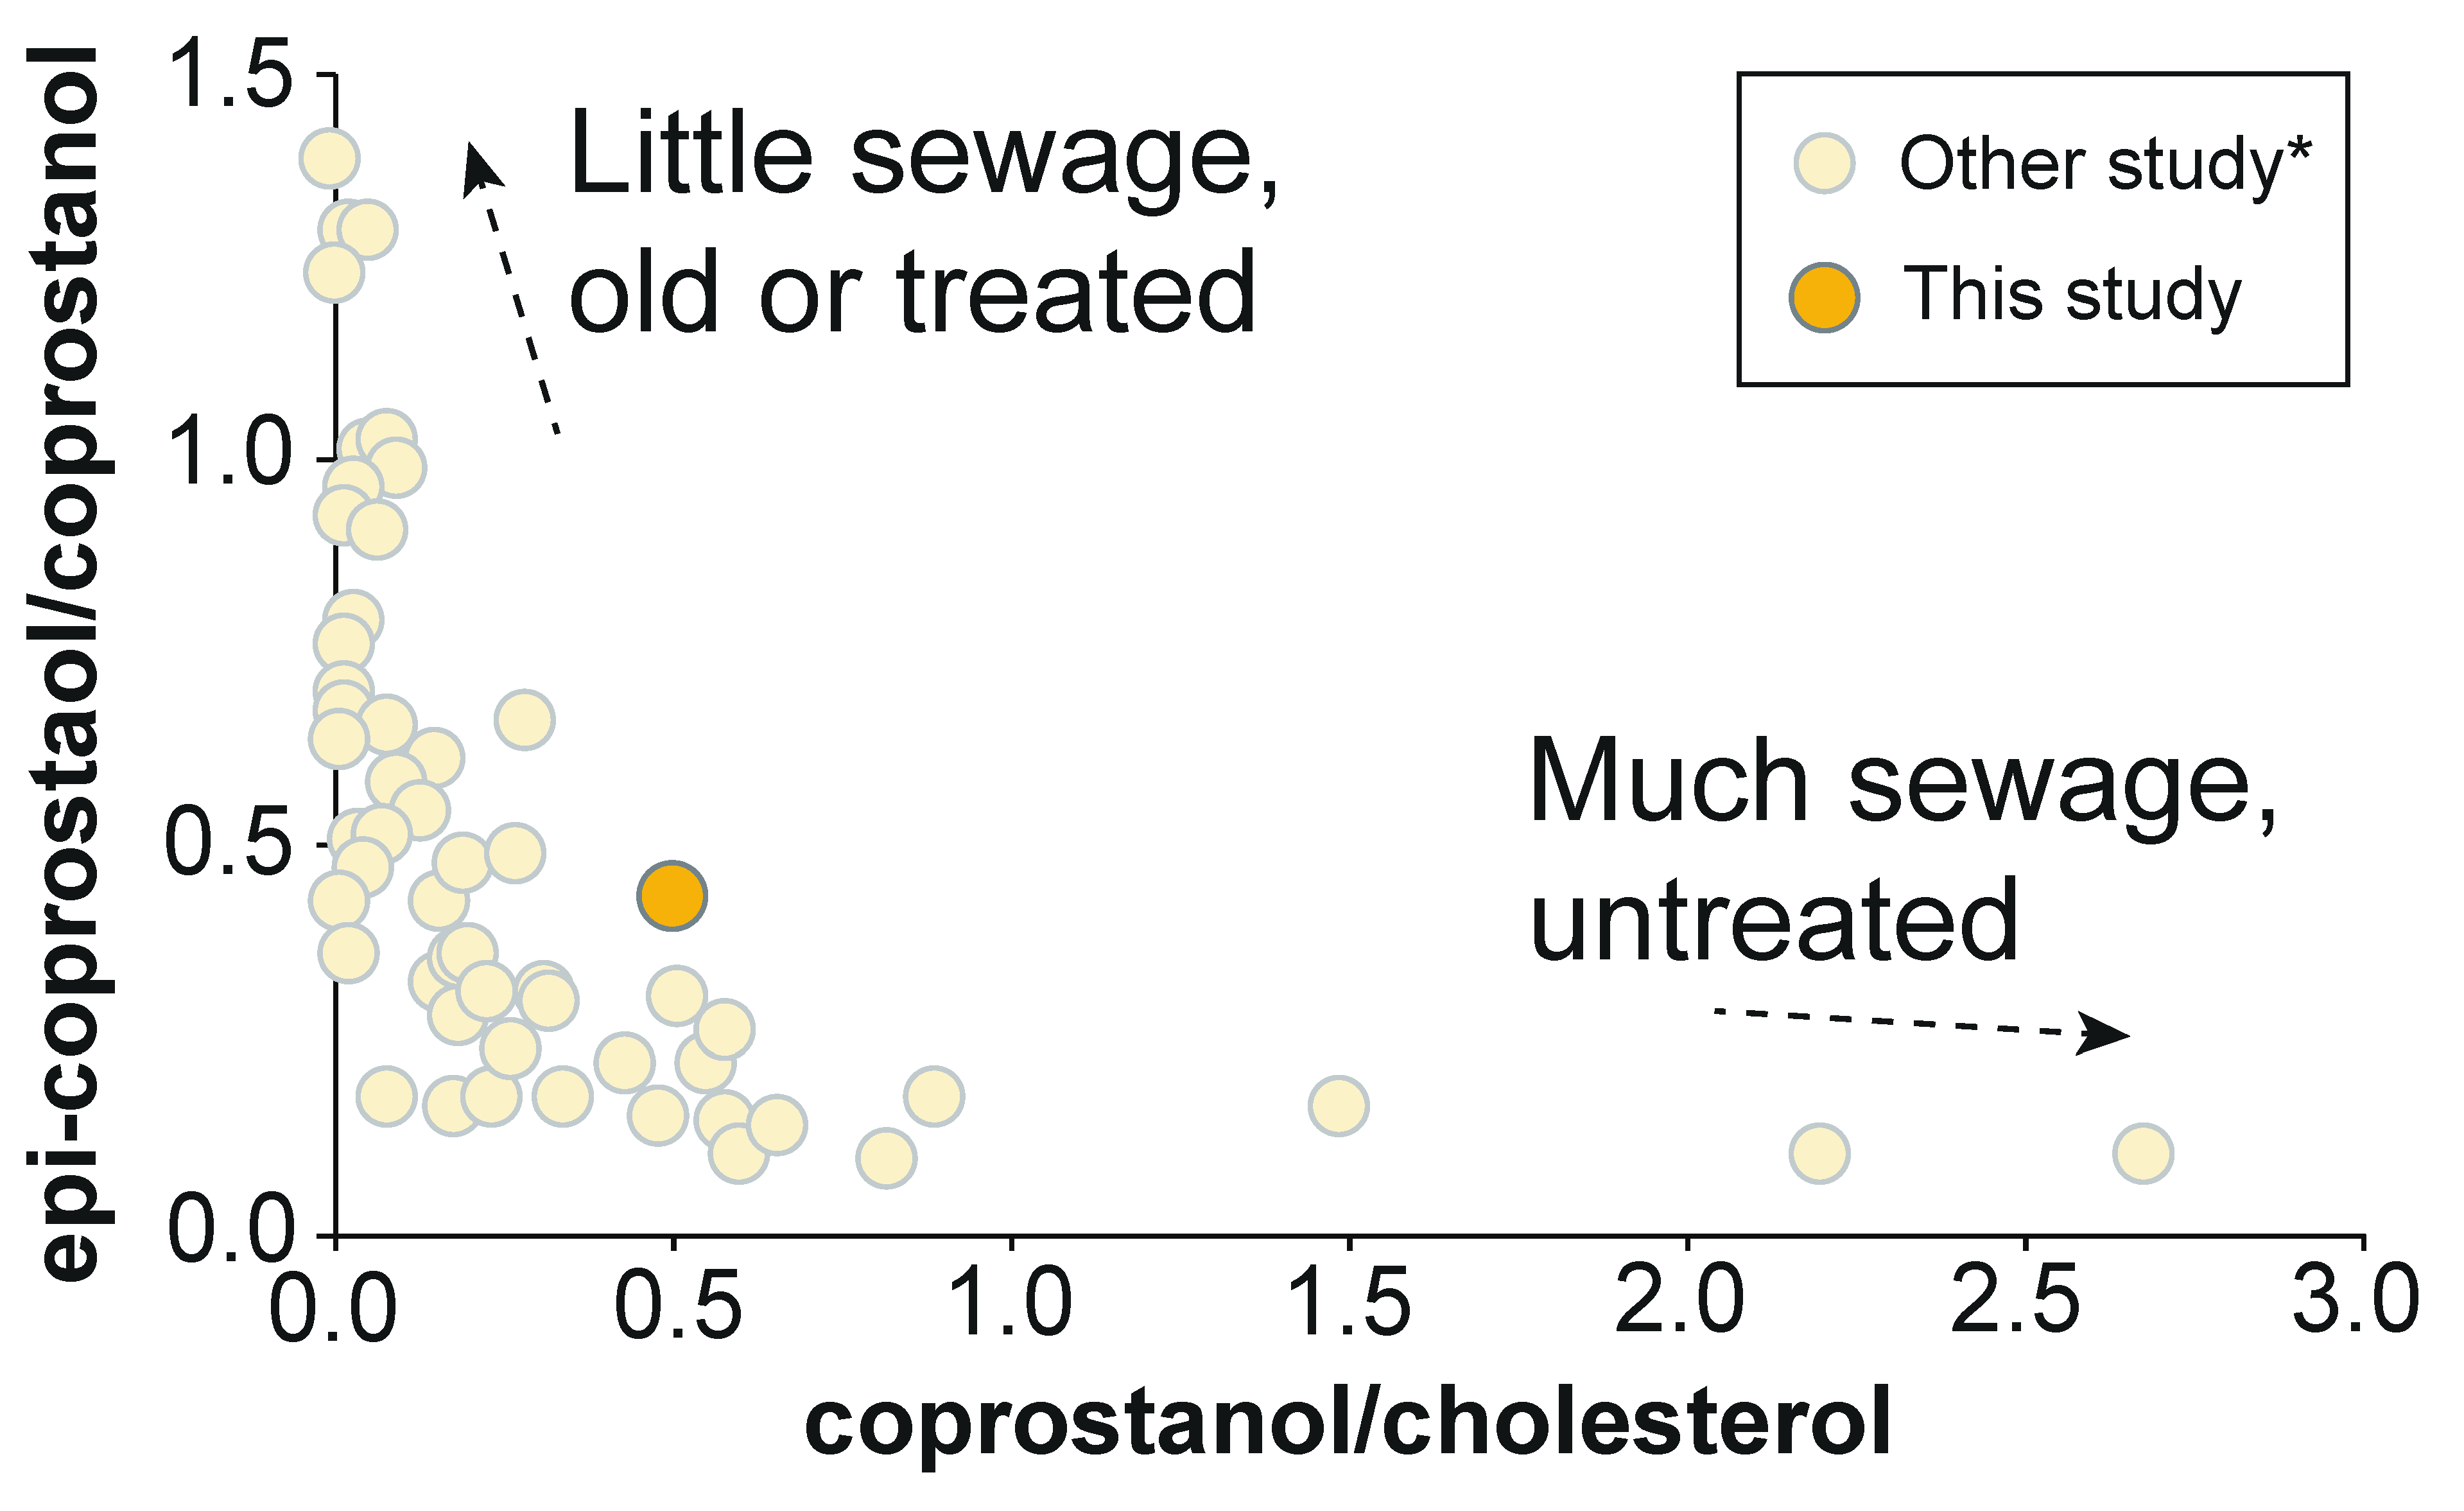
3.4. 5β(H)-Stanols (Coprostanol and Epicoprostanol)
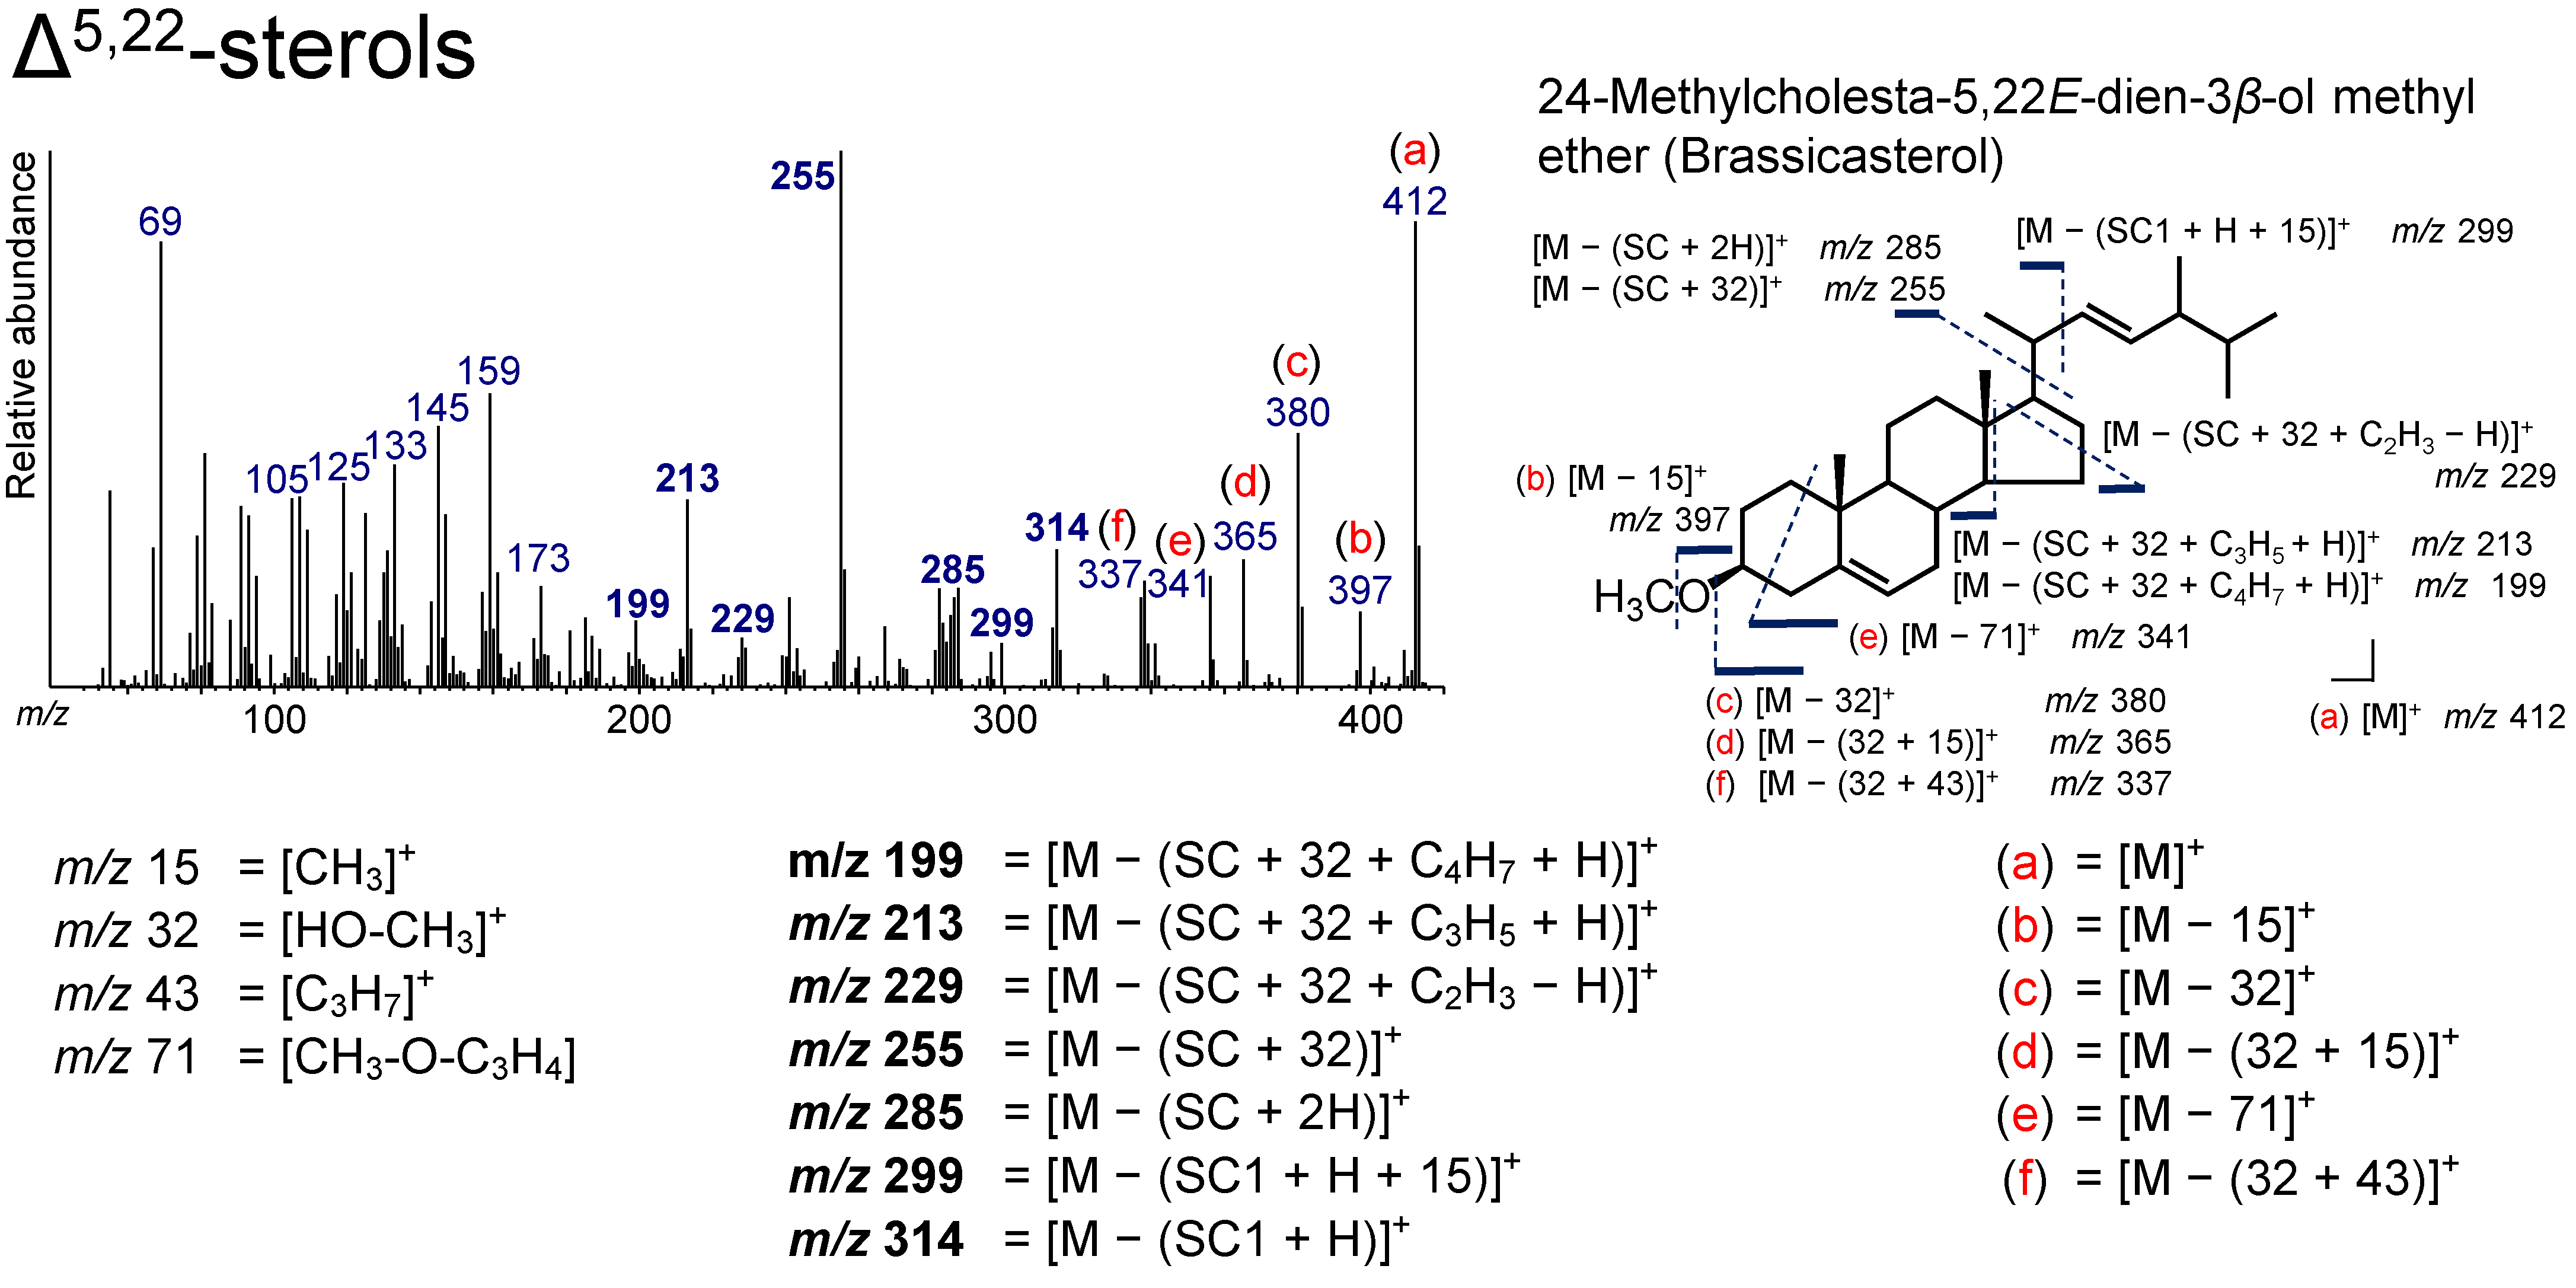
3.5. Δ5,22-Sterol (Brassicasterol)
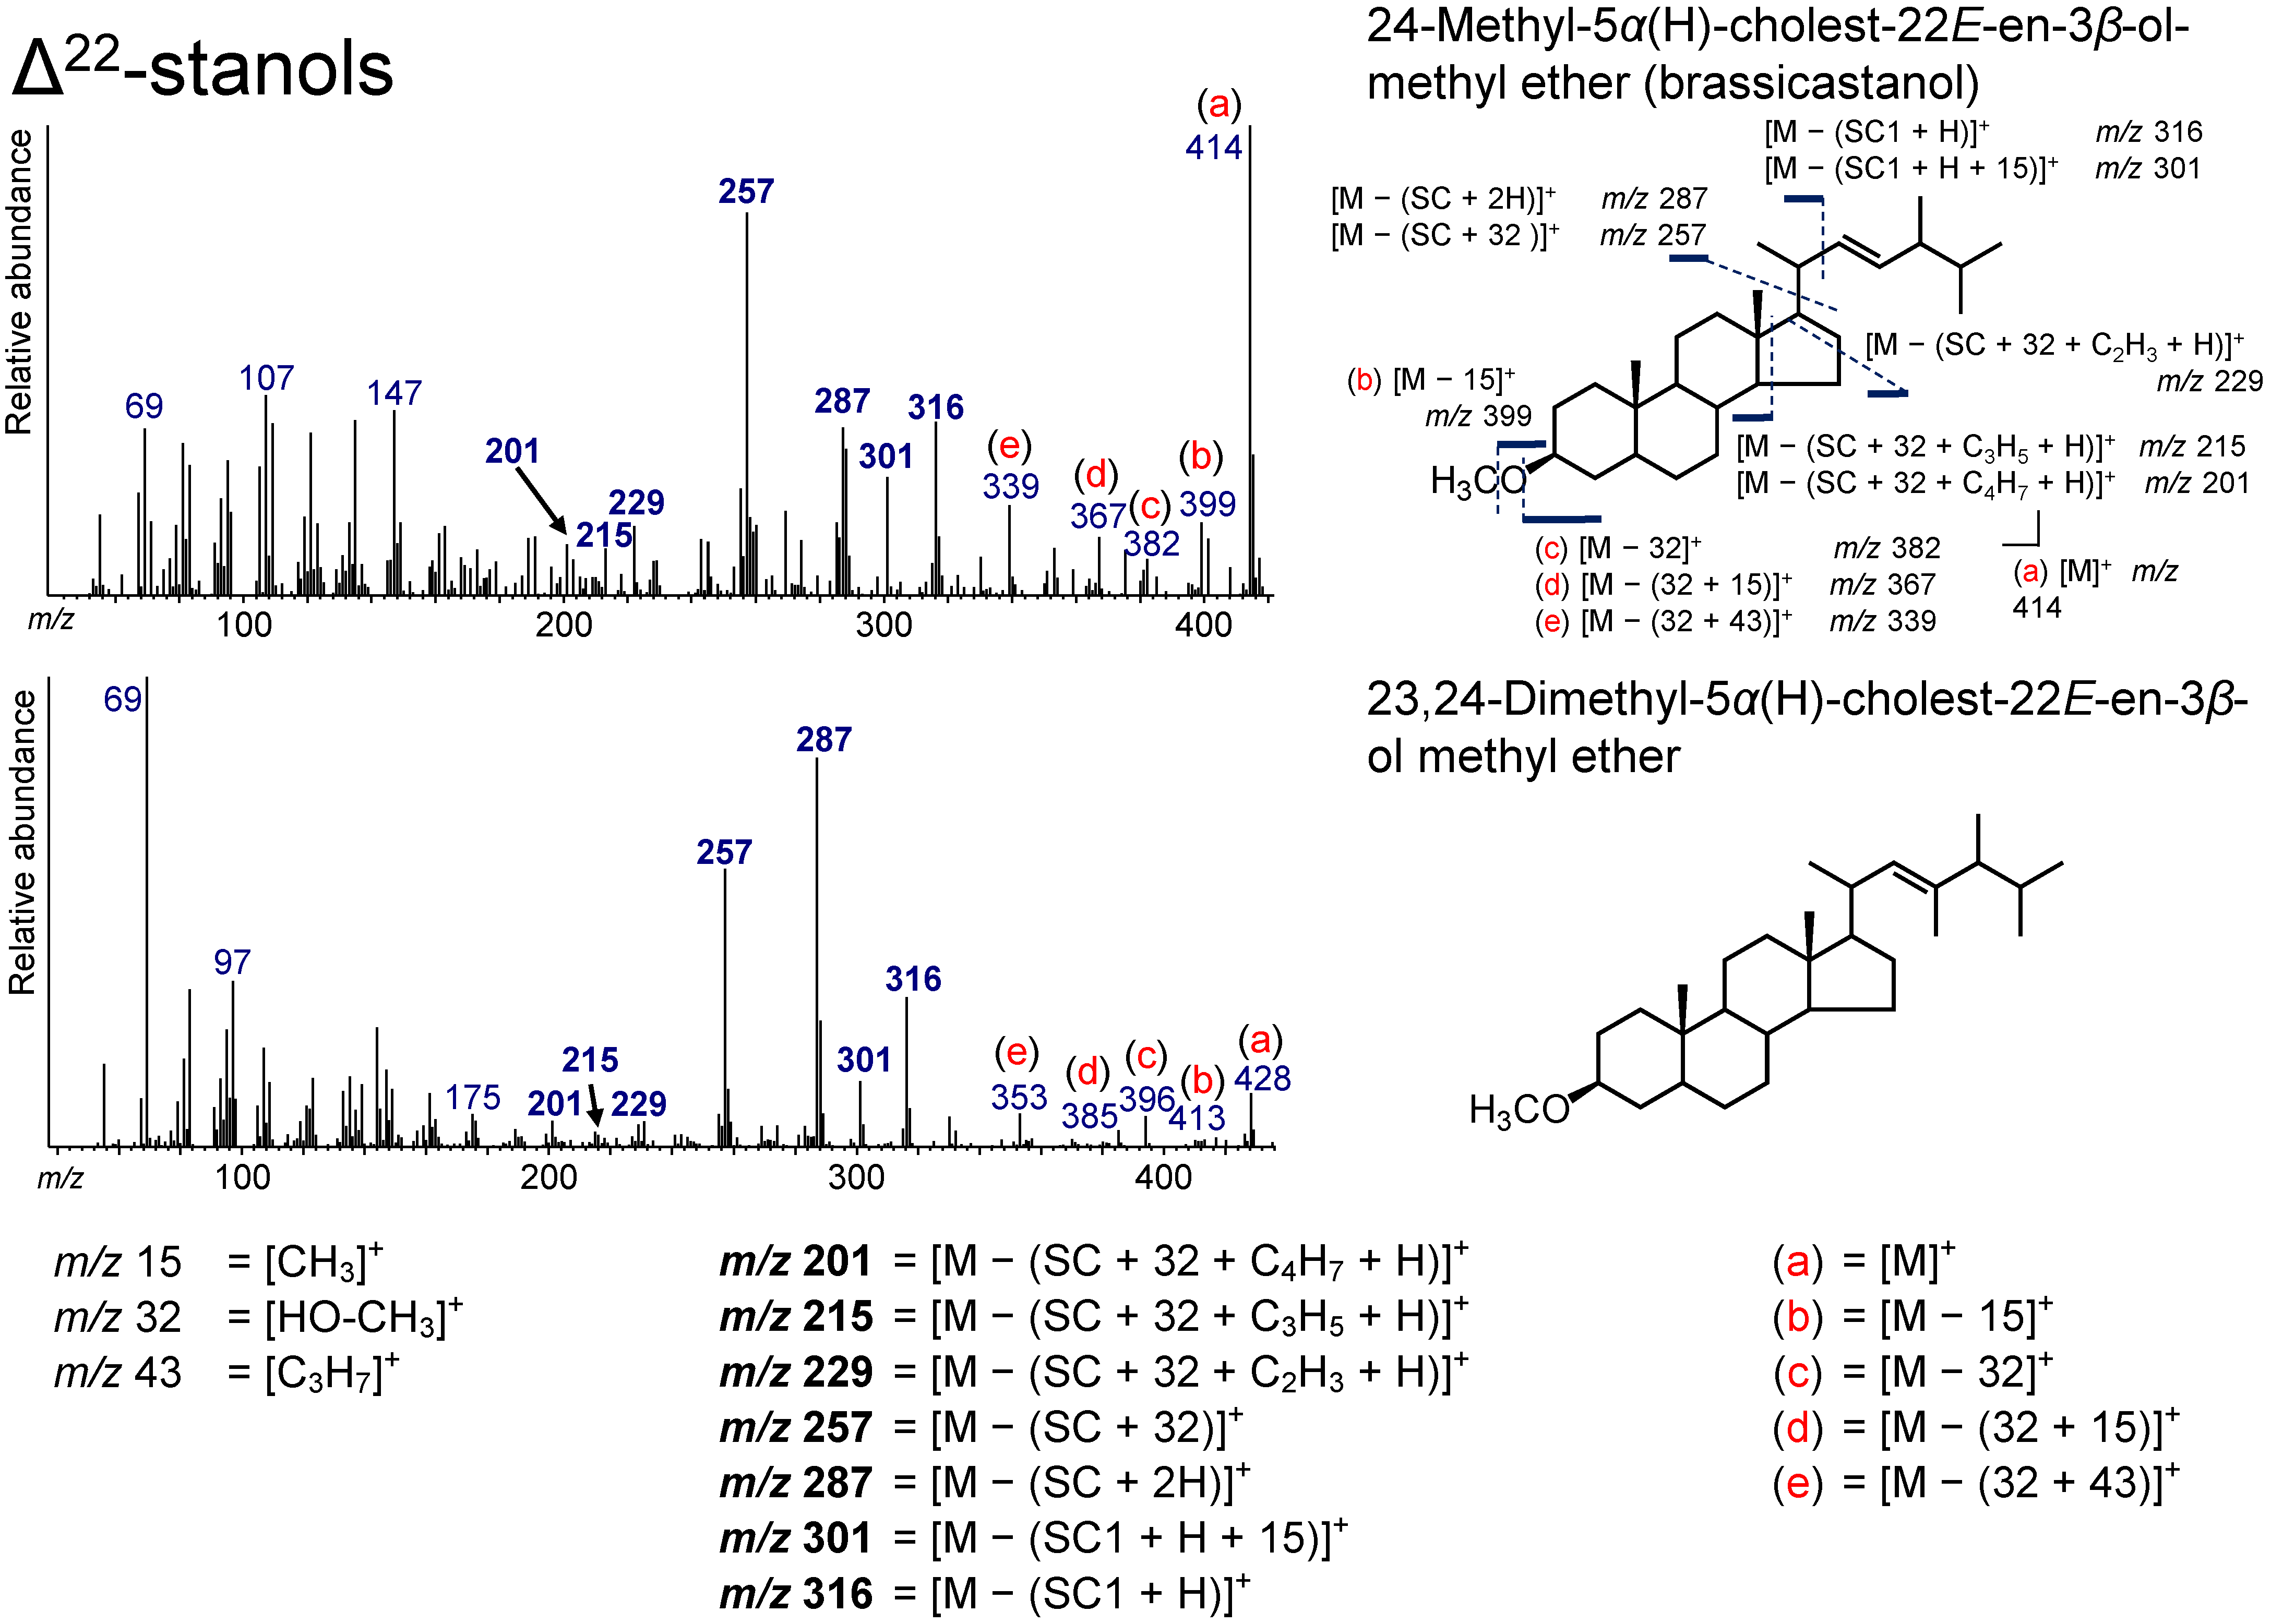
3.6. Δ22-Stanols
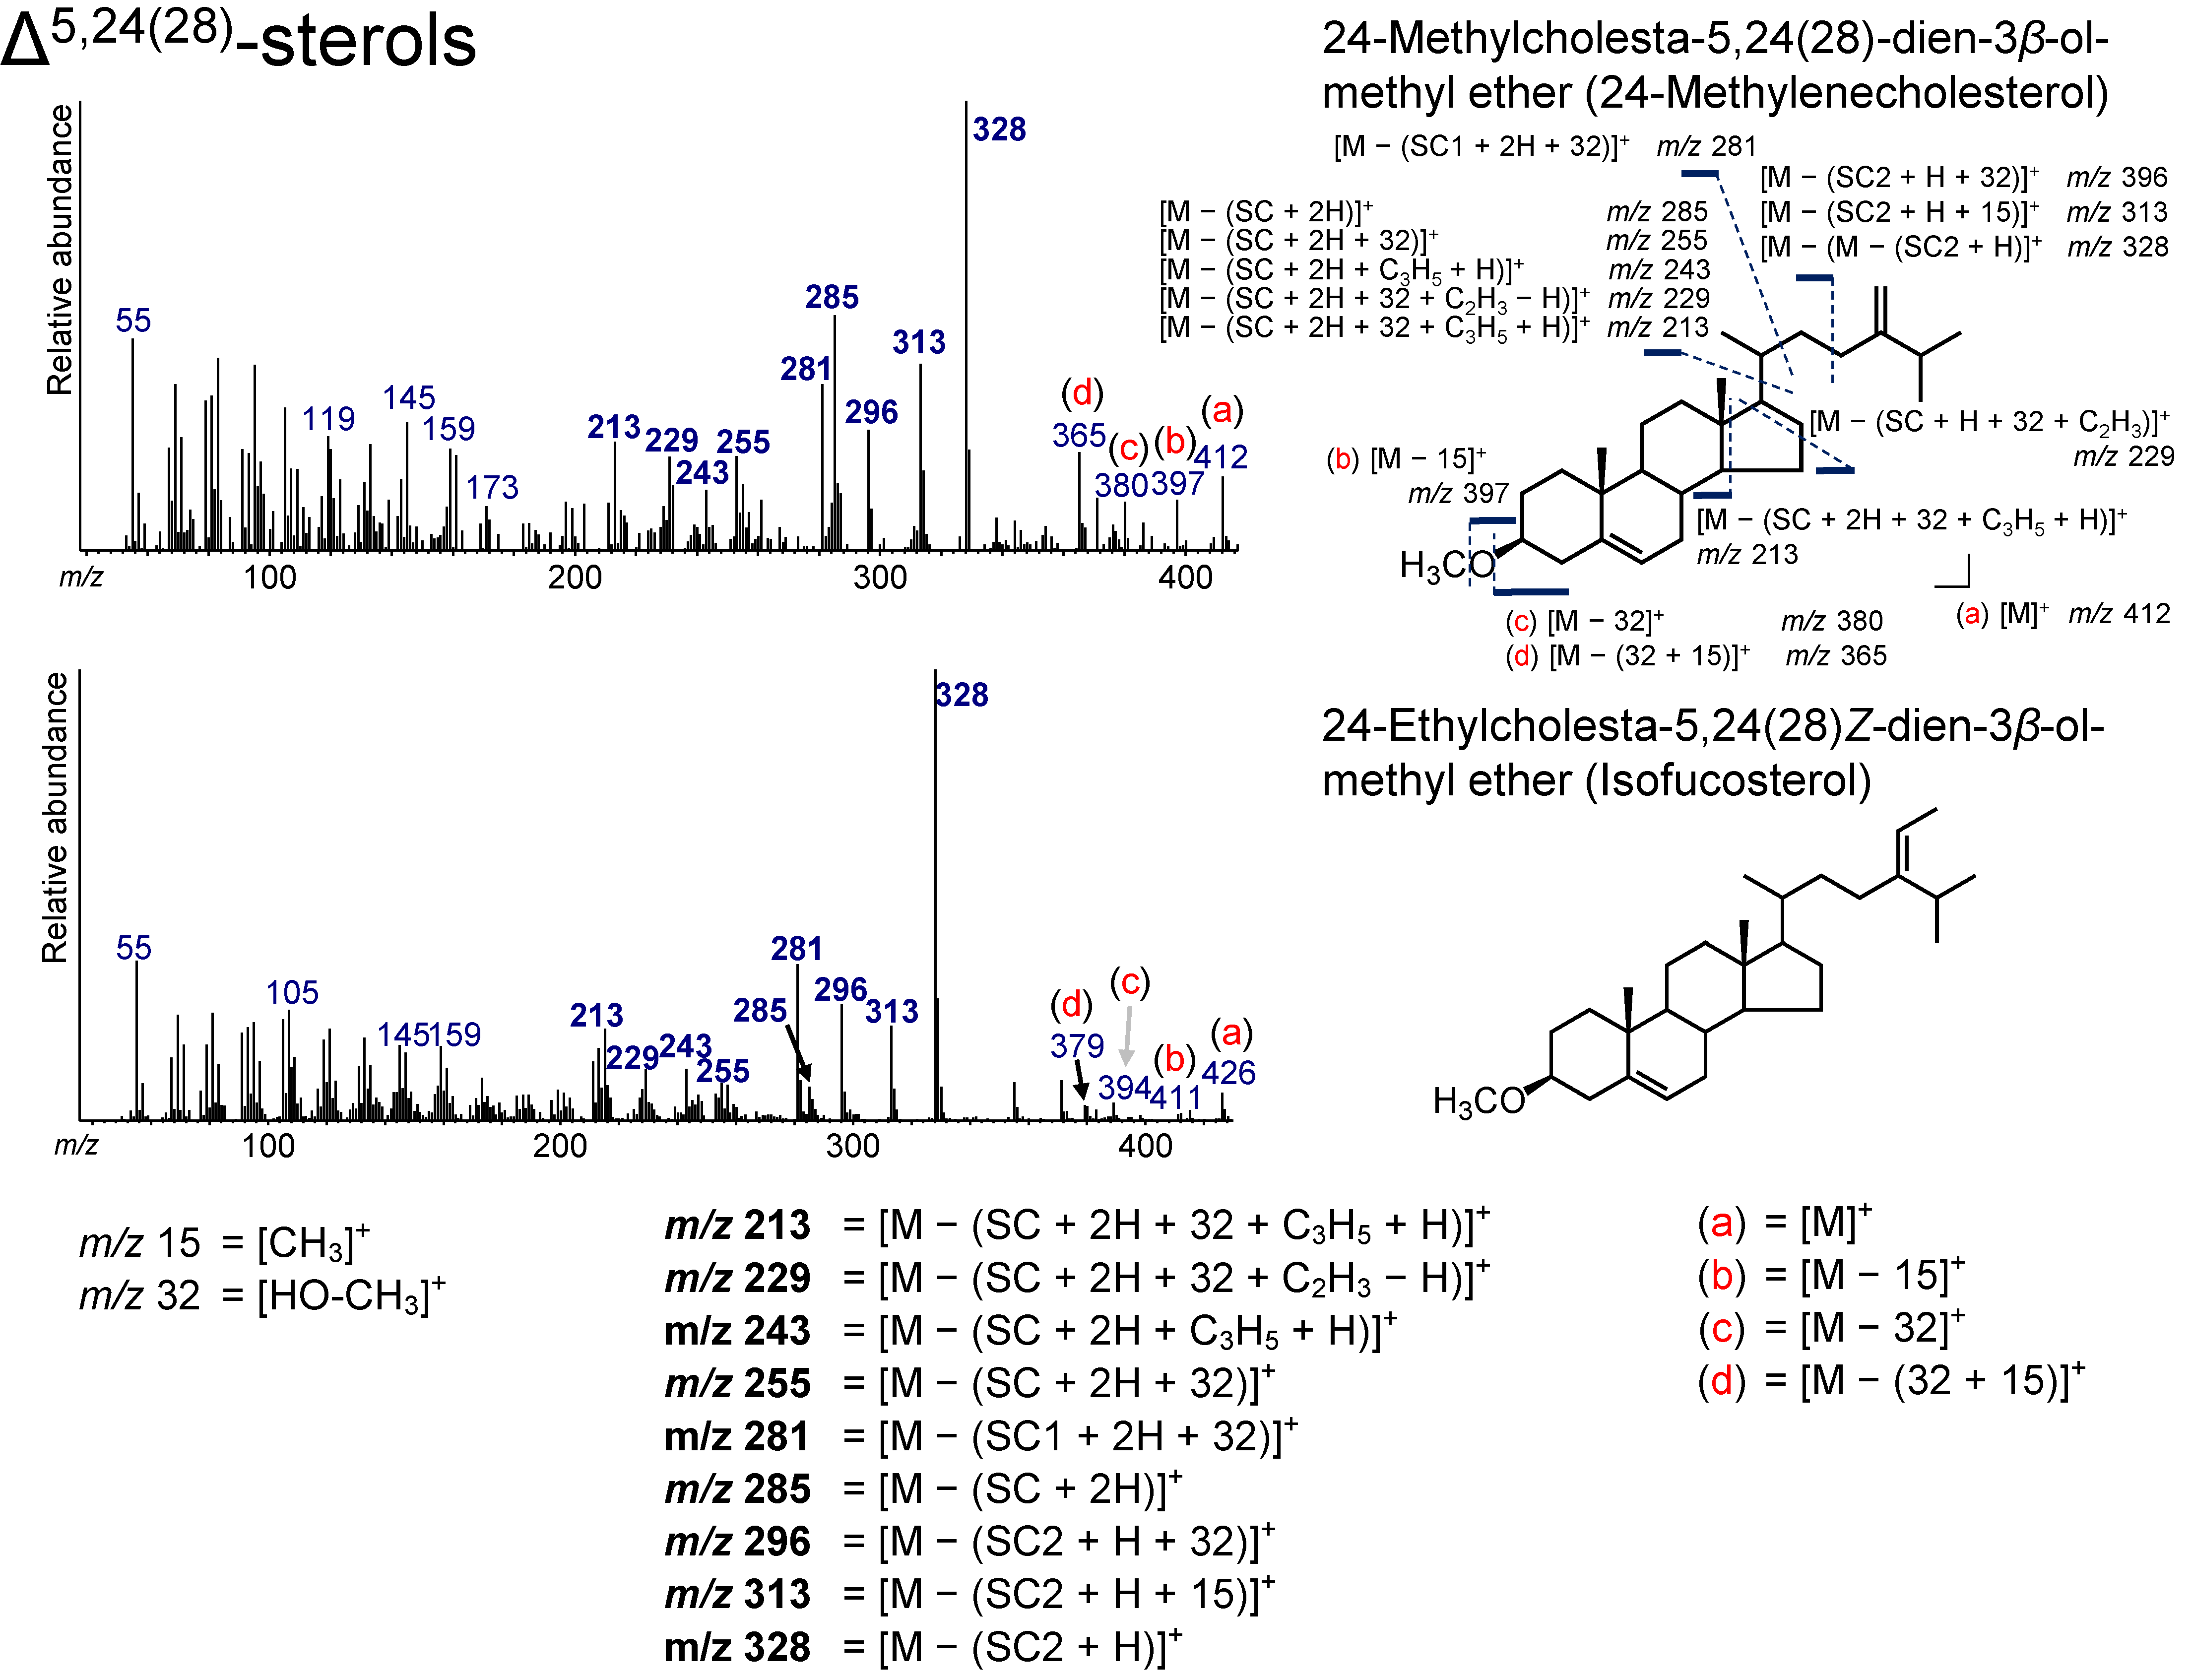
3.7. Δ5,24(28)-Sterols
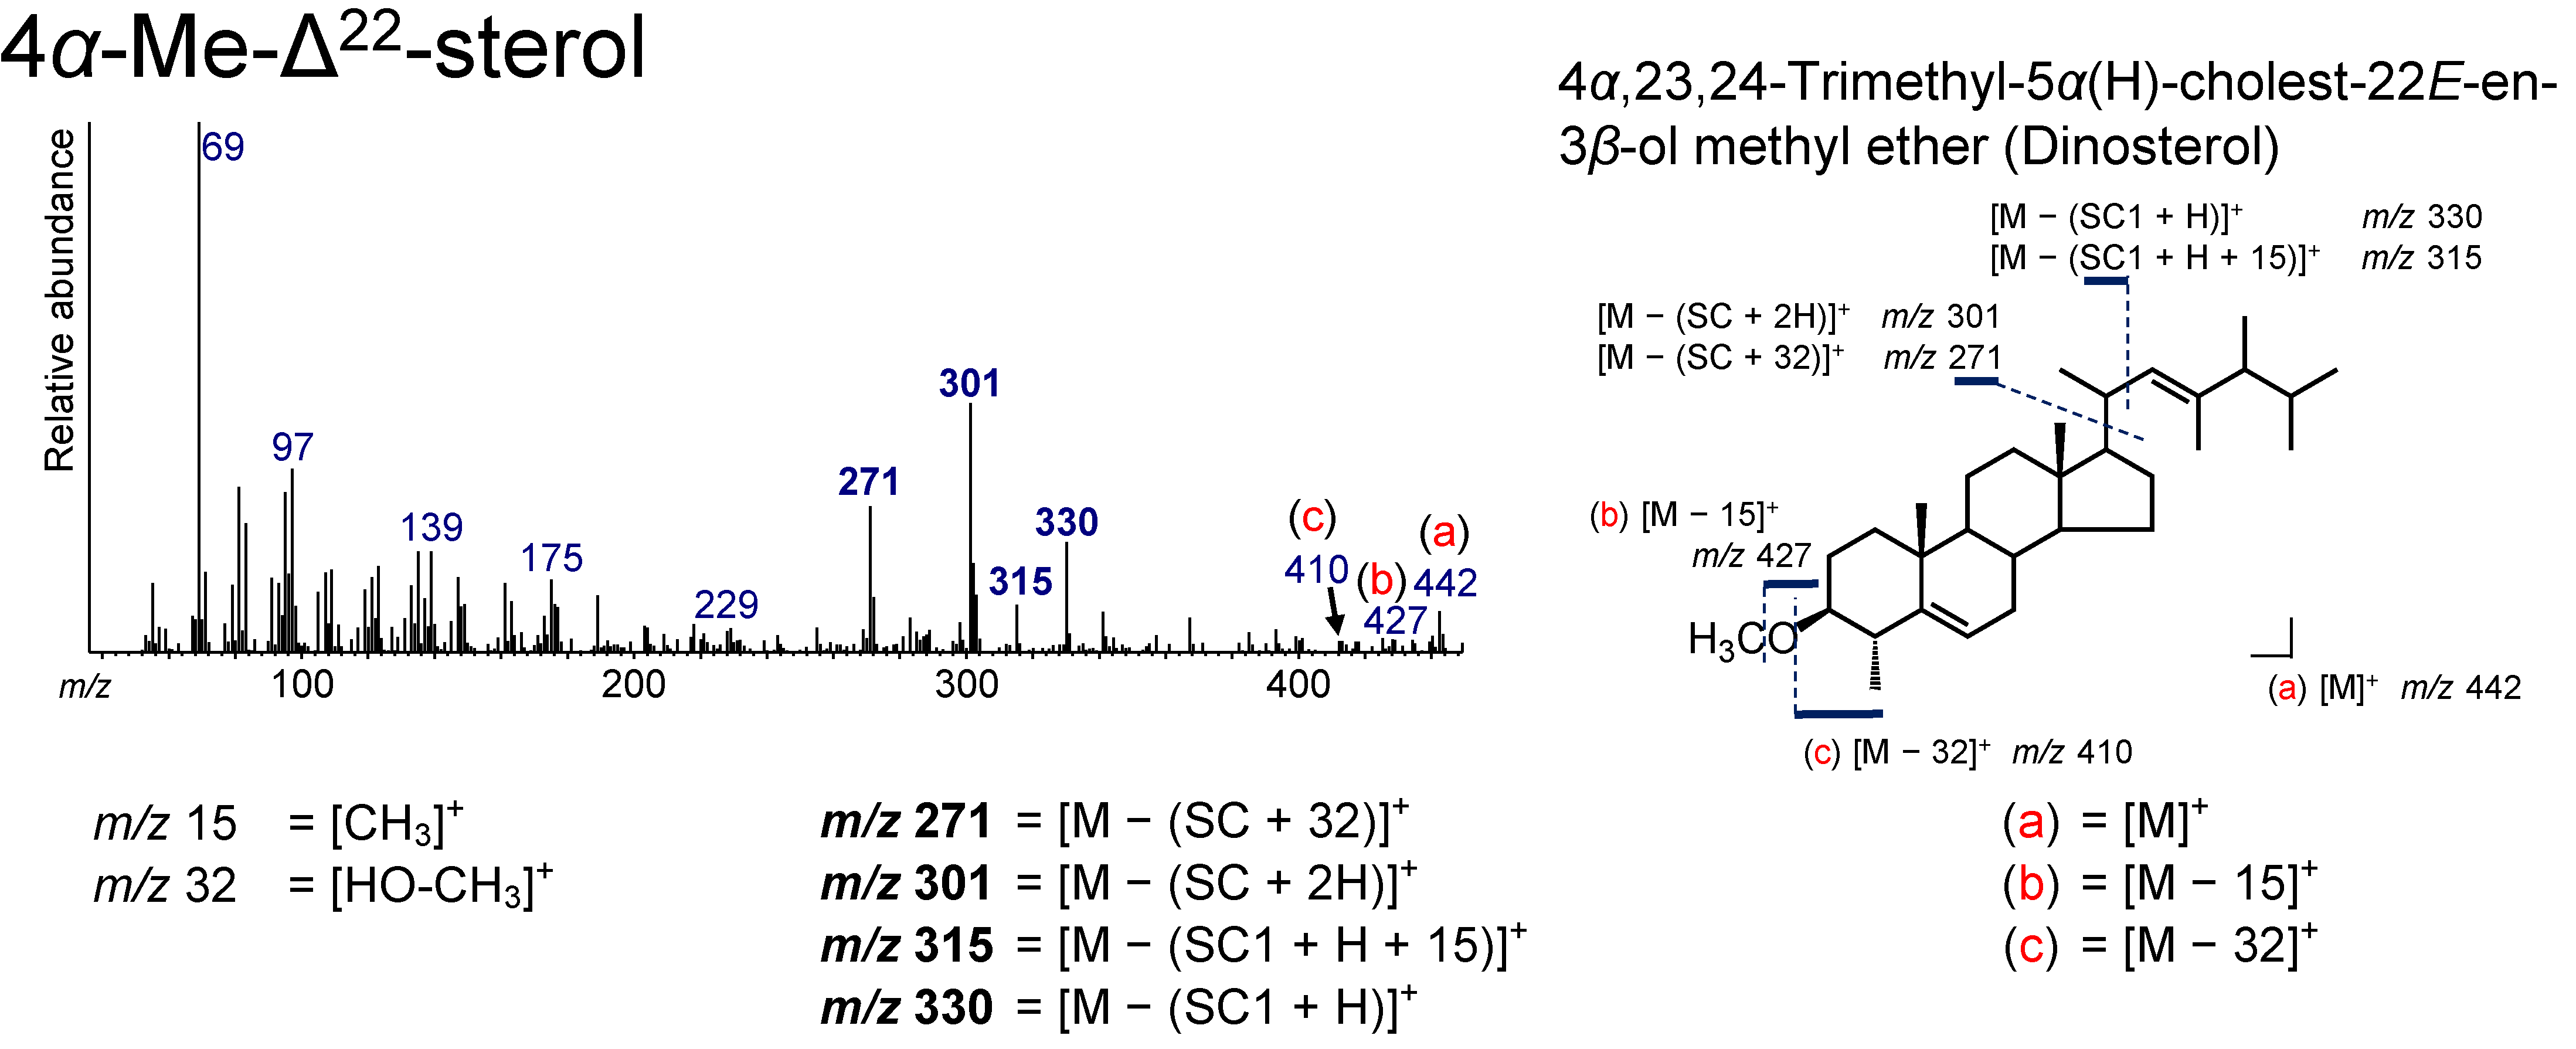
3.8. 4α-Me-Δ22 Sterol
3.9. Identification of Sterols from the Extracted Ion Chromatograms
4. Conclusions
Author Contributions
Founding
Acknowledgments
Conflicts of Interest
References
- Volkman, J.K. Sterols in microorganisms. Appl. Microbiol. Biotechnol. 2003, 60, 495–506. [Google Scholar] [CrossRef] [PubMed]
- Volkman, J.K. A review of sterol markers for marine and terrigenous organic matter. Org. Geochem. 1986, 9, 83–99. [Google Scholar] [CrossRef]
- Wu, P.; Bi, R.; Duan, S.; Jin, H.; Chen, J.; Hao, Q.; Cai, Y.; Mao, X.; Zhao, M. Spatiotemporal variations of phytoplankton in the East China Sea and the Yellow Sea revealed by lipid biomarkers. J. Geophys. Res. 2016, 121, 109–125. [Google Scholar] [CrossRef]
- Bechtel, A.; Schubert, C.J. Biogeochemistry of particulate organic matter from lakes of different trophic levels in Switzerland. Org. Geochem. 2009, 40, 441–454. [Google Scholar] [CrossRef]
- Nakakuni, M.; Dairiki, C.; Kaur, G.; Yamamoto, S. Stanol to sterol ratios in late Quaternary sediments from southern California: An indicator for continuous variability of the oxygen minimum zone. Org. Geochem. 2017, 111, 126–135. [Google Scholar] [CrossRef]
- Nakakuni, M.; Kitano, J.; Uemura, H.; Yamamoto, S. Modern sediment records of stanol to sterol ratios in Lake Suigetsu, Japan: An indicator of variable lacustrine redox conditions. Org. Geochem. 2018, 119, 59–71. [Google Scholar] [CrossRef]
- Wakeham, S.G. Reduction of stenols to stanols in particulate matter at oxic-anoxic boundaries in sea water. Nature 1989, 342, 787–790. [Google Scholar] [CrossRef]
- Huang, W.Y.; Meinschein, W.G. Sterols as ecological indicators. Geochim. Et Cosmochim. Acta 1979, 43, 739–745. [Google Scholar] [CrossRef]
- Rontani, J.F.; Charriere, B.; Petit, M.; Vaultier, F.; Heipieper, H.J.; Link, H.; Chaillou, G.; Sempéré, R. Degradation state of organic matter in surface sediments from the Southern Beaufort Sea: A lipid approach. Biogeosciences 2012, 9, 3513–3530. [Google Scholar] [CrossRef]
- Rontani, J.F.; Vaultier, F.; Bonin, P. Biotic and abiotic degradation of marine and terrestrial higher plant material in intertidal surface sediments from Arcachon Bay (France): A lipid approach. Mar. Chem. 2014, 158, 69–79. [Google Scholar] [CrossRef]
- Rontani, J.F.; Charrière, B.; Sempéré, R.; Doxaran, D.; Vaultier, F.; Vonk, J.E.; Volkman, J.K. Degradation of sterols and terrigenous organic matter in waters of the Mackenzie Shelf, Canadian Arctic. Org. Geochem. 2014, 75, 61–73. [Google Scholar] [CrossRef]
- Huang, W.Y.; Meinschein, W.G. Sterols in sediments from Baffin Bay. Texas. Geochim. Et Cosmochim. Acta 1978, 42, 1391–1396. [Google Scholar] [CrossRef]
- Smith, D.J.; Eglinton, G.; Morris, R.J.; Poutanen, E.L. Aspects of the steroid geochemistry of a recent diatomaceous sediment from the Namibian Shelf. Oceanol. Acta 1982, 5, 365–378. [Google Scholar]
- Smith, D.J.; Eglinton, G.; Morris, R.J.; Poutanen, E.L. Aspects of the steroid geochemistry of an interfacial sediment from the Peruvian upwelling. Oceanol. Acta 1983, 6, 211–219. [Google Scholar]
- Volkman, J.K.; Kearney, P.; Jeffrey, S.W. A new source of 4-methyl sterols and 5α(H)-stanols in sediments: Prymnesiophyte microalgae of the genus Pavlova. Org. Geochem. 1990, 15, 489–497. [Google Scholar] [CrossRef]
- Junker, J.; Chong, I.; Kamp, F.; Steiner, H.; Giera, M.; Müller, C.; Bracher, F. Comparison of strategies for the determination of sterol sulfates via GC–MS leading to a novel deconjugation-derivatization protocol. Molecules 2019, 24, 2353. [Google Scholar] [CrossRef] [PubMed]
- Challinor, J.M. Review: The development and applications of thermally assisted hydrolysis and methylation reactions. J. Anal. Appl. Pyrolysis 2001, 61, 3–34. [Google Scholar] [CrossRef]
- Challinor, J.M. Characterization of wood by pyrolysis derivatisation-gas chromatography/mass spectrometry. J. Anal. Appl. Pyrolysis 1995, 34, 93–107. [Google Scholar] [CrossRef]
- Kuroda, K.; Suzuki, A. Analysis of cinnamic acids in rice (Oryza sativa) by simultaneous pyrolysis-methylation-gas chromatography. Mokuzai Gakkaishi 1995, 41, 851–857. [Google Scholar]
- Hatcher, P.G.; Nanny, M.A.; Minard, R.D.; Dible, S.D.; Carson, D.M. Comparison of two thermochemolytic methods for the analysis of lignin in decomposing gymnosperm wood: The CuO oxidation method and the method of thermochemolysis with tetramethylammonium hydroxide (TMAH). Org. Geochem. 1995, 23, 881–888. [Google Scholar] [CrossRef]
- Fabbri, D.; Helleur, R. Characterization of the tetramethylammonium hydroxide thermochemolysis products of carbohydrates. J. Anal. Appl. Pyrolysis 1999, 49, 277–293. [Google Scholar] [CrossRef]
- Gallois, N.; Templier, J.; Derenne, S. Pyrolysis-gas chromatography–mass spectrometry of the 20 protein amino acids in the presence of TMAH. J. Anal. Appl. Pyrolysis 2007, 80, 216–230. [Google Scholar] [CrossRef]
- Zang, X.; Brown, J.C.; van Heemst, J.D.H.; Palumbo, A.; Hatcher, P.G. Characterization of amino acids and proteinaceous materials using online tetramethylammonium hydroxide (TMAH) thermochemolysis and gas chromatography-mass spectrometry technique. J. Anal. Appl. Pyrolysis 2001, 61, 181–193. [Google Scholar] [CrossRef]
- He, Y.; Buch, A.; Morisson, M.; Szopa, C.; Freissinet, C.; Williams, A.; Millan, M.; Guzman, M.; Navarro-Gonzalez, R.; Bonnet, J.Y.; et al. Application of TMAH thermochemolysis to the detection of nucleobases: Application to the MOMA and SAM space experiment. Talanta 2019, 204, 802–811. [Google Scholar] [CrossRef]
- Martin, F.; Gonzalez-Vila, F.J.; del Rio, J.C.; Verdejo, T. Pyrolysis derivatization of humic substances 1. Pyrolysis of fulvic acids in the presence of tetramethylammonium hydroxide. J. Anal. Appl. Pyrolysis 1994, 28, 71–80. [Google Scholar] [CrossRef]
- Hatcher, P.G.; Clifford, D.J. Flash pyrolysis and in situ methylation of humic acids from soil. Org. Geochem. 1994, 21, 1081–1092. [Google Scholar] [CrossRef]
- Clifford, D.J.; Carson, D.M.; McKinney, D.E.; Bortiatynski, J.M.; Hatcher, P.G. A new rapid technique for the characterization of lignin in vascular plants: Thermochemolysis with tetramethylammonium hydroxide (TMAH). Org. Geochem. 1995, 23, 169–175. [Google Scholar] [CrossRef]
- McKinney, D.E.; Carson, D.M.; Clifford, D.J.; Minard, R.D.; Hatcher, P.G. Off-line thermochemolysis versus flash pyrolysis for the in-situ methylation of lignin: Is pyrolysis necessary? J. Anal. Appl. Pyrolysis 1995, 34, 41–46. [Google Scholar] [CrossRef]
- Asperger, A.; Engewald, W.; Fabian, G. Thermally assisted hydrolysis and methylation – a simple and rapid online derivatization method for the gas chromatographic analysis of natural waxes. J. Anal. Appl. Pyrolysis 2001, 61, 91–109. [Google Scholar] [CrossRef]
- Isobe, K.O.; Tarao, M.; Chiem, N.H.; Minh, L.Y.; Takada, H. Effect of environmental factors on the relationship between concentrations of coprostanol and decal indicator bacteria in tropical (Mekong Delta) and temperate (Tokyo) freshwaters. Appl. Environ. Microbiol. 2004, 70, 814–821. [Google Scholar] [CrossRef]
- Kamata, M.; Kanai, Y.; Ueta, M.; Narusue, M.; Kurosawa, R.; Koita, M.; Fukui, K.; Tsukamoto, Y.; Kaji, K.; Kaneko, T. Assessment of the amount of benthos by substratum conditions. Strix 1996, 14, 201–203. [Google Scholar]
- Arao, K.; Motai, K.; Shibahara, T.; Furota, T. Ichthyofauna of Yatsu Tidal Flat in the inner Tokyo Bay. Nat. Hist. Rep. Kanagawa 2019, 40, 41–48. [Google Scholar]
- Murakami, K.; Inoue-Kohama, A. Water environmental condition assessment of inflow rivers of Yatsu tidal flat using biotic indicator. J. Jpn. Soc. Civ. Eng. Ser. B3 (Ocean Eng.) 2015, 71, 844–849. [Google Scholar]
- Idler, D.R.; Safe, L.M.; Safe, S.H. Mass spectrometric studies of methyl ether derivatives of sterols. Steroids 1970, 16, 251–262. [Google Scholar] [CrossRef]
- Nishimura, M. Origin of stanols in young lacustrine sediments. Nature 1977, 270, 711–712. [Google Scholar] [CrossRef]
- Nishimura, M.; Koyama, T. The occurrence of stanols in various living organisms and the behavior of sterols in contemporary sediments. Geochim. Et Cosmochim. Acta 1977, 41, 379–385. [Google Scholar] [CrossRef]
- Rosenfeld, R.S.; Hellman, L. Reduction and esterification of cholesterol and sitosterol by homogenates of feces. J. Lipid Res. 1971, 12, 192–197. [Google Scholar]
- Eyssen, H.J.; Parmentier, G.G.; Compernolle, F.C.; de Pauw, G.; Piessens-Denef, M. Biohydrogenation of sterols by eubacterium ATCC 21,408—Nova Species. Eur. J. Biochem. 1973, 36, 411–421. [Google Scholar] [CrossRef]
- Rinna, J.; Warning, B.; Meyers, P.A.; Brumsack, H.J.; Rullkötter, J. Combined organic and inorganic geochemical reconstruction of paleodepositional conditions of a Pliocene sapropel from the eastern Mediterranean Sea. Geochim. Et Cosmochim. Acta 2002, 66, 1969–1986. [Google Scholar] [CrossRef]
- Antharam, V.C.; McEwen, D.C.; Garrett, T.J.; Dossey, A.T.; Li, E.C.; Kozlov, A.N.; Mesbah, Z.; Wang, G.P. An integrated metabolomic and microbiome analysis identified specific gut microbiota associated with fecal cholesterol and coprostanol in Clostridium difficile infection. PLoS ONE 2016, 11, 1–23. [Google Scholar] [CrossRef]
- Kriaa, A.; Bourgin, M.; Mkaouar, H.; Jablaoui, A.; Akermi, N.; Soussou, S.; Maguin, E.; Rhimi, M. Microbial reduction of cholesterol to coprostanol: An old concept and new insights. Catalysts 2019, 9, 167. [Google Scholar] [CrossRef]
- Férézou, J.; Gouffier, E.; Coste, T.; Chevallier, F. Daily elimination of fecal neutral sterols by humans. Digestion 1978, 18, 201–212. [Google Scholar] [CrossRef] [PubMed]
- Leeming, R.; Ball, A.; Ashbolt, N.; Nichols, P. Using faecal sterols from humans and animals to distinguish faecal pollution in receiving waters. Water Res. 1996, 30, 2893–2900. [Google Scholar] [CrossRef]
- Hatcher, P.G.; McGillivary, P.A. Sewage contamination in the New York Bight. Coprostanol as an indicator. Environ. Sci. Technol. 1979, 13, 1225–1229. [Google Scholar] [CrossRef]
- Pierce, R.H.; Brown, R.C. Coprostanol distribution from sewage discharge into Sarasota Bay, Florida. Bull. Environ. Contam. Toxicol. 1984, 32, 75–79. [Google Scholar] [CrossRef] [PubMed]
- Walker, R.W.; Wun, C.K.; Litsky, W.; Dutka, B.J. Coprostanol as an indicator of fecal pollution. C R C Crit. Rev. Environ. Control 1982, 12, 91–112. [Google Scholar] [CrossRef]
- Rada, J.P.A.; Duarte, A.C.; Pato, P.; Cachada, A.; Carreira, R.S. Sewage contamination of sediments from two Portuguese Atlantic coastal systems, revealed by fecal sterols. Mar. Pollut. Bull. 2016, 103, 319–324. [Google Scholar] [CrossRef]
- Lyons, B.P.; Devlin, M.J.; Abdul Hamid, S.A.; Al-Otiabi, A.F.; Al-Enezi, M.; Massoud, M.S.; Al-Zaidan, A.S.; Smith, A.J.; Morris, S.; Bersuder, P.; et al. Microbial water quality and sedimentary faecal sterols as markers of sewage contamination in Kuwait. Mar. Pollut. Bull. 2015, 100, 689–698. [Google Scholar] [CrossRef]
- Frena, M.; Bataglion, G.A.; Tonietto, A.E.; Eberlin, M.N.; Alexandre, M.R.; Madureira, L.A.S. Assessment of anthropogenic contamination with sterol markers in surface sediments of a tropical estuary (Itajaí-Açu, Brazil). Sci. Total Environ. 2016, 544, 432–438. [Google Scholar] [CrossRef]
- Brooks, C.J.W.; Horning, E.C.; Young, J.S. Characterization of sterols by gas chromatography-mass spectrometry of the trimethylsilyl ethers. Lipids 1968, 3, 391–402. [Google Scholar] [CrossRef]
- Ballantine, J.A.; Roberts, J.C.; Morris, R.J. Marine sterols. III—the sterol compositions of oceanic jellyfish. The use of gas chromatographic mass spectrometric techniques to identify unresolved components. Biol. Mass Spectrom. 1976, 3, 14–20. [Google Scholar] [CrossRef] [PubMed]
- de Leeuw, J.W.; Rijpstra, W.I.C.; Schenck, P.A.; Volkman, J.K. Free, esterified and residual bound sterols in Black Sea Unit I sediments. Geochim. Et Cosmochim. Acta 1983, 47, 455–465. [Google Scholar] [CrossRef]
- McCalley, D.V.; Cooke, M.; Nickless, G. Effect of sewage treatment on faecal sterols. Water Res. 1981, 15, 1019–1025. [Google Scholar] [CrossRef]
- Mudge, S.M.; Seguel, C.G. Organic contamination of San Vicente Bay, Chile. Mar. Pollut. Bull. 1999, 38, 1011–1021. [Google Scholar] [CrossRef]
- Mudge, S.M.; Ball, A.S. Sewage. In Environmental Forensics; Morrison, R.D., Murphy, B.L., Eds.; Elsevier: Amsterdam, The Netherlands, 2006; pp. 36–53. [Google Scholar]
- Grimalt, J.O.; Albaigés, J. Characterization of the depositional environments of the Ebro Delta (western Mediterranean) by the study of sedimentary lipid markers. Mar. Geol. 1990, 95, 207–224. [Google Scholar] [CrossRef]
- Gilpin, B.J.; Gregor, J.E.; Savill, M.G. Identification of the source of faecal pollution in contaminated rivers. Water Sci. Technol. 2002, 46, 9–15. [Google Scholar] [CrossRef]
- Barrett, S.M.; Volkman, J.K.; Dunstan, G.A.; LeRoi, J.M. Sterols of 14 species of marine diatoms (Bacillariophyta). J. Phycol. 1995, 31, 360–369. [Google Scholar] [CrossRef]
- Orcutt, D.M.; Patterson, G.W. Sterol, fatty acid and elemental composition of diatoms grown in chemically defined media. Comp. Biochem. Physiol. Part B: Comp. Biochem. 1975, 50, 579–583. [Google Scholar] [CrossRef]
- Gladu, P.K.; Patterson, G.W.; Wikfors, G.H.; Chitwood, D.J.; Lusby, W.R. Sterols of some diatoms. Phytochemistry 1991, 30, 2301–2303. [Google Scholar] [CrossRef]
- Rampen, S.W.; Abbas, B.A.; Schouten, S.; Sinninghe Damsté, J.S. A comprehensive study of sterols in marine diatoms (Bacillariophyta): Implications for their use as tracers for diatom productivity. Limnol. Oceanogr. 2010, 55, 91–105. [Google Scholar] [CrossRef]
- Huang, W.Y.; Meinschein, W.G. Sterols as source indicators of organic materials in sediments. Geochim. Et Cosmochim. Acta 1976, 40, 323–330. [Google Scholar]
- Wyllie, S.G.; Djerassi, C. Mass spectrometry in structural and stereochemical problems. CXLVI. Mass spectrometric fragmentations typical of sterols wit unsaturated side chains. J. Org. Chem. 1968, 33, 305–313. [Google Scholar] [CrossRef]
- Volkman, J.K.; Gllan, F.T.; Johns, R.B.; Eglinton, G. Sources of neutral lipids in a temperate intertidal sediment. Geochim. Et Cosmochim. Acta 1981, 45, 1817–1828. [Google Scholar] [CrossRef]
- Rontani, J.F.; Belt, S.T.; Brown, T.A.; Amiraux, R.; Gosselin, M.; Vaultier, F.; Mundy, C.J. Monitoring abiotic degradation in sinking versus suspended Arctic sea ice algae during a spring ice melt using specific lipid oxidation tracers. Org. Geochem. 2016, 98, 82–97. [Google Scholar] [CrossRef]
- Smik, L.; Belt, S.T.; Lieser, J.L.; Armand, L.K.; Leventer, A. Distributions of highly branched isoprenoid alkenes and other algal lipids in surface waters from East Antarctica: Further insights for biomarker-based paleo sea-ice reconstruction. Org. Geochem. 2016, 95, 71–80. [Google Scholar] [CrossRef] [Green Version]
- Rontani, J.F.; Belt, S.T.; Amiraux, R. Biotic and abiotic degradation of the sea ice diatom biomarker IP25 and selected algal sterols in near-surface Arctic sediments. Org. Geochem. 2018, 118, 73–88. [Google Scholar] [CrossRef] [Green Version]
- Withers, N. Dinoflagellate sterols. In Marine Natural Products. Scheuer, P.J., Ed.; Academic Press: Cambridge, MA, USA, 1983; pp. 87–130. [Google Scholar]
- Janouškovec, J.; Gavelis, G.S.; Burki, F.; Dinh, D.; Bachvaroff, T.R.; Gornik, S.G.; Bright, K.J.; Imanian, B.; Strom, S.L.; Delwiche, C.F.; et al. Major transitions in dinoflagellate evolution unveiled by phylotranscriptomics. Proc. Natl. Acad. Sci. 2017, 114, 171–180. [Google Scholar] [CrossRef]
- Piretti, M.V.; Pagliuca, G.; Boni, L.; Pistocchi, R.; Diamante, M.; Gazzotti, T. Investigation of 4-methyl sterols from cultured dinoflagellate algal strains. J. Phycol. 1997, 33, 61–67. [Google Scholar] [CrossRef]
- Robinson, N.; Eglinton, G.; Brassell, S.C.; Cranwell, P.A. Dinoflagellate origin for sedimentary 4α-methylsteroids and 5α-stanols. Nature 1984, 308, 439–442. [Google Scholar] [CrossRef]
- Boon, J.J.; Rijpstra, W.I.C.; De Lange, F.; De Leeuw, J.W.; Yoshioka, M.; Shimizu, Y. Black Sea sterol—A molecular fossil for dinoflagellate blooms. Nature 1979, 277, 125–127. [Google Scholar] [CrossRef]


| Retention Time (min) | Symbol * | Systematic Name | Trivial Name | Formula (Methylated Ether) | Molecular Weight (Methylated Ether) | m/z ** |
|---|---|---|---|---|---|---|
| 38.358 | Coprostanol | 5β(H)-Cholestan-3β-ol methyl ether | Coprostanol | C28H50O | 402 | 215, 230, 248, 257, 345, 355, 370, 387, 402 |
| 38.671 | Epicoprostanol | 5β(H)-Cholestan-3α-ol methyl ether | Epicoprostanol | C28H50O | 402 | 215, 230, 248, 257, 345, 355, 370, 387, 402 |
| 38.777 | Epicholestanol | 5α(H)-Cholestan-3α-ol methyl ether | Epicholestanol | C28H50O | 402 | 215, 230, 248, 257, 345, 355, 370, 387, 402 |
| 39.096 | 27Δ5 | Cholest-5-en-3β-ol methyl ether | Cholesterol | C28H48O | 400 | 213, 229, 255, 275, 301, 326, 329, 353, 368, 385, 400 |
| 39.228 | 27Δ0 | 5α(H)-Cholestan-3β-ol methyl ether | Cholestanol | C28H50O | 402 | 215, 230, 248, 257, 345, 355, 370, 387, 402 |
| 39.578 | 28(24)Δ5,22E | 24-Methylcholesta-5,22E-dien-3β-ol methyl ether | Brassicasterol | C29H48O | 412 | 199, 213, 229, 255, 285, 299, 314, 337, 341, 365, 380, 397, 412 |
| 39.722 | 28(24)Δ22E | 24-Methyl-5α(H)-cholest-22E-en-3β-ol methyl ether | Brassicastanol | C29H50O | 414 | 201, 215, 229, 257, 287, 301, 316, 339, 367, 382, 399, 414 |
| 40.166 | 28(24)Δ5,24(28) | 24-Methylcholesta-5,24(28)-dien-3β-ol methyl ether | 24-Methylenecholesterol | C29H48O | 412 | 213, 229, 243, 255, 281, 285, 296, 313, 328, 365, 380, 397, 412 |
| 40.229 | 28(24)Δ5 | 24-Methylcholest-5-en-3β-ol methyl ether | Campesterol | C29H50O | 414 | 213, 255, 261, 289, 301, 315, 340, 343, 367, 382, 399, 414 |
| 40.360 | 28(24)Δ0 | 24-Methyl-5α(H)-cholestan-3β-ol methyl ether | Campestanol | C29H52O | 416 | 215, 230, 248, 257, 359, 369, 384, 401, 416 |
| 40.616 | 29(23,24)Δ22E | 23,24-Dimethyl-5α(H)-cholest-22E-en-3β-ol methyl ether | C30H52O | 428 | 201, 215, 229, 257, 287, 301, 316, 353, 385, 396, 413, 428 | |
| 41.161 | 29(24)Δ5 | 24-Ethylcholest-5-en-3β-ol methyl ether | Sitosterol | C30H52O | 428 | 213, 229, 255, 275, 303, 329, 354, 357, 381, 396, 413, 428 |
| 41.217 | 30(4,23,24)Δ22E | 4α,23,24-Trimethyl-5α(H)-cholest-22E-en-3β-ol methyl ether | Dinosterol | C31H54O | 442 | 271, 301, 315, 330, 410, 427, 442 |
| 41.298 | 29(24)Δ0 | 24-Ethyl-5α(H)-cholestan-3β-ol methyl ether | Sitostanol | C30H54O | 430 | 215, 230, 248, 257, 290, 373, 383, 398, 415, 430 |
| 41.336 | 29(24)Δ5,24(28)Z | 24-Ethylcholesta-5,24(28)Z-dien-3β-ol methyl ether | Isofucosterol | C30H50O | 426 | 213, 229, 243, 255, 281, 285, 296, 313, 328, 379, 394, 411, 426 |
© 2019 by the authors. Licensee MDPI, Basel, Switzerland. This article is an open access article distributed under the terms and conditions of the Creative Commons Attribution (CC BY) license (http://creativecommons.org/licenses/by/4.0/).
Share and Cite
Nakakuni, M.; Yamasaki, Y.; Yoshitake, N.; Takehara, K.; Yamamoto, S. Methyl Ether-Derivatized Sterols and Coprostanol Produced via Thermochemolysis Using Tetramethylammonium Hydroxide (TMAH). Molecules 2019, 24, 4040. https://doi.org/10.3390/molecules24224040
Nakakuni M, Yamasaki Y, Yoshitake N, Takehara K, Yamamoto S. Methyl Ether-Derivatized Sterols and Coprostanol Produced via Thermochemolysis Using Tetramethylammonium Hydroxide (TMAH). Molecules. 2019; 24(22):4040. https://doi.org/10.3390/molecules24224040
Chicago/Turabian StyleNakakuni, Masatoshi, Yoshimi Yamasaki, Nonoka Yoshitake, Keiko Takehara, and Shuichi Yamamoto. 2019. "Methyl Ether-Derivatized Sterols and Coprostanol Produced via Thermochemolysis Using Tetramethylammonium Hydroxide (TMAH)" Molecules 24, no. 22: 4040. https://doi.org/10.3390/molecules24224040
APA StyleNakakuni, M., Yamasaki, Y., Yoshitake, N., Takehara, K., & Yamamoto, S. (2019). Methyl Ether-Derivatized Sterols and Coprostanol Produced via Thermochemolysis Using Tetramethylammonium Hydroxide (TMAH). Molecules, 24(22), 4040. https://doi.org/10.3390/molecules24224040