Isoliquiritigenin Inhibits Ovarian Cancer Metastasis by Reversing Epithelial-to-Mesenchymal Transition

Abstract
1. Introduction
2. Results
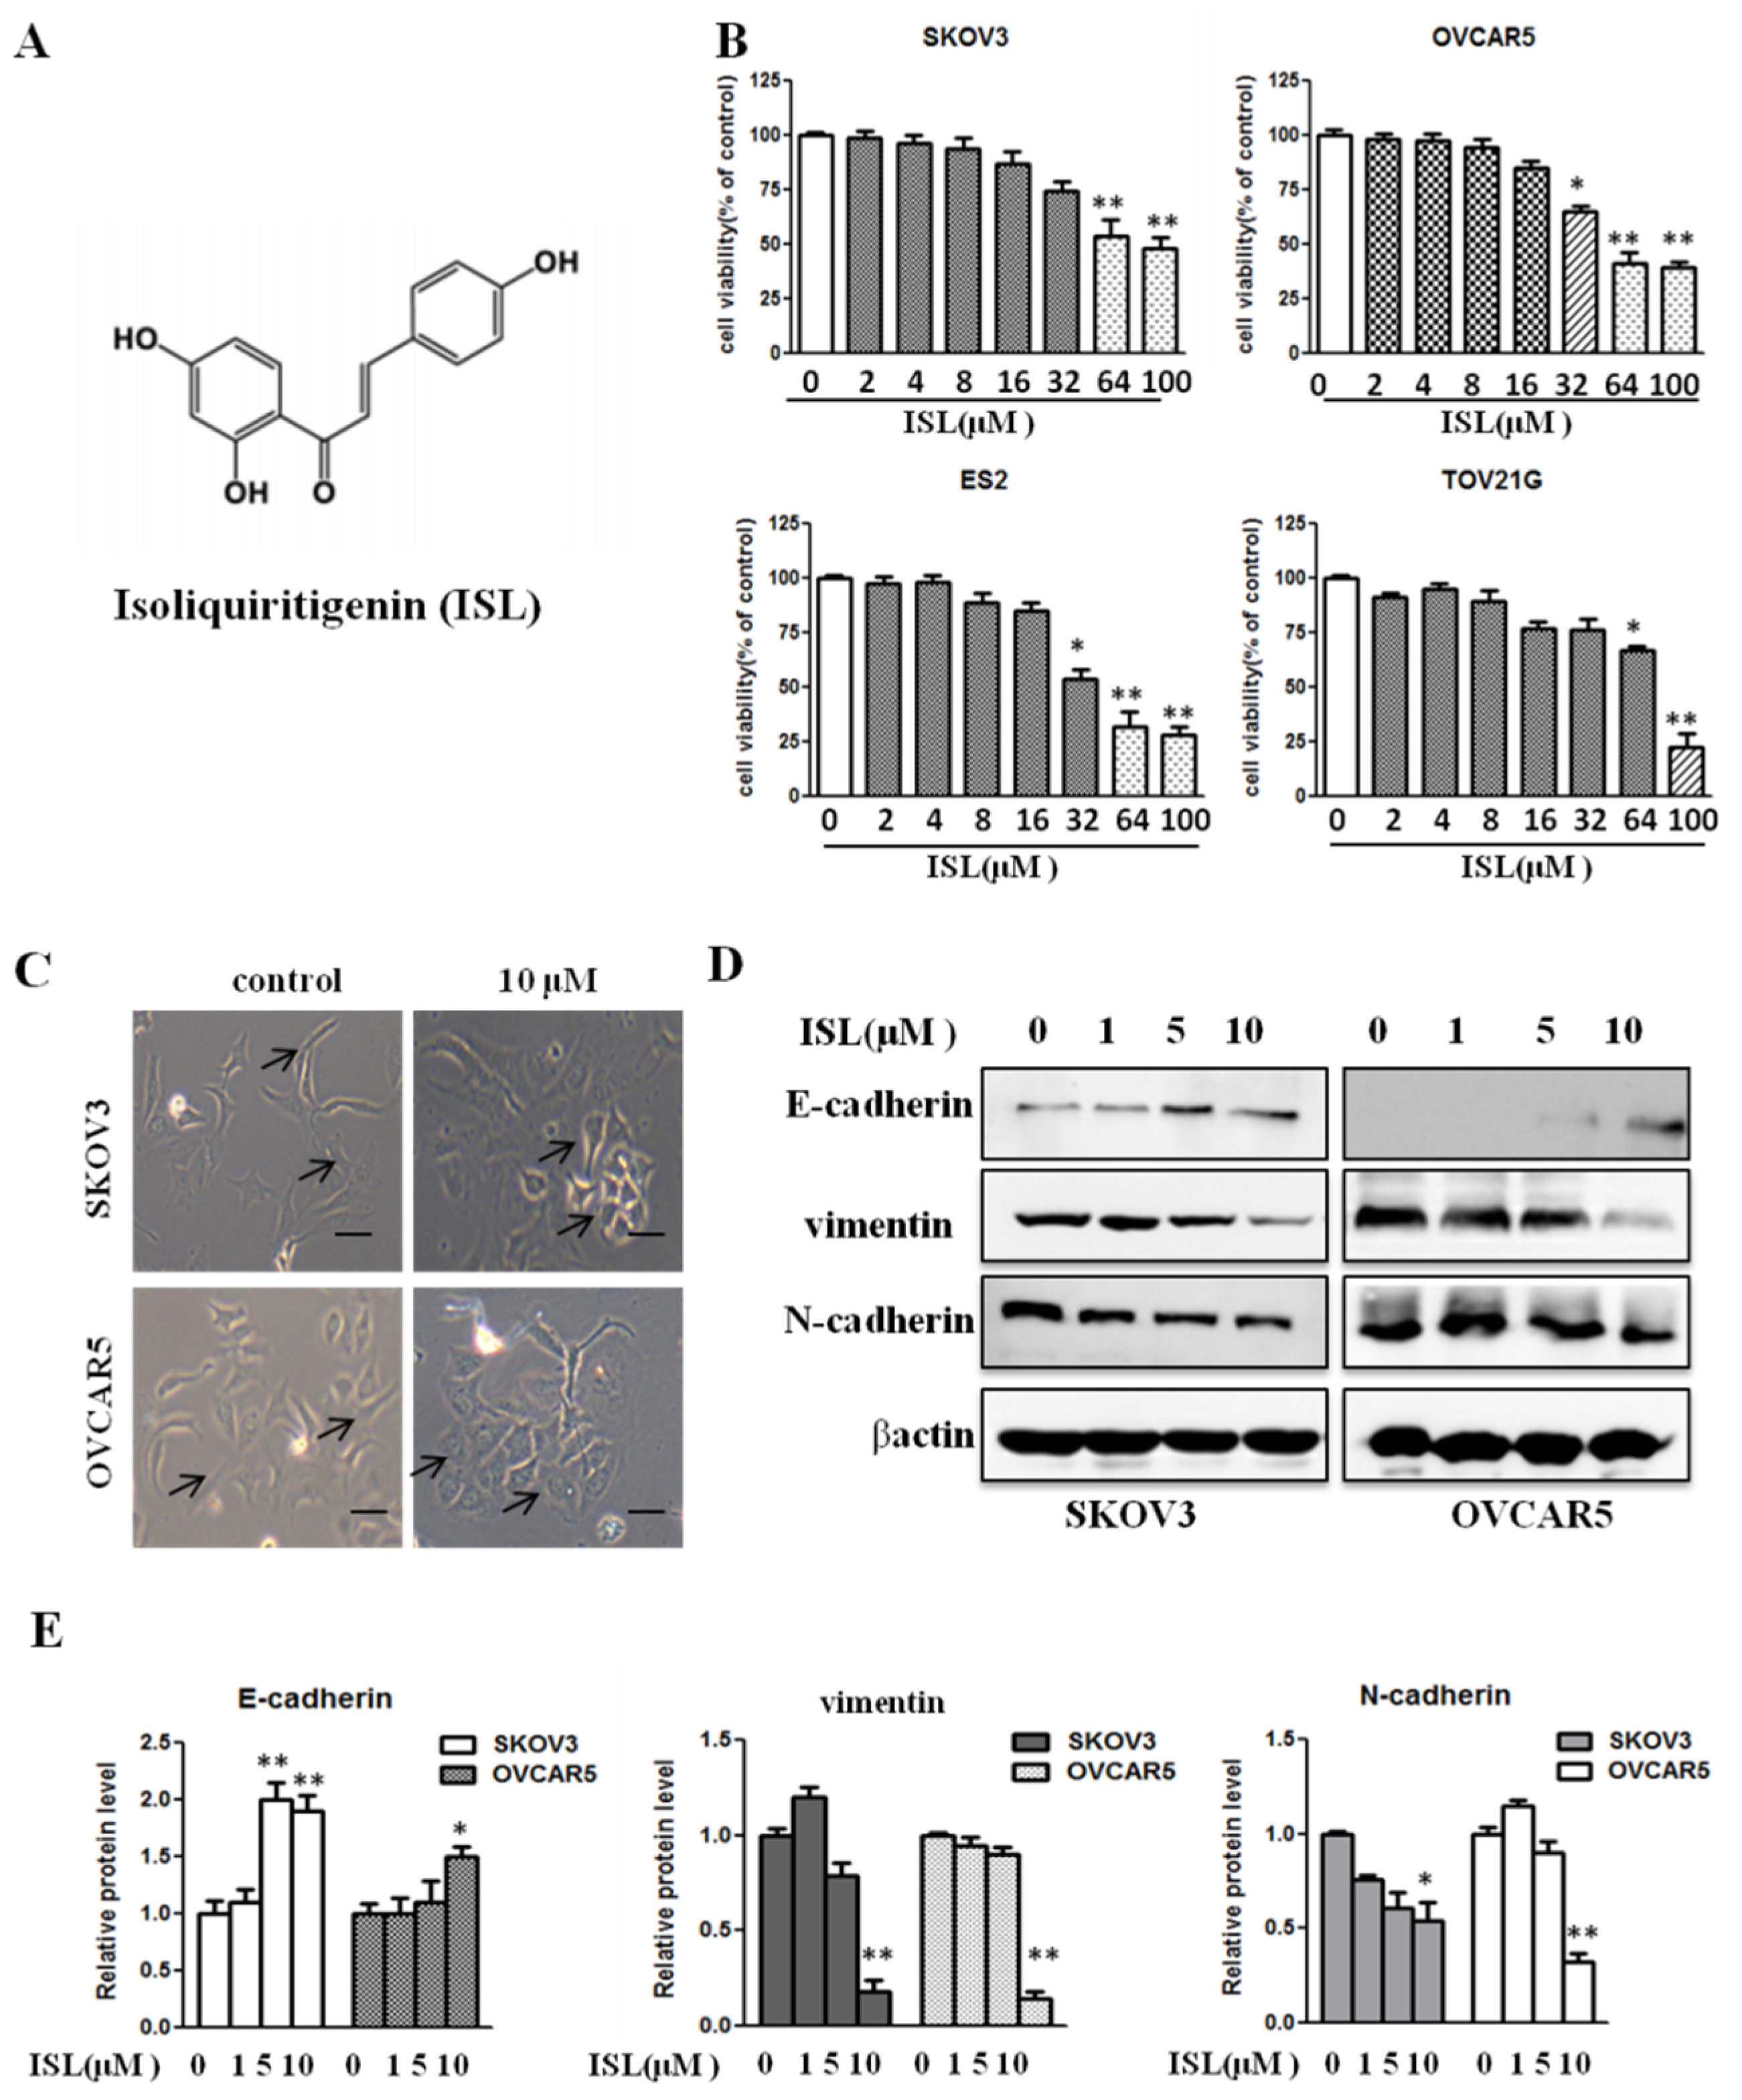
2.1. ISL at a Noncytotoxic Concentration Suppresses Ovarian Cancer Cell EMT Traits
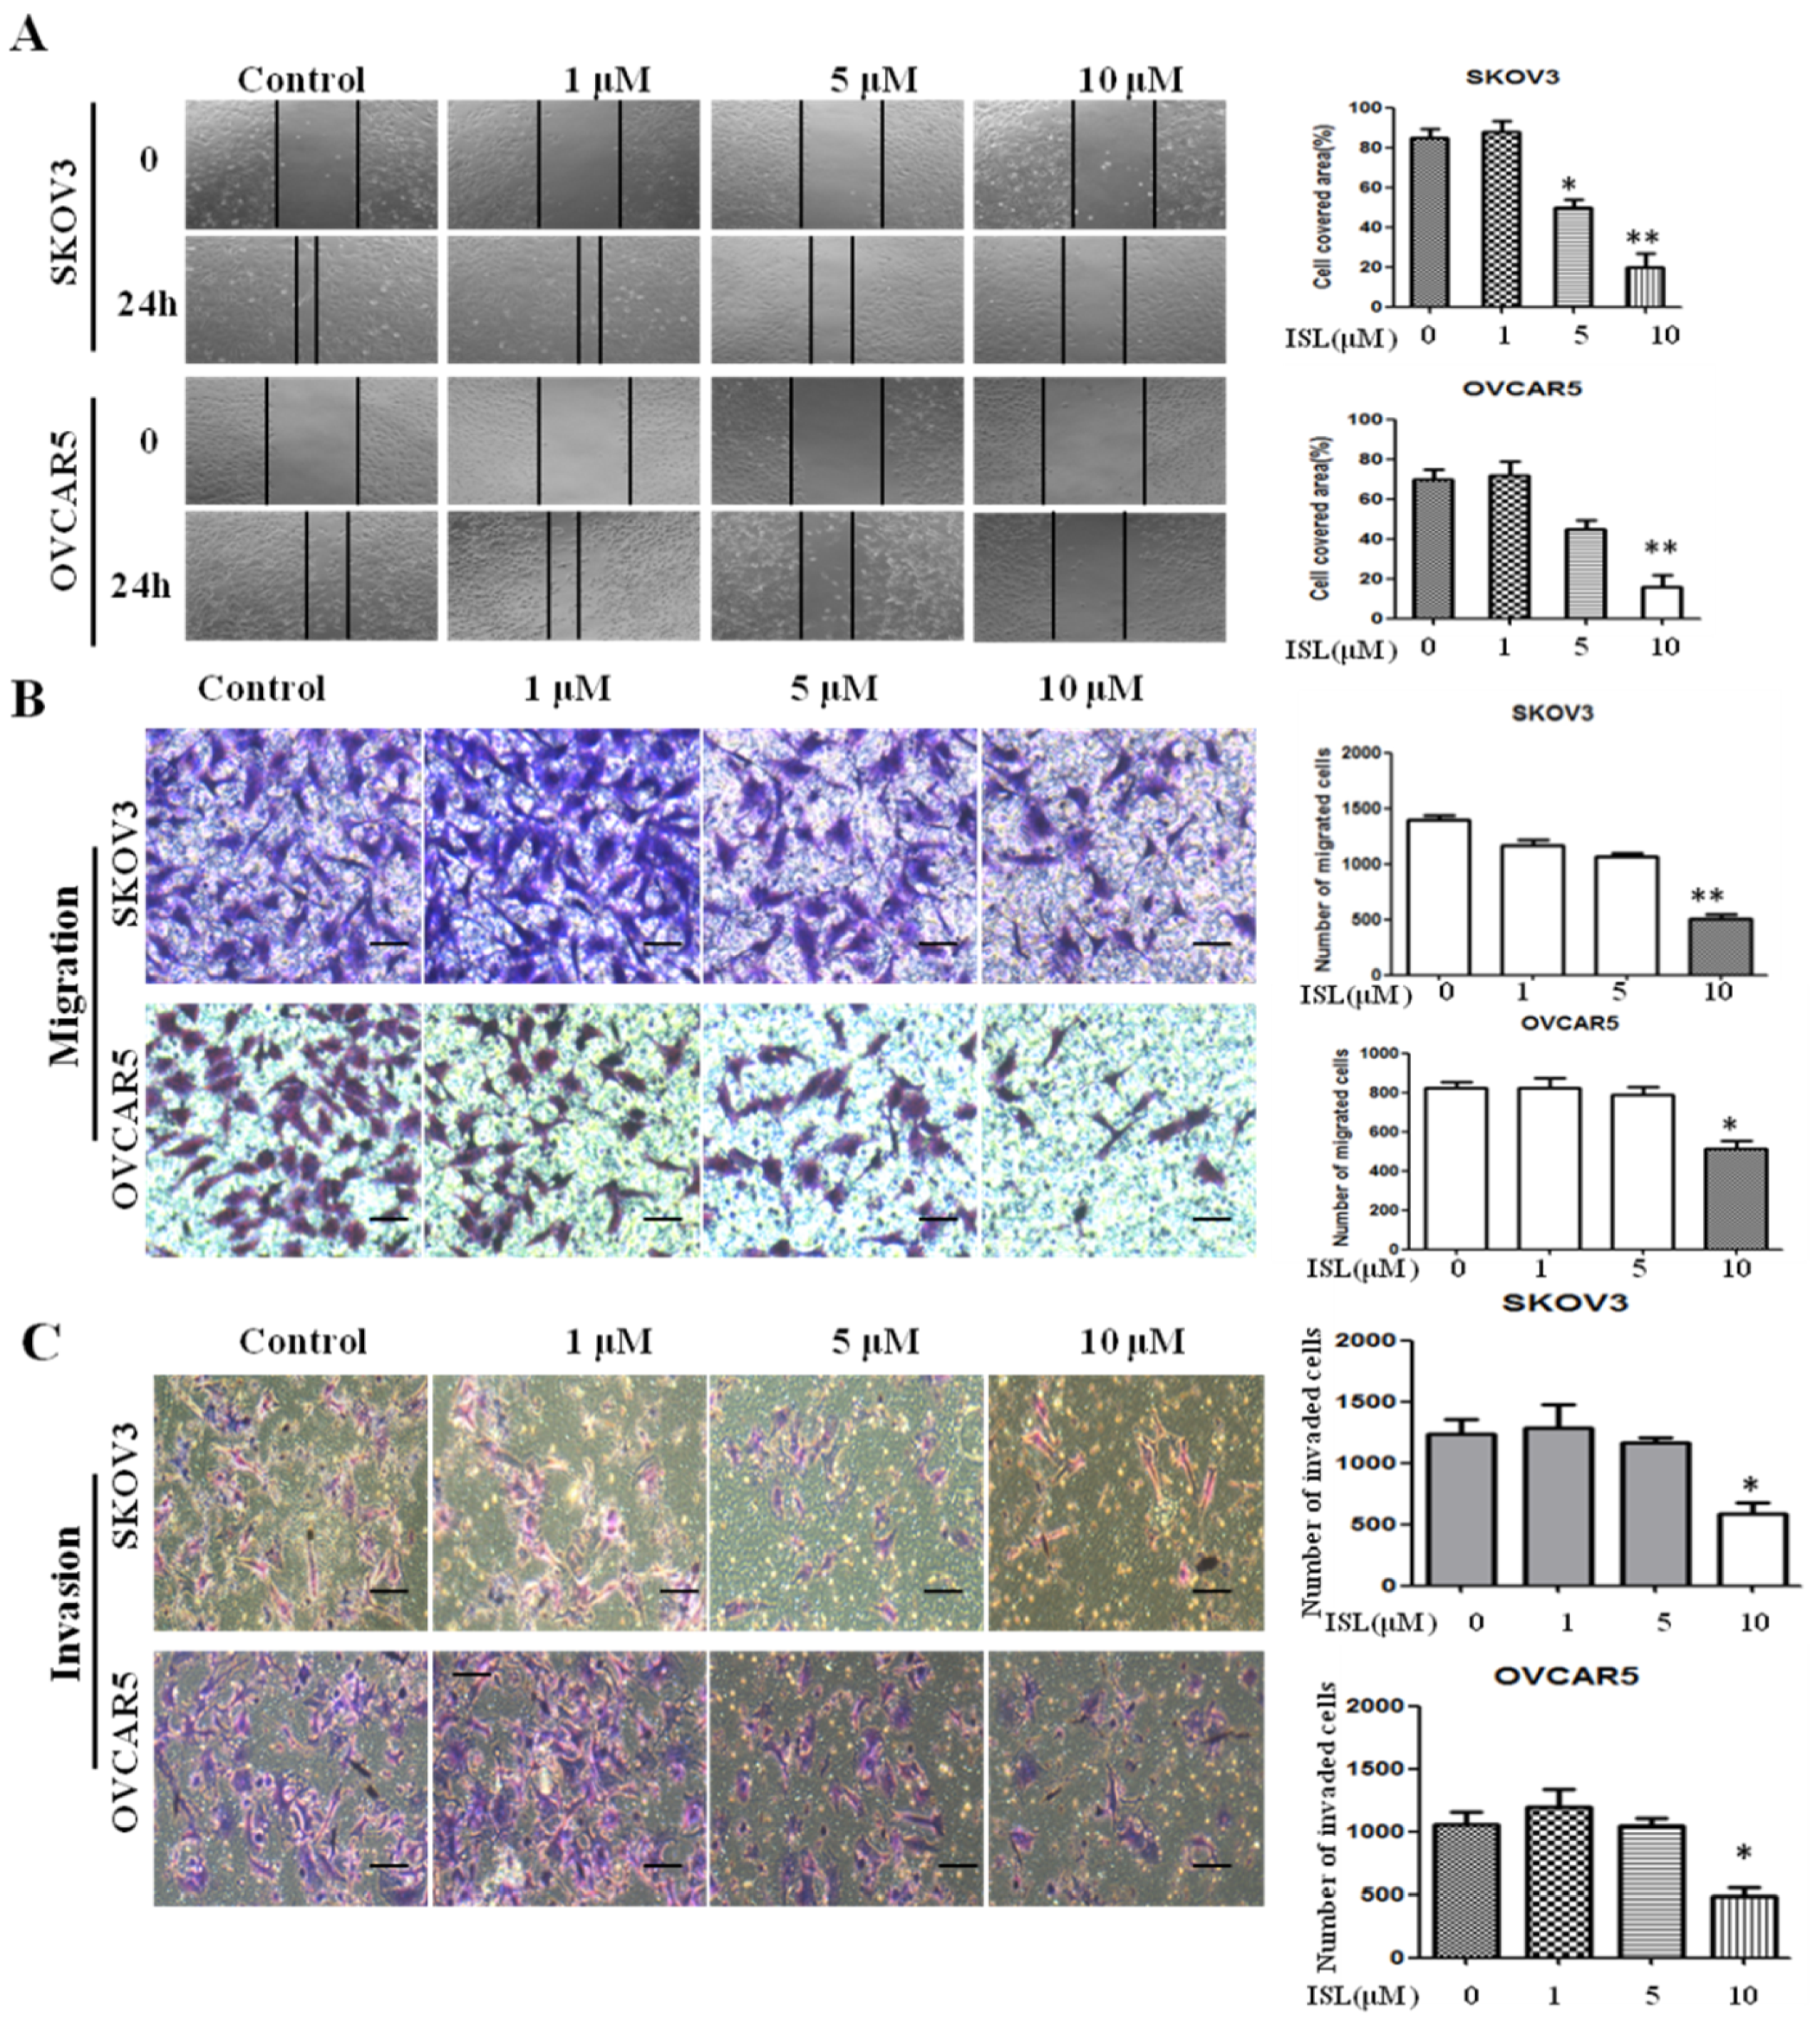
2.2. ISL Inhibited SKOV3 and OVCAR5 Migration and Invasion
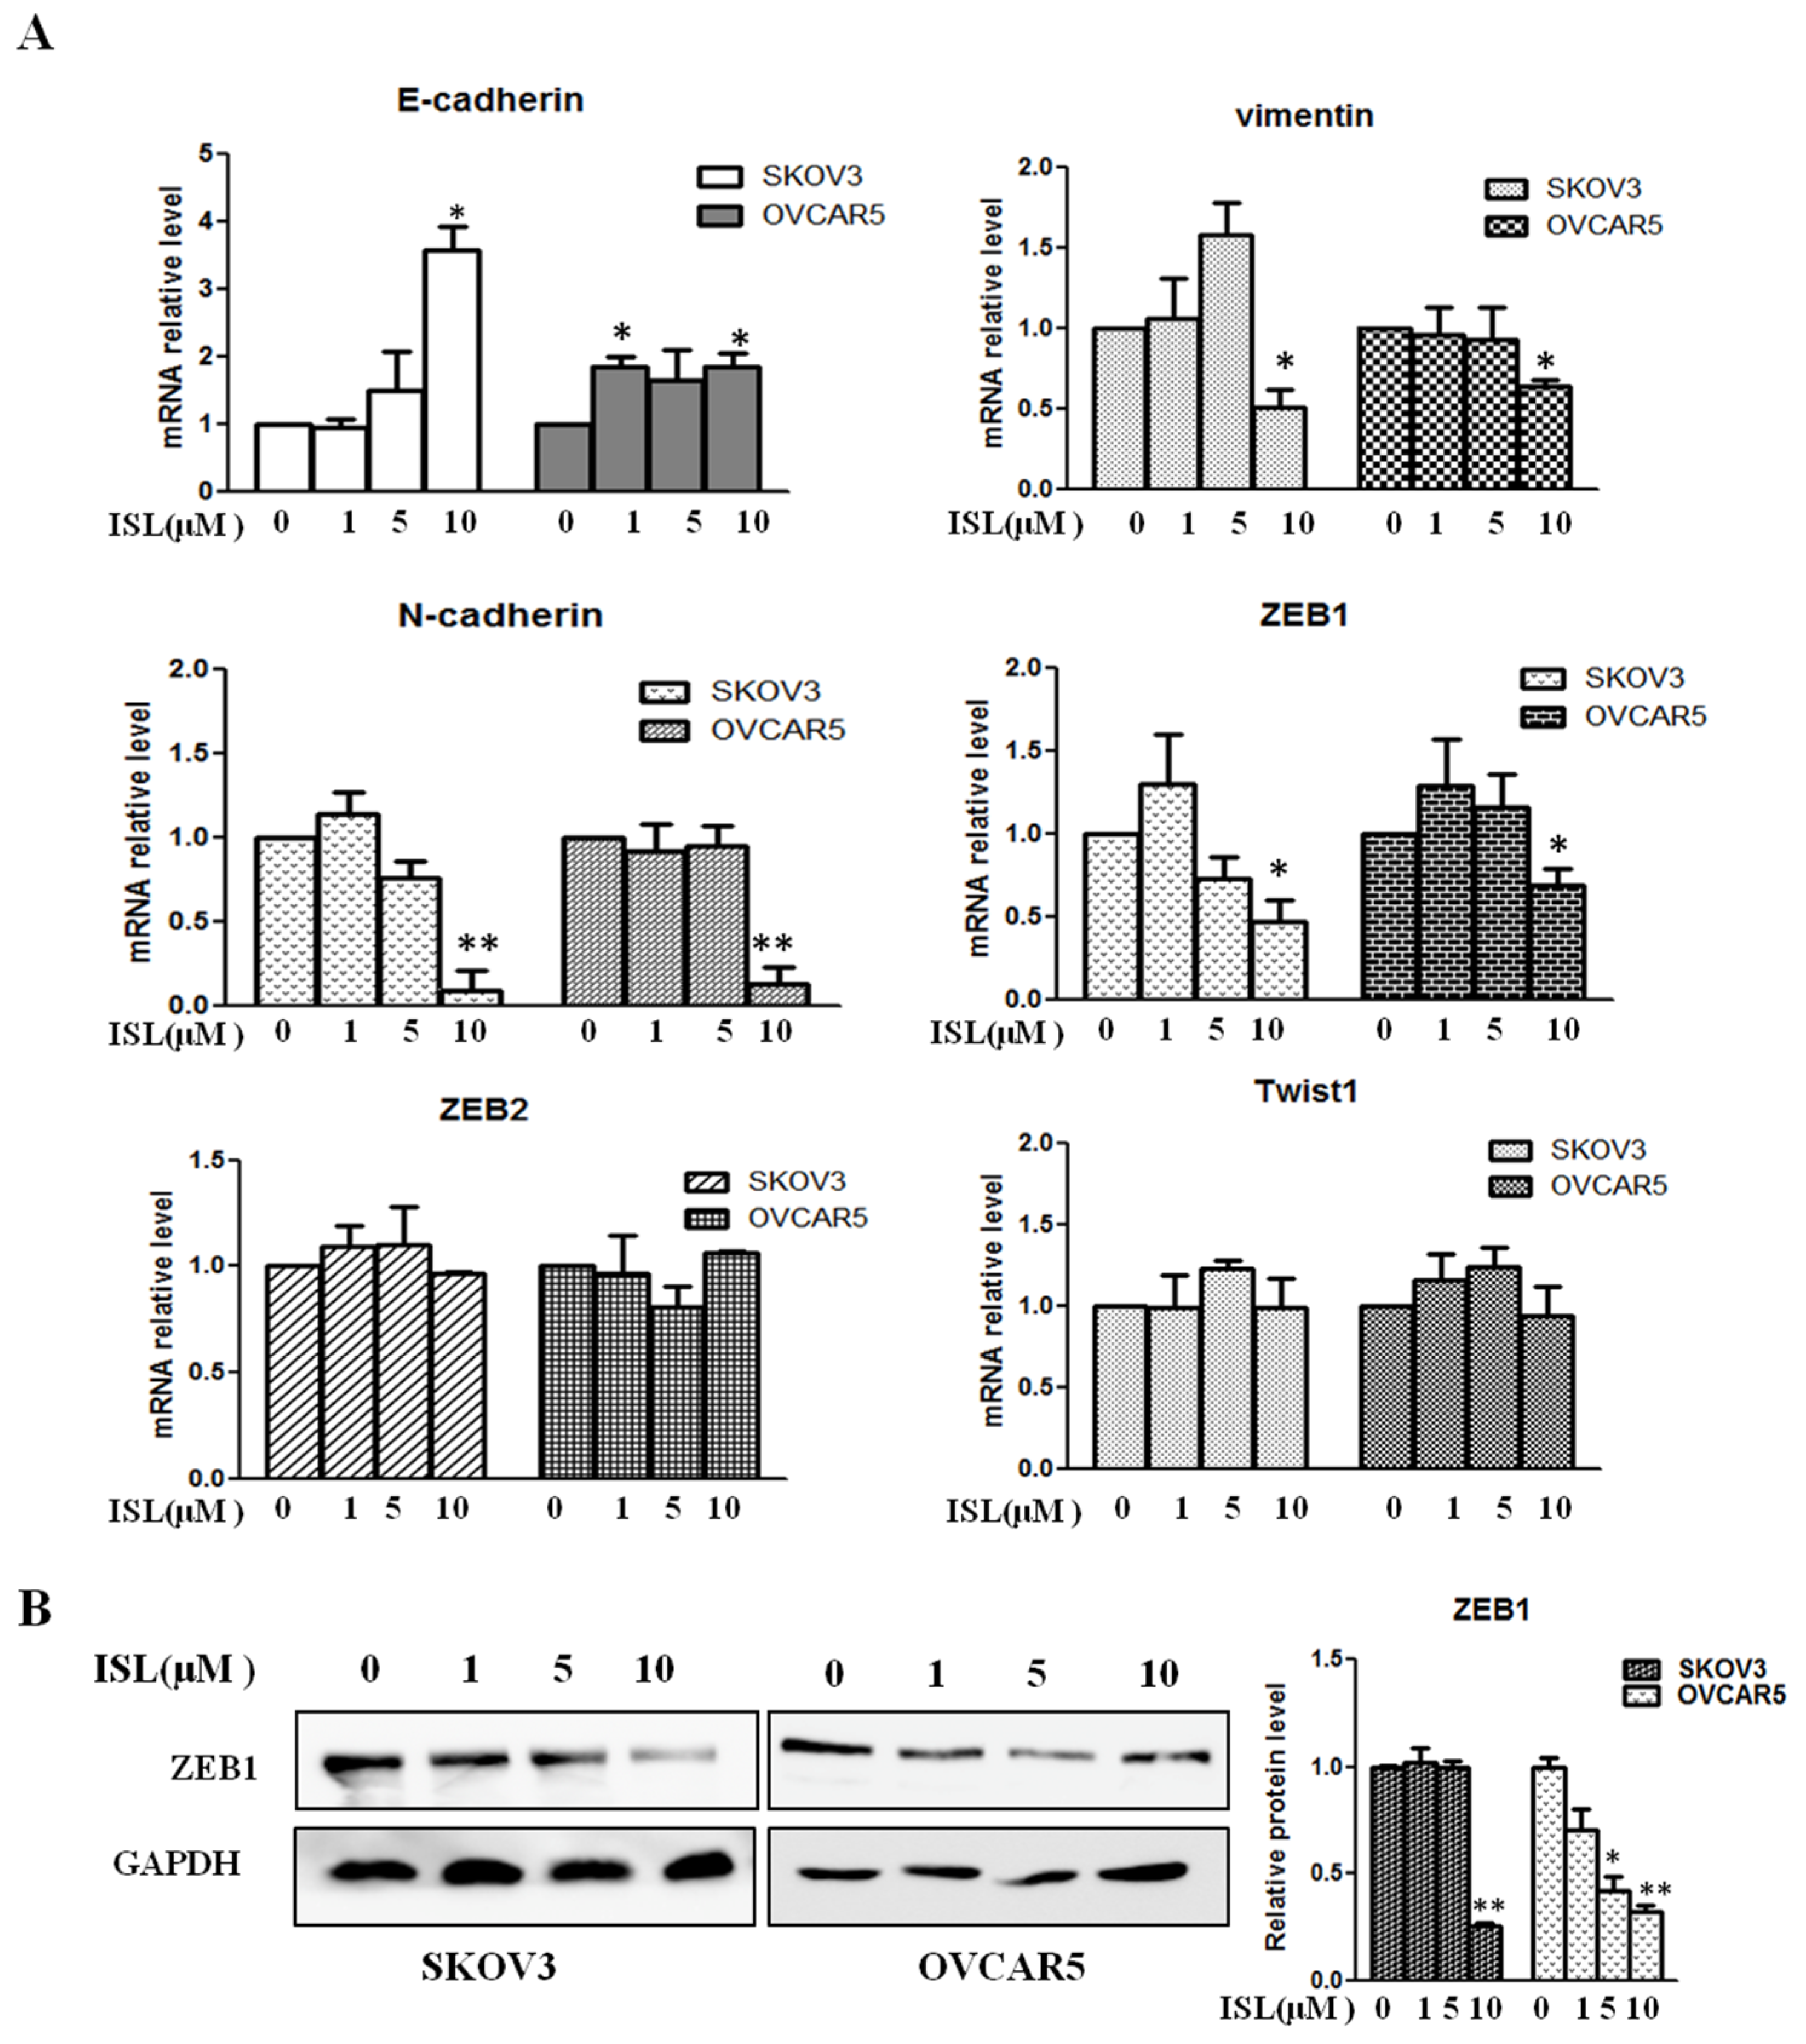
2.3. ISL Downregulated the Expression of EMT-Associated Transcription Factor ZEB1
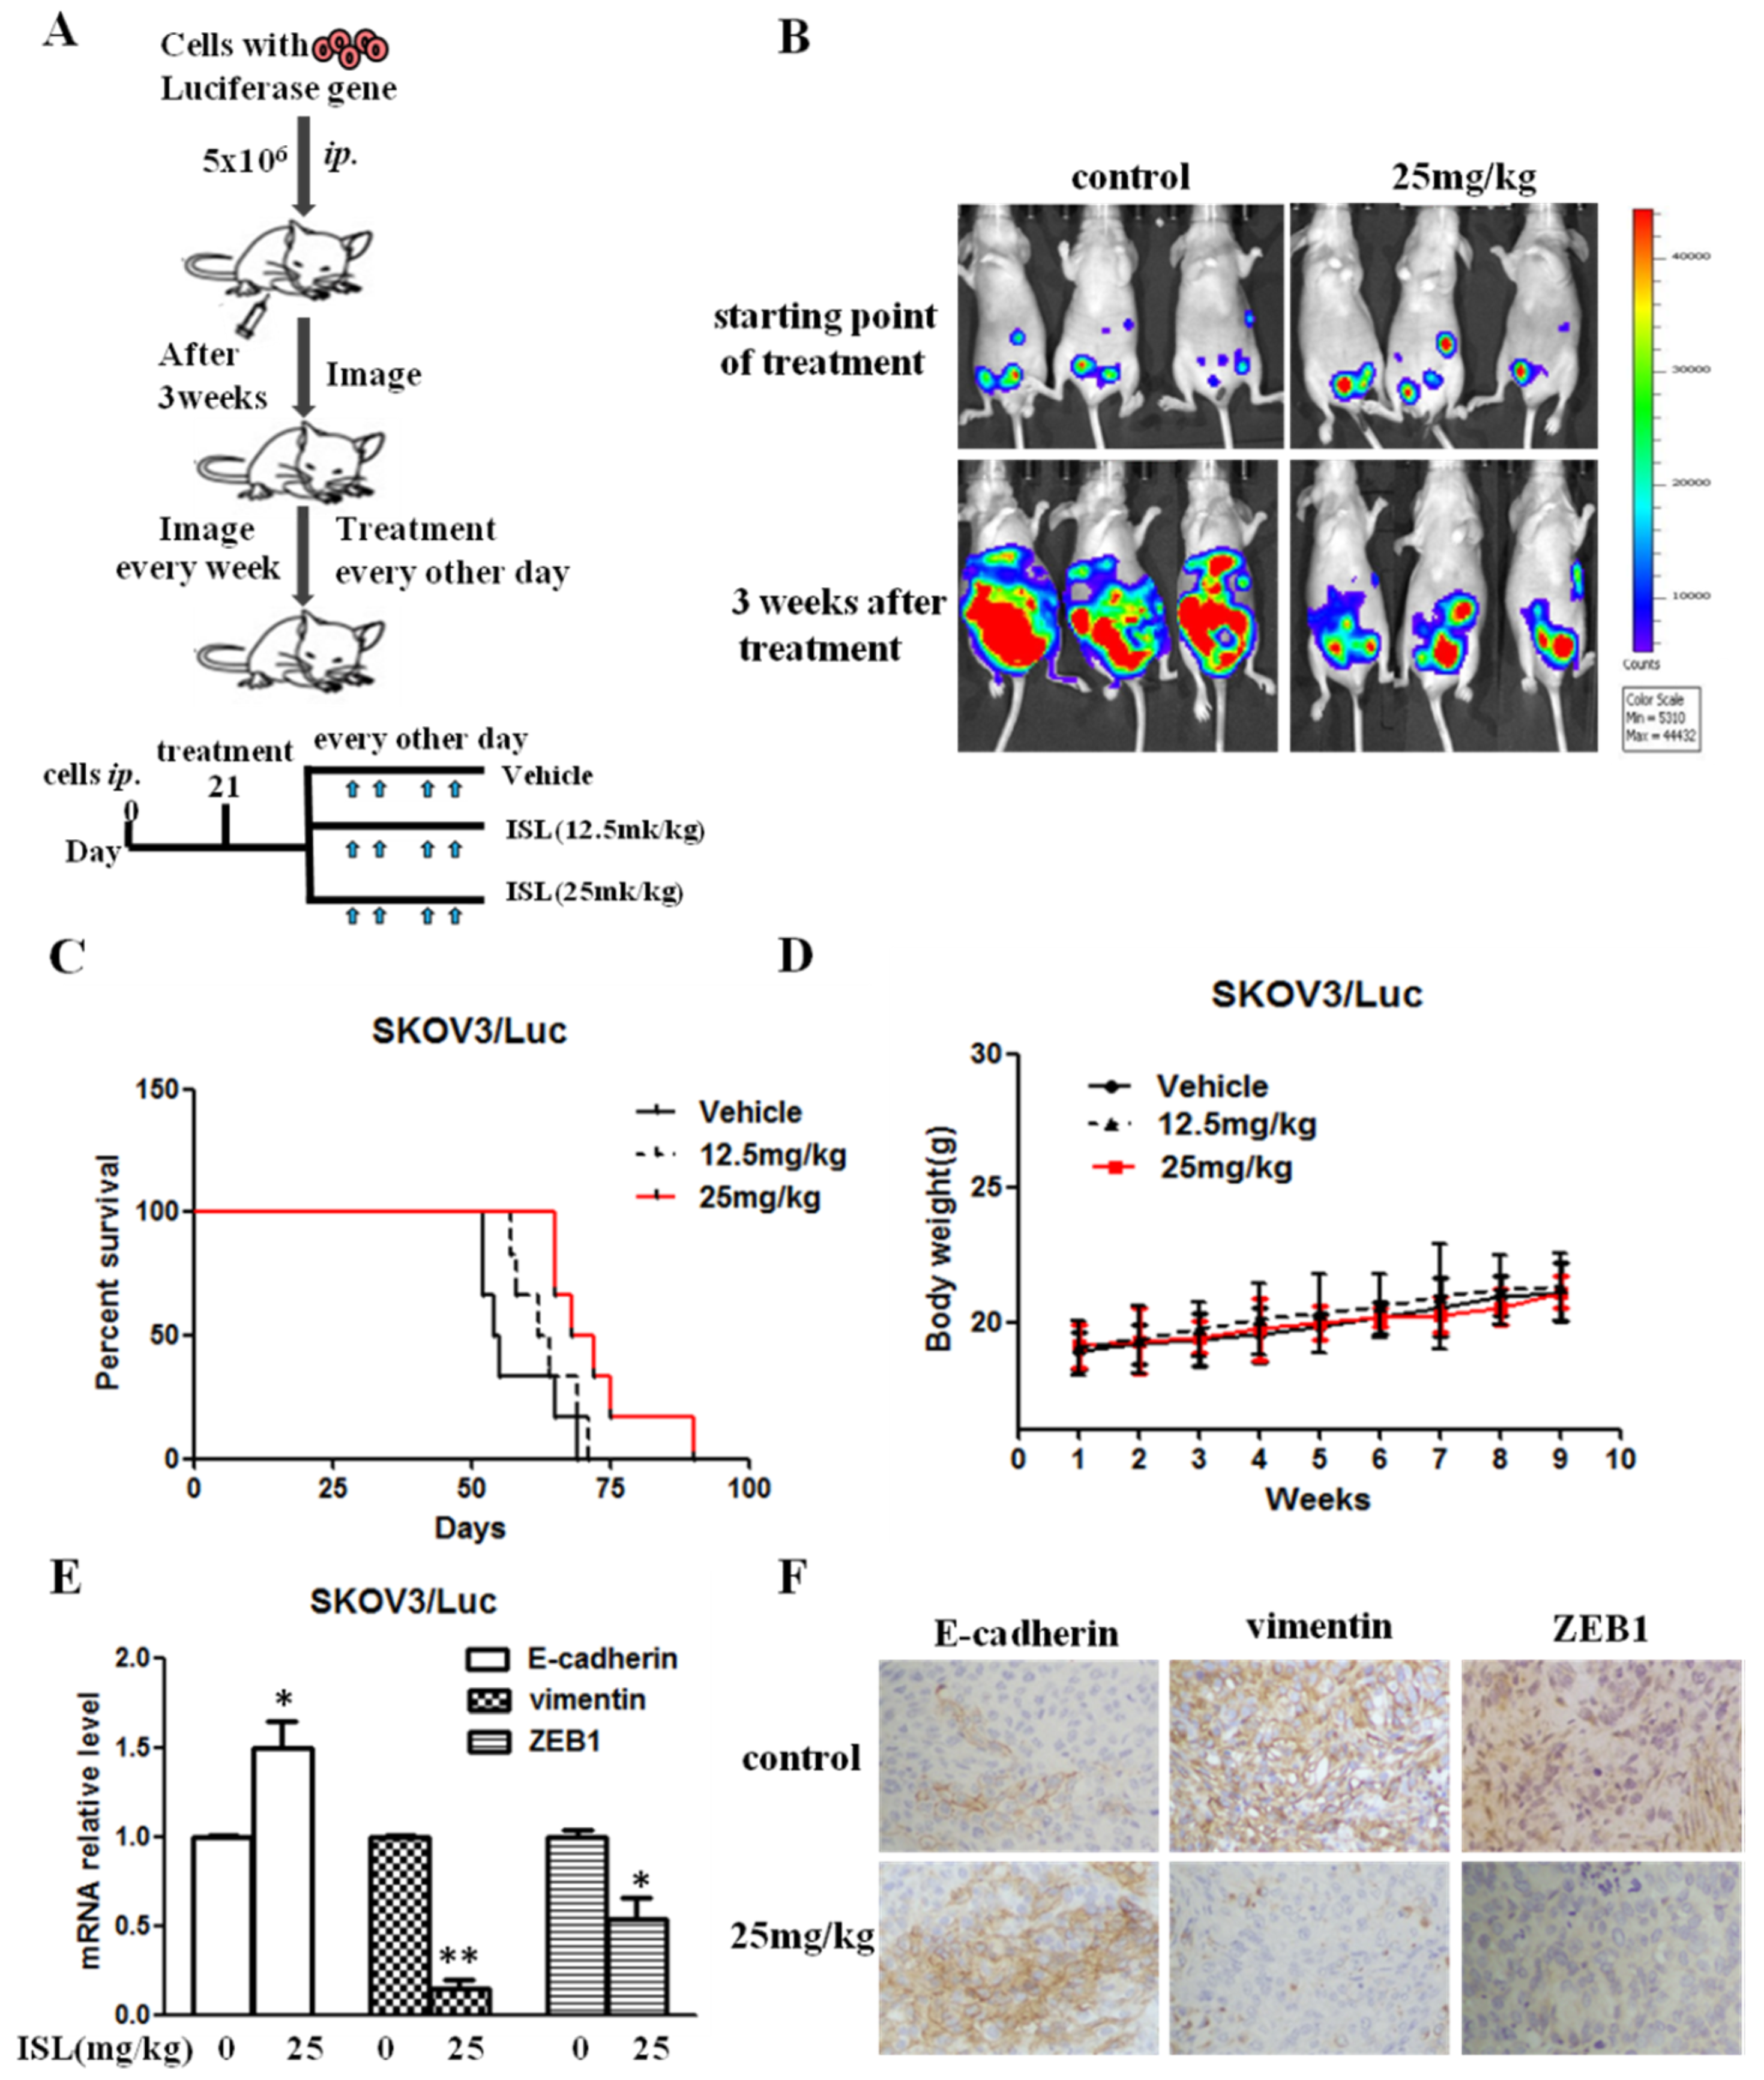
2.4. ISL Blocked Intraperitoneal Xenograft Development and Prolonged the Survival of Ovary-Tumor-Bearing Mice
3. Discussion
4. Materials and Methods
4.1. Cells and Other Reagents
4.2. Cell Viability Assay
4.3. Cell Morphology Observations
4.4. Wound-Healing Assay
4.5. Cell Migration and Invasion Assays
4.6. Real-Time PCR-Based Microarray Assay and qRT-PCR
4.7. Western Blot Analysis
4.8. Intraperitoneal Xenograft Development Assay
4.9. Immunohistochemistry
4.10. Statistical Analysis
4.11. Ethics Approval and Consent to Participate
5. Conclusions
Supplementary Materials
Author Contributions
Funding
Conflicts of Interest
Abbreviations
| EMT | Epithelial-to-mesenchymal transition |
| ISL | Isoliquiritigenin |
| Vim | vimentin |
| ZEB1 | Zinc finger E-box binding homeobox 1 |
| qRT-PCR | Real-time quantitative reverse transcription PCR |
| MTT | 3-(4,5-Dimethylthiazol-2-yl)-2,5-diphenyltetrazolium bromide |
| MET | Mesenchymal-to-epithelial transition |
| IHC | Immunohistochemistry |
| TGF-β | Transforming growth factor β |
| DMSO | Dimethyl sulfoxide |
References
- Jayson, G.C.; Kohn, E.C.; Kitchener, H.C.; Ledermann, J.A. Ovarian cancer. Lancet 2014, 384, 1376–1388. [Google Scholar] [CrossRef]
- Canmstra, S.A. Cancer of the ovary. N. Eng. J. Med. 2004, 351, 2519–2529. [Google Scholar] [CrossRef] [PubMed]
- Seward, S.M.; Winer, I. Primary debulking surgery and neoadjuvant chemotherapy in the treatment of advanced epithelial ovarian carcinoma. Cancer Metastasis Rev. 2015, 34, 5–10. [Google Scholar] [CrossRef] [PubMed]
- Nieto, M.A.; Huang, R.Y.; Jackson, R.A.; Thiery, J.P. Emt: 2016. Cell 2016, 166, 21–45. [Google Scholar] [CrossRef] [PubMed]
- Tsai, J.H.; Yang, J. Epithelial-mesenchymal plasticity in carcinoma metastasis. Genes Dev. 2013, 27, 2192–2206. [Google Scholar] [CrossRef]
- Thompson, E.W.; Newgreen, D.F.; Tarin, D. Carcinoma invasion and metastasis: A role for epithelial–mesenchymal transition? Cancer Res. 2005, 65, 5991–5995. [Google Scholar] [CrossRef]
- Thiery, J.P.; Sleeman, J.P. Complex networks orchestrate epithelial–mesenchymal transitions. Nat. Rev. Mol. Cell Biol. 2006, 7, 131–142. [Google Scholar] [CrossRef]
- Thiery, J.P. Epithelial-mesenchymal transitions in tumour progression. Nat. Rev. Cancer 2002, 2, 442–454. [Google Scholar] [CrossRef]
- Thiery, J.P.; Acloque, H.; Huang, R.Y.; Nieto, M.A. Epithelial-mesenchymal transitions in development and disease. Cell 2009, 139, 871–890. [Google Scholar] [CrossRef]
- Peng, F.; Du, Q.; Peng, C.; Wang, N.; Tang, H.; Xie, X.; Shen, J.; Chen, J. A Review: The Pharmacology of Isoliquiritigenin. Phytother. Res. 2015, 29, 969–977. [Google Scholar] [CrossRef]
- Honda, H.; Nagai, Y.; Matsunaga, T.; Saitoh, S.; Akashi-Takamura, S.; Hayashi, H.; Fujii, I.; Miyake, K.; Muraguchi, A.; Takatsu, K. Glycyrrhizin and isoliquiritigenin suppress the LPS sensor toll-like receptor 4/MD-2 complex signaling in a different manner. J. Leukoc. Biol. 2012, 91, 967–976. [Google Scholar] [CrossRef] [PubMed]
- Honda, H.; Nagai, Y.; Matsunaga, T.; Okamoto, N.; Watanabe, Y.; Tsuneyama, K.; Hayashi, H.; Fujii, I.; Ikutani, M.; Hirai, Y.; et al. Isoliquiritigenin is a potent inhibitor of NLRP3 inflammasome activation and diet-induced adipose tissue inflammation. J. Leukoc. Biol. 2014, 96, 1087–1100. [Google Scholar] [CrossRef] [PubMed]
- Zhao, Z.; Park, S.M.; Guan, L.; Wu, Y.; Lee, J.R.; Kim, S.C.; Kim, Y.W.; Zhao, R. Isoliquiritigenin attenuates oxidative hepatic damage induced by carbon tetrachloride with or without buthionine sulfoximine. Chem. Biol. Interact. 2015, 225, 13–20. [Google Scholar] [CrossRef] [PubMed]
- Traboulsi, H.; Cloutier, A.; Boyapelly, K.; Bonin, M.A.; Marsault, É.; Cantin, A.M.; Richter, M.V. The Flavonoid Isoliquiritigenin Reduces Lung Inflammation and Mouse Morbidity during Influenza Virus Infection. Antimicrob. Agents Chemother. 2015, 59, 6317–6327. [Google Scholar] [CrossRef] [PubMed]
- Tawata, M.; Aida, K.; Noguchi, T.; Ozaki, Y.; Kume, S.; Sasaki, H.; Chin, M.; Onaya, T. Anti-platelet action of isoliquiritigenin, an aldose reductase inhibitor in licorice. Eur. J. Pharmacol. 1992, 212, 87–92. [Google Scholar] [CrossRef]
- Gaur, R.; Kumar, S.; Trivedi, P.; Bhakuni, R.S.; Bawankule, D.U.; Pal, A.; Shanker, K. Liquiritigenin derivatives and their hepatoprotective activity. Nat. Prod. Commun. 2010, 5, 1243–1246. [Google Scholar] [PubMed]
- Park, S.J.; Youn, H.S. Isoliquiritigenin suppresses the toll-interleukin-1 receptor domain-containing adapter inducing interferon-beta (TRIF)-dependent signaling pathway of toll-like receptors by targeting TBK1. J. Agric. Food Chem. 2010, 58, 4701–4705. [Google Scholar] [CrossRef]
- Zhang, X.; Zhu, P.; Zhang, X.; Ma, Y.; Li, W.; Chen, J.M.; Guo, H.M.; Bucala, R.; Zhuang, J.; Li, J. Natural antioxidant-isoliquiritigenin ameliorates contractile dysfunction of hypoxic cardiomyocytes via AMPK signaling pathway. Mediat. Inflamm. 2013, 2013, 390890. [Google Scholar] [CrossRef]
- Ii, T.; Satomi, Y.; Katoh, D.; Shimada, J.; Baba, M.; Okuyama, T.; Nishino, H.; Kitamura, N. Induction of cell cycle arrest and p21(CIP1/WAF1) expression in human lung cancer cells by isoliquiritigenin. Cancer Lett. 2004, 207, 27–35. [Google Scholar] [CrossRef]
- Hsia, S.M.; Yu, C.C.; Shih, Y.H.; Chen, M.Y.; Wang, T.H.; Huang, Y.T.; Shieh, T.M. Isoliquiritigenin as a cause of DNA damage and inhibitor of ataxia-telangiectasia mutated expression leading to G2/M phase arrest and apoptosis in oral squamous cell carcinoma. Head Neck. 2016, 38 (Suppl. 1), E360–E371. [Google Scholar] [CrossRef]
- Lin, L.C.; Wu, C.H.; Shieh, T.M.; Chen, H.Y.; Huang, T.C.; Hsia, S.M. The licorice dietary component isoliquiritigenin chemosensitizes human uterine sarcoma cells to doxorubicin and inhibits cell growth by inducing apoptosis and autophagy via inhibition of m-TOR signaling. J. Funct. Foods 2017, 33, 332–344. [Google Scholar] [CrossRef]
- Li, Y.; Zhao, H.; Wang, Y.; Zheng, H.; Yu, W.; Chai, H.; Zhang, J.; Falck, J.R.; Guo, A.M.; Yue, J.; et al. Isoliquiritigenin induces growth inhibition and apoptosis through downregulating arachidonic acid metabolic network and the deactivation of PI3K/Akt in human breast cancer. Toxicol. Appl. Pharmacol. 2013, 272, 37–48. [Google Scholar] [CrossRef] [PubMed]
- Jung, S.K.; Lee, M.H.; Lim, D.Y.; Kim, J.E.; Singh, P.; Lee, S.Y.; Jeong, C.H.; Lim, T.G.; Chen, H.; Chi, Y.I.; et al. Isoliquiritigenin induces apoptosis and inhibits xenograft tumor growth of human lung cancer cells by targeting both wild type and L858R/T790M mutant EGFR. J. Biol. Chem. 2014, 289, 35839–35848. [Google Scholar] [CrossRef] [PubMed]
- Hsu, Y.L.; Kuo, P.L.; Chiang, L.C.; Lin, C.C. Isoliquiritigenin inhibits the proliferation and induces the apoptosis of human non - small cell lung cancer a549 cells. Clin. Exp. Pharmacol Physiol. 2004, 31, 414–418. [Google Scholar] [CrossRef]
- Wang, J.R.; Luo, Y.H.; Piao, X.J.; Zhang, Y.; Feng, Y.C.; Li, J.Q.; Xu, W.T.; Zhang, Y.; Zhang, T.; Wang, S.N.; et al. Mechanisms underlying isoliquiritigenin-induced apoptosis and cell cycle arrest via ROS-mediated MAPK/STAT3/NF-κB pathways in human hepatocellular carcinoma cells. Drug Dev. Res. 2019, 80, 461–470. [Google Scholar] [CrossRef]
- Zheng, H.; Li, Y.; Wang, Y.; Zhao, H.; Zhang, J.; Chai, H.; Tang, T.; Yue, J.; Guo, A.M.; Yang, J. Downregulation of COX-2 and CYP4A signaling by isoliquiritigenin inhibits human breast cancer metastasis through preventing anoikis resistance, migration and invasion. Toxicol. Appl. Pharmacol. 2014, 280, 10–20. [Google Scholar] [CrossRef]
- Wang, K.L.; Hsia, S.M.; Chan, C.J.; Chang, F.Y.; Huang, C.Y.; Bau, D.T.; Wang, P.S. Inhibitory effects of isoliquiritigenin on the migration and invasion of human breast cancer cells. Expert Opin. Ther. Targets 2013, 17, 337–349. [Google Scholar] [CrossRef]
- Tian, T.; Sun, J.; Wang, J.; Liu, Y.; Liu, H. Isoliquiritigenin inhibits cell proliferation and migration through the PI3K/AKT signaling pathway in A549 lung cancer cells. Oncol. Lett. 2018, 16, 6133–6139. [Google Scholar] [CrossRef]
- Chen, C.; Shenoy, A.K.; Padia, R.; Fang, D.; Jing, Q.; Yang, P.; Su, S.B.; Huang, S. Suppression of lung cancer progression by isoliquiritigenin through its metabolite 2, 4, 2’, 4’-Tetrahydroxychalcone. J. Exp. Clin. Cancer Res. 2018, 37, 243. [Google Scholar] [CrossRef]
- Li, N.; Yang, L.; Deng, X.; Sun, Y. Effects of isoliquiritigenin on ovarian cancer cells. Onco Targets Ther. 2018, 11, 1633–1642. [Google Scholar] [CrossRef]
- Chen, H.Y.; Huang, T.C.; Shieh, T.M.; Wu, C.H.; Lin, L.C.; Hsia, S.M. Isoliquiritigenin induces autophagy and inhibits ovarian Cancer cell growth. Int. J. Mol. Sci. 2017, 18, 2025. [Google Scholar] [CrossRef] [PubMed]
- Chen, H.; Wu, X.; Pan, Z.K.; Huang, S. Integrity of SOS1/EPS8/ABI1 tri-complex determines ovarian cancer metastasis. Cancer Res. 2010, 70, 9979–9990. [Google Scholar] [CrossRef] [PubMed]
- Fang, D.; Chen, H.; Zhu, J.Y.; Wang, W.; Teng, Y.; Ding, H.F.; Jing, Q.; Su, S.B.; Huang, S. Epithelial-mesenchymal transition of ovarian cancer cells is sustained by Rac1 through simultaneous activation of MEK1/2 and Src signaling pathways. Oncogene 2017, 36, 1546–1558. [Google Scholar] [CrossRef] [PubMed]
- Zhou, J.; Jain, S.; Azad, A.K.; Xu, X.; Yu, H.C.; Xu, Z.; Godbout, R.; Fu, Y. Notch and TGFβ form a positive regulatory loop and regulate EMT in epithelial ovarian cancer cells. Cell Signal. 2016, 8, 838–849. [Google Scholar] [CrossRef] [PubMed]
- Mitra, T.; Roy, S.S. Co-Activation of TGFβ and Wnt Signalling Pathways Abrogates EMT in Ovarian Cancer Cells. Cell Physiol. Biochem. 2017, 41, 1336–1345. [Google Scholar] [CrossRef] [PubMed]
- Fang, D.; Sun, L.; Lin, S.; Zhou, L.; Su, N.; Yuan, S.; Yu, B. Vinorelbine inhibits angiogenesis and 95D migration via reducing hypoxic fibroblast stromal cell-derived factor 1 secretion. Exp. Biol. Med. (Maywood) 2012, 237, 1045–1055. [Google Scholar] [CrossRef] [PubMed]
- Yan, J.; Zhou, X.; Guo, J.J.; Mao, L.; Wang, Y.J.; Sun, J.; Sun, L.X.; Zhang, L.Y.; Zhou, X.F.; Liao, H. Nogo-66 inhibits adhesion and migration of microglia via GTPase Rho pathway in vitro. J. Neurochem. 2012, 120, 721–731. [Google Scholar] [CrossRef]
- Lin, S.; Wan, S.; Sun, L.; Hu, J.; Fang, D.; Zhao, R.; Yuan, S.; Zhang, L. Chemokine C-C motif receptor 5 and C-C motif ligand 5 promote cancer cell migration under hypoxia. Cancer Sci. 2012, 103, 904–912. [Google Scholar] [CrossRef]
- Zhu, J.; Sun, L.; Lin, S.; Zhao, R.; Zhou, L.; Fang, D.; Chen, L.; Liu, J.; Shi, W.; Zhang, L.; et al. BlyS is up-regulated by hypoxia and promotes migration of human breast cancer cells. J. Exp. Clin. Cancer Res. 2012, 31, 31. [Google Scholar] [CrossRef]
- Wang, W.; Li, Y.; Zhu, J.Y.; Fang, D.; Ding, H.F.; Dong, Z.; Jing, Q.; Su, S.B.; Huang, S. Triple negative breast cancer development can be selectively suppressed by sustaining an elevated level of cellular cyclic AMP through simultaneously blocking its efflux and decomposition. Oncotarget 2016, 7, 87232–87245. [Google Scholar] [CrossRef]
- Yang, L.; Fang, D.; Chen, H.; Lu, Y.; Dong, Z.; Ding, H.F.; Jing, Q.; Su, S.B.; Huang, S. Cyclin-dependent kinase 2 is an ideal target for ovary tumors with elevated cyclin E1 expression. Oncotarget 2015, 6, 20801–20812. [Google Scholar] [CrossRef] [PubMed]
Sample Availability: Samples of the compounds are not available from the authors. |


| Gene | Control | ISL | Gene | Control | ISL | Gene | Control | ISL |
|---|---|---|---|---|---|---|---|---|
| AHNAK | 1 | 0.734623 | IL1RN | 1 | 0.418554 | SMAD2 | 1 | 0.572358 |
| AKT1 | 1 | 0.924291 | ILK | 1 | 0.785611 | SNAI1 | 1 | 1.566291 |
| BMP1 | 1 | 0.404673 | ITGA5 | 1 | 0.535606 | SNAI2 | 1 | 1.131232 |
| BMP2 | 1 | 0.743396 | ITGAV | 1 | 0.513642 | SNAI3 | 1 | 2.443003 |
| BMP7 | 1 | 0.31247 | ITGB1 | 1 | 0.594326 | SOX10 | 1 | 0.510887 |
| CALD1 | 1 | 0.419532 | JAG1 | 1 | 0.435286 | SPARC | 1 | 1.120049 |
| CAMK2N1 | 1 | 0.767472 | KRT14 | 1 | 1.161878 | SPP1 | 1 | 4.084098 |
| CAV2 | 1 | 0.53588 | KRT19 | 1 | 0.717957 | STAT3 | 1 | 0.572006 |
| CDH1 | 1 | 1.068836 | KRT7 | 1 | 0.497813 | STEAP1 | 1 | 0.182371 |
| CDH2 | 1 | 0.296297 | MAP1B | 1 | 0.413056 | TCF3 | 1 | 1.037395 |
| COL1A2 | 1 | 0.373447 | MMP2 | 1 | 1.518571 | TCF4 | 1 | 0.875013 |
| COL3A1 | 1 | 0.374667 | MMP3 | 1 | 0.474877 | TFPI2 | 1 | 0.403746 |
| COL5A2 | 1 | 0.668282 | MMP9 | 1 | 0.924883 | TGFB1 | 1 | 0.583945 |
| CTNNB1 | 1 | 0.573468 | MSN | 1 | 1.18802 | TGFB2 | 1 | 0.394966 |
| DSC2 | 1 | 0.948605 | MST1R | 1 | 0.764398 | TGFB3 | 1 | 1.295126 |
| DSP | 1 | 0.463705 | NODAL | 1 | 1.54975 | TIMP1 | 1 | 1.09639 |
| EGFR | 1 | 0.396217 | NOTCH1 | 1 | 0.595044 | TMEFF1 | 1 | 0.619747 |
| ERBB3 | 1 | 0.34008 | NUDT13 | 1 | 0.524084 | MEM132A | 1 | 0.890626 |
| ESR1 | 1 | 0.696109 | OCLN | 1 | 0.350573 | TSPAN13 | 1 | 1.582411 |
| F11R | 1 | 0.662682 | PDGFRB | 1 | / | TWIST1 | 1 | 0.811606 |
| FN1 | 1 | 0.797309 | PLEK2 | 1 | 1.065871 | VCAN | 1 | 0.987891 |
| FOXC2 | 1 | 0.659119 | PPPDE2 | 1 | 0.419386 | VIM | 1 | 1.056343 |
| FZD7 | 1 | 0.748245 | PTK2 | 1 | 0.654937 | VPS13A | 1 | 0.762398 |
| GNG11 | 1 | 0.770319 | PTP4A1 | 1 | 0.389229 | WNT11 | 1 | 2.137225 |
| GSC | 1 | 1.215896 | RAC1 | 1 | 0.782444 | WNT5A | 1 | 1.517202 |
| GSK3B | 1 | 0.321123 | RGS2 | 1 | 1.443939 | WNT5B | 1 | 2.762547 |
| IGFBP4 | 1 | 0.614624 | SERPINE1 | 1 | 0.598634 | ZEB1 | 1 | 0.602478 |
| SIP1 | 1 | 0.928877 | ZEB2 | 1 | 0.506116 |
© 2019 by the authors. Licensee MDPI, Basel, Switzerland. This article is an open access article distributed under the terms and conditions of the Creative Commons Attribution (CC BY) license (http://creativecommons.org/licenses/by/4.0/).
Share and Cite
Chen, C.; Huang, S.; Chen, C.-L.; Su, S.-B.; Fang, D.-D. Isoliquiritigenin Inhibits Ovarian Cancer Metastasis by Reversing Epithelial-to-Mesenchymal Transition. Molecules 2019, 24, 3725. https://doi.org/10.3390/molecules24203725
Chen C, Huang S, Chen C-L, Su S-B, Fang D-D. Isoliquiritigenin Inhibits Ovarian Cancer Metastasis by Reversing Epithelial-to-Mesenchymal Transition. Molecules. 2019; 24(20):3725. https://doi.org/10.3390/molecules24203725
Chicago/Turabian StyleChen, Chen, Shuang Huang, Chang-Liang Chen, Shi-Bing Su, and Dong-Dong Fang. 2019. "Isoliquiritigenin Inhibits Ovarian Cancer Metastasis by Reversing Epithelial-to-Mesenchymal Transition" Molecules 24, no. 20: 3725. https://doi.org/10.3390/molecules24203725
APA StyleChen, C., Huang, S., Chen, C.-L., Su, S.-B., & Fang, D.-D. (2019). Isoliquiritigenin Inhibits Ovarian Cancer Metastasis by Reversing Epithelial-to-Mesenchymal Transition. Molecules, 24(20), 3725. https://doi.org/10.3390/molecules24203725