Determination of Antidepressants and Antipsychotics in Dried Blood Spots (DBSs) Collected from Post-Mortem Samples and Evaluation of the Stability over a Three-Month Period

 ,
, 
Abstract

1. Introduction
2. Results
3. Discussion
3.1. Pre-Analytical Issues
3.2. Analytical Issues
3.3. Stability Study
4. Materials and Methods
4.1. Reagents and Chemicals
4.2. Instrumentation and Chromatographic Conditions
4.3. Sample Collection and Storage
4.4. Sample Preparation
4.5. Stability Studies
4.6. Validation Procedure
5. Conclusions
Author Contributions
Funding
Conflicts of Interest
References
- Davies, J.; Read, J. A systematic review into the incidence, severity and duration of antidepressant withdrawal effects: Are guidelines evidence-based? Addict. Behav. 2018, 97, 111–121. [Google Scholar] [CrossRef] [PubMed]
- Maruf, A.A.; Greenslade, A.; Arnold, P.D.; Bousman, C. Antidepressant pharmacogenetics in children and young adults: A systematic review. J. Affect. Disord. 2019, 254, 98–108. [Google Scholar] [CrossRef] [PubMed]
- Cipriani, A.; Furukawa, T.A.; Salanti, G.; Chaimani, A.; Atkinson, L.Z.; Ogawa, Y.; Leucht, S.; Ruhe, H.G.; Turner, E.H.; Higgins, J.P.T.; et al. Comparative efficacy and acceptability of 21 antidepressant drugs for the acute treatment of adults with major depressive disorder: A systematic review and network meta-analysis. Lancet 2018, 391, 1357–1366. [Google Scholar] [CrossRef]
- Artigas, F.; Nutt, D.J.; Shelton, R. Mechanism of action of antidepressants. Psychopharmacol. Bull. 2002, 36, 123–132. [Google Scholar]
- Buckley, N.A.; Whyte, I.M.; Dawson, A.H.; Isbister, G.K. A prospective cohort study of trends in self-poisoning, Newcastle, Australia, 1987-2012: Plus ca change, plus c’est la meme chose. Med. J. Aust. 2015, 202, 438–442. [Google Scholar] [CrossRef] [PubMed]
- Borg, L.; Julkunen, A.; Rorbaek Madsen, K.; Strom, T.; Toft, P. Antidepressant or Antipsychotic Overdose in the Intensive Care Unit—Identification of Patients at Risk. Basic Clin. Pharmacol. Toxicol. 2016, 119, 110–114. [Google Scholar] [CrossRef]
- Wang, S.M.; Han, C.; Bahk, W.M.; Lee, S.J.; Patkar, A.A.; Masand, P.S.; Pae, C.U. Addressing the Side Effects of Contemporary Antidepressant Drugs: A Comprehensive Review. Chonnam. Med. J. 2018, 54, 101–112. [Google Scholar] [CrossRef]
- Santarsieri, D.; Schwartz, T.L. Antidepressant efficacy and side-effect burden: A quick guide for clinicians. Drugs Context 2015, 4. [Google Scholar] [CrossRef]
- Berling, I.; Buckley, N.A.; Isbister, G.K. The antipsychotic story: Changes in prescriptions and overdose without better safety. Br. J. Clin. Pharmacol. 2016, 82, 249–254. [Google Scholar] [CrossRef]
- Chokhawala, K.; Stevens, L. Antipsychotic Medications; StatPearls, 2019. Available online: https://www.ncbi.nlm.nih.gov/books/NBK519503/ (accessed on 22 April 2019).
- Mauri, M.; Paletta, S.; Maffini, M.; Colasanti, A.; Dragogna, F.; Di Pace, C.; Altamura, A. Clinical pharmacology of atypical antipsychotics: An update. EXCLI J. 2014, 13, 1163–1191. [Google Scholar]
- Dhillon, N.K.; Peng, F.; Bokhari, S.; Callen, S.; Shin, S.H.; Zhu, X.; Kim, K.J.; Buch, S.J. Cocaine mediated alteration in thitght juncion protein expression and modulation of CCL2/CCR2 axis across the blood brain barrier: Implications for HIV dementia. J. Neuroimmune. Pharm. 2007, 3, 52–56. [Google Scholar] [CrossRef] [PubMed]
- Tsiouris, J.A. Pharmacotherapy for aggressive behaviours in persons with intellectual disabilities: Treatment or mistreatment? J. Intellect. Disabil. Res. 2010, 54, 1–16. [Google Scholar] [CrossRef] [PubMed]
- Isacsson, G.; Ahlner, J. Antidepressants and the risk of suicide in young persons—Prescription trends and toxicological analyses. Acta Psychiatr. Scand. 2014, 129, 296–302. [Google Scholar] [CrossRef] [PubMed]
- Ramachandraiah, C.T.; Subramaniam, N.; Tancer, M. The story of antipsychotics: Past and present. Indian J. Psychiatry 2009, 51, 324–326. [Google Scholar] [CrossRef] [PubMed]
- Harrison, J.N.; Cluxton-Keller, F.; Gross, D. Antipsychotic Medication Prescribing Trends in Children and Adolescents. J. Pediatr. Health Care 2012, 26, 139–145. [Google Scholar] [CrossRef]
- Oiestad, A.M.L.; Karinen, R.; Rogde, S.; Nilsen, S.; Boye Eldor, K.B.; Brochmann, G.W.; Arnestad, M.; Oiestad, E.L.; Peres, M.D.; Kristoffersen, L.; et al. Comparative Study of Postmortem Concentrations of Antidepressants in Several Different Matrices. J. Anal. Toxicol. 2018, 42, 446–458. [Google Scholar] [CrossRef]
- Drasch, G.; Dahlmann, F.; von Meyer, L.; Roider, G.; Eisenmenger, W. Frequency of different anti-depressants associated with suicides and drug deaths. Int. J. Legal. Med. 2008, 122, 115–121. [Google Scholar] [CrossRef]
- Goodman, L.S.; Brunton, L.L.; Chabner, B.; Knollmann, B.C. Goodman & Gilman’s Pharmacological Basis of Therapeutics; McGraw-Hill: New York, NY, USA, 2011. [Google Scholar]
- Levine, B.; American Association for Clinical Chemistry. Principles of Forensic Toxicology, 4th ed.; AACC Press: Washington, DC, USA, 2013. [Google Scholar]
- Soderberg, C.; Wernvik, E.; Tillmar, A.; Spigset, O.; Kronstrand, R.; Reis, M.; Jonsson, A.K.; Druid, H. Antipsychotics—Postmortem fatal and non-fatal reference concentrations. Forensic Sci. Int. 2016, 266, 91–101. [Google Scholar] [CrossRef]
- La Marca, G.; Malvagia, S.; Filippi, L.; Luceri, F.; Moneti, G.; Guerrini, R. A new rapid micromethod for the assay of phenobarbital from dried blood spots by LC-tandem mass spectrometry. Epilepsia 2009, 50, 2658–2662. [Google Scholar] [CrossRef]
- Edelbroek, P.M.; van der Heijden, J.; Stolk, L.M. Dried blood spot methods in therapeutic drug monitoring: Methods, assays, and pitfalls. Ther. Drug Monit. 2009, 31, 327–336. [Google Scholar] [CrossRef]
- McDade, T.W.; Williams, S.; Snodgrass, J.J. What a drop can do: Dried blood spots as a minimally invasive method for integrating biomarkers into population-based research. Demography 2007, 44, 899–925. [Google Scholar] [CrossRef] [PubMed]
- Li, W.; Tse, F.L. Dried blood spot sampling in combination with LC-MS/MS for quantitative analysis of small molecules. Biomed. Chromatogr. 2010, 24, 49–65. [Google Scholar] [CrossRef] [PubMed]
- Guthrie, R.; Susi, A. A simple phenylalanine method for detecting phenylketonuria in large populations of newborn infants. Pediatrics 1963, 32, 338–343. [Google Scholar] [PubMed]
- Resano, M.; Belarra, M.A.; García-Ruiz, E.; Aramendía, M.; Rello, L. Dried matrix spots and clinical elemental analysis. Current status, difficulties, and opportunities. TrAC Trend. Anal. Chem. 2018, 99, 75–87. [Google Scholar] [CrossRef]
- Mei, J.V.; Zobel, S.D.; Hall, E.M.; De Jesus, V.R.; Adam, B.W.; Hannon, W.H. Performance properties of filter paper devices for whole blood collection. Bioanalysis 2010, 2, 1397–1403. [Google Scholar] [CrossRef]
- Keevil, B.G. The analysis of dried blood spot samples using liquid chromatography tandem mass spectrometry. Clin. Biochem. 2011, 44, 110–118. [Google Scholar] [CrossRef] [PubMed]
- Kulkarni, P.; Chaudhari, G.H.; Sripuram, V.; Banote, R.K.; Kirla, K.T.; Sultana, R.; Rao, P.; Oruganti, S.; Chatti, K. Oral dosing in adult zebrafish: Proof-of-concept using pharmacokinetics and pharmacological evaluation of carbamazepine. Pharmacol. Rep. 2014, 66, 179–183. [Google Scholar] [CrossRef] [PubMed]
- Stove, C.P.; Ingels, A.S.; De Kesel, P.M.; Lambert, W.E. Dried blood spots in toxicology: From the cradle to the grave? Crit. Rev. Toxicol. 2012, 42, 230–243. [Google Scholar] [CrossRef]
- Berm, E.J.J.; Paardekooper, J.; Brummel-Mulder, E.; Hak, E.; Wilffert, B.; Maring, J.G. A simple dried blood spot method for therapeutic drug monitoring of the tricyclic antidepressants amitriptyline, nortriptyline, imipramine, clomipramine, and their active metabolites using LC-MS/MS. Talanta 2015, 134, 165–172. [Google Scholar] [CrossRef]
- Linder, C.; Wide, K.; Walander, M.; Beck, O.; Gustafsson, L.L.; Pohanka, A. Comparison between dried blood spot and plasma sampling for therapeutic drug monitoring of antiepileptic drugs in children with epilepsy: A step towards home sampling. Clin. Biochem. 2017, 50, 418–424. [Google Scholar] [CrossRef]
- Martial, L.C.; Aarnoutse, R.E.; Mulder, M.; Schellekens, A.; Bruggemann, R.J.M.; Burger, D.M.; Schene, A.H.; Batalla, A. Dried Blood Spot sampling in psychiatry: Perspectives for improving therapeutic drug monitoring. Eur. Neuropsychopharmacol. 2017, 27, 205–216. [Google Scholar] [CrossRef] [PubMed]
- Zakaria, R.; Allen, K.J.; Koplin, J.J.; Roche, P.; Greaves, R.F. Advantages and Challenges of Dried Blood Spot Analysis by Mass Spectrometry Across the Total Testing Process. EJIFCC 2016, 27, 288–317. [Google Scholar] [PubMed]
- Odoardi, S.; Anzillotti, L.; Strano-Rossi, S. Simplifying sample pretreatment: Application of dried blood spot (DBS) method to blood samples, including postmortem, for UHPLC-MS/MS analysis of drugs of abuse. Forensic Sci. Int. 2014, 243, 61–67. [Google Scholar] [CrossRef] [PubMed]
- Chepyala, D.; Tsai, I.L.; Liao, H.W.; Chen, G.Y.; Chao, H.C.; Kuo, C.H. Sensitive screening of abused drugs in dried blood samples using ultra-high-performance liquid chromatography-ion booster-quadrupole time-of-flight mass spectrometry. J. Chromatogr. A 2017, 1491, 57–66. [Google Scholar] [CrossRef]
- Saussereau, E.; Lacroix, C.; Gaulier, J.M.; Goulle, J.P. On-line liquid chromatography/tandem mass spectrometry simultaneous determination of opiates, cocainics and amphetamines in dried blood spots. J. Chromatogr. B 2012, 885–886, 1–7. [Google Scholar] [CrossRef] [PubMed]
- Sadler Simoes, S.; Castanera Ajenjo, A.; Dias, M.J. Dried blood spots combined to an UPLC-MS/MS method for the simultaneous determination of drugs of abuse in forensic toxicology. J. Pharm. Biomed. Anal. 2018, 147, 634–644. [Google Scholar] [CrossRef] [PubMed]
- Kyriakou, C.; Marchei, E.; Scaravelli, G.; Garcia-Algar, O.; Supervia, A.; Graziano, S. Identification and quantification of psychoactive drugs in whole blood using dried blood spot (DBS) by ultra-performance liquid chromatography tandem mass spectrometry. J. Pharm. Biomed. Anal. 2016, 128, 53–60. [Google Scholar] [CrossRef] [PubMed]
- Ambach, L.; Hernandez Redondo, A.; Konig, S.; Weinmann, W. Rapid and simple LC-MS/MS screening of 64 novel psychoactive substances using dried blood spots. Drug Test Anal. 2014, 6, 367–375. [Google Scholar] [CrossRef]
- Deglon, J.; Lauer, E.; Thomas, A.; Mangin, P.; Staub, C. Use of the dried blood spot sampling process coupled with fast gas chromatography and negative-ion chemical ionization tandem mass spectrometry: Application to fluoxetine, norfluoxetine, reboxetine, and paroxetine analysis. Anal. Bioanal. Chem. 2010, 396, 2523–2532. [Google Scholar] [CrossRef] [PubMed][Green Version]
- Deglon, J.; Thomas, A.; Cataldo, A.; Mangin, P.; Staub, C. On-line desorption of dried blood spot: A novel approach for the direct LC/MS analysis of micro-whole blood samples. J. Pharm. Biomed. Anal. 2009, 49, 1034–1039. [Google Scholar] [CrossRef]
- Berm, E.J.; Brummel-Mulder, E.; Paardekooper, J.; Hak, E.; Wilffert, B.; Maring, J.G. Determination of venlafaxine and O-desmethylvenlafaxine in dried blood spots for TDM purposes, using LC-MS/MS. Anal. Bioanal. Chem. 2014, 406, 2349–2353. [Google Scholar] [CrossRef] [PubMed]
- Kloosterboer, S.M.; de Winter, B.C.M.; Bahmany, S.; Al-Hassany, L.; Dekker, A.; Dieleman, G.C.; van Gelder, T.; Dierckx, B.; Koch, B.C.P. Dried Blood Spot Analysis for Therapeutic Drug Monitoring of Antipsychotics: Drawbacks of Its Clinical Application. Ther. Drug Monit. 2018, 40, 344–350. [Google Scholar] [CrossRef] [PubMed]
- Patteet, L.; Maudens, K.E.; Stove, C.P.; Lambert, W.E.; Morrens, M.; Sabbe, B.; Neels, H. The use of dried blood spots for quantification of 15 antipsychotics and 7 metabolites with ultra-high performance liquid chromatography—Tandem mass spectrometry. Drug Test Anal. 2015, 7, 502–511. [Google Scholar] [CrossRef] [PubMed]
- Patteet, L.; Maudens, K.E.; Stove, C.P.; Lambert, W.E.; Morrens, M.; Sabbe, B.; Neels, H. Are capillary DBS applicable for therapeutic drug monitoring of common antipsychotics? A proof of concept. Bioanalysis 2015, 7, 2119–2130. [Google Scholar] [CrossRef] [PubMed]
- Moretti, M.; Visona, S.D.; Freni, F.; Tomaciello, I.; Vignali, C.; Groppi, A.; Tajana, L.; Osculati, A.M.M.; Morini, L. A liquid chromatography-tandem mass spectrometry method for the determination of cocaine and metabolites in blood and in dried blood spots collected from postmortem samples and evaluation of the stability over a 3-month period. Drug Test Anal. 2018, 10, 1430–1437. [Google Scholar] [CrossRef]
- Moretti, M.; Freni, F.; Tomaciello, I.; Vignali, C.; Groppi, A.; Visona, S.D.; Tajana, L.; Osculati, A.M.M.; Morini, L. Determination of benzodiazepines in blood and in dried blood spots (DBS) collected from postmortem samples and evaluation of the stability over a three-month period. Drug Test Anal. 2019, 11, 1403–1411. [Google Scholar] [CrossRef]
- Sempio, C.; Morini, L.; Vignali, C.; Groppi, A. Simple and sensitive screening and quantitative determination of 88 psychoactive drugs and their metabolites in blood through LC-MS/MS: Application on postmortem samples. J. Chromatogr. B 2014, 970, 1–7. [Google Scholar] [CrossRef]
- Peters, F.T.; Wissenbach, D.K.; Busardo, F.P.; Marchei, E.; Pichini, S. Method Development in Forensic Toxicology. Curr. Pharm. Des. 2017, 23, 5455–5467. [Google Scholar] [CrossRef]
- Saar, E.; Gerostamoulos, D.; Drummer, O.H.; Beyer, J. Assessment of the stability of 30 antipsychotic drugs in stored blood specimens. Forensic Sci. Int. 2012, 215, 152–158. [Google Scholar] [CrossRef]
- Machado-Vieira, R.; Baumann, J.; Wheeler-Castillo, C.; Latov, D.; Henter, I.D.; Salvadore, G.; Zarate, C.A. The Timing of Antidepressant Effects: A Comparison of Diverse Pharmacological and Somatic Treatments. Pharmaceuticals 2010, 3, 19–41. [Google Scholar] [CrossRef]
- Fisher, D.S.; Partridge, S.J.; Handley, S.A.; Flanagan, R.J. Stability of some atypical antipsychotics in human plasma, haemolysed whole blood, oral fluid, human serum and calf serum. Forensic Sci. Int. 2013, 229, 151–156. [Google Scholar] [CrossRef] [PubMed]
- Rieger-Gies, A.; Heller, S.; Stroba, G.; Daum-Kreysch, E.; Sachse, J.; Härtter, S.; Hiemke, C. Storage and Transport Stability of New Antidepressant and Antipsychotic Drugs. Pharmacopsychiatry 2005, 38, 73. [Google Scholar] [CrossRef]
- Timmerman, P.; White, S.; Globig, S.; Ludtke, S.; Brunet, L.; Smeraglia, J. EBF recommendation on the validation of bioanalytical methods for dried blood spots. Bioanalysis 2011, 3, 1567–1575. [Google Scholar] [CrossRef] [PubMed]
- Zhang, J.; Majumdar, T.K.; Flarakos, J.; Tse, F.L.S. Best Practices in LC-MS Method Development and Validation for Dried Blood Spots. Handb. LC-MS Bioanal. 2013, 379–389. [Google Scholar] [CrossRef]
- Morini, L.; Bernini, M.; Vezzoli, S.; Restori, M.; Moretti, M.; Crenna, S.; Papa, P.; Locatelli, C.; Osculati, A.M.M.; Vignali, C.; et al. Death after 25C-NBOMe and 25H-NBOMe consumption. Forensic Sci. Int. 2017, 279, e1–e6. [Google Scholar] [CrossRef] [PubMed]
- Vignali, C.; Moretti, M.; Groppi, A.; Osculati, A.M.M.; Tajana, L.; Morini, L. Distribution of the Synthetic Cathinone alpha-Pyrrolidinohexiophenone in Biological Specimens. J. Anal. Toxicol. 2019, 43, e1–e6. [Google Scholar] [CrossRef] [PubMed]
- Heller, S.; Hiemke, C.; Stroba, G.; Rieger-Gies, A.; Daum-Kreysch, E.; Sachse, J.; Hartter, S. Assessment of storage and transport stability of new antidepressant and antipsychotic drugs for a nationwide TDM service. Ther. Drug Monit. 2004, 26, 459–461. [Google Scholar] [CrossRef]
- Leis, H.J.; Windischhofer, W.; Raspotnig, G.; Fauler, G. Stable isotope dilution negative ion chemical ionization gas chromatography-mass spectrometry for the quantitative analysis of paroxetine in human plasma. J. Mass. Spectrom. 2001, 36, 923–928. [Google Scholar] [CrossRef]
- Massaroti, P.; Cassiano, N.M.; Duarte, L.F.; Campos, D.R.; Marchioretto, M.A.; Bernasconi, G.; Calafatti, S.; Barros, F.A.; Meurer, E.C.; Pedrazzoli, J. Validation of a selective method for determination of paroxetine in human plasma by LC-MS/MS. J. Pharm. Pharm. Sci. 2005, 8, 340–347. [Google Scholar]
- Geschke, R.; Korner, J.; Eggers, H. Determination of the new monoamine oxidase inhibitor moclobemide and three of its metabolites in biological fluids by high-performance liquid chromatography. J. Chromatogr. 1987, 420, 111–120. [Google Scholar] [CrossRef]
- Morgan, P.E.; Tapper, J.; Spencer, E.P. Measurement of total mirtazapine and normirtazapine in plasma/serum by liquid chromatography with fluorescence detection. J. Chromatogr. B 2003, 798, 211–215. [Google Scholar] [CrossRef] [PubMed]
- Lantz, R.J.; Farid, K.Z.; Koons, J.; Tenbarge, J.B.; Bopp, R.J. Determination of fluoxetine and norfluoxetine in human plasma by capillary gas chromatography with electron-capture detection. J. Chromatogr. 1993, 614, 175–179. [Google Scholar] [CrossRef]
- Maris, F.A.; Dingler, E.; Niehues, S. High-performance liquid chromatographic assay with fluorescence detection for the routine monitoring of the antidepressant mirtazapine and its demethyl metabolite in human plasma. J. Chromatogr. B Biomed. Sci. Appl. 1999, 721, 309–316. [Google Scholar] [CrossRef]
- Roemmelt, A.T.; Steuer, A.E.; Kraemer, T. Liquid chromatography, in combination with a quadrupole time-of-flight instrument, with sequential window acquisition of all theoretical fragment-ion spectra acquisition: Validated quantification of 39 antidepressants in whole blood as part of a simultaneous screening and quantification procedure. Anal. Chem. 2015, 87, 9294–9301. [Google Scholar] [CrossRef] [PubMed]
- Macek, J.; Ptacek, P.; Klima, J. Rapid determination of citalopram in human plasma by high-performance liquid chromatography. J. Chromatogr. B Biomed. Sci. Appl. 2001, 755, 279–285. [Google Scholar] [CrossRef]
- Peters, F.T. Stability of analytes in biosamples—An important issue in clinical and forensic toxicology? Anal. Bioanal. Chem. 2007, 388, 1505–1519. [Google Scholar] [CrossRef]
- Rao, M.L.; Staberock, U.; Baumann, P.; Hiemke, C.; Deister, A.; Cuendet, C.; Amey, M.; Hartter, S.; Kraemer, M. Monitoring tricyclic antidepressant concentrations in serum by fluorescence polarization immunoassay compared with gas chromatography and HPLC. Clin. Chem. 1994, 40, 929–933. [Google Scholar]
- Wille, S.M.; De Letter, E.A.; Piette, M.H.; Van Overschelde, L.K.; Van Peteghem, C.H.; Lambert, W.E. Determination of antidepressants in human postmortem blood, brain tissue, and hair using gas chromatography-mass spectrometry. Int. J. Legal. Med. 2009, 123, 451–458. [Google Scholar] [CrossRef]
- Martin, A.; Pounder, D.J. Post-mortem toxico-kinetics of trazodone. Forensic Sci. Int. 1992, 56, 201–207. [Google Scholar] [CrossRef]
- Holmgren, P.; Druid, H.; Holmgren, A.; Ahlner, J. Stability of drugs in stored postmortem femoral blood and vitreous humor. J. Forensic Sci. 2004, 49, 820–825. [Google Scholar] [CrossRef]
- Khelfi, A.; Azzouz, M.; Abtroun, R.; Reggabi, M.; Alamir, B. Determination of Chlorpromazine, Haloperidol, Levomepromazine, Olanzapine, Risperidone, and Sulpiride in Human Plasma by Liquid Chromatography/Tandem Mass Spectrometry (LC-MS/MS). Int. J. Anal. Chem. 2018, 2018, 5807218. [Google Scholar] [CrossRef] [PubMed]
- Remane, D.; Meyer, M.R.; Wissenbach, D.K.; Maurer, H.H. Ultra high performance liquid chromatographic-tandem mass spectrometric multi-analyte procedure for target screening and quantification in human blood plasma: Validation and application for 31 neuroleptics, 28 benzodiazepines, and Z-drugs. Anal. Bioanal. Chem. 2011, 401, 1341–1352. [Google Scholar] [CrossRef] [PubMed]
- Karinen, R.; Andresen, W.; Smith-Kielland, A.; Morland, J. Long-term storage of authentic postmortem forensic blood samples at −20 degrees C: Measured concentrations of benzodiazepines, central stimulants, opioids and certain medicinal drugs before and after storage for 16–18 years. J. Anal. Toxicol. 2014, 38, 686–695. [Google Scholar] [CrossRef] [PubMed]
- Lewis, R.J.; Angier, M.K.; Johnson, R.D.; Rains, B.M.; Nepal, S. Analysis of Citalopram and Desmethylcitalopram in Postmortem Fluids and Tissues Using Liquid Chromatography-Mass Spectrometry; Technical Report for Federal Aviation Administration Oklahoma City OK Civil Aerospace Medical Institute: Oklahoma City, OK, USA, October 2011; p. 11. [Google Scholar]
- Lavasani, H.; Giorgi, M.; Sheikholeslami, B.; Hedayati, M.; Rouini, M.R. A Rapid and Sensitive HPLC-Fluorescence Method for Determination of Mirtazapine and Its two Major Metabolites in Human Plasma. Iran J. Pharm. Res. 2014, 13, 853–862. [Google Scholar] [PubMed]
- Kuchekar, S.R.; Kundlik, M.L.; Zaware, B.H. Rapid quantification of mirtazapine and desmethyl mirtazapine in human plasma by LC–ESI-MS/MS: Application to a bioequivalence study. J. Saudi Chem. Soc. 2011, 15, 145–153. [Google Scholar] [CrossRef]
- Butzbach, D.M.; Stockham, P.C.; Kobus, H.J.; Sims, D.N.; Byard, R.W.; Lokan, R.J.; Walker, G.S. Stability of serotonin-selective antidepressants in sterile and decomposing liver tissue. J. Forensic Sci. 2013, 58, S117–S125. [Google Scholar] [CrossRef] [PubMed]
- Binsumait, I.A.; Hadidi, K.A.; Raghib, S.A. Stability of fluoxetine in stored plasma, aqueous, and methanolic solutions determined by HPLC with UV detection. Pharmazie 2001, 56, 311–313. [Google Scholar] [PubMed]
- Karinen, R.; Oiestad, E.L.; Andresen, W.; Smith-Kielland, A.; Christophersen, A. Comparison of the stability of stock solutions of drugs of abuse and other drugs stored in a freezer, refrigerator, and at ambient temperature for up to one year. J. Anal. Toxicol. 2011, 35, 583–590. [Google Scholar] [CrossRef]
- Youssef, R.M.; Abdine, H.H.; Barary, M.A.; Wagih, M.M. Selective RP-HPLC method for determination of quetiapine in presence of coadministered drugs: Application for long-term stability study of quetiapine in whole bloo. Acta Chromatogr. 2016, 28. [Google Scholar] [CrossRef]
- Butzbach, D.M.; Stockham, P.C.; Kobus, H.J.; Sims, D.N.; Byard, R.W.; Lokan, R.J.; Walker, G.S. Bacterial degradation of risperidone and paliperidone in decomposing blood. J. Forensic Sci. 2013, 58, 90–100. [Google Scholar] [CrossRef]
- Peters, F.T.; Drummer, O.H.; Musshoff, F. Validation of new methods. Forensic Sci. Int. 2007, 165, 216–224. [Google Scholar] [CrossRef] [PubMed]
- Fisichella, M.; Morini, L.; Sempio, C.; Groppi, A. Validation of a multi-analyte LC-MS/MS method for screening and quantification of 87 psychoactive drugs and their metabolites in hair. Anal. Bioanal. Chem. 2014, 406, 3497–3506. [Google Scholar] [CrossRef] [PubMed]
Sample Availability: Samples of the compounds are not available from the authors. |


| Substance Antidepressants | LOD (ng/mL) | LOQ (ng/mL) | Substance Antipsychotics | LOD (ng/mL) | LOQ (ng/mL) |
|---|---|---|---|---|---|
| Amitriptyline | 0.6 | / | Amisulpride | 0.2 | 5.0 |
| Citalopram | 2.3 | 5.0 | Asenapine | 4.1 | / |
| Desipramine | 0.9 | / | Chlorpromazine | 0.4 | / |
| N-Desmethyl-mirtazapine | 1.4 | 5.0 | Clotiapine | 1.8 | 10.0 |
| Desvenlafaxine | 3.2 | 5.0 | Clozapine | 1.4 | / |
| Dibenzepin | 0.3 | 5.0 | Dixyrazine | 1.3 | 5.0 |
| Dothiepin | 1.8 | / | Duloxetine | 1.3 | / |
| Fluoxetine | 1.6 | 5.0 | Fluphenazine | 0.3 | / |
| Fluvoxamine | 1.9 | 5.0 | Haloperidol | 0.8 | 10.0 |
| Maprotiline | 0.6 | / | Hydroxyzine | 0.9 | / |
| Mianserin | 1.0 | / | Levomepromazine | 5.2 | / |
| Mirtazapine | 2.2 | 10.0 | Olanzapine | 2.7 | / |
| Nortriptyline | 0.5 | / | Paliperidone | 1.4 | 10.0 |
| Paroxetine | 0.6 | / | Pimozide | 2.1 | 5.0 |
| Protriptyline | 2.0 | / | Promazine | 0.1 | / |
| Reboxetine | 1.1 | / | Promethazine | 2.0 | / |
| Sertraline | 0.5 | / | Quetiapine | 0.8 | 10.0 |
| Trazodone | 0.5 | 5.0 | Tiapride | 0.4 | / |
| Trimipramine | 0.1 | 5.0 | Ziprasidone | 1.8 | / |
| Venlafaxine | 0.1 | 5.0 |
| Substance | Accuracy (bias%) | Intra-Day Precision (CV%) | Inter-Day Precision (CV%) | ||||||||||||
|---|---|---|---|---|---|---|---|---|---|---|---|---|---|---|---|
| 5 ng/mL | 10 ng/mL | 20 ng/mL | 100 ng/mL | 250 ng/mL | 5 ng/mL | 10 ng/mL | 20 ng/mL | 100 ng/mL | 250 ng/mL | 5 ng/mL | 10 ng/mL | 20 ng/mL | 100 ng/mL | 250 ng/mL | |
| Amisulpride | 6.6 | 2.2 | 0.2 | 0.9 | 1.3 | 20.0 | 5.3 | 8.6 | 6.6 | 8.2 | 15.4 | 20.0 | 8.0 | 16.9 | 2.1 |
| Clotiapine | / | 7.0 | 11.5 | 3.6 | 0.4 | / | 3.7 | 7.1 | 16.3 | 6.9 | / | 17.1 | 17.4 | 12.5 | 4.5 |
| Haloperidol | / | 7.7 | 4.7 | 2.1 | 0.2 | / | 11.3 | 7.9 | 14.6 | 12.3 | / | 18.9 | 2.2 | 17.2 | 14.1 |
| Paliperidone | / | 6.8 | 6.1 | 3.0 | 0.4 | / | 19.5 | 8.5 | 15.0 | 19.3 | / | 17.9 | 7.3 | 5.7 | 5.7 |
| Quetiapine | / | 8.1 | 1.0 | 1.0 | 0.2 | / | 19.5 | 17.2 | 6.2 | 5.3 | / | 2.8 | 15.9 | 5.2 | 17.9 |
| Citalopram | 4.5 | 1.6 | 4.0 | 1.8 | 0.3 | 9.3 | 18.2 | 4.9 | 9.7 | 4.2 | 4.5 | 18.6 | 13.2 | 7.6 | 8.1 |
| Desvenlafaxine | 5.9 | 0.3 | 2.7 | 0.9 | 0.1 | 17.5 | 18.4 | 14.2 | 8.9 | 15.6 | 9.8 | 18.8 | 12.7 | 12.8 | 5.6 |
| Dibenzepin | 5.6 | 3.8 | 1.3 | 0.4 | 1.6 | 19.8 | 20.0 | 11.0 | 18.1 | 2.2 | 7.2 | 6.3 | 8.4 | 14.8 | 1.2 |
| Fluoxetine | 16.6 | 0.4 | 0.8 | 1.5 | 0.3 | 18.6 | 6.2 | 17.6 | 6.5 | 7.1 | 19.6 | 17.4 | 14.7 | 16.1 | 3.1 |
| Fluvoxamine | 0.6 | 8.5 | 3.5 | 2.8 | 0.3 | 20.0 | 2.5 | 16.0 | 11.9 | 18.9 | 18.6 | 17.6 | 16.9 | 20.0 | 20,0 |
| Mirtazapine | / | 10.5 | 1.6 | 3.0 | 0.5 | / | 15.9 | 11.9 | 18.6 | 7.0 | / | 20.0 | 10.0 | 10.2 | 5.9 |
| N-Desmethyl-mirtazapine | 0.5 | 6.3 | 2.1 | 0.3 | 2.3 | 19.6 | 18.0 | 4.1 | 2.7 | 18.2 | 6.2 | 16.5 | 8.4 | 18.6 | 3.6 |
| Trazodone | 12.9 | 2.0 | 0.6 | 1.7 | 0.1 | 18.9 | 19.9 | 15.6 | 15.3 | 5.5 | 4.9 | 20.0 | 5.7 | 9.6 | 7.8 |
| Venlafaxine | 6.0 | 3.4 | 5.3 | 1.2 | 0.2 | 17.9 | 3.5 | 11.5 | 12.2 | 6.9 | 10.8 | 2.6 | 8.3 | 15.3 | 2.2 |
| Substance | Recovery % | Matrix Effects % | ||||||
|---|---|---|---|---|---|---|---|---|
| 5 ng/mL | 10 ng/mL | 20 ng/mL | 250 ng/mL | 5 ng/mL | 10 ng/mL | 20 ng/mL | 250 ng/mL | |
| Amisulpride | 115.7 | 110.9 | 79,6 | 103.9 | +16.2 | +11.8 | +19.3 | +4.1 |
| Clotiapine | / | 119.2 | 118.8 | 113.5 | / | +20.3 | −17.8 | −7.7 |
| Haloperidol | / | 114.1 | 70.5 | 103.1 | / | −12.2 | −19.1 | +14.5 |
| Paliperidone | / | 53.4 | 59.4 | 44.7 | / | +17.6 | −6.0 | +3.9 |
| Quetiapine | / | 50.4 | 40.8 | 26.9 | / | +5.5 | +16.2 | +17.8 |
| Citalopram | 99.2 | 98.5 | 66.9 | 92.1 | +1.5 | −12.9 | −12.8 | −1.9 |
| Desvenlafaxine | 95.2 | 85.4 | 85.4 | 89.3 | −2.1 | −11.5 | +13.9 | −11.6 |
| Dibenzepin | 117.8 | 106.4 | 76.5 | 103.9 | −10.4 | +19.7 | −4.3 | +20.5 |
| Fluoxetine | 120.0 | 49.7 | 32.1 | 57.0 | −16.3 | −0.7 | +19.4 | +18.5 |
| Fluvoxamine | 118.8 | 69.2 | 90.1 | 86.6 | −1.0 | −16.8 | −4.1 | +20.6 |
| Mirtazapine | / | 116.7 | 77.0 | 101.6 | / | −0.6 | −18.5 | +4.6 |
| N-desmethyl-mirtazapine | 102.4 | 117.6 | 87.1 | 87.3 | −18.6 | −18.5 | −16.5 | −3.6 |
| Trazodone | 88.0 | 112.4 | 59.8 | 95.9 | −2.2 | −19.4 | −19.6 | +20.6 |
| Venlafaxine | 116.4 | 118.7 | 87.3 | 94.4 | +0.6 | −10.2 | −13.7 | −13.2 |
| Case Number | Substance | Blood Therapeutic Range Used in the Laboratory (ng/mL) | Concentration in DBS (ng/mL) |
|---|---|---|---|
| 1 | Trazodone Paroxetine | 700.0–1000.0 10.0–50.0 | 91.1 671.6 |
| 2 | Fluvoxamine | 60.0–230.0 | 2366.0 |
| 3 | Mirtazapine N-desmethylmirtazapine | 30.0–80.0 / | 133.7 112.1 |
| 4 | Fluoxetine | 120.0–500.0 | 5.6 |
| 5 | Citalopram | 50.0–110.0 | 408.3 |
| 6 | Citalopram | 50.0–110.0 | 56.9 |
| 7 | Venlafaxine Desvenlafaxine | 100.0–400.0 100.0–400.0 | 362.5 523.5 |
| 8 | Dibenzepin Quetiapine Dixyrazine | 25.0–150.0 100.0–500.0 ≈300.0 | 483.4 2309.7 126.4 |
| 9 | Pimozide | 4.0–10.0 | 13.1 |
| 10 | Trazodone | 700.0–1000.0 | 162.0 |
| 11 | Quetiapine | 100.0–500.0 | 84.1 |
| 12 | Venlafaxine Desvenlafaxine | 100.0–400.0 100.0–400.0 | 25.6 479.5 |
| 13 | Paliperidone | 20.0–60.0 | 17.6 |
| 14 | Amisulpride | 100.0–400.0 | 527.2 |
| 15 | Venlafaxine Desvenlafaxine Quetiapine | 100.0–400.0 100.0–400.0 100.0–500.0 | 321.7 686.1 153.5 |
| 16 | Clotiapine Haloperidol | 5.0–170.0 5.0–40.0 | 24.5 19.0 |
| Analytes (Number of Positive Cases) | Stability of the Analytes on DBSs Observed in the Present Study | Stability of the Analytes in Similar Matrices According to Previously Published Articles |
|---|---|---|
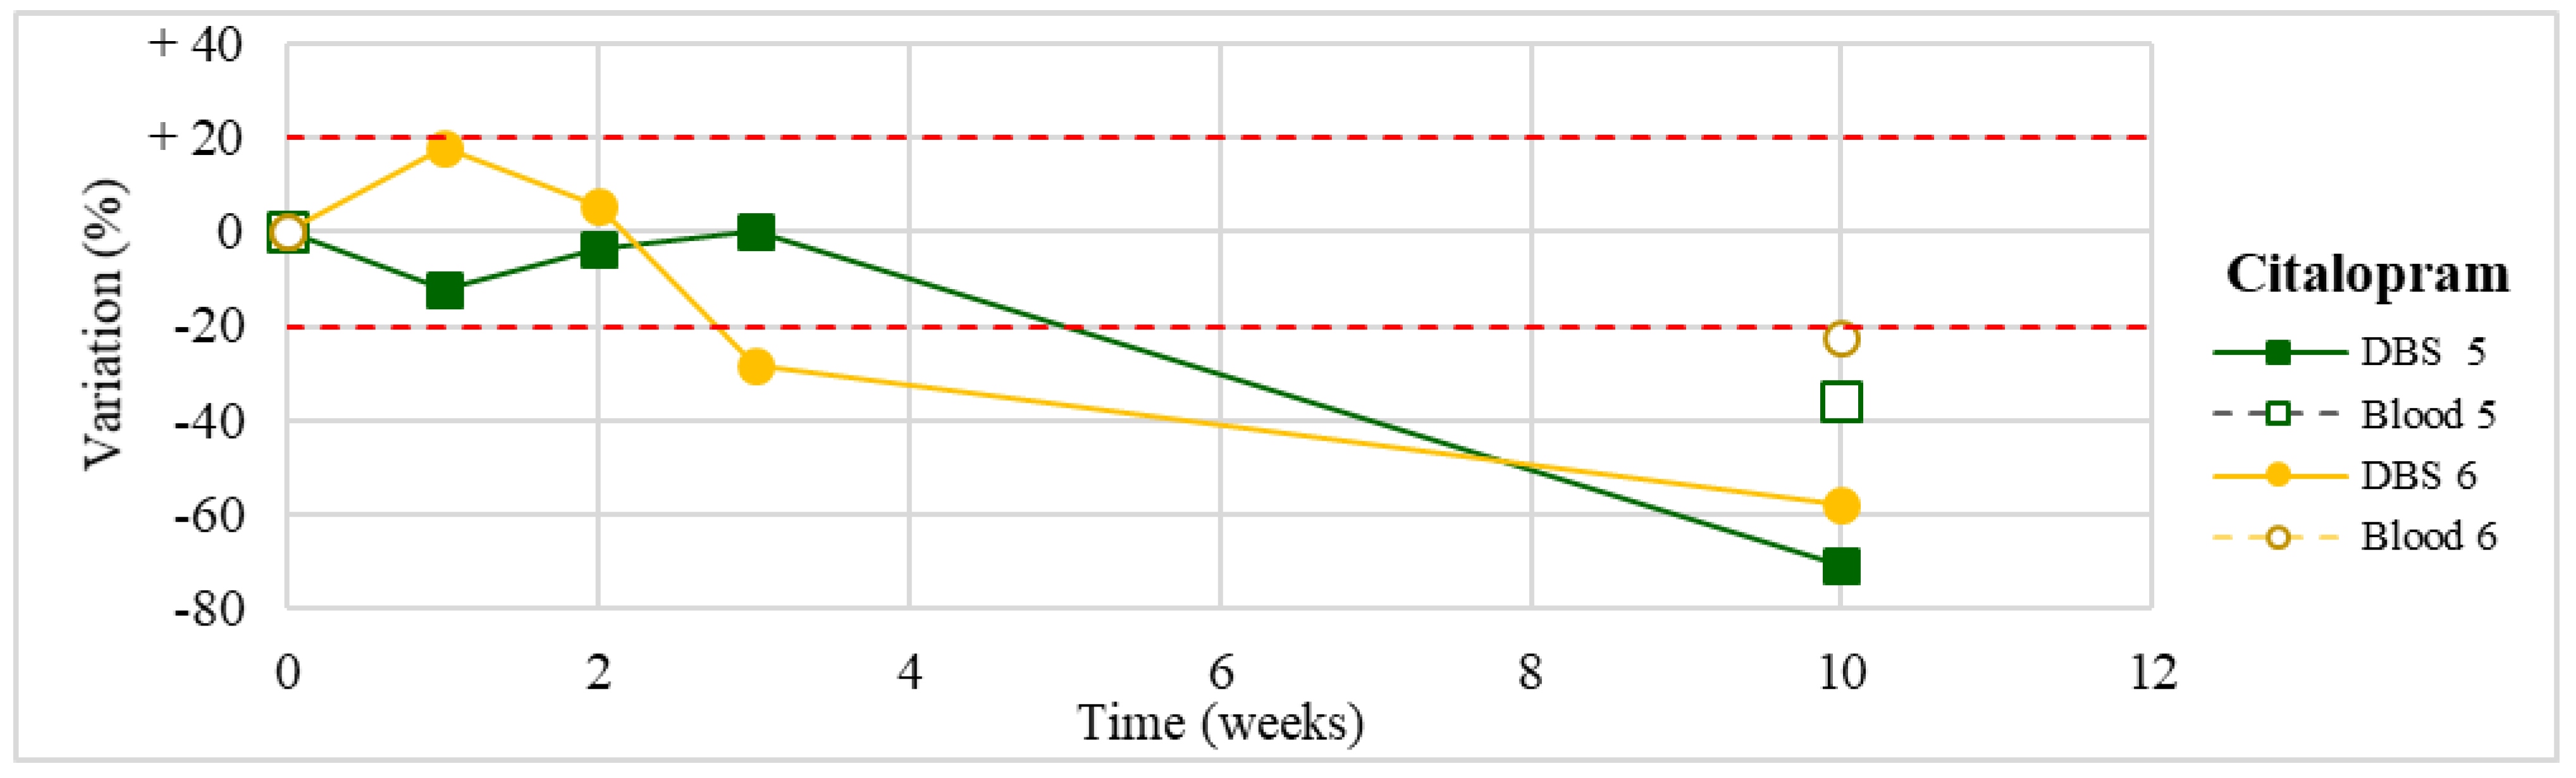
| Citalopram (n = 2) | Stable for the first 2 weeks in one case and for 3 weeks in the other one. Degradation >50% after 3-month storage. | |
| Mirtazapine (n = 1) | Stable within the 3-month period. | |
| N-desmethyl mirtazapine (n = 1) | Stable for the first 3 weeks, with a slight degradation (−24%) at T4. | |
| Venlafaxine (n = 3) | Stable within the 3-month period. | |
| Desvenlafaxine (n = 3) | Stable within the 3-month period (except for an apparent degradation at T1 in one case, not confirmed at further analyses). | |
| Trazodone (n = 1) | Stable within the 3-month period. | / |
| Dibenzepin (n = 1) | Stable for the first 3 weeks. Degradation >50% after 3-month storage on DBSs (but not in blood stored at −20° C). | / |
| Fluvoxamine (n = 1) | Moderate degradation in the first week (about −30%), remaining substantially stable afterward. | / |
| Fluoxetine § (n = 1) | Slight degradation after the first week of storage (about −20%), remaining stable at the further analyses. |
|
| Paroxetine * (n = 1) | Stable within the 3-month period. |
|
| Dixyrazine * (n = 1) | Stable within the 3-month period. | / |
| Quetiapine (n = 3) | In one case, moderate increase in the first 3 weeks (<31%). In the other two cases, stable within the 3-month period (except for an apparent degradation of 29% at T1 in one of them, not confirmed at further analyses). |
|
| Amisulpride (n = 1) | Stable within the 3-month period. | |
| Haloperidol (n = 1) | Stable within the 3-month period. | / |
| Pimozide * (n = 1) | Stable for the first 3 weeks. Degradation >50% after 3-month storage. | / |
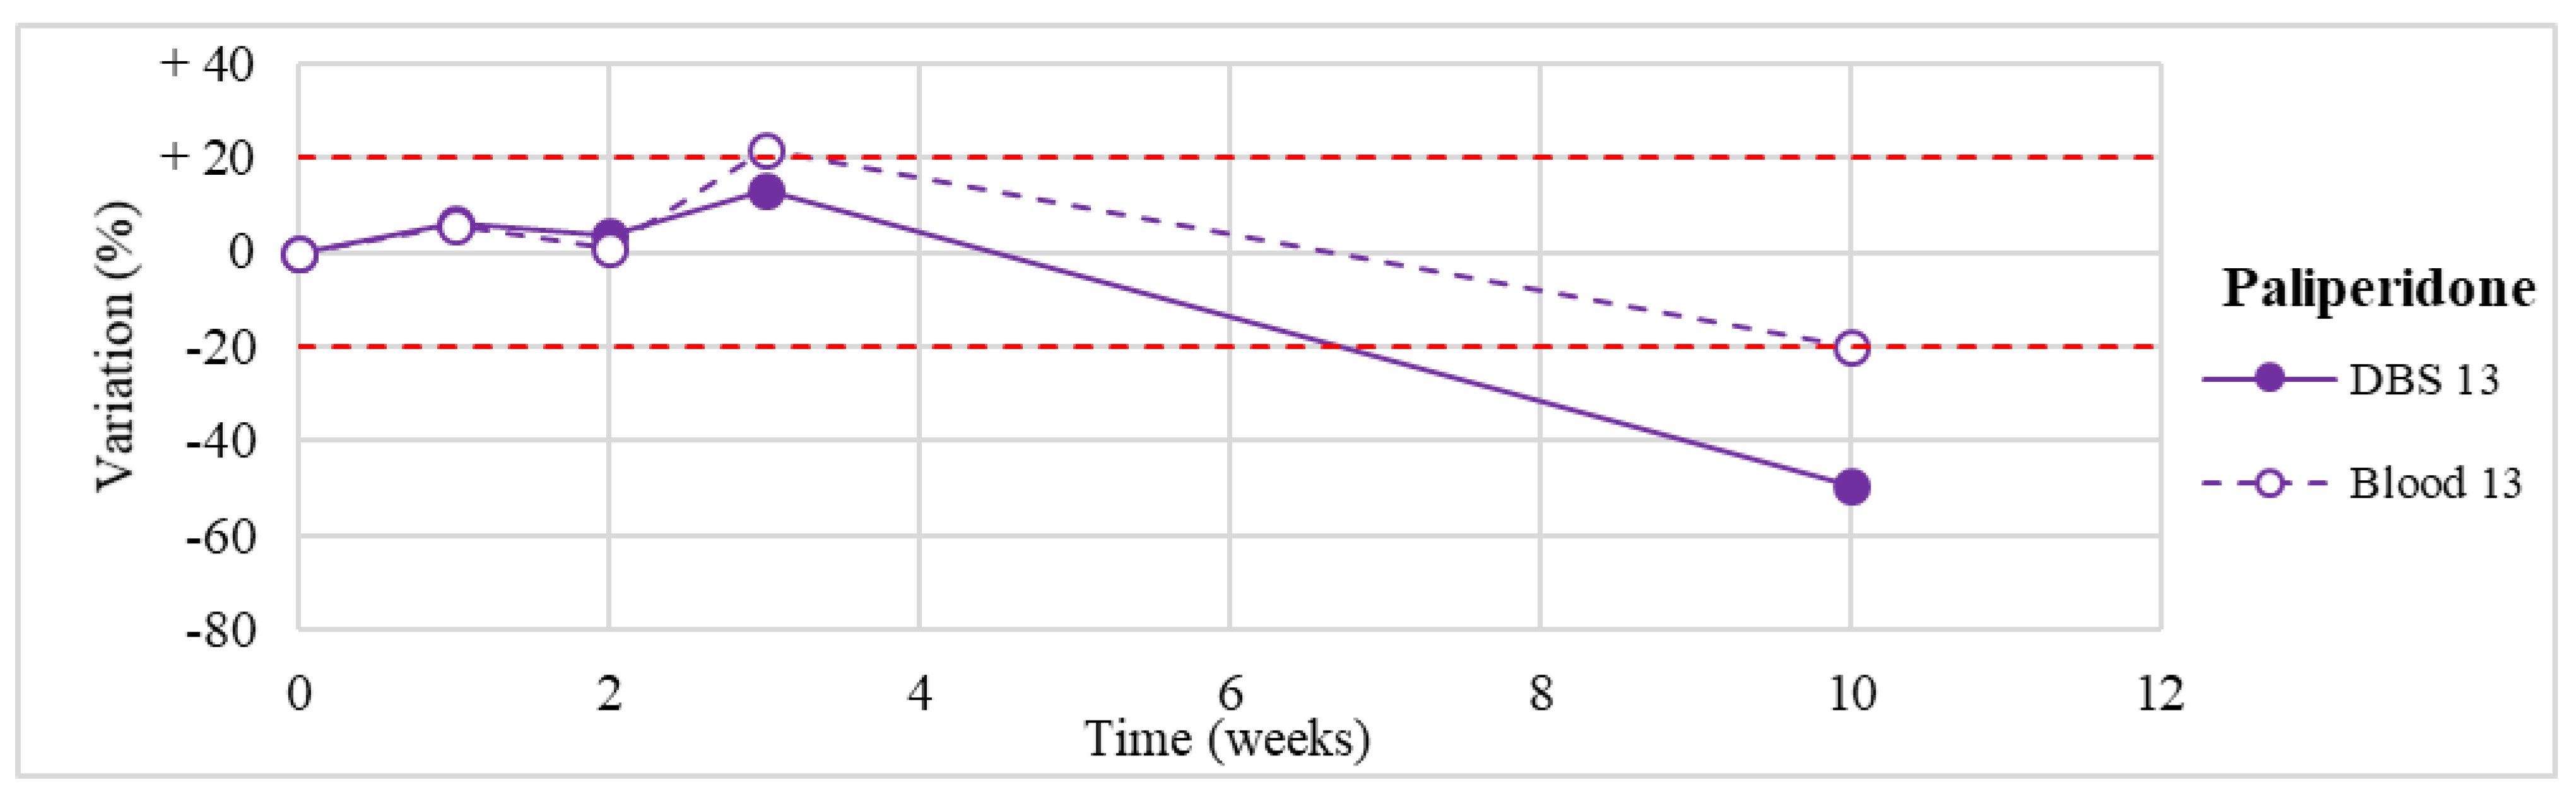
| Paliperidone (n = 1) | Stable for the first 3 weeks. Degradation >50% after 3-month storage on DBSs (but not in blood stored at −20° C). |
|
| Clotiapine (n = 1) | Unstable after 2 weeks, with >70% loss after 3 months. | / |
| Liquid Chromatography | |
| Flow rate | 200 µL/min → 400 µL/min constant flow of 0.2 mL/min; gradient elution: 90% A maintained for 2.5 min, then from 90% to 10% A within 3.0 min, maintaining 10% A up to 10.0 min, and re-equilibration up to 20 min. |
| Mobile phase | H2O 0.1% (v/v) formic acid (A) Acetonitrile 0.1% (v/v) formic acid (B) |
| Type of elution | gradient |
| Column | Kinetex C18 (100 × 2,1 mm, 5 µm particle size) (Phenomenex, Castelmaggiore, BO, Italy) Kept at 45° during the analysis |
| Mass Spectrometry | |
| Operative mode | Multiple reaction monitoring (MRM)—positive polarity using nitrogen as collision gas (pressure set at level 5). Dwell time: 30 ms. |
| Ion spray voltage | 5000 V |
| Source temperature | 350 °C |
| Curtain gas | 15 PSI |
| Nebulization gas (air) | 20 PSI |
| Heating gas (air) | 25 PSI |
| ANALYTE | Q1 (m/z) | Q3 (m/z) | DP *(V) | EP *(V) | CE *(V) | CXP *(V) |
|---|---|---|---|---|---|---|
| Antidepressants | ||||||
| Amitriptyline | 278.1 | 233.3 | 102 | 10 | 25 | 5 |
| 278.1 | 91.2 | 102 | 10 | 35 | 3 | |
| Citalopram | 325.1 | 109.2 | 100 | 9 | 35 | 4 |
| 325.1 | 262.3 | 100 | 9 | 28 | 6 | |
| Citalopram-D6 | 331.1 | 109.1 | 85 | 10 | 37 | 5 |
| 331.1 | 262.1 | 85 | 10 | 28 | 10 | |
| Desipramine | 266.9 | 72.2 | 71 | 10 | 28 | 11 |
| 266.9 | 208.3 | 71 | 10 | 33 | 10 | |
| N-Desmethylmirtazapine | 252.0 | 195.2 | 95 | 9 | 32 | 8 |
| 252.0 | 209.1 | 95 | 9 | 32 | 9 | |
| Desvenlafaxine | 265.0 | 58.1 | 62 | 10 | 48 | 7 |
| 265.0 | 202.0 | 62 | 10 | 25 | 8 | |
| Dibenzepin | 295.9 | 250.9 | 90 | 10 | 35 | 10 |
| 295.9 | 209.2 | 90 | 10 | 47 | 10 | |
| Dothiepin | 295.9 | 223.2 | 75 | 8 | 33 | 11 |
| 295.9 | 218.3 | 75 | 8 | 33 | 11 | |
| Fluoxetine | 310.1 | 310.1 | 63 | 8 | 7 | 10 |
| 310.1 | 148.3 | 63 | 8 | 13 | 7 | |
| Fluvoxamine | 319.0 | 258.3 | 69 | 8 | 16 | 7 |
| 319.0 | 71.2 | 69 | 8 | 29 | 11 | |
| Maprotiline | 278.2 | 250.3 | 148 | 8 | 28 | 13 |
| 278.2 | 219.3 | 148 | 8 | 36 | 11 | |
| Mianserin | 264.9 | 208.3 | 103 | 12 | 30 | 10 |
| 264.9 | 58.3 | 103 | 12 | 47 | 8 | |
| Mirtazapine | 267.0 | 196.0 | 100 | 10 | 35 | 8 |
| 267.0 | 72.0 | 100 | 10 | 32 | 9 | |
| Nortriptyline | 263.9 | 233.3 | 80 | 9 | 22 | 12 |
| 263.9 | 91.2 | 80 | 9 | 35 | 3 | |
| Paroxetine | 330.4 | 192.3 | 144 | 9 | 30 | 9 |
| 330.4 | 70.2 | 144 | 9 | 49 | 11 | |
| Protriptyline | 264.9 | 192.2 | 110 | 10 | 34 | 7 |
| 264.9 | 156.2 | 110 | 10 | 29 | 7 | |
| Reboxetine | 313.8 | 176.0 | 81 | 10 | 31 | 29 |
| 313.8 | 91.1 | 81 | 10 | 43 | 3 | |
| Sertraline | 306.0 | 159.2 | 63 | 8 | 37 | 7 |
| 306.0 | 275.2 | 63 | 8 | 18 | 6 | |
| Trazodone | 372.2 | 176.3 | 97 | 9 | 35 | 8 |
| 372.2 | 148.2 | 97 | 9 | 48 | 6 | |
| Trimipramine | 295.0 | 100.3 | 69 | 10 | 23 | 4 |
| 295.0 | 58.1 | 69 | 10 | 59 | 8 | |
| Venlafaxine | 278.0 | 58.2 | 71 | 10 | 40 | 6 |
| 278.0 | 121.1 | 71 | 10 | 40 | 3 | |
| Antipsychotics | ||||||
| Amisulpride | 369.9 | 242.2 | 101 | 9 | 39 | 12 |
| 369.9 | 112.5 | 101 | 9 | 39 | 4 | |
| Asenapine | 286.2 | 165.9 | 96 | 10 | 46 | 6 |
| 286.2 | 215.0 | 96 | 10 | 40 | 8 | |
| Chlorpromazine | 318.8 | 86.2 | 78 | 7 | 29 | 3 |
| 318.8 | 246.2 | 78 | 7 | 34 | 12 | |
| Clotiapine | 343.9 | 287.2 | 101 | 14 | 30 | 7 |
| 343.9 | 255.3 | 101 | 14 | 44 | 5 | |
| Clozapine | 327.0 | 270.1 | 100 | 9 | 34 | 6 |
| 327.0 | 296.3 | 100 | 9 | 36 | 7 | |
| Clozapine-D4 | 331.3 | 272.3 | 94 | 10 | 35 | 9 |
| 331.3 | 299.1 | 94 | 10 | 35 | 11 | |
| Dixyrazine | 427.9 | 229.3 | 104 | 10 | 37 | 11 |
| 427.9 | 187.3 | 104 | 10 | 39 | 9 | |
| Duloxetine | 298.2 | 154.1 | 38 | 8 | 8 | 5 |
| 298.2 | 188.0 | 38 | 8 | 8 | 7 | |
| Fluphenazine | 437.9 | 171.3 | 109 | 10 | 38 | 8 |
| 437.9 | 143.3 | 109 | 10 | 45 | 6 | |
| Haloperidol | 375.9 | 165.2 | 83 | 10 | 34 | 7 |
| 375.9 | 123.1 | 83 | 10 | 57 | 5 | |
| Hydroxyzine | 376.1 | 202.2 | 64 | 10 | 26 | 10 |
| 376.1 | 166.2 | 64 | 10 | 70 | 7 | |
| Levomepromazine | 330.0 | 100.3 | 72 | 14 | 30 | 4 |
| 330.0 | 243.2 | 72 | 14 | 33 | 12 | |
| Olanzapine | 330.0 | 100.3 | 72 | 14 | 30 | 4 |
| 330.0 | 243.2 | 72 | 14 | 33 | 12 | |
| Paliperidone | 427.3 | 207.2 | 122 | 10 | 40 | 8 |
| 427.3 | 110.1 | 122 | 10 | 60 | 2 | |
| Pimozide | 462.1 | 328.4 | 126 | 10 | 43 | 8 |
| 462.1 | 109.2 | 126 | 10 | 88 | 4 | |
| Promazine | 284.8 | 86.2 | 65 | 12 | 29 | 13 |
| 284.8 | 212.3 | 65 | 12 | 35 | 10 | |
| Promethazine | 285.0 | 198.0 | 80 | 10 | 18 | 15 |
| 285.0 | 240.0 | 80 | 10 | 20 | 15 | |
| Quetiapine | 384.5 | 253.5 | 96 | 10 | 31 | 6 |
| 384.5 | 279.1 | 96 | 10 | 34 | 7 | |
| Quetiapine-D8 | 392.3 | 258.3 | 90 | 10 | 35 | 12 |
| 392.3 | 286.5 | 90 | 10 | 34 | 15 | |
| Tiapride | 328.9 | 256.0 | 118 | 6 | 26 | 20 |
| 328.9 | 213.2 | 118 | 6 | 48 | 10 | |
| Ziprasidone | 413.3 | 194.2 | 121 | 10 | 39 | 9 |
| 413.3 | 177.3 | 121 | 10 | 39 | 8 | |
© 2019 by the authors. Licensee MDPI, Basel, Switzerland. This article is an open access article distributed under the terms and conditions of the Creative Commons Attribution (CC BY) license (http://creativecommons.org/licenses/by/4.0/).
Share and Cite
Moretti, M.; Freni, F.; Valentini, B.; Vignali, C.; Groppi, A.; Visonà, S.D.; Osculati, A.M.M.; Morini, L. Determination of Antidepressants and Antipsychotics in Dried Blood Spots (DBSs) Collected from Post-Mortem Samples and Evaluation of the Stability over a Three-Month Period. Molecules 2019, 24, 3636. https://doi.org/10.3390/molecules24203636
Moretti M, Freni F, Valentini B, Vignali C, Groppi A, Visonà SD, Osculati AMM, Morini L. Determination of Antidepressants and Antipsychotics in Dried Blood Spots (DBSs) Collected from Post-Mortem Samples and Evaluation of the Stability over a Three-Month Period. Molecules. 2019; 24(20):3636. https://doi.org/10.3390/molecules24203636
Chicago/Turabian StyleMoretti, Matteo, Francesca Freni, Beatrice Valentini, Claudia Vignali, Angelo Groppi, Silvia Damiana Visonà, Antonio Marco Maria Osculati, and Luca Morini. 2019. "Determination of Antidepressants and Antipsychotics in Dried Blood Spots (DBSs) Collected from Post-Mortem Samples and Evaluation of the Stability over a Three-Month Period" Molecules 24, no. 20: 3636. https://doi.org/10.3390/molecules24203636
APA StyleMoretti, M., Freni, F., Valentini, B., Vignali, C., Groppi, A., Visonà, S. D., Osculati, A. M. M., & Morini, L. (2019). Determination of Antidepressants and Antipsychotics in Dried Blood Spots (DBSs) Collected from Post-Mortem Samples and Evaluation of the Stability over a Three-Month Period. Molecules, 24(20), 3636. https://doi.org/10.3390/molecules24203636