Article

Simultaneous Optimization of Ultrasound-Assisted Extraction for Flavonoids and Antioxidant Activity of Angelica keiskei Using Response Surface Methodology (RSM)

1
College of Life Sciences, Institute of Advanced Cross-Field Science, Institute of Angelica keiskei Health Industry Technology, Qingdao University, Qingdao 266071, China
2
College of Chemistry and Chemical Engineering, Qingdao University, Qingdao 266071, China
3
Qingdao Balanson Biotech Co., Ltd., Qingdao 266071, China
*
Authors to whom correspondence should be addressed.
Molecules 2019, 24(19), 3461; https://doi.org/10.3390/molecules24193461
Submission received: 13 August 2019 / Revised: 6 September 2019 / Accepted: 18 September 2019 / Published: 24 September 2019
(This article belongs to the Special Issue Green Extraction of Natural Products)

Abstract

:
Angelica keiskei Koidzumi (A. keiskei), as a Japanese edible herbal plant, enjoys a variety of biological activities due to the presence of numerous active compounds, especially flavonoids. This study aims for the optimization of ultrasound-assisted extraction (UAE) for flavonoids in A. keiskei and their antioxidant activity by using the response surface methodology (RSM). Single-factor experiments and a four-factor three-level Box–Behnken design (BBD) were performed to explore the effects of the following parameters on flavonoid extraction and antioxidant activity evaluation: ultrasonic temperature (X1), ultrasonic time (X2), ethanol concentration (X3) and liquid–solid ratio (X4). The optimum conditions of the combination of total flavonoid content (TFC), 2,2-diphenyl-1-picrylhydrazyl (DPPH) radical scavenging capacity (DPPH-RSC) and ferric-reducing antioxidant power (FRAP) were as follows: X1 = 80 °C, X2 = 4 min, X3 = 78%, X4 = 35 mL/g, respectively. The experimental results provide a theoretical basis for the extensive utilization of A. keiskei and flavonoids extraction from A. keiskei as a potential source of antioxidants.

Graphical Abstract

1. Introduction

Angelica keiskei Koidzumi (A. keiskei), a clumping perennial herb member of the Umbelliferae family, has been described as “Ashitaba” or “Japanese angelica” in Japan [1,2], “Shin-sun cho” or “Myeong-ilyeob” in Korea [3] and “Ming-ri-ye” in China [4]. As a native plant to the island of Hachijojima, the herb is mainly located in the Izu Islands of Japan [5,6], but it has also been cultivated in other Asian countries, including China and South Korea [7]. Particularly, since a successful introduction of A. keiskei into China in the 1990s, it has been widely planted in Shandong, Jiangsu, Yunnan, Guizhou and Guangxi provinces to date [8]. The aerial parts of A. keiskei has been initially used as ordinary food, especially as vegetables and pickles [9]. Recently, it has gained popularity as a functional or nutritional component used in beverages, daily chemicals and healthcare products, such as tea bags [10], cosmetics [11], capsules of dietary supplements [12], etc. Moreover, it has been reported to possess properties of anti-oxidative [13], anti-bacterial [14], anti-virus [15], anti-osteoporosis [16], anti-tumor [17], anti-hyperlipidemic [18], ameliorate inflammation [19] and prevention of metabolic syndrome [20]. Noticeably, these biological activities are documented and attributed to the presence of varieties of bioactive constituents in A. keiskei, such as flavonoids, coumarins, terpenoids, acetylenes, phenolics and other compounds [21].
Flavonoids are universally acknowledged to be a large category of secondary metabolites and widespread in plants, which are divided into eight different categories and contain more than ten thousand kinds of structures [22,23]. So far, scientists have extracted, isolated and identified 56 flavonoids, including 42 chalcones, 8 flavones and 6 flavanones from A. keiskei [21]. In recent years, owing to their promising pharmacological properties including coronary heart disease prevention, free radical elimination, cancer prevention and so on, these active compounds have captured great attention among researchers [24]. Oxidants and free radicals are usually generated by two pathways: one is the metabolism of normal cells and the other is the external environment, particularly electromagnetic radiation, air pollution, cigarette smoke and drugs. When the amount of free radicals produced is unbalanced with the amount of free radicals consumed, the accumulation of free radicals in the body can lead to oxidative stress [25]. Moreover, severe oxidative stress can give rise to cardiovascular, neurological and pulmonary diseases, or even cancer. Flavonoids, as a kind of antioxidant, can scavenge excess to free radicals in vivo to avoid oxidative stress and reduce the risk of related diseases [26]. Notably, few reported studies have been focused on the optimization for the flavonoids extraction and their antioxidant activity of A. keiskei by using the response surface methodology (RSM).
In general, the solvent extraction process is of great importance to conduct qualitative and quantitative analysis of active ingredients from plants or herbs. However, the composition of the extraction products and the extraction rate of the target products are affected by many factors, particularly extraction factors including method, solvent, time, temperature and liquid–solid ratio [27]. Usually, the traditional liquid–solid extraction methods such as percolation, impregnation, decoction, reflux and Soxhlet extraction consume large amounts of solvents and energy. Ultrasound-assisted extraction (UAE) can utilize the mechanical, cavitation and thermal effects of ultrasonic waves to overcome the weaknesses of traditional extraction and effectively improve the extraction efficiency of flavonoids [28]. Moreover, ethanol–water system has been chosen as an extraction solvent due to its eco-friendly characteristics [29].
RSM, proposed by Box and Wilson in 1951, is an optimization method for comprehensive experimental design and mathematical modeling [30], which has been widely applied in the extraction of flavonoids from plants or herbs due to its advantages of fewer trials, higher precision and better predictive performance [31,32]. To the best of our knowledge, this study is the first attempt to simultaneously optimize UAE conditions for total flavonoid content (TFC) and their antioxidant activities (2,2-diphenyl-1-picrylhydrazyl radical scavenging capacity (DPPH-RSC) and ferric-reducing antioxidant power (FRAP)) in A. keiskei extracts by Box–Behnken design (BBD). Furthermore, ultrasonic temperature (X1), ultrasonic time (X2), ethanol concentration (X3) and liquid–solid ratio (X4) were selected as independent variables in order to optimize extraction process for flavonoids and antioxidant activity of A. keiskei employing RSM with four-factor three-level BBD.

2. Results and Discussion

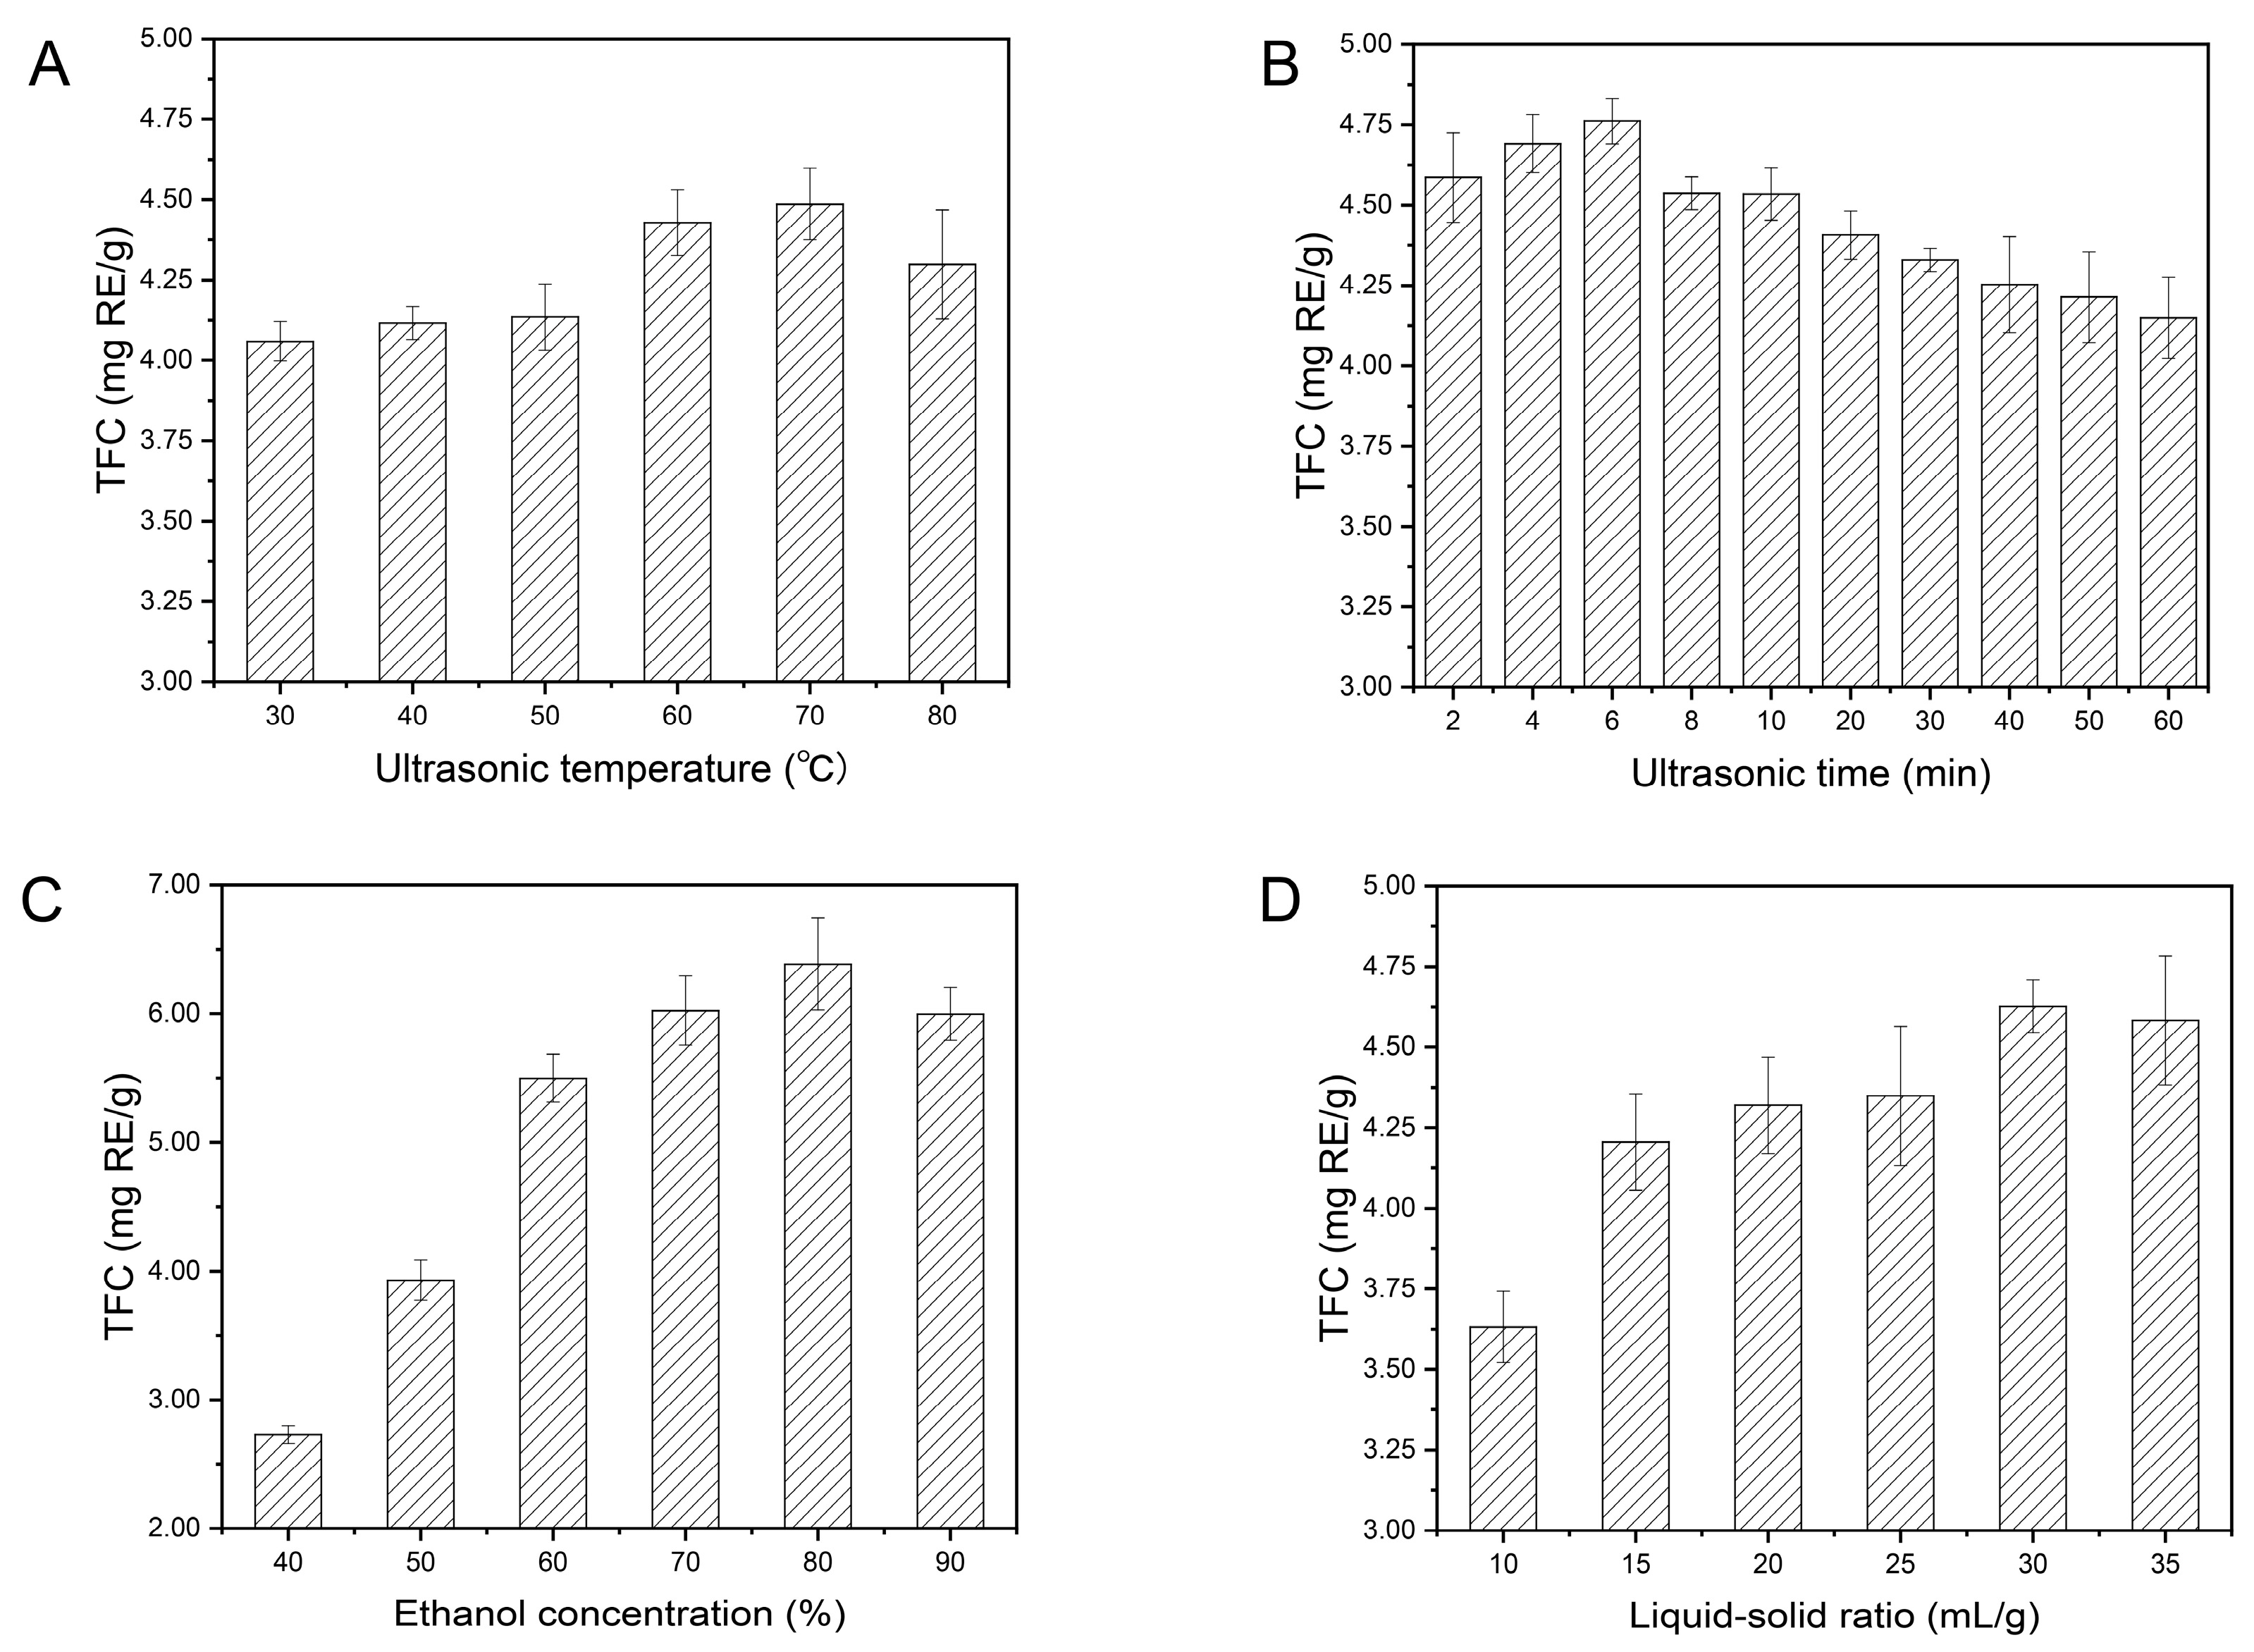
2.1. Optimization of Single-Factor Experimental Extraction Conditions

2.1.1. Effects of Ultrasonic Temperature on TFC

It is generally accepted that the speed of molecular motion, diffusion speed, penetration and dissolution rise rapidly when ultrasonic temperature increases, which contributes to the improvement of TFC. In order to explore the effects of ultrasonic temperature on TFC, different temperatures (30 °C, 40 °C, 50 °C, 60 °C, 70 °C and 80 °C) were selected and three other factors were fixed as follows: ultrasonic time 30 min, ethanol concentration 50% (v/v), and liquid–solid ratio 25 mL/g. As shown in Table S1 and Figure 1A, ultrasonic temperature implied a remarkably significant effect on TFC and TFC went up slowly as the ultrasonic temperature increased continuously from 30 °C to 70 °C. However, TFC began to decrease when the temperature exceeded 70 °C. Similar phenomena were found for the extraction of flavonoid compounds from Sophora flavescens [33], Fagopyrum tataricum [34] and Morus alba L. Leaves [35]. Thus, it can be inferred that relative high temperatures are favorable for the denaturation of the flavonoid compounds [36,37]. Therefore, the range of ultrasonic temperature from 60 °C to 80 °C was selected for further BBD experiments.

2.1.2. Effects of Ultrasonic Time on TFC

Ultrasonic time is another important element that can remarkably influence TFC. The effects of ultrasonic time (0 min to 60 min) on TFC were tested, with other conditions set as follows: ultrasonic temperature 60 °C, ethanol concentration 50% (v/v), and liquid–solid ratio 25 mL/g. It can be seen in Table S2 and Figure 1B that ultrasonic time showed a remarkably significant impact on TFC. When the independent variable (ultrasonic time) was changed from 2 min to 60 min, the dependent variable (TFC) reached a maximum within a short period of time (6 min), and then decreased when prolonged. The results can be mainly attributed to the following reasons: the flavonoid compounds were rapidly released in a shorter period of time from A. keiskei and quickly accumulated in the extraction solution. In addition, the flavonoid compounds seemed to be decomposed and emulsified; however, the flavonoids production was less than the flavonoids consumption [38,39]. Thus, it can be deductive that short-time sonication is more suitable for the extraction of flavonoids in A. keiskei. Therefore, an ultrasonic time within 4–8 min was selected for subsequent BBD experiments.

2.1.3. Effects of Ethanol Concentration on TFC

In this study, different concentrations of ethanol solutions (40%, 50%, 60%, 70%, 80% and 90% (v/v)) were prepared to evaluate the effects of different ethanol concentrations on TFC, with other extraction conditions as follows: ultrasonic temperature 60 °C, ultrasonic time 30 min, and liquid–solid ratio 25 mL/g. As shown in Table S3 and Figure 1C, ethanol concentration implied a remarkably significant effect on TFC. The TFC remarkably increased with the ethanol concentration ranging from 40% to 80%, while it dropped at 90%, indicating that different ethanol–water systems possess different extraction capabilities which may be due to the variant structures of compounds and polarity of the solvent. Specifically, the maximum value of TFC was detected by extracting flavonoids with 80% ethanol, which demonstrates that the forms of flavonoids in A. keiskei were highly soluble in 80% ethanol solution [40,41]. Thus, the medium-high concentration of ethanol solution can be conducive to extract flavonoid compounds. Therefore, 70–90% ethanol solution was selected for further BBD experiments.

2.1.4. Effects of Liquid–Solid Ratio on TFC

The liquid–solid ratio is related to the liquid–solid contact area, which can affect the extraction of flavonoids. In this study, liquid–solid ratios ranging from 10 mL/g to 35 mL/g were adopted to determine the effects of liquid–solid ratio on TFC, while other three parameters remained changeless with ultrasonic temperature at 60 °C, ultrasonic time of 30 min, ethanol concentration of 50% (v/v). As illustrated in Table S4 and Figure 1D, liquid–solid ratio exhibited a remarkably significant on TFC and TFC increased when the liquid–solid ratio changed from 10 mL/g to 30 mL/g. Moreover, a slowly declined trend appeared when the liquid–solid ratio exceeded 30 mL/g. These results demonstrated that freeze-drying powders of A. keiskei (FPAK) were fully dispersed in the ethanol solution at a high liquid–solid ratio, so that a larger contact area was obtained to enhance mass transfer. However, as the volume of ethanol increased continuously, the contact area reached saturation [42,43]. Therefore, a liquid–solid ratio range of 25–35 mL/g was chosen for further BBD experiments.

2.2. Model Fitting

The three-level four-factor BBD was carried out to optimize the UAE of flavonoids and antioxidant activity using RSM. Total flavonoid content (YTFC), DPPH radical scavenging capacity (YDPPH) and ferric-reducing antioxidant power (YFRAP) acquired from 29 groups of experiments are listed in Table 1. According to previous experimental results, three second-order polynomial regression mathematical models and their mathematical expressions were automatically generated by Design-Expert software. The response variable and three fitted coding equation of the model are shown in Table 1.
The significance of the constant terms, the linear terms, the interaction terms, the square terms and the models were determined by analysis of variance (ANOVA) and the results are illustrated in Table 2. The results reveal that the three models were remarkably significant (p < 0.001) for TFC, DPPH-RSC and FRAP. Moreover, these two values of adjusted R² and predicted R² were very close to 1 and the value of “adjusted R²-predicted R²” was low (adjusted R²-predicted R² < 2), suggesting the regression model can fully explain the process [44,45]. In addition, “adequate precision”, as the signal-to-noise ratio, was greater than four which was desirable [46]. Furthermore, the value of the coefficient of variation for the proposed model was less than 10%, indicating the precision and reliability of the experimental run [47,48]. To conclude, it can be seen from Table 2 that the three fitted model equations conformed to the above principles and showed good adaptability.
In addition, a host of 3D response surface plots were generated by fixing two factors at zero level, while changing the other two factors within the scope of the exploration. These 3D graphs explored the interactive effects of the factors on TFC, DPPH-RSC and FRAP, as shown in Figure 2.

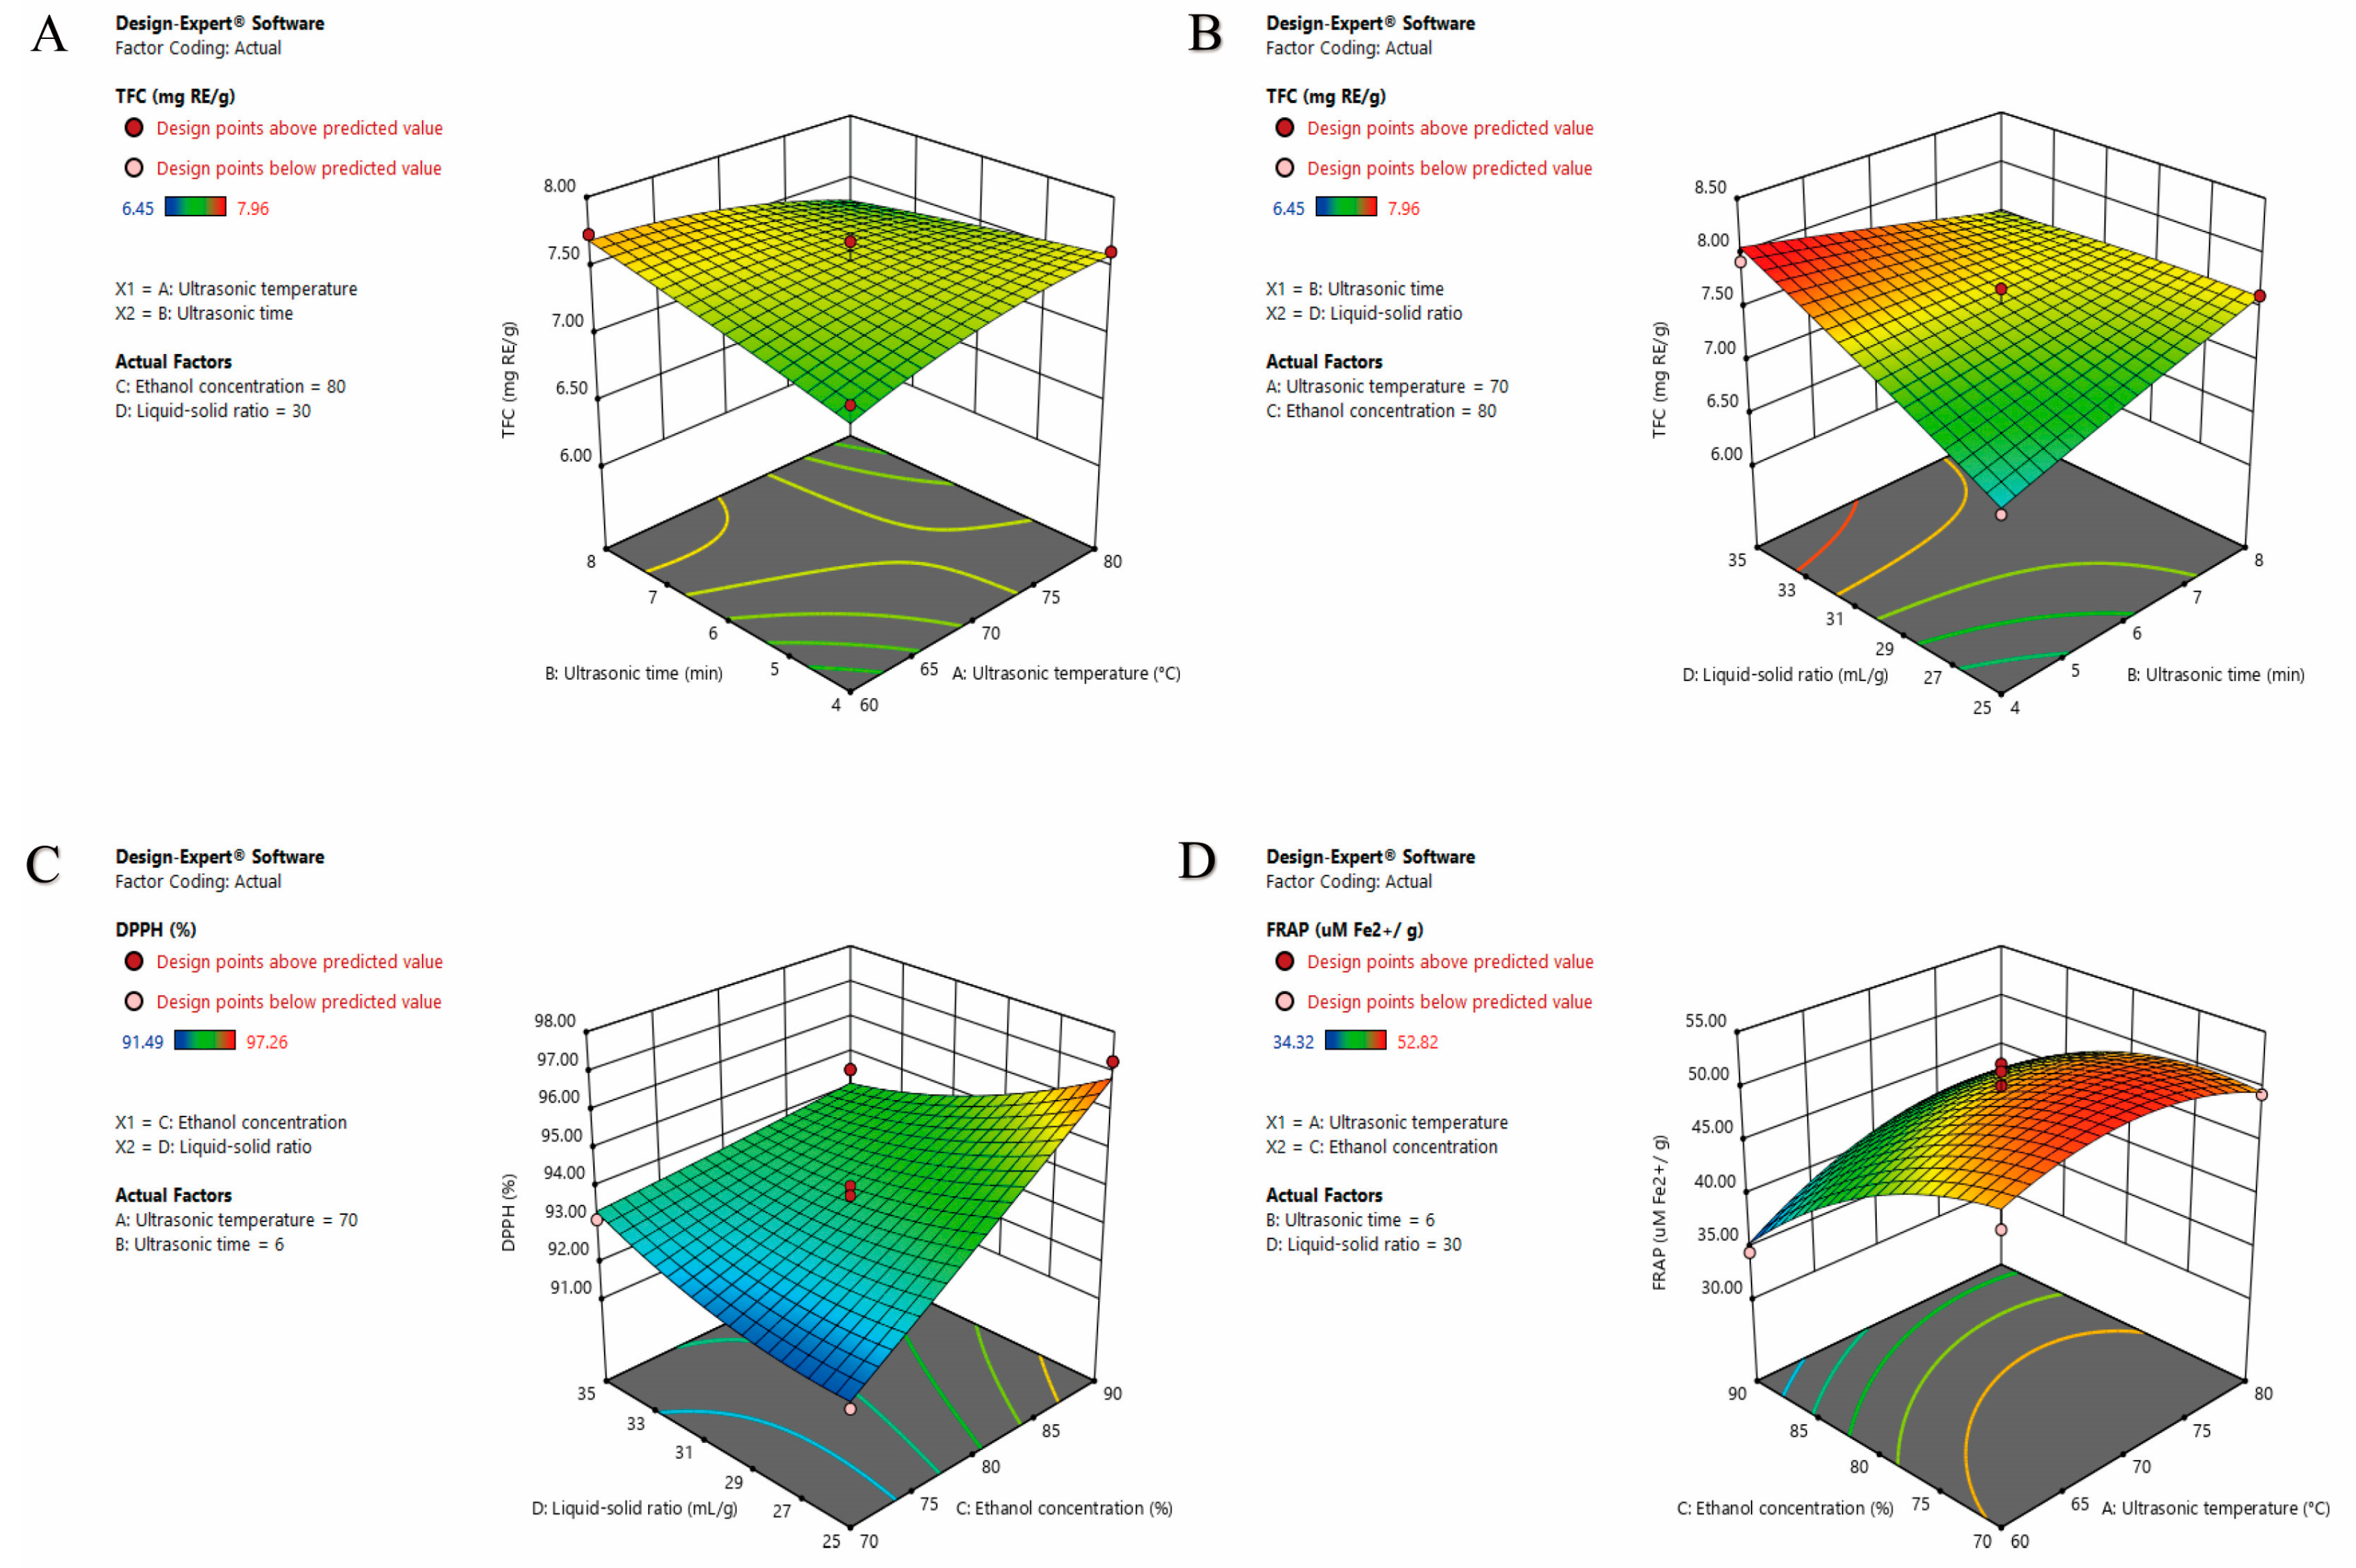
2.3. Effects of the Variables on TFC

The ANOVA results of TFC illustrated that the fitted YTFC model with a high F-value (16.16) and small p-value (<0.0001) was remarkably significant, as shown in Table S5 and Table 2. In addition, these results also indicated that X3, X4, X1X2, X2X4 and X32 (p-value < 0.05) can significantly affect TFC while other model terms (p-value > 0.1) cannot. Note that the lack of fit (F-value = 1.18, p-value = 0.4747) was not remarkable compared with the pure error [49]. In other words, the non-significant lack of fit showed the YTFC model was in good agreement with the real data. In summary, this model was suitable and can be used to analyze and predict TFC in the extracts.
More specifically, the linear effect of the liquid–solid ratio (X4) implied a remarkably significant (p < 0.001) positive effect on TFC, while ethanol concentration (X3) and its square term (X32) exhibited a negative one, as shown in Table S5 and Table 2. The TFC was mainly related to X32, followed by X2X4, X4, X3 and X1X2.
It can be seen from Table S5 and Table 2 that the interaction of the ultrasonic temperature and ultrasonic time (X1X2) showed a significant (p < 0.05) negative effect on TFC. The TFC gradually increased at a lower ultrasonic temperature and shorter ultrasonic time. However, as displayed in Figure 2A, TFC declined with increasing ultrasonic temperature over a longer ultrasonic time. This may be caused by the acceleration of molecular movement with increasing ultrasonic temperature. Moreover, flavonoids are sensitive to temperature and decompose at a high temperature [50,51].
It can be observed from Table S5 and Table 2 that the interaction between ultrasonic time and liquid–solid ratio (X2X4) showed a remarkably significant (p < 0.001) negative effect on TFC. The TFC dramatically elevated with increasing liquid–solid ratio over a shorter ultrasonic time. In addition, as noted in Figure 2B, TFC showed a slowly declined trend with increasing liquid–solid ratio over a longer ultrasonic time, which can be attributed to the mechanical, cavitation and thermal effects of ultrasonic waves. Furthermore, ultrasonic waves can break the cell walls in order to accelerate the penetration of the extraction solution. However, prolonging the ultrasound time can destroy the flavonoids by the powerful energy of the ultrasonic waves [52,53].

2.4. Effects of the Variables on Antioxidant Activity

2.4.1. Effects of the Variables on DPPH-RSC

As shown in Table S6 and Table 2, it can be clearly seen that the fitted YDPPH model showed characteristics with a high F-value (F-value = 16.16) and low p-value (p-value < 0.01), indicating that the model was remarkably significant and can be used for subsequent optimization designs. What is more, Table S6 and Table 2 suggest that X1, X2, X3, X4, X1X2, X1X3, X1X4, X2X4, X3X4 and X4² (p-value < 0.05) can significantly affect DPPH-RSC while other terms (p-value > 0.05) cannot. In addition, the lack of fit (F-value = 1.97, p-value = 0.2628) was non-significant, suggesting that the YDPPH model agreed well with previous experiment results. Therefore, the model is favorable to be used to analyze and predict the DPPH-RSC of extracts.
In detail, the linear effects of ultrasonic temperature (X1) and liquid–solid ratio (X4) showed significant (p< 0.05) negative effects on DPPH-RSC, while the linear term (ultrasonic time, X2) exhibited a positive one on DPPH-RSC. Moreover, the ethanol concentration (X3) and square term (X42) showed remarkably significant (p < 0.001) and significant (p < 0.05) positive effects on DPPH-RSC, respectively. Furthermore, the interaction of the ultrasonic temperature and ethanol concentration (X1X3), ultrasonic temperature and liquid–solid ratio (X1X4) illustrated significant (p < 0.05) positive effects on DPPH-RSC, while the cross product (X2X4, ultrasonic time and liquid–solid ratio; X1X2, ultrasonic temperature and ultrasonic time) showed significant (p < 0.05) and remarkably significant (p < 0.001) negative effects on DPPH-RSC. Therefore, DPPH-RSC mainly depended on X3, followed by X3X4, X1X2, X1X4, X2X4, X1X3, X42, X2, X4 and X1.
The interaction between the ethanol concentration and liquid–solid ratio (X3X4) showed a remarkably significant (p < 0.001) negative effect on DPPH-RSC (Table S6, Table 2). DPPH-RSC dramatically went up with increasing ethanol concentration. Further, at a low ethanol concentration, DPPH-RSC decreased as the liquid–solid ratio declined. However, at a high ethanol concentration, DPPH-RSC slightly increased with a decreasing liquid–solid ratio, as shown in Figure 2C.

2.4.2. Effects of the Variables on FRAP

The ANOVA results of FRAP are shown in Table S7 and Table 2, which illustrated that the fitted YFRAP model with high F-value (16.03) and low p-value (p-value < 0.001) was remarkably significant. Furthermore, these results also implied X1, X2, X3, X4, X1X3, X12, X22, X32 and X4² (p-value < 0.05) exhibited significant effects on FRAP and other model terms (p-value > 0.1) did not. Moreover, the lack of fit (F-value = 1.40, p-value = 0.4000) was non-significant. The results suggest that the model was suitable to be used to analyze and predict the FRAP of the extracts.
Specifically, the linear effect of X1, X2 and X4 illustrated highly significant (p < 0.01) and remarkably significant (p < 0.001) positive effects on FRAP, respectively, while their square terms (X12, X22 and X42) exhibited highly significant (p < 0.01), significant (p < 0.05) and remarkably significant (p < 0.001) negative ones, respectively. In addition, the linear effect of X3 and its square term (X32) exhibited a remarkably significant (p < 0.001) negative effect on FRAP. Furthermore, the cross product of X1X3 showed a significant (p < 0.05) positive effect on FRAP, as shown in Table S7 and Table 2. It can be inferred that FRAP was related to X3, followed by X42, X32, X12, X4, X1X3, X1, X22 and X2 based on these data.
The interaction between the ultrasonic temperature and ethanol concentration (X1X3) illustrated a significant (p < 0.05) positive effect on FRAP, as seen in Table S7 and Table 2. FRAP elevated sharply with the decrease of ethanol concentration. Further, at a low ultrasonic temperature, FRAP increased slightly as the temperature went up. However, as shown in Figure 2D, at a high ultrasonic temperature, FRAP slightly decreased with the increase of ultrasonic temperature.

2.5. Optimization Extraction Conditions and Verification of Predictive Model

The optimal combination of factors and levels was obtained by adopting RSM. Subsequently, the optimum extraction conditions were generated by the Design-Expert software. The extraction conditions for maximum of TFC and antioxidant activity were as follows: ultrasonic temperature 80 °C, ultrasonic time 4 min, ethanol concentration 78%, liquid–solid ratio 35 mL/g. According to the modified optimal process conditions, three repeated verification experiments were carried out. The experimental value of TFC, DPPH-RSC, FRAP and their predicted values are listed in Table 3. The experimental results were quite close to the corresponding predicted values, suggesting that the model parameters obtained by using BBD optimization were accurate and reliable.

3. Materials and Methods

3.1. Plant Materials

Freeze-drying powders of A. keiskei (FPAK) were supplied by Shandong Ashitaba Biotech Co., Ltd (Shandong, China), which were manufactured through a vacuum freeze-drying process (−40 °C) of fresh aerial parts of A. keiskei first and then was ground into powders (around 300 mesh). The powders were packed in a fresh-keeping zip lock bag and stored in a refrigerator at 4 °C before conducting the extraction experiments.

3.2. Chemicals and Reagents

Sodium hydroxide was purchased from Guangfu Technology Development Co., Ltd. (Tianjin, China). Hydrochloric acid was obtained from Sanhe Chemical Reagent Co., Ltd. (Yantai, China). Sodium acetate anhydrous was acquired from Guangcheng Chemical Reagent Co., Ltd. (Tianjin, China). 2,2-Diphenyl-1-picrylhydrazyl (DPPH, 96% purity) and 2,4,6-tris(2-pyridyl)-s-triazine (TPTZ, 99% purity) were supplied by RHAWN Chemical Reagent Co., Ltd. (Shanghai, China). Ethanol and acetic acid were bought from Fuyu Fine Chemical Co., Ltd. (Tianjin, China). Aluminum nitrate nonahydrate and rutin hydrate (analytical reference) were purchased from Macklin Biochemical Co., Ltd. (Shanghai, China). Sodium nitrite, iron (Ⅲ) chloride hexahydrate and iron (Ⅱ) sulfate heptahydrate were supplied by Sinopharm Chemical Reagent Co., Ltd. (Shanghai, China). Distilled water was provided by Chengda Distilled Water Co., Ltd. (Qingdao, China). All other chemicals and reagents used in this study were of analytical reagent grade.

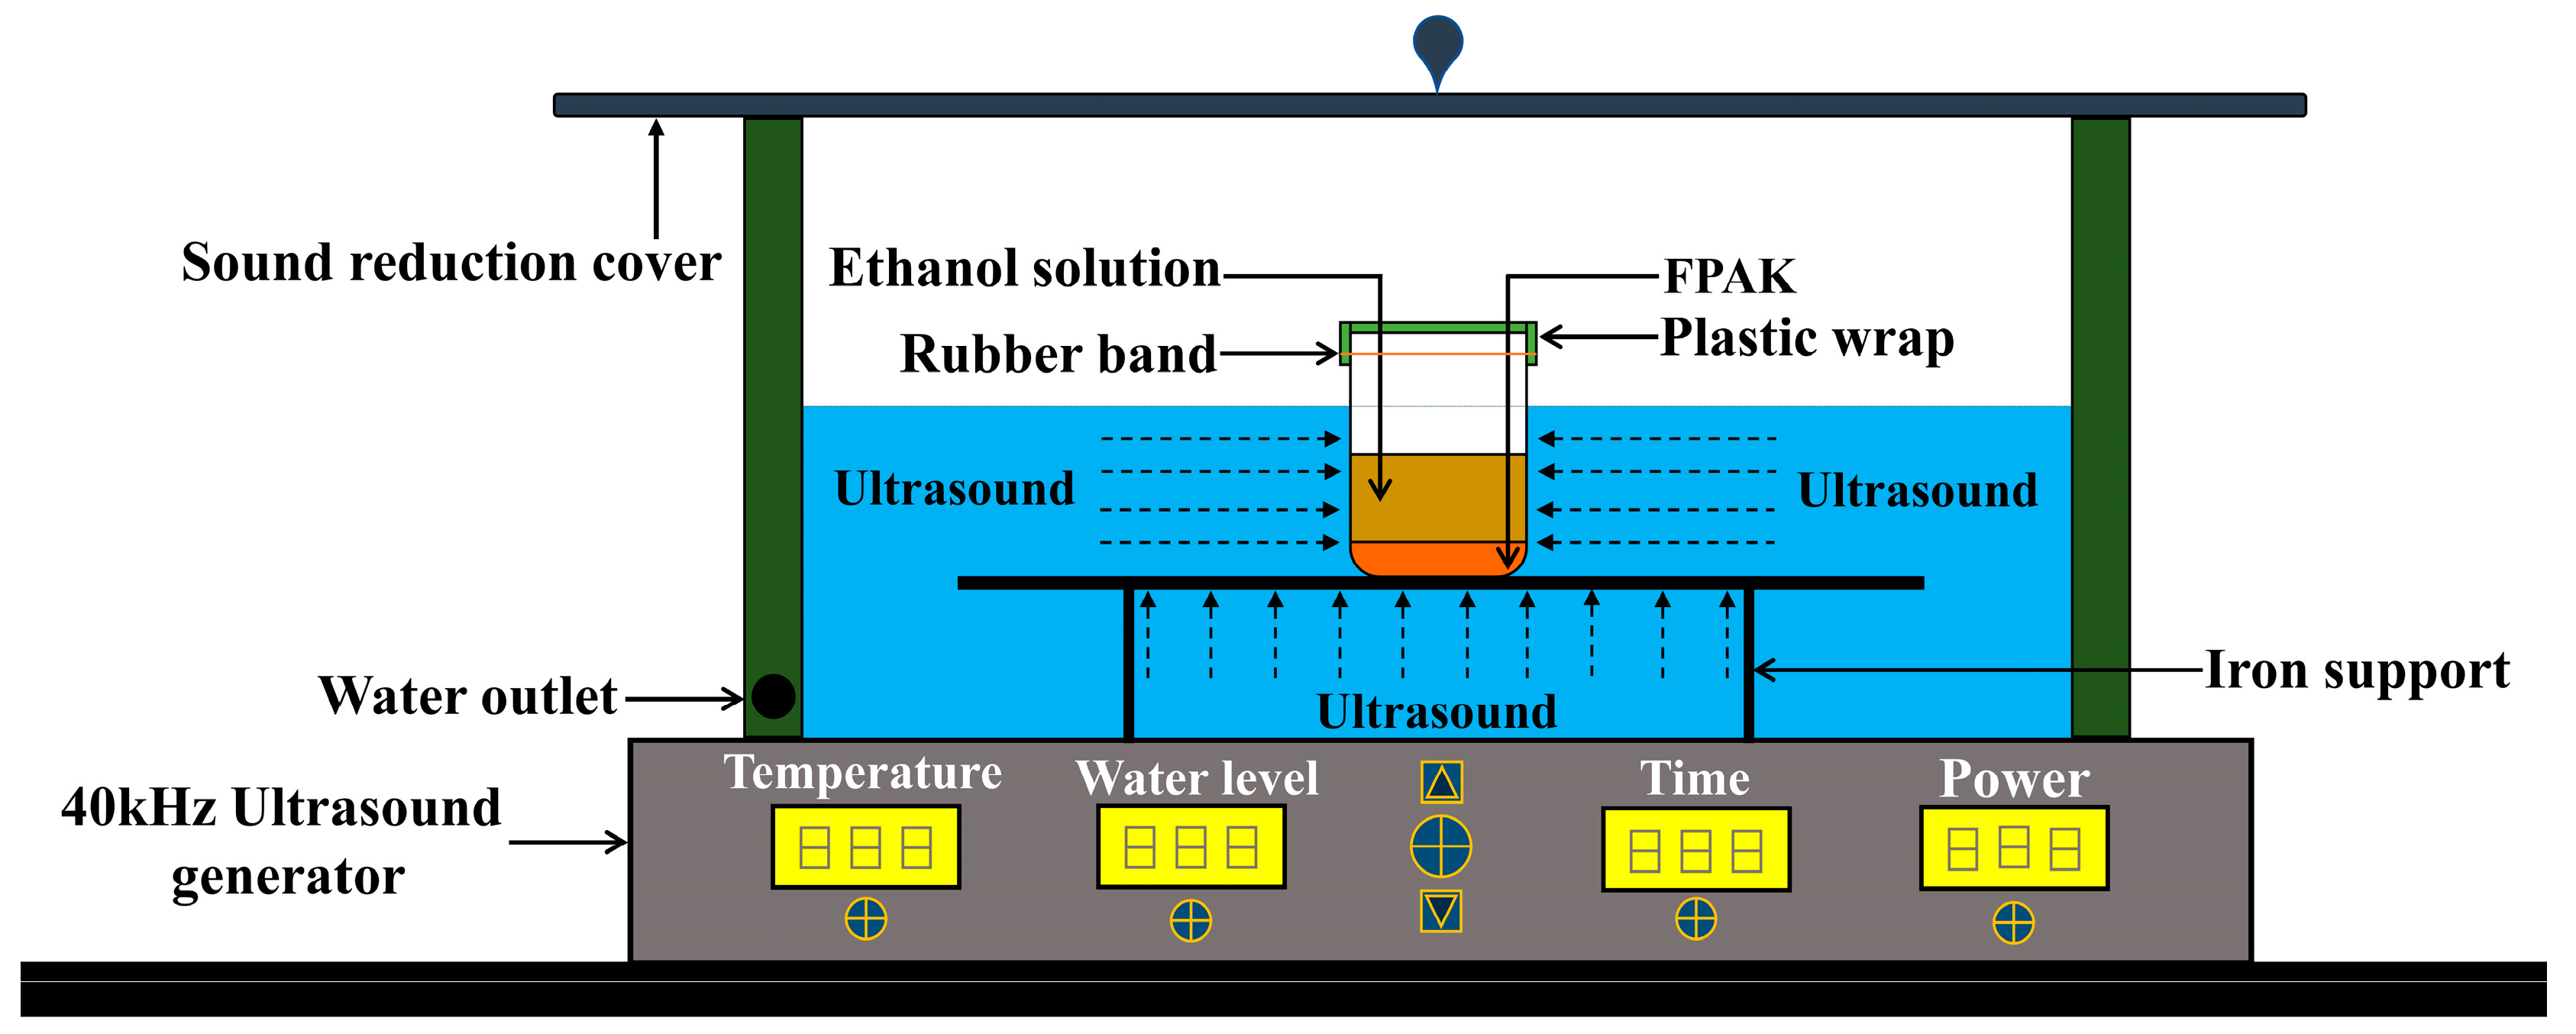
3.3. Equipment for UAE

The scheme of experimental setup for the extraction process is depicted in Figure 3. For the UAE experiments, a digitally-controlled ultrasonic cleaning machine (KQ-300DE, Kunshan Ultrasonic Instrument Co., Ltd., Jiangsu, China) with fixed frequency at 40 kHz was adopted as the ultrasound generator. FPAK were placed in a 100 mL beaker containing ethanol solution, and then the beaker mouth was sealed with polyethylene plastic wrap and a rubber band. Finally, a tiny hole in the plastic wrap was pierced by the disposable medical injection needle to prevent the plastic wrap from exploding due to excessive pressure inside the beaker.

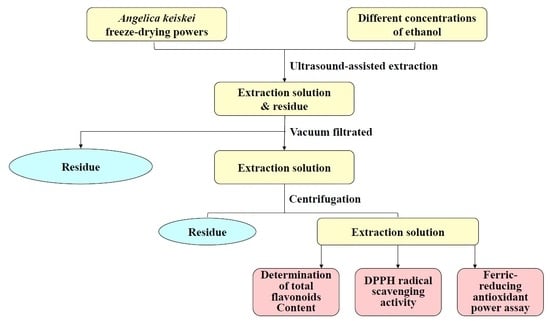
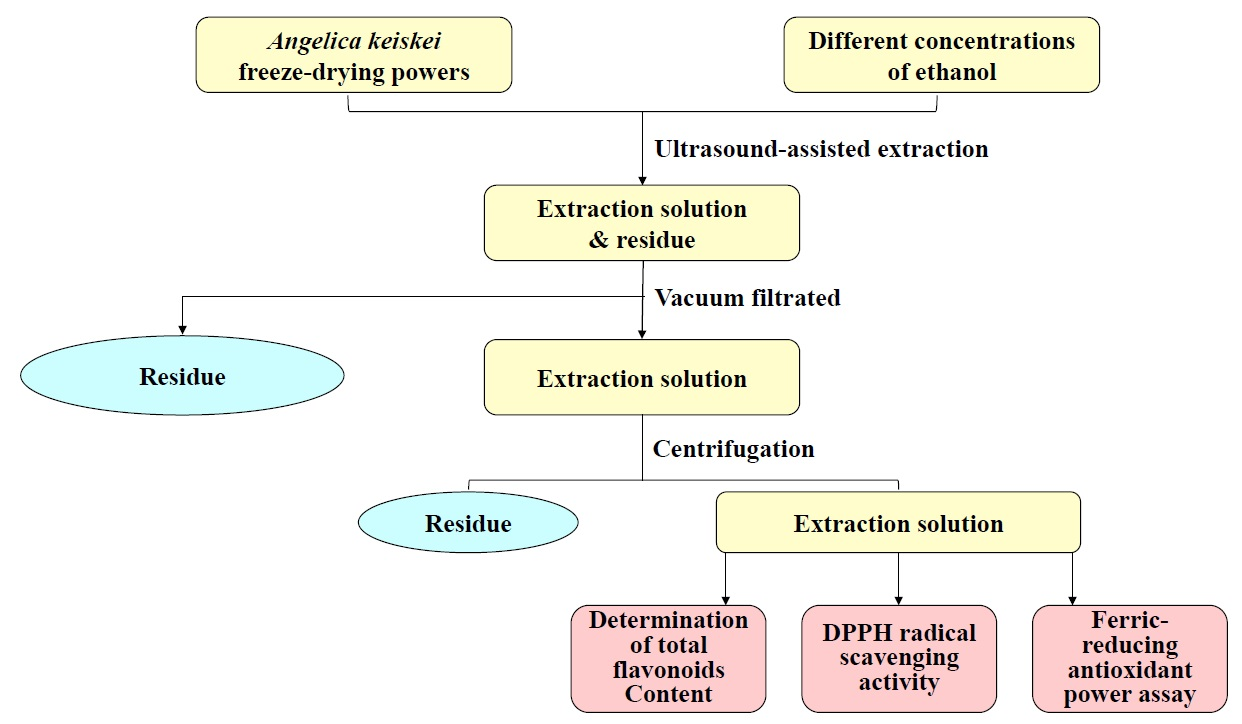
3.4. UAE of Flavonoids from A. keiskei

Firstly, FPAK were placed into a 100 mL beaker, and steeped in ethanol solution at a certain concentration in a given ratio of liquid to solid, then the beaker was placed into the digitally-controlled ultrasonic cleaning machine with a fixed frequency of 40 kHz at a given time and temperature. After the extraction, the flask was removed from the bath. Subsequently, the extracts were finely filtered with filter paper and transferred to a volumetric flask. Then s specific concentration of ethanol solution was cautiously added until a precisely calibrated final volume was reached. The solution was shaken till evenly mixed. Finally, the filtrates were collected in a 100 mL hermetically sealed plastic bottle and kept in a refrigerator at 4 °C until further experimental analysis.

3.5. Single-Factor Experiments

In this part, single-factor experiments were performed to explore the effects of the following parameters on TFC: ultrasonic temperature (30–80 °C), ultrasonic time (0–60 min), ethanol concentration (40–90%) and liquid–solid ratio (10–35 mL/g). According to the single-factor experimental data, the maximum values in these four sets of experiments were the optimal central values for TFC. A series of studies were carried out afterwards to determine the best extraction process of A. keiskei by using the RSM.

3.6. BBD for Extraction Optimization

According to single-factor experiments, a three-level four-factor BBD with RSM was conducted to optimize the UAE of flavonoids and antioxidant activity in FPAK. Ultrasonic temperature (°C, X1), ultrasonic time (min, X2), ethanol concentration (%, X3) and liquid–solid ratio (mL/g, X4) were selected as the main influencing factors. Based on the results of previous single-factor experiments, TFC was regarded as an important indicator for determining the range of each independent variable. Independent variables and their codes and levels used for RSM are shown in Table 4. The BBD contained 29 groups of experiments which are listed in Table 5.
A second-order polynomial regression mathematical model was used to express the value of YTFC, YDPPH and YFRAP. The mathematical model was shown in Equation (1).
Y = β 0 + j = 1 4 β j X j + j = 1 4 β jj X j 2 + i = 1 3 j = i + 1 4 β ij X i X j
where Y is the response variable; β0 is a fixed value that means the intercept of the model; βj, βjj and βij are the linear, quadratic and interactive coefficients, respectively; Xi and Xj represent the coded level of independent variables.

3.7. Determination of Total Flavonoid Content (TFC)

The TFC from A. keiskei in extracts was determined by a NaNO2-Al(NO3)3-NaOH method described in two reports with a few adjustments [54,55]. Briefly, the extracts were firstly centrifuged at 8000 rpm for 10 min, and the upper-layer solution was collected for further detection of TFC. One mL of the solution was transferred into a 10 mL volumetric flask with the addition of 0.4 mL 5% (w/v) NaNO2 solution afterwards. Six minutes later, 0.4 mL of 10% (w/v) Al(NO3)3 was added and the mixture stood for 6 min. Subsequently, 4.0 mL of 5% (w/v) NaOH solution was added into the volumetric flask to form a 10 mL solution with distilled water. Then the solution was mixed thoroughly and incubated for 30 min at room temperature. Finally, the absorbance of the solution was measured immediately against a blank at 510 nm using a UV–Vis spectrophotometer (TU-1901, Persee General Instrument Co., Ltd., Beijing, China). Rutin was used as the standard for a calibration curve and TFC was expressed as rutin equivalent (RE) per gram of FPAK (mg RE/g) and calculated by Equation (2).
TFC = The   flavonoids   content   of   extracts   ( mg   RE ) weight   of   FPAK   ( g )

3.8. Determination of Antioxidant Activities

3.8.1. DPPH Radical Scavenging Capacity (DPPH-RSC) Measurement

DPPH-RSC was measured using a colorimetric method described by Wang et al. with certain modifications [56]. Firstly, the extracts were centrifuged at 8000 rpm for 10 min, and the upper-layer solution was collected for determination of DPPH-RSC. Briefly, 2.5 mL of 0.1 mM DPPH ethanol solution and 2.5 mL of the upper-layer solution were thoroughly mixed. Then the mixture was incubated for 30 min at room temperature in the dark. At last, the absorbance A1 was measured immediately against a blank (absolute ethanol) at 517 nm. For the blank control, 2.5 mL of absolute ethanol and 2.5 mL of extract was mixed. This mixture was kept still in the dark for 30 min, and the absorbance A2 was measured at 517 nm with absolute ethanol as the blank. For negative control, 2.5 mL of 0.1 mM DPPH and 2.5 mL of absolute ethanol was mixed. Then the mixture was placed in the dark for 30 min, and the absorbance A0 was measured at 517 nm with absolute ethanol as a blank. DPPH-RSC was calculated by Equation (3):
DPPH RSC   ( % ) = [ A 0 ( A 1 A 2 ) A 0 ] × 100

3.8.2. Ferric-Reducing Antioxidant Power (FRAP) Assay

FRAP was determined by a colorimetric method described by Impei et al. with some modifications [57]. The extracts were centrifuged at 8000 rpm for 10 min, and the upper-layer solution was collected. A fresh FRAP reagent was prepared by mixing 25 mL of 20 mM FeCl3ꞏ6H2O solution with 25 mL of 10 mM TPTZ solution (40 mM HCl solution as the solvent), and 250 mL of 300 mM acetate buffer containing 5.1 g CH3COONa and 20 mL CH3COOH (pH = 3.6). Briefly, 3.9 mL freshly prepared FRAP reagent and 130 μL upper-layer solution was mixed. Then the reaction mixture was incubated at 37 °C for 15 min in the dark. Lastly, the absorbance of the solution was measured immediately at 593 nm against a reagent blank (3.9 mL of FRAP solution and 130 μL of distilled water). The FRAP was expressed as FeSO4 equivalents per gram of FPAK (μmol Fe2+/g) and calculated as Equation (4) through the calibration curve of FeSO4. In Equation (4), C was the Fe2+ concentration (μmol Fe2+/L) corresponding to the absorbance of the sample solution, V was the total volume of the sample solution (L), and W was the mass of FPAK (g).
FRAP = C   ×   V W

3.9. Statistical Analysis

All extraction experiments, TFC determination experiments and antioxidant activity assays were carried out in triplicates. All results were expressed as average values ± standard deviation (n = 3) and analyzed by OriginPro 2018 (OriginLab Corporation, Northampton, MA, USA), SPSS statistics v25.0 (IBM Corporation, New York, NY, USA) and Design-Expert v11.0 (Stat-Ease Inc., Minneapolis, MN, USA). To determine the individual linear, quadratic and interaction regression coefficients (β), ANOVA was performed. The fitness of the polynomial was estimated by employing the coefficient of determination (R2), and the significance of each coefficient was determined by p-values. Specifically, p-value ≤ 0.001, 0.001 < p-value ≤ 0.01, 0.01< p-value ≤ 0.05 and p-value > 0.05 indicate that the model terms are remarkably significant, highly significant, significant and not significant, respectively [58].

4. Conclusions

In this study, single-factor experiments were carried out to determine the optimal extraction parameters under different conditions. A three-level four-factor BBD was performed to explore the linear, cross and quadratic effects by using RSM of the following parameters on flavonoids and antioxidant activity: ultrasonic temperature (X1), ultrasonic time (X2), ethanol concentration (X3) and liquid–solid ratio (X4). Experimental results indicated that X3 and X4 affected TFC, DPPH-RSC and FRAP. Furthermore, X1 and X2 also had an influence on the DPPH-RSC and FRAP, while X1 and X2 had little correlation with TFC. In addition, X2X4, X32; X1X2, X3X4 and X32, X42 showed a remarkably significant effect on TFC, DPPH-RSC and FRAP, respectively. The optimum conditions of the combination of TFC, DPPH-RSC and FRAP were as follows: X1 = 80 °C, X2 = 4 min, X3 = 78% and X4 = 35 mL/g. Based on three repeated verification experiments, it was found that the experimental results were quite close to the corresponding predicted values. These results can provide a theoretical basis for the comprehensive utilization of A. keiskei and the extraction of its flavonoids as a potential source of antioxidants. In addition, further analyses and comprehensive researches should be warranted for clarifying the main bioactive components and their contents in the extracts of A. keiskei, and the mechanisms of their bioactivities still need to be explored.

Supplementary Materials

The following are available online; Tables S1–S7.

Author Contributions

Conceptualization, Q.L. and Z.L.; data curation, L.Z., X.G. and Z.L.; formal analysis, L.Z., X.G. and Z.L.; investigation, L.Z., Y.J., X.P. and P.H.; methodology, Q.L. and Z.L.; writing—original draft, L.Z.; writing—review and editing, Q.L. and Z.L.

Funding

This work was financially supported by the China Postdoctoral Science Foundation funded project (Grant 2016M602103), Shandong Provincial Natural Science Foundation (ZR2019PH020) and the Innovation-Driven Boost Project of Qingdao Science and Technology Association (Grant C2018ZL).

Acknowledgments

The authors wish to thank to the Shandong Ashitaba Biotech Co., Ltd. for providing freeze-drying powders of A. keiskei.

Conflicts of Interest

The authors declare no conflicts of interest.

References

  1. Zhang, C.; Liu, D.; Gao, H. Kinetics, physicochemical properties, and antioxidant activities of Angelica keiskei processed under four drying conditions. LWT Food Sci. Technol. 2018, 98, 349–357. [Google Scholar] [CrossRef]
  2. Carmona-Gutierrez, D.; Zimmermann, A.; Kainz, K.; Pietrocola, F.; Chen, G.; Maglioni, S.; Schiavi, A.; Nah, J.; Mertel, S.; Beuschel, C.B.; et al. The flavonoid 4,4’-dimethoxychalcone promotes autophagy-dependent longevity across species. Nat. Commun. 2019, 10, 651. [Google Scholar] [CrossRef] [PubMed]
  3. Kil, Y.S.; Choi, S.K.; Lee, Y.S.; Jafari, M.; Seo, E.K. Chalcones from Angelica keiskei: Evaluation of Their Heat Shock Protein Inducing Activities. J. Nat. Prod. 2015, 78, 2481–2487. [Google Scholar] [CrossRef] [PubMed]
  4. Zhang, L.; Li, Z.; Wang, L.; Gao, X.; Li, Q. Research Progress of Anti-tumor Effects of Chalcones from Angelica keiskei. Sci. Technol. Food Ind. 2018, 39, 336–352. [Google Scholar] [CrossRef]
  5. Nakamura, T.; Tokushima, T.; Kawabata, K.; Yamamoto, N.; Miyamoto, M.; Ashida, H. Absorption and metabolism of 4-hydroxyderricin and xanthoangelol after oral administration of Angelica keiskei (Ashitaba) extract in mice. Arch. Biochem. Biophys. 2012, 521, 71–76. [Google Scholar] [CrossRef] [PubMed]
  6. Li, J.L.; Gao, L.X.; Meng, F.W.; Tang, C.L.; Zhang, R.J.; Li, J.Y.; Luo, C.; Li, J.; Zhao, W.M. PTP1B inhibitors from stems of Angelica keiskei (Ashitaba). Bioorg. Med. Chem. Lett. 2015, 25, 2028–2032. [Google Scholar] [CrossRef]
  7. Zhang, W.; Jin, Q.; Luo, J.; Wu, J.; Wang, Z. Phytonutrient and anti-diabetic functional properties of flavonoid-rich ethanol extract from Angelica keiskei leaves. J. Food Sci. Technol. 2018, 55, 4406–4412. [Google Scholar] [CrossRef]
  8. Xie, F.; Wang, Y.; Zhou, Y.; Wu, J.; Wang, Z. Effect of lactic acid bacteria on microbial safety of angelica keiskei juice. J. Food Saf. 2017, 37, e12325. [Google Scholar] [CrossRef]
  9. Sarker, S.D.; Nahar, L. Natural medicine: The genus Angelica. Curr. Med. Chem. 2004, 11, 1479–1500. [Google Scholar] [CrossRef]
  10. Zhang, T.; Yamashita, Y.; Yasuda, M.; Yamamoto, N.; Ashida, H. Ashitaba (Angelica keiskei) extract prevents adiposity in high-fat diet-fed C57BL/6 mice. Food Funct. 2015, 6, 135–145. [Google Scholar] [CrossRef]
  11. Nikitakis, J.; Lange, B. International Cosmetic Ingredient Dictionary and Handbook, 6th ed.; Personal Care Products Council: Washington, DC, USA, 2016. [Google Scholar]
  12. Chen, C.Y. Trace elements in Taiwanese health food, Angelica keiskei, and other products. Food Chem. 2004, 84, 545–549. [Google Scholar] [CrossRef]
  13. Cao, X.; Zhang, M.; Mujumdar, A.S.; Wang, Z. Effect of microwave freeze-drying on microbial inactivation, antioxidant substance and flavor quality of Ashitaba leaves (Angelica keiskei Koidzumi). Dry. Technol. 2019, 37, 793–800. [Google Scholar] [CrossRef]
  14. Sugamoto, K.; Matsusita, Y.I.; Matsui, K.; Kurogi, C.; Matsui, T. Synthesis and antibacterial activity of chalcones bearing prenyl or geranyl groups from Angelica keiskei. Tetrahedron 2011, 67, 5346–5359. [Google Scholar] [CrossRef]
  15. Park, J.Y.; Jeong, H.J.; Kim, Y.M.; Park, S.J.; Rho, M.C.; Park, K.H.; Ryu, Y.B.; Lee, W.S. Characteristic of alkylated chalcones from Angelica keiskei on influenza virus neuraminidase inhibition. Bioorg. Med. Chem. Lett. 2011, 21, 5602–5604. [Google Scholar] [CrossRef] [PubMed]
  16. Hagiwara, H.; Nakata, K.; Miyazaki, H.; Maehashi, S.; Komiyama, Y.; Aida, R.; Yoshida, S.; Kokubu, D.; Hagiwara, K.; Yoshida, K. 4-Hydroxyderricin inhibits osteoclast formation and accelerates osteoblast differentiation. Cytotechnology 2019, 71, 15–22. [Google Scholar] [CrossRef] [PubMed]
  17. Li, Z.; Zhang, L.; Gao, M.; Han, M.; Liu, K.; Zhang, Z.; Gong, Z.; Xing, L.; Shi, X.; Lu, K.; et al. Endoplasmic reticulum stress triggers Xanthoangelol-induced protective autophagy via activation of JNK/c-Jun Axis in hepatocellular carcinoma. J. Exp. Clin. Cancer Res. 2019, 38, 8. [Google Scholar] [CrossRef]
  18. Ogawa, H.; Ohno, M.; Baba, K. Hypotensive and lipid regulatory actions of 4-hydroxyderricin, a chalcone from Angelica keiskei, in stroke-prone spontaneously hypertensive rats. Clin. Exp. Pharmacol. Physiol. 2005, 32, 19–23. [Google Scholar] [CrossRef]
  19. Yasuda, M.; Kawabata, K.; Miyashita, M.; Okumura, M.; Yamamoto, N.; Takahashi, M.; Ashida, H.; Ohigashi, H. Inhibitory effects of 4-hydroxyderricin and xanthoangelol on lipopolysaccharide-induced inflammatory responses in RAW264 macrophages. J. Agric. Food Chem. 2014, 62, 462–467. [Google Scholar] [CrossRef]
  20. Ohnogi, H.; Kudo, Y.; Tahara, K.; Sugiyama, K.; Enoki, T.; Hayami, S.; Sagawa, H.; Tanimura, Y.; Aoi, W.; Naito, Y.; et al. Six new chalcones from Angelica keiskei inducing adiponectin production in 3T3-L1 adipocytes. Biosci. Biotechnol. Biochem. 2012, 76, 961–966. [Google Scholar] [CrossRef]
  21. Kil, Y.S.; Pham, S.T.; Seo, E.K.; Jafari, M. Angelica keiskei, an emerging medicinal herb with various bioactive constituents and biological activities. Arch. Pharmacal Res. 2017, 40, 655–675. [Google Scholar] [CrossRef]
  22. Borges Bubols, G.; da Rocha Vianna, D.; Medina-Remon, A.; von Poser, G.; Maria Lamuela-Raventos, R.; Lucia Eifler-Lima, V.; Cristina Garcia, S. The Antioxidant Activity of Coumarins and Flavonoids. Mini Rev. Med. Chem. 2013, 13, 318–334. [Google Scholar] [CrossRef]
  23. Agati, G.; Azzarello, E.; Pollastri, S.; Tattini, M. Flavonoids as antioxidants in plants: Location and functional significance. Plant Sci. 2012, 196, 67–76. [Google Scholar] [CrossRef] [PubMed]
  24. Yao, L.H.; Jiang, Y.; Shi, J.; Tomas-Barberan, F.; Datta, N.; Singanusong, R.; Chen, S. Flavonoids in food and their health benefits. Plant Foods Hum. Nutr. 2004, 59, 113–122. [Google Scholar] [CrossRef] [PubMed]
  25. Halliwell, B. Free radicals, antioxidants, and human disease: Curiosity, cause, or consequence? Lancet 1994, 344, 721–724. [Google Scholar] [CrossRef]
  26. Pham-Huy, L.A.; He, H.; Pham-Huy, C. Free radicals, antioxidants in disease and health. Int. J. Biomed. Sci. 2008, 4, 89–96. [Google Scholar] [PubMed]
  27. Oludemi, T.; Barros, L.; Prieto, M.A.; Heleno, S.A.; Barreiro, M.F.; Ferreira, I. Extraction of triterpenoids and phenolic compounds from Ganoderma lucidum: Optimization study using the response surface methodology. Food Funct. 2018, 9, 209–226. [Google Scholar] [CrossRef]
  28. Cai, X.; Zhang, R.; Guo, Y.; He, J.; Li, S.; Zhu, Z.; Liu, G.; Liu, Z.; Yang, J. Optimization of ultrasound-assisted extraction of gardenia fruit oil with bioactive components and their identification and quantification by HPLC-DAD/ESI-MS2. Food Funct. 2015, 6, 2194–2204. [Google Scholar] [CrossRef]
  29. Farrell, A.E.; Plevin, R.J.; Turner, B.T.; Jones, A.D.; Michael, O.H.; Kammen, D.M. Ethanol can contribute to energy and environmental goals. Science 2006, 311, 506–508. [Google Scholar] [CrossRef]
  30. Box, G.E.P.; Wilson, K.B. On the Experimental Attainment of Optimum Conditions. J. R. Stat. Soc. Ser. B (Methodol.) 1951, 13, 1–45. [Google Scholar] [CrossRef]
  31. Briones-Labarca, V.; Giovagnoli-Vicuna, C.; Canas-Sarazua, R. Optimization of extraction yield, flavonoids and lycopene from tomato pulp by high hydrostatic pressure-assisted extraction. Food Chem. 2019, 278, 751–759. [Google Scholar] [CrossRef]
  32. Agarwal, C.; Mathe, K.; Hofmann, T.; Csoka, L. Ultrasound-Assisted Extraction of Cannabinoids from Cannabis Sativa L. Optimized by Response Surface Methodology. J. Food Sci. Technol. 2018, 83, 700–710. [Google Scholar] [CrossRef] [PubMed]
  33. Zhou, J.; Zhang, L.; Li, Q.; Jin, W.; Chen, W.; Han, J.; Zhang, Y. Simultaneous Optimization for Ultrasound-Assisted Extraction and Antioxidant Activity of Flavonoids from Sophora flavescens Using Response Surface Methodology. Molecules 2018, 24, 112. [Google Scholar] [CrossRef] [PubMed]
  34. Peng, L.X.; Zou, L.; Zhao, J.L.; Xiang, D.B.; Zhu, P.; Zhao, G. Response surface modeling and optimization of ultrasound-assisted extraction of three flavonoids from tartary buckwheat (Fagopyrum tataricum). Pharmacogn. Mag. 2013, 9, 210–215. [Google Scholar] [CrossRef] [PubMed]
  35. Cui, H.; Lu, T.; Wang, M.; Zou, X.; Zhang, Y.; Yang, X.; Dong, Y.; Zhou, H. Flavonoids from Morus alba L. Leaves: Optimization of Extraction by Response Surface Methodology and Comprehensive Evaluation of Their Antioxidant, Antimicrobial, and Inhibition of alpha-Amylase Activities through Analytical Hierarchy Process. Molecules 2019, 24, 2398. [Google Scholar] [CrossRef] [PubMed]
  36. Sheng, Z.L.; Wan, P.F.; Dong, C.L.; Li, Y.H. Optimization of total flavonoids content extracted from Flos Populi using response surface methodology. Ind. Crop. Prod. 2013, 43, 778–786. [Google Scholar] [CrossRef]
  37. Wang, Y.; Gao, Y.; Ding, H.; Liu, S.; Han, X.; Gui, J.; Liu, D. Subcritical ethanol extraction of flavonoids from Moringa oleifera leaf and evaluation of antioxidant activity. Food Chem. 2017, 218, 152–158. [Google Scholar] [CrossRef] [PubMed]
  38. Lai, J.; Wang, H.; Wang, D.; Fang, F.; Wang, F.; Wu, T. Ultrasonic extraction of antioxidants from Chinese sumac (Rhus typhina L.) fruit using response surface methodology and their characterization. Molecules 2014, 19, 9019–9032. [Google Scholar] [CrossRef] [PubMed]
  39. Tomaz, I.; Maslov, L.; Stupić, D.; Preiner, D.; Ašperger, D.; Karoglan Kontić, J. Multi-response optimisation of ultrasound-assisted extraction for recovery of flavonoids from red grape skins using response surface methodology. Phytochem. Anal. 2016, 27, 13–22. [Google Scholar] [CrossRef] [PubMed]
  40. Xu, D.P.; Zheng, J.; Zhou, Y.; Li, Y.; Li, S.; Li, H.B. Ultrasound-assisted extraction of natural antioxidants from the flower of Limonium sinuatum: Optimization and comparison with conventional methods. Food Chem. 2017, 217, 552–559. [Google Scholar] [CrossRef] [PubMed]
  41. Tian, J.; Muhammad, S.; Chen, A.; Chen, P.; Wang, J.; Yang, C.; Yuan, H.; Wang, Z. An experimental study exploring the influencing factors for ultrasonic-assisted extraction of flavonoid compounds from leaves of Amorpha fruticosa L. J. For. Res. 2019, 30, 1735–1741. [Google Scholar] [CrossRef]
  42. Zhang, Y.; Prawang, P.; Li, C.; Meng, X.; Zhao, Y.; Wang, H.; Zhang, S. Ultrasonic assisted extraction of artemisinin from Artemisia Annua L. using monoether-based solvents. Green Chem. 2018, 20, 713–723. [Google Scholar] [CrossRef]
  43. Tabaraki, R.; Nateghi, A. Optimization of ultrasonic-assisted extraction of natural antioxidants from rice bran using response surface methodology. Ultrason. Sonochem. 2011, 18, 1279–1286. [Google Scholar] [CrossRef] [PubMed]
  44. Li, F.; Mao, Y.D.; Wang, Y.F.; Raza, A.; Qiu, L.P.; Xu, X.Q. Optimization of Ultrasonic-Assisted Enzymatic Extraction Conditions for Improving Total Phenolic Content, Antioxidant and Antitumor Activities in Vitro from Trapa quadrispinosa Roxb. Residues. Molecules 2017, 22, 396. [Google Scholar] [CrossRef] [PubMed]
  45. Chen, W.; Wang, W.P.; Zhang, H.S.; Huang, Q. Optimization of ultrasonic-assisted extraction of water-soluble polysaccharides from Boletus edulis mycelia using response surface methodology. Carbohydr. Polym. 2012, 87, 614–619. [Google Scholar] [CrossRef]
  46. Erbay, Z.; Icier, F. Optimization of Drying of Olive Leaves in a Pilot-Scale Heat Pump Dryer. Dry. Technol. 2009, 27, 416–427. [Google Scholar] [CrossRef]
  47. Chen, G.; Chen, J.; Srinivasakannan, C.; Peng, J. Application of response surface methodology for optimization of the synthesis of synthetic rutile from titania slag. Appl. Surf. Sci. 2012, 258, 3068–3073. [Google Scholar] [CrossRef]
  48. Eslami, A.; Asadi, A.; Meserghani, M.; Bahrami, H. Optimization of sonochemical degradation of amoxicillin by sulfate radicals in aqueous solution using response surface methodology (RSM). J. Mol. Liq. 2016, 222, 739–744. [Google Scholar] [CrossRef]
  49. Kostić, M.D.; Bazargan, A.; Stamenković, O.S.; Veljković, V.B.; McKay, G. Optimization and kinetics of sunflower oil methanolysis catalyzed by calcium oxide-based catalyst derived from palm kernel shell biochar. Fuel 2016, 163, 304–313. [Google Scholar] [CrossRef]
  50. Wang, B.; Qu, J.; Luo, S.; Feng, S.; Li, T.; Yuan, M.; Huang, Y.; Liao, J.; Yang, R.; Ding, C. Optimization of Ultrasound-Assisted Extraction of Flavonoids from Olive (Olea europaea) Leaves, and Evaluation of Their Antioxidant and Anticancer Activities. Molecules 2018, 23, 2513. [Google Scholar] [CrossRef]
  51. Zhu, C.P.; Zhai, X.C.; Li, L.Q.; Wu, X.X.; Li, B. Response surface optimization of ultrasound-assisted polysaccharides extraction from pomegranate peel. Food Chem. 2015, 177, 139–146. [Google Scholar] [CrossRef]
  52. Lin, T.; Liu, Y.; Lai, C.; Yang, T.; Xie, J.; Zhang, Y. The effect of ultrasound assisted extraction on structural composition, antioxidant activity and immunoregulation of polysaccharides from Ziziphus jujuba Mill var. spinosa seeds. Ind. Crop. Prod. 2018, 125, 150–159. [Google Scholar] [CrossRef]
  53. Shirzad, H.; Niknam, V.; Taheri, M.; Ebrahimzadeh, H. Ultrasound-assisted extraction process of phenolic antioxidants from Olive leaves: A nutraceutical study using RSM and LC-ESI-DAD-MS. J. Food Sci. Technol. 2017, 54, 2361–2371. [Google Scholar] [CrossRef] [PubMed]
  54. Wang, X.; Wu, Q.; Wu, Y.; Chen, G.; Yue, W.; Liang, Q. Response surface optimized ultrasonic-assisted extraction of flavonoids from Sparganii rhizoma and evaluation of their in vitro antioxidant activities. Molecules 2012, 17, 6769–6783. [Google Scholar] [CrossRef] [PubMed]
  55. Zhang, G.; He, L.; Hu, M. Optimized ultrasonic-assisted extraction of flavonoids from Prunella vulgaris L. and evaluation of antioxidant activities in vitro. Innov. Food Sci. Emerg. Technol. 2011, 12, 18–25. [Google Scholar] [CrossRef]
  56. Wang, S.; Dong, X.; Tong, J. Optimization of enzyme-assisted extraction of polysaccharides from alfalfa and its antioxidant activity. Int. J. Biol. Macromol. 2013, 62, 387–396. [Google Scholar] [CrossRef]
  57. Impei, S.; Gismondi, A.; Canuti, L.; Canini, A. Metabolic and biological profile of autochthonous Vitis vinifera L. ecotypes. Food Funct. 2015, 6, 1526–1538. [Google Scholar] [CrossRef]
  58. Chen, S.; Zeng, Z.; Hu, N.; Bai, B.; Wang, H.; Suo, Y. Simultaneous optimization of the ultrasound-assisted extraction for phenolic compounds content and antioxidant activity of Lycium ruthenicum Murr. fruit using response surface methodology. Food Chem. 2018, 242, 1–8. [Google Scholar] [CrossRef]
Sample Availability: Not available.
Figure 1. Effects of ultrasonic temperature (A), ultrasonic time (B), ethanol concentration (C) and liquid–solid ratio (D) on total flavonoid content (TFC). Results were expressed as average values ± standard deviation (n = 3).
Molecules 24 03461 g001
Figure 2. The interaction of extraction variables on TFC (A,B), DPPH-RSC (C) and FRAP (D).
Molecules 24 03461 g002
Figure 3. Diagram of experimental ultrasonic-assisted extraction device.
Molecules 24 03461 g003
Table 1. Response variables and their fitted model equations.
SymbolResponse VariableFitting the Coding Equation of the Model
YTFCTotal flavonoid content
(mg RE/g)
YTFC = 7.5459 + 0.0014X1 + 0.0529X2−0.2517X3 + 0.2763X4 − 0.1827X1X2 − 0.0065X1X3 + 0.0837X1X4 + 0.0992X2X3 − 0.3285X2X4 + 0.0278X3X4 − 0.0796X1² − 0.0099X2² − 0.5671X3² − 0.0266X4²
YDPPHDPPH radical scavenging capacity
(%)
YDPPH = 93.6219 − 0.2886X1 + 0.3209X2 + 1.4200X3 − 0.3100X4 − 0.8693X1X2 + 0.4834X1X3 + 0.6182X1X4 − 0.0165X2X3 − 0.5440X2X4 − 1.0414X3X4 + 0.0552X1² + 0.2049X2² + 0.0356X3² + 0.4082X4²
YFRAPFerric-reducing antioxidant power
(μM Fe2+/g)
YFRAP = 49.6304 + 1.7734X1 + 1.6391X2 − 5.3144X3 + 2.2654X4 − 1.4726X1X2 + 1.8035X1X3 + 0.0422X1X4 + 0.5681X2X3 + 0.2908X2X4 + 1.3159X3X4 − 2.6215X1² − 1.6820X2² − 2.7125X3² − 3.1732X4²
X1: ultrasonic temperature (°C); X2: ultrasonic time (min); X3: ethanol concentration (%); X4: liquid–solid ratio (mL/g). DPPH: diphenyl-1-picrylhydrazyl.
Table 2. Regression coefficient (β) and fit statistics of the predicted second-order polynomial models for flavonoids and antioxidant activity.
FactorCoefficient (β)
TFCDPPH-RSCFRAP
Intercept7.545993.621949.6304
Linear
X10.0014−0.2886 *1.7734 **
X20.05290.3209 *1.6391 **
X3−0.2517 ***1.4200 ***−5.3144 ***
X40.2763 ***−0.3100 *2.2654 ***
Cross product
X1X2−0.1827 *−0.8693 ***−1.4726
X1X3−0.00650.4834 *1.8035 *
X1X40.08370.6182 *0.0422
X2X30.0992−0.01650.5681
X2X4−0.3285 ***−0.5440 *0.2908
X3X40.0278−1.0414 ***1.3159
Quadratic
X1²−0.07960.0552−2.6215 **
X2²−0.00990.2049−1.6820 *
X3²−0.5671 ***0.0356−2.7125 ***
X4²−0.02660.4082 *−3.1732 ***
0.94170.94270.9413
Adjusted R²0.88350.88540.8825
Predicted R²0.72640.71060.7166
Adequate precision16.388617.780314.0570
Coefficient of variation1.95%0.4427%3.65%
p-Value (Model)<0.0001 ***<0.0001 ***<0.0001 ***
p-Value (Lack of fit)0.47470.26820.4000
X1: ultrasonic temperature (°C); X2: ultrasonic time (min); X3: ethanol concentration (%); X4: liquid–solid ratio (mL/g). *: indicates significance level (0.01 < p-value ≤ 0.05); **: indicates highly significant level (0.001 < p-value ≤ 0.01); ***: indicates remarkably significant level (p-value ≤ 0.001). TFC: total flavonoid content; FRAP: ferric-reducing antioxidant power; DPHH-RSC: 2,2-diphenyl-1-picrylhydrazyl radical scavenging capacity.
Table 3. Experimental values and predicted values of response variables at optimum extraction conditions.
Response VariablesOptimum Extraction Conditions 1Maximum Value
X1X2X3X4Experimental Value 2Predicted Value
YTFC (mg RE/g)80 °C4 min78%35 mL/g7.96 ± 0.188.29
YDPPH (%)94.68 ± 0.5795.25
YFRAP (μM Fe2+/g)45.35 ± 0.2346.17
1 X1: ultrasonic temperature (°C); X2: ultrasonic time (min); X3: ethanol concentration (%); X4: liquid–solid ratio (mL/g). 2 Experimental results were expressed as average values ± standard deviation (n = 3).
Table 4. Independent variables and their levels in Box–Behnken design (BBD).
Independent VariableSymbolLevel
−101
Ultrasonic temperature (°C)X1607080
Ultrasonic time (min)X2468
Ethanol concentration (%)X3708090
Liquid-solid ratio (mL/g)X4253035
Table 5. Designed experiments and measured responses of response surface analysis.
RunUltrasonic TemperatureUltrasonic TimeEthanol Concentration Liquid-Solid RatioResponse 1-YTFCResponse 2-YDPPHResponse 3-YFRAP
(℃)(min)(%)(mL/g)(mg RE/g)(%)(μM Fe2+/g)
160670306.9593.0947.97
280880307.2792.8845.92
370680307.5293.2948.20
460680357.7393.5545.93
580670307.0091.4949.38
660880307.7494.9245.66
780680357.9694.0048.43
860680257.1495.2541.82
970470307.3692.1550.65
1080680257.0493.2244.15
1170680307.4393.3648.06
1260480307.3493.3640.36
1370480256.7993.4739.37
1480480307.6194.7946.51
1570880257.6295.7042.96
1660690306.6894.9234.54
1770670357.4793.1649.11
1870680307.6893.8051.47
1970690356.9394.5340.19
2070480357.9393.8144.95
2170680307.6994.0650.24
2270670257.1091.7348.50
2370870307.2893.1452.82
2470890306.8495.3843.45
2570680307.4193.6050.17
2680690306.7195.2543.16
2770690256.4597.2634.32
2870490306.5294.4639.01
2970880357.4493.8749.70

