
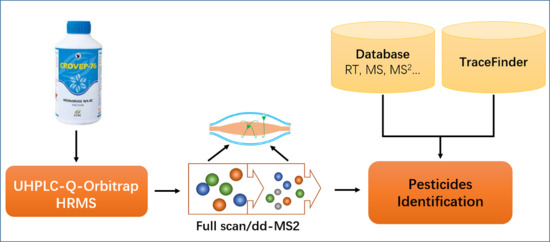
Screening 89 Pesticides in Fishery Drugs by Ultrahigh Performance Liquid Chromatography Tandem Quadrupole-Orbitrap Mass Spectrometer


Abstract
1. Introduction
2. Results and Discussion
2.1. Full MS-ddMS2 Scan for Identification and Qualification
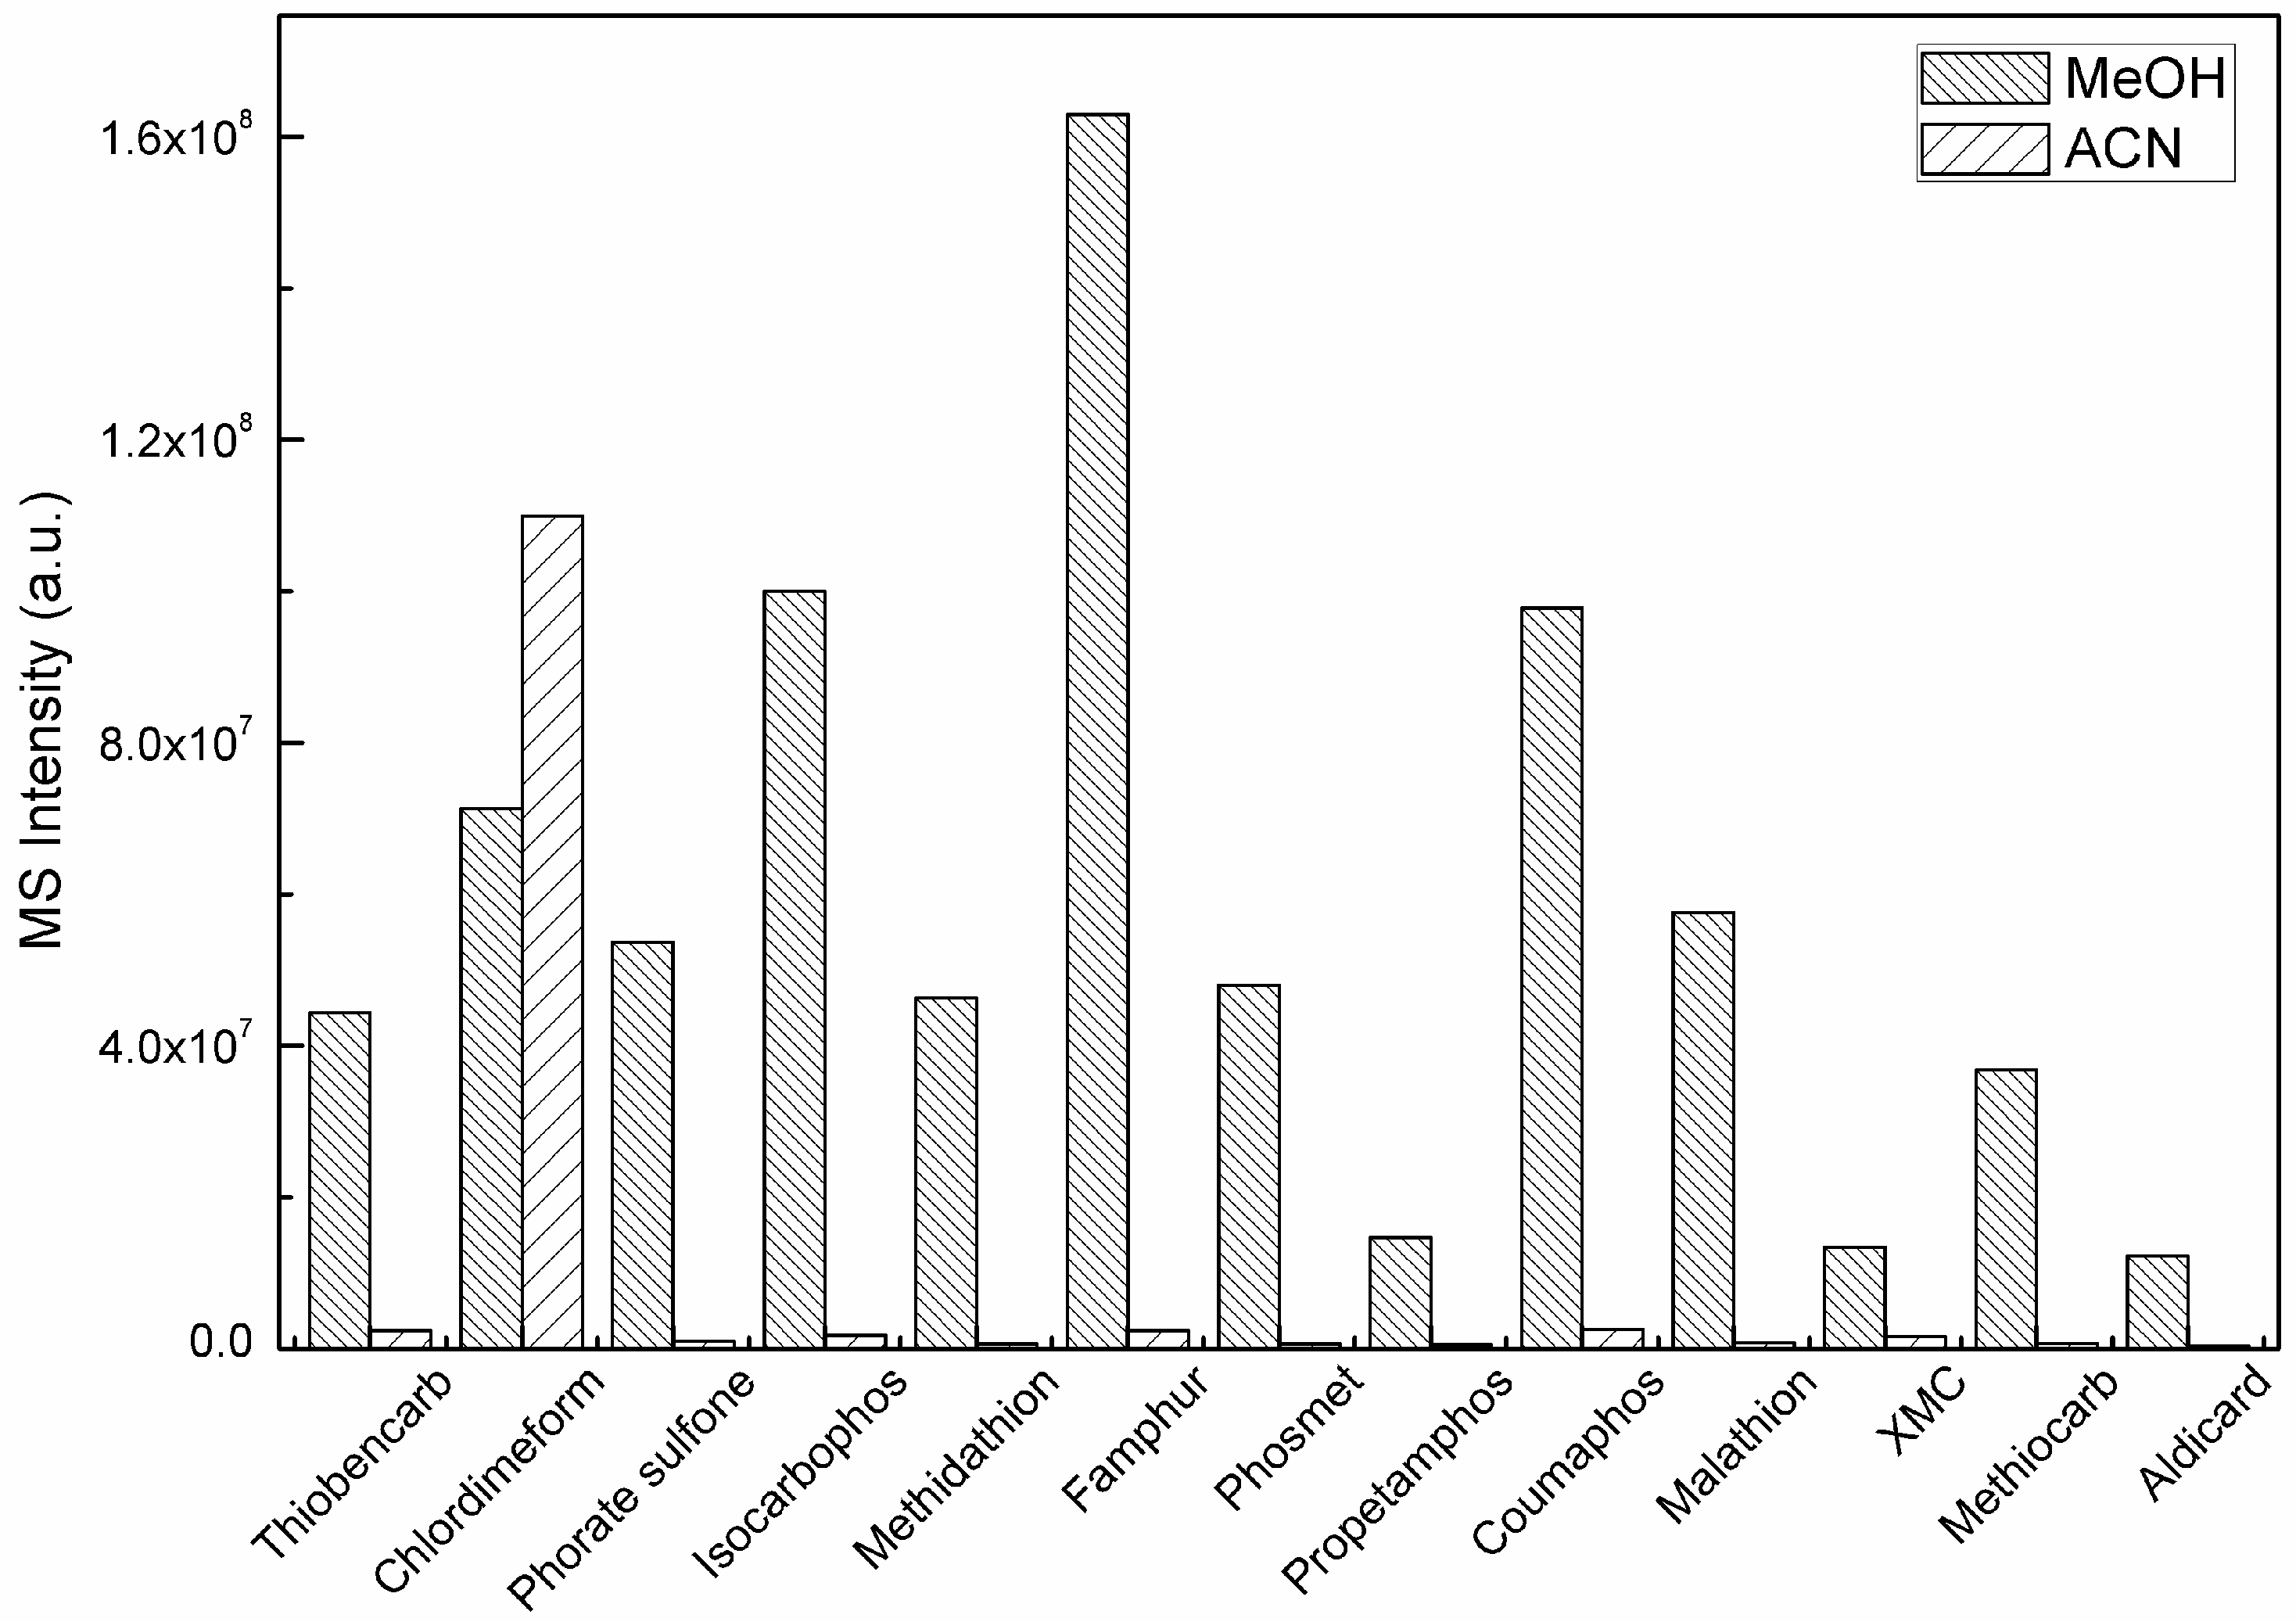
2.2. Mobile Phase
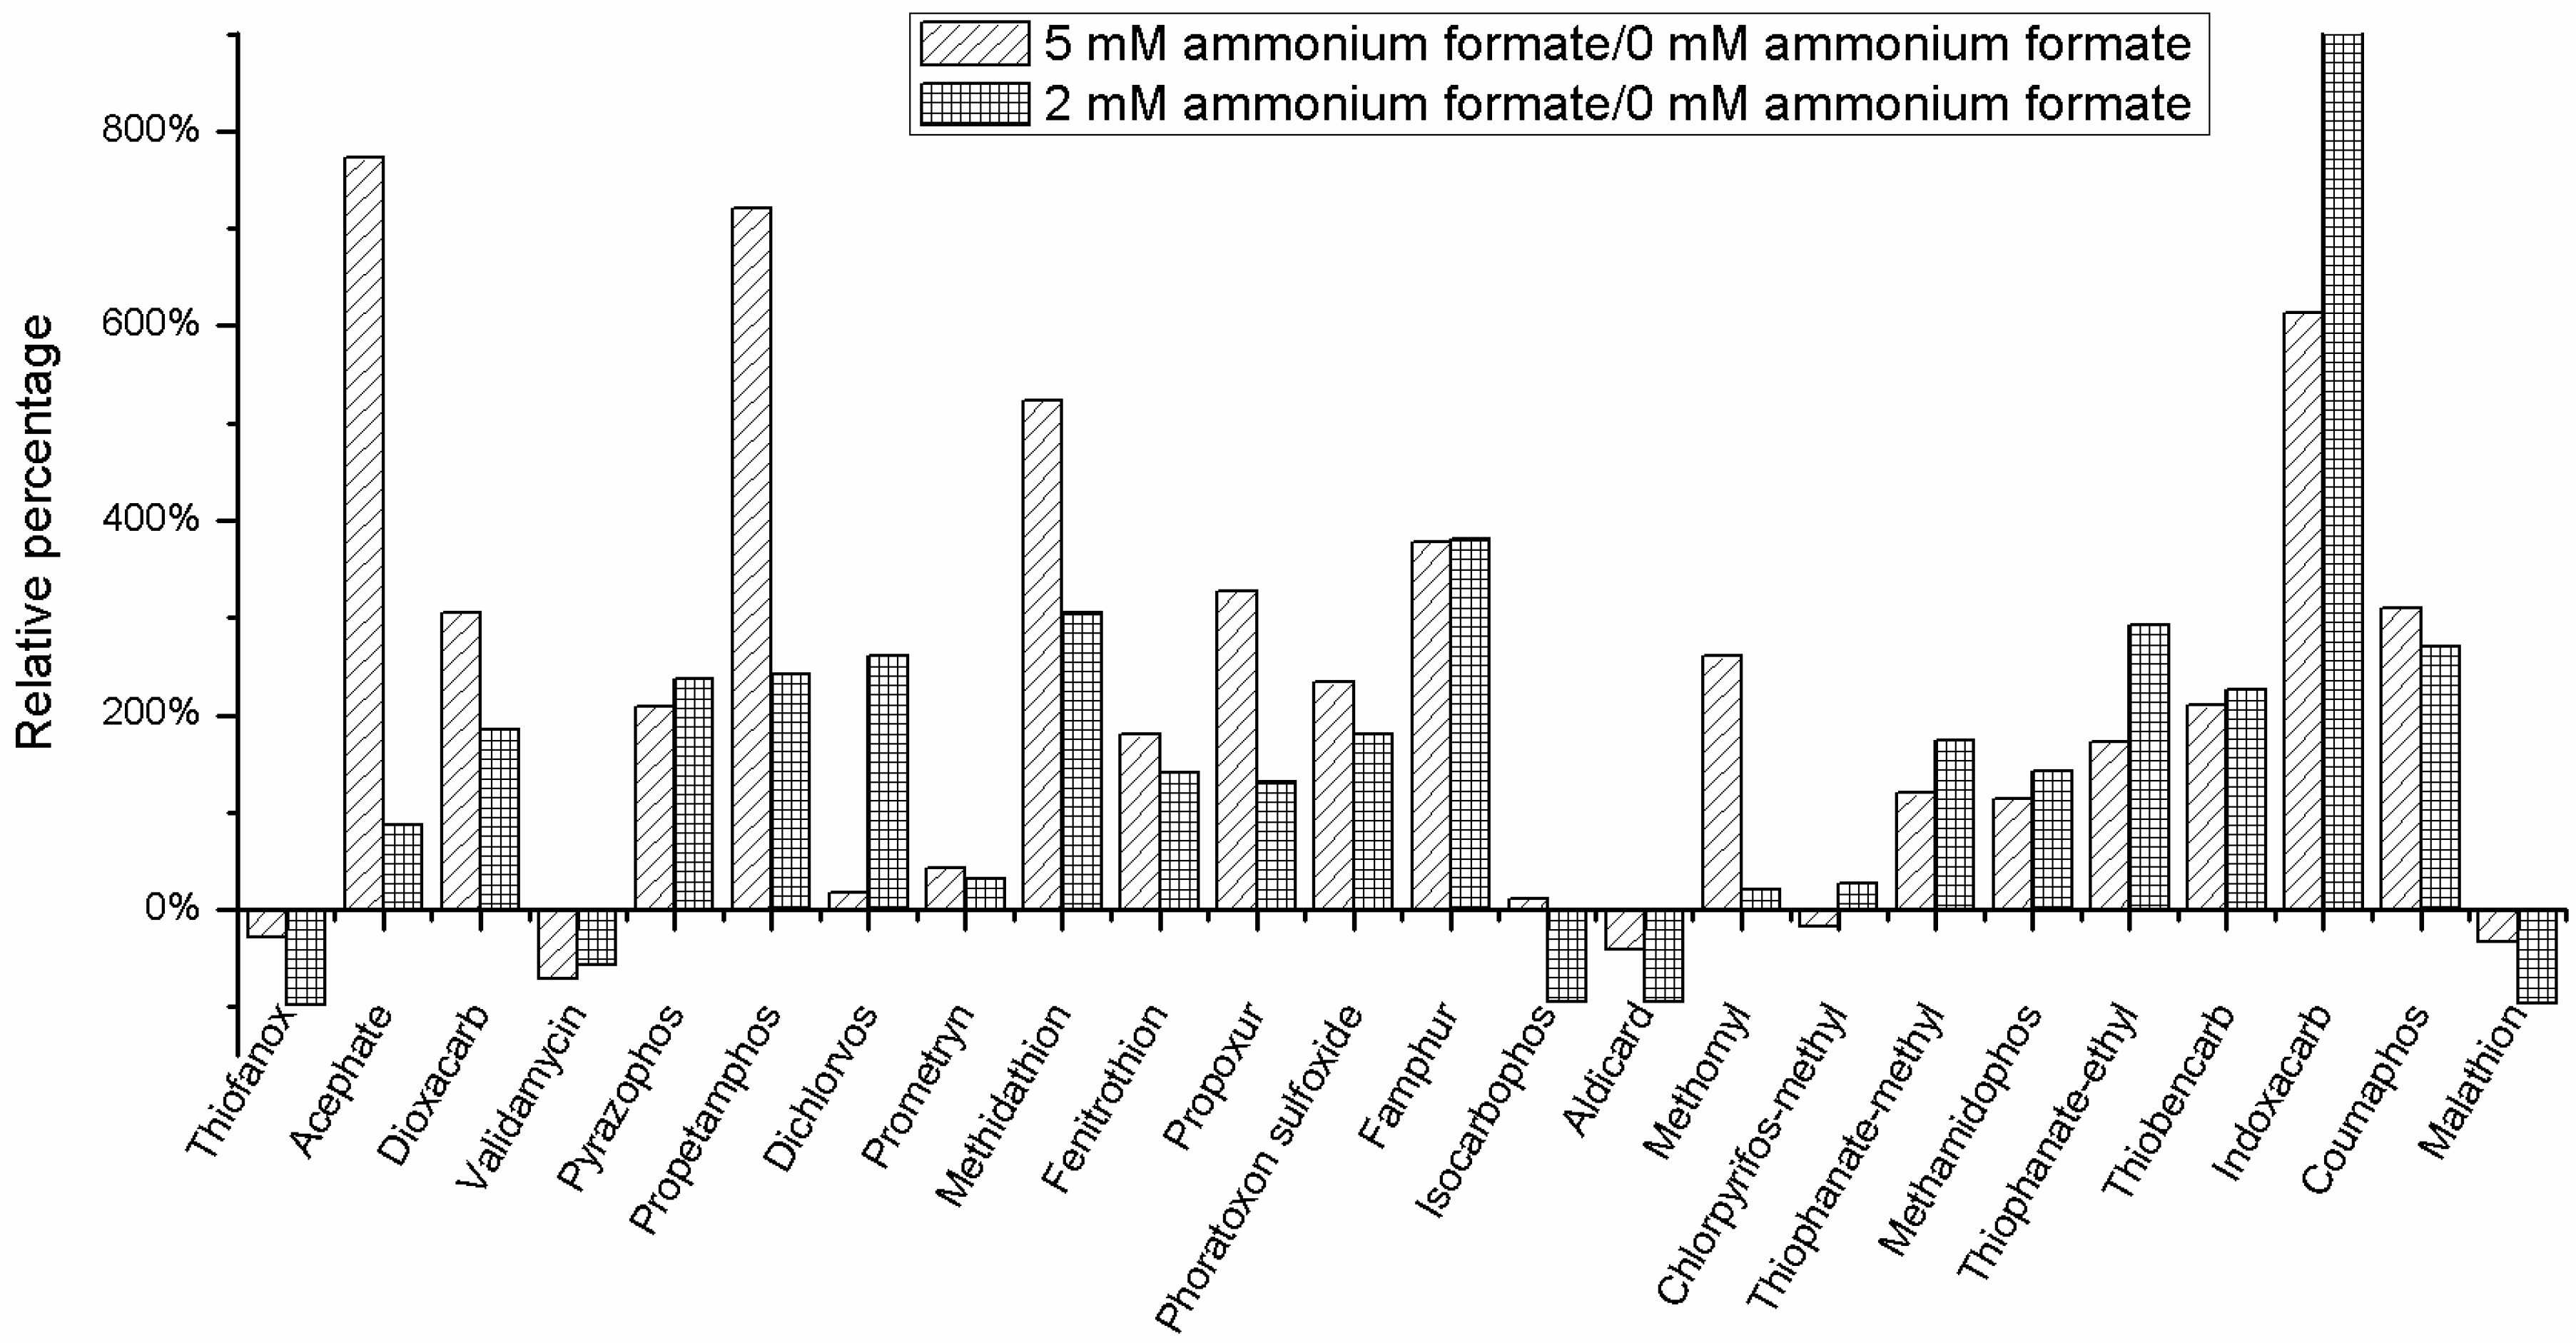
2.3. Buffers
2.4. Mass Spectrometry
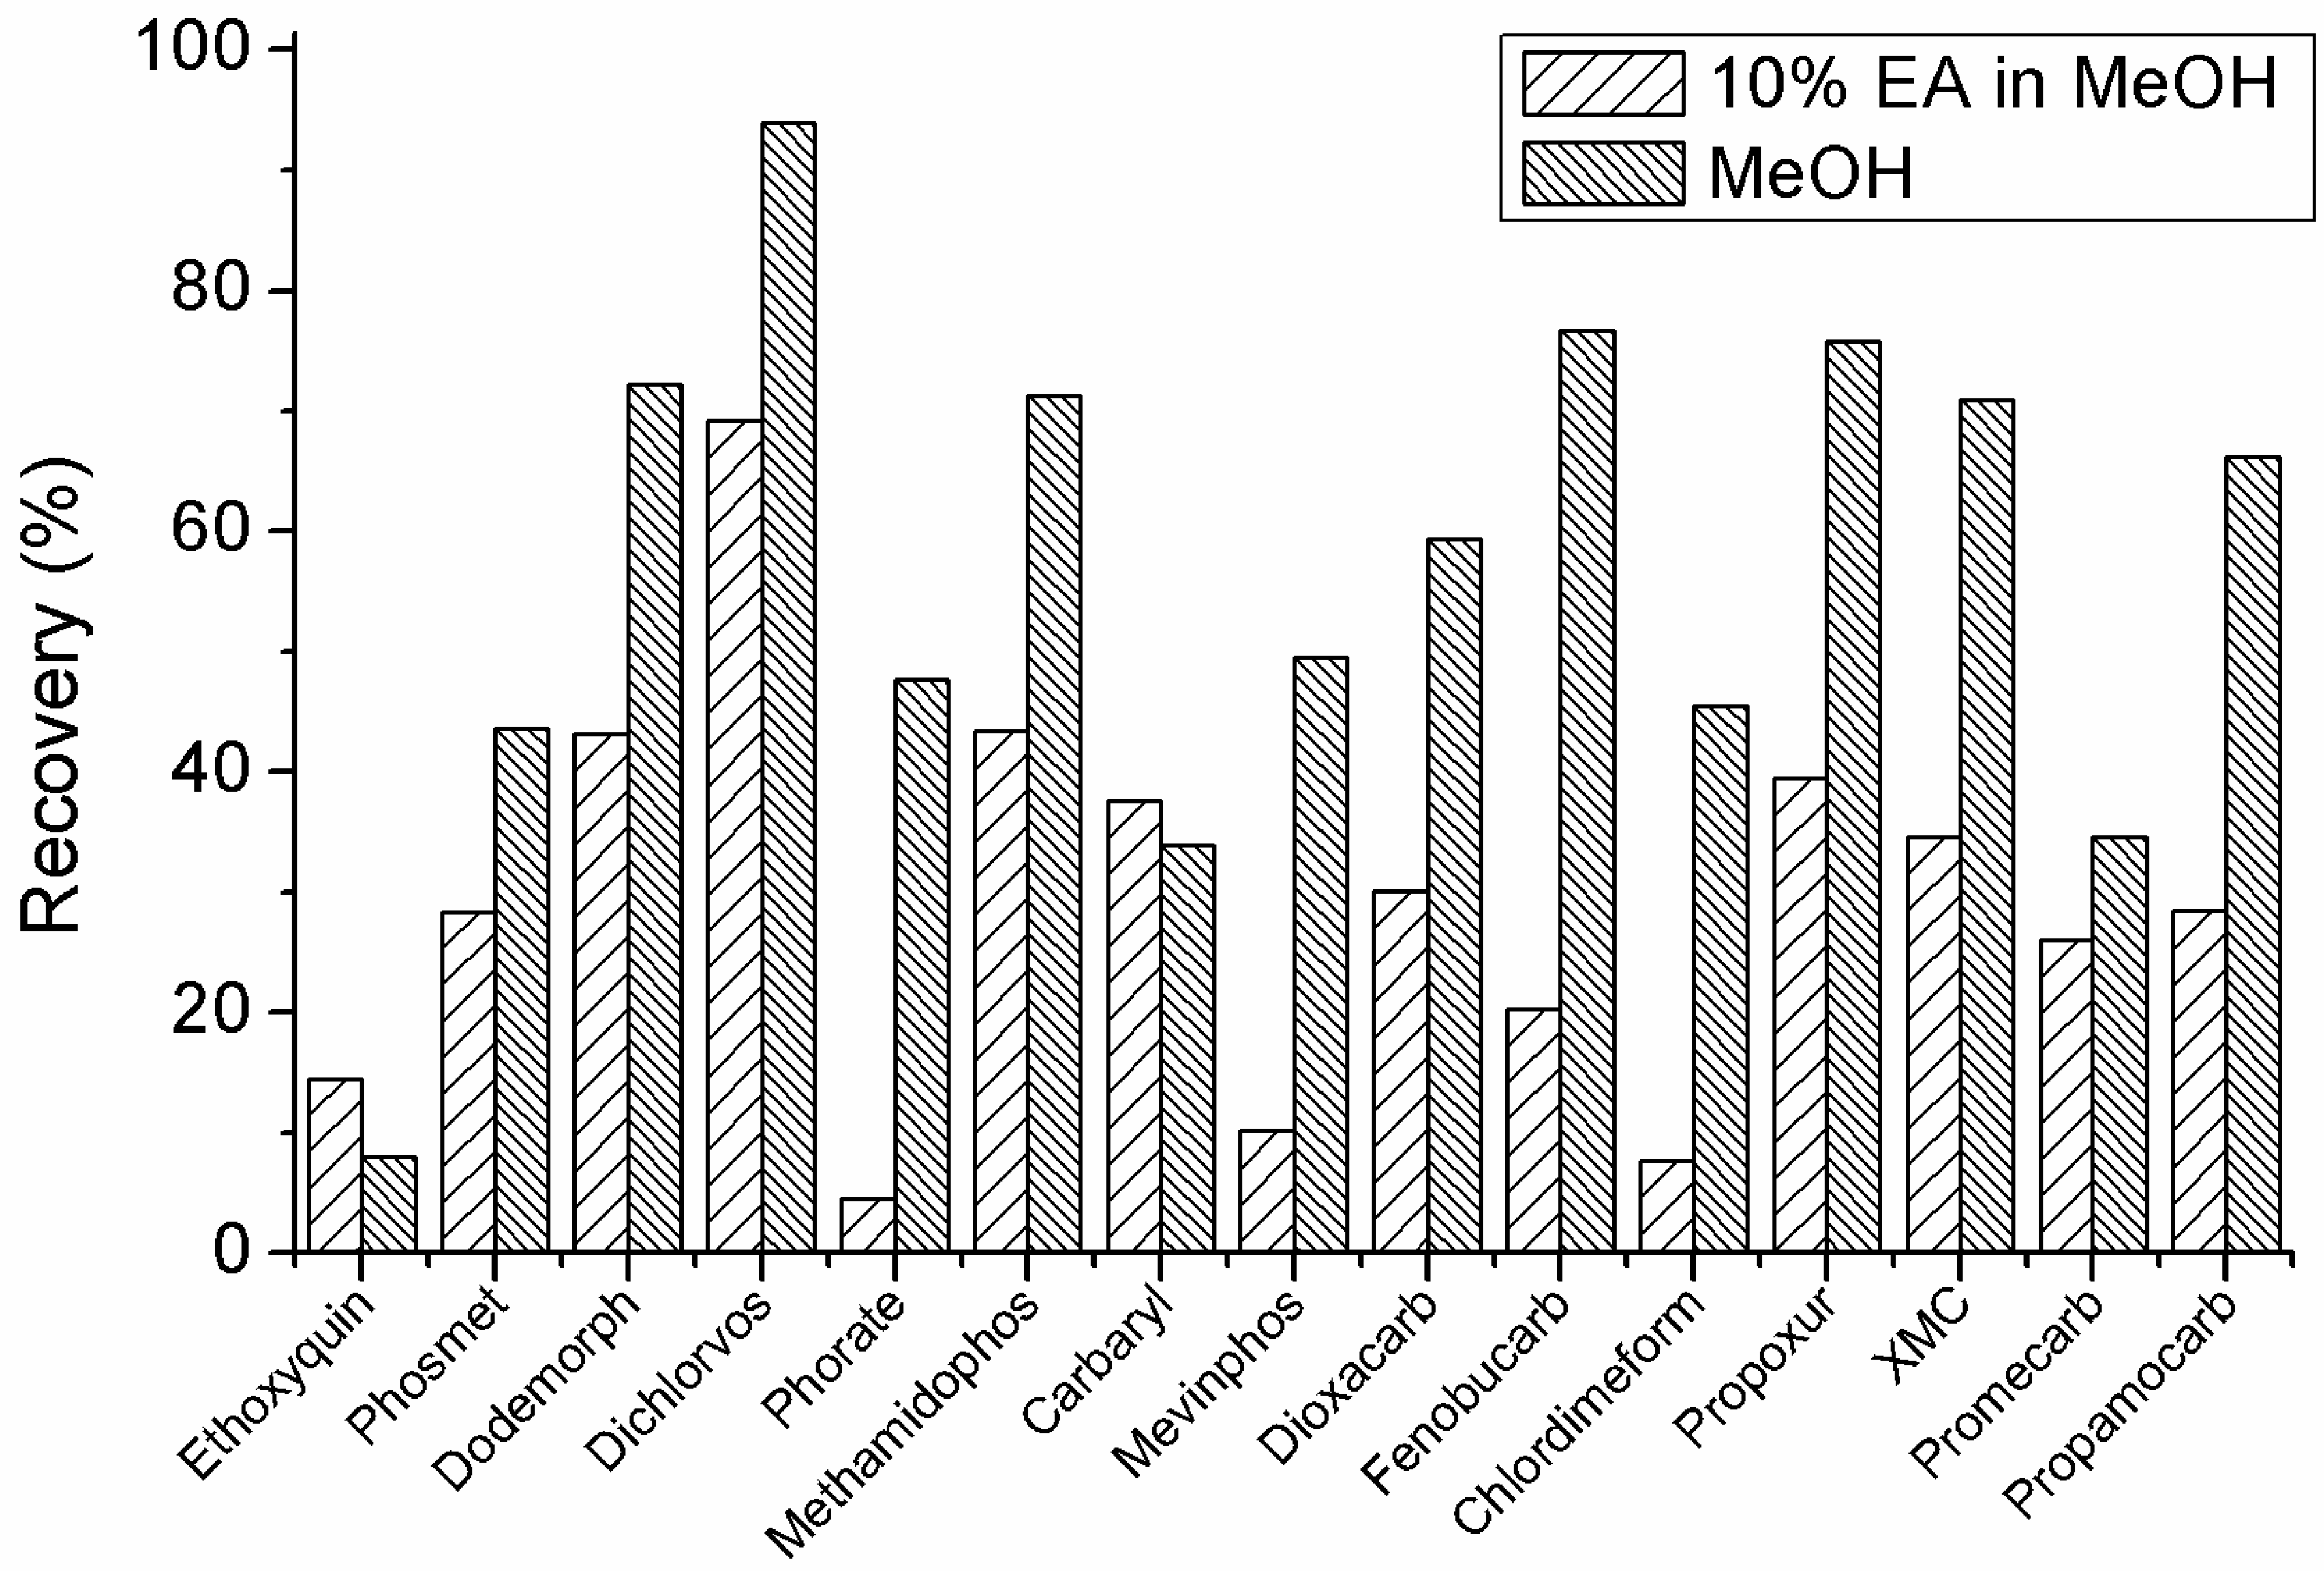
2.5. Sample Preparation
2.6. Matrix Effect
2.7. Method Validation
2.7.1. Screening Detection Limit
2.7.2. Accuracy and Repeatability
2.7.3. Calibration and linearity
2.8. Practical Screening
3. Materials and Methods
3.1. Instruments and Reagents
3.2. Preparation of Standards
3.3. Methods
3.3.1. Elution Conditions
3.3.2. Mass Spectrometer Condition
3.4. Sample Preparation
3.5. Database for Screening, Qualitative and Quantitative Rules
4. Conclusions
Supplementary Materials
Author Contributions
Funding
Acknowledgments
Conflicts of Interest
References
- Broughton, E.I.; Walker, D.G. Policies and practices for aquaculture food safety in china. Food Pol. 2010, 35, 471–478. [Google Scholar] [CrossRef]
- Green Food—Fishery Medicine Application Guideline Industry Standard; Agriculture: Beijing, China, 2013; Volume NY/T 755–2013, Available online: http;//foodmate.net/standard/yulan.php?itemid=39306 (accessed on 23 December 2013).
- Rico, A.; Geng, Y.; Focks, A.; Van den Brink, P.J. Modeling environmental and human health risks of veterinary medicinal products applied in pond aquaculture. Environ. Toxicol. Chem. 2013, 32, 1196–1207. [Google Scholar] [CrossRef] [PubMed]
- Rico, A.; Satapornvanit, K.; Haque, M.M.; Min, J.; Nguyen, P.T.; Telfer, T.C.; van den Brink, P.J. Use of chemicals and biological products in asian aquaculture and their potential environmental risks: A critical review. Rev. Aquacult. 2012, 4, 75–93. [Google Scholar] [CrossRef]
- Burridge, L.; Weis, J.S.; Cabello, F.; Pizarro, J.; Bostick, K. Chemical use in salmon aquaculture: A review of current practices and possible environmental effects. Aquaculture 2010, 306, 7–23. [Google Scholar] [CrossRef]
- Haya, K.; Burridge, L.E.; Davies, I.M.; Ervik, A. A review and assessment of environmental risk of chemicals used for the treatment of sea lice infestations of cultured salmon. In Environmental Effects of Marine Finfish Aquaculture. Handbook of Environmental Chemistry; Springer: Berlin/Heidelberg, Germany, 2005; Volume 5M, pp. 305–340. [Google Scholar]
- Turnipseed, S.B.; Storey, J.M.; Lohne, J.J.; Andersen, W.C.; Burger, R.; Johnson, A.S.; Madson, M.R. Wide-scope screening method for multiclass veterinary drug residues in fish, shrimp, and eel using liquid chromatography–quadrupole high-resolution mass spectrometry. J. Agric. Food Chem. 2017, 65, 7252–7267. [Google Scholar] [CrossRef] [PubMed]
- Asghar, M.A.; Zhu, Q.; Sun, S.; Peng, Y.; Shuai, Q. Suspect screening and target quantification of human pharmaceutical residues in the surface water of wuhan, china, using UHPLC-Q-ORBITRAP HRMS. Sci. Total Environ. 2018, 635, 828–837. [Google Scholar] [CrossRef] [PubMed]
- Muehlwald, S.; Buchner, N.; Kroh, L.W. Investigating the causes of low detectability of pesticides in fruits and vegetables analysed by high-performance liquid chromatography-time-of-flight. J. Chromatogr. A 2018, 1542, 37–49. [Google Scholar] [CrossRef] [PubMed]
- Mol, H.G.; Zomer, P.; De Koning, M. Qualitative aspects and validation of a screening method for pesticides in vegetables and fruits based on liquid chromatography coupled to full scan high resolution (orbitrap) mass spectrometry. Anal. Bioanal. Chem. 2012, 403, 2891–2908. [Google Scholar] [CrossRef] [PubMed]
- Zuo, L.; Sun, Z.; Wang, Z. Tissue distribution profiles of multiple major bioactive components in rats after intravenous administration of xuebijing injection by UHPLC-Q-ORBITRAP HRMS. Biomed. Chromatogr. 2019, 33, e4400. [Google Scholar] [CrossRef] [PubMed]
- Núñez, O.; Gallart-Ayala, H.; Martins, C.P.B.; Lucci, P. New trends in fast liquid chromatography for food and environmental analysis. J. Chromatogr. A 2012, 1228, 298–323. [Google Scholar] [CrossRef]
- Wang, J.; Leung, D.; Chow, W.; Chang, J.; Wong, J.W. Development and validation of a multiclass method for analysis of veterinary drug residues in milk using ultrahigh performance liquid chromatography electrospray ionization quadrupole orbitrap mass spectrometry. J. Agric. Food Chem. 2015, 63, 9175–9187. [Google Scholar] [CrossRef] [PubMed]
- Kaufmann, A.; Teale, P. Capabilities and limitations of High-Resolution Mass Spectrometry (HRMS): Time-of-flight and orbitraptm. In Chemical Analysis of Non-Antimicrobial Veterinary Drug Residues in Food; Kay, J.F., MacNeil, J.D., Wang, J., Eds.; Wiley: Hoboken, NJ, USA, 2016; Volume 3, pp. 93–139. [Google Scholar]
- Kaufmann, A.; Walker, S. Comparison of linear intrascan and interscan dynamic ranges of orbitrap and ion-mobility time-of-flight mass spectrometers. Rapid Commun. Mass Spectrom. 2017, 31, 1915–1926. [Google Scholar] [CrossRef] [PubMed]
- Kong, C.; Wang, Y.; Huang, Y.; Yu, H. Multiclass screening of >200 pharmaceutical and other residues in aquatic foods by ultrahigh-performance liquid chromatography-quadrupole-orbitrap mass spectrometry. Anal. Bioanal. Chem. 2018, 410, 1–9. [Google Scholar] [CrossRef] [PubMed]
- Del Mar Gomez-Ramos, M.; Rajski, L.; Heinzen, H.; Fernandez-Alba, A.R. Liquid chromatography orbitrap mass spectrometry with simultaneous full scan and tandem MS/MS for highly selective pesticide residue analysis. Anal. Bioanal. Chem. 2015, 407, 6317–6326. [Google Scholar] [CrossRef] [PubMed]
- Casado, J.; Santillo, D.; Johnston, P. Multi-residue analysis of pesticides in surface water by liquid chromatography quadrupole-orbitrap high resolution tandem mass spectrometry. Anal. Chim. Acta 2018, 1024, 1–17. [Google Scholar] [CrossRef] [PubMed]
- Hernandez, F.; Ibanez, M.; Portoles, T.; Cervera, M.I.; Sancho, J.V.; Lopez, F.J. Advancing towards universal screening for organic pollutants in waters. J. Hazard. Mater. 2015, 282, 86–95. [Google Scholar] [CrossRef] [PubMed]
- Jia, W.; Chu, X.; Chang, J.; Wang, P.G.; Chen, Y.; Zhang, F. High-throughput untargeted screening of veterinary drug residues and metabolites in tilapia using high resolution orbitrap mass spectrometry. Anal. Chim. Acta 2017, 957, 29–39. [Google Scholar] [CrossRef]
- Wang, J.; Chow, W.; Wong, J.W.; Leung, D.; Chang, J.; Li, M. Non-target data acquisition for target analysis (ndata) of 845 pesticide residues in fruits and vegetables using uhplc/esi q-orbitrap. Anal. Bioanal. Chem. 2019, 411, 1421–1431. [Google Scholar] [CrossRef]
- Martinello, M.; Borin, A.; Stella, R.; Bovo, D.; Biancotto, G.; Gallina, A.; Mutinelli, F. Development and validation of a quechers method coupled to liquid chromatography and high resolution mass spectrometry to determine pyrrolizidine and tropane alkaloids in honey. Food Chem. 2017, 234, 295–302. [Google Scholar] [CrossRef]
- Rochat, B. Proposed confidence scale and id score in the identification of known-unknown compounds using high resolution ms data. J. Am. Soc. Mass Spectrom. 2017, 28, 709–723. [Google Scholar] [CrossRef]
- Schymanski, E.L.; Singer, H.P.; Slobodnik, J.; Ipolyi, I.M.; Oswald, P.; Krauss, M.; Schulze, T.; Haglund, P.; Letzel, T.; Grosse, S.; et al. Non-target screening with high-resolution mass spectrometry: Critical review using a collaborative trial on water analysis. Anal. Bioanal. Chem. 2015, 407, 6237–6255. [Google Scholar] [CrossRef]
- Raina, R.; Sun, L. Trace level determination of selected organophosphorus pesticides and their degradation products in environmental air samples by liquid chromatography-positive ion electrospray tandem mass spectrometry. J. Environ. Sci. Health, Part B 2008, 43, 323–332. [Google Scholar] [CrossRef]
- Kong, C.; Zhou, Z.; Wang, Y.; Huang, Y.-F.; Shen, X.-S.; Huang, D.-M.; Cai, Y.-Q.; Yu, H.-J. Screening of chemical drugs in fishery inputs by ultrahigh performance liquid chromatography-orbitrap high resolution mass spectroscopy. Chin. J. Anal. Chem. 2017, 45, 245–252. [Google Scholar]
- Wang, Y.; Huang, Y.-F.; Han, F.; Kong, C.; Zhou, Z.; Cai, Y.-Q.; Yu, H.-J. Screening 175 veterinary drugs in fishery feed by ultrahigh performance liquid chromatography-orbitrap high resolution mass spectrometry. Chin. J. Anal. Lab. 2018, 37, 1013–1019. [Google Scholar]
- Rajski, L.; Gomez-Ramos Mdel, M.; Fernandez-Alba, A.R. Large pesticide multiresidue screening method by liquid chromatography-orbitrap mass spectrometry in full scan mode applied to fruit and vegetables. J. Chromatogr. A 2014, 1360, 119–127. [Google Scholar] [CrossRef]
- Bateman, K.P.; Kellmann, M.; Muenster, H.; Papp, R.; Taylor, L. Quantitative–qualitative data acquisition using a benchtop orbitrap mass spectrometer. J. Am. Soc. Mass Spectrom. 2009, 20, 1441–1450. [Google Scholar] [CrossRef]
- Li, P.; Zeng, X.-Y.; Cui, J.-T.; Zhao, L.-J.; Yu, Z.-Q. Determination of seven urinary metabolites of organophosphate esters using liquid chromatography-tandem mass spectrometry. Chin. J. Anal. Chem. 2017, 45, 1648–1654. [Google Scholar] [CrossRef]
- Trufelli, H.; Palma, P.; Famiglini, G.; Cappiello, A. An overview of matrix effects in liquid chromatography-mass spectrometry. Mass Spectrom. Rev. 2011, 30, 491–509. [Google Scholar] [CrossRef]
- Łozowicka, B.; Rutkowska, E.; Jankowska, M. Influence of quechers modifications on recovery and matrix effect during the multi-residue pesticide analysis in soil by GC/MS/MS and GC/ECD/NPD. Environ. Sci. Pollut. Res. Int. 2017, 24, 7124–7138. [Google Scholar] [CrossRef]
- European commission. Guidance Document on Analytical Quality Control and Validation Procedures for Pesticide Residues Analysis in Food and Feed. Sante/11813/2017. Available online: https://ec.europa.eu/food/sites/food/files/plant/docs/pesticides_mrl_guidelines_wrkdoc_2017-11813.pdf (accessed on 1 March 2018).
- Portolés, T.; Ibáñez, M.; Garlito, B.; Nácher-Mestre, J.; Karalazos, V.; Silva, J.; Alm, M.; Serrano, R.; Pérez-Sánchez, J.; Hernández, F.; et al. Comprehensive strategy for pesticide residue analysis through the production cycle of gilthead sea bream and atlantic salmon. Chemosphere 2017, 179, 242–253. [Google Scholar] [CrossRef]
- De Paepe, E.; Wauters, J.; Van Der Borght, M.; Claes, J.; Huysman, S.; Croubels, S.; Vanhaecke, L. Ultra-high-performance liquid chromatography coupled to quadrupole orbitrap high-resolution mass spectrometry for multi-residue screening of pesticides, (veterinary) drugs and mycotoxins in edible insects. Food Chem. 2019, 293, 187–196. [Google Scholar] [CrossRef]
- Huysman, S.; Van Meulebroek, L.; Vanryckeghem, F.; Van Langenhove, H.; Demeestere, K.; Vanhaecke, L. Development and validation of an ultra-high performance liquid chromatographic high resolution q-orbitrap mass spectrometric method for the simultaneous determination of steroidal endocrine disrupting compounds in aquatic matrices. Anal. Chim. Acta 2017, 984, 140–150. [Google Scholar] [CrossRef]
Sample Availability: Samples of the compounds are not available from the authors. |


| Compound | 10 mg·kg−1 | 100 mg·kg−1 | Compound | 10 mg·kg−1 | 100 mg·kg−1 | ||||
|---|---|---|---|---|---|---|---|---|---|
| Recovery (%) | RSD (%, n = 3) | Recovery (%) | RSD (%, n = 3) | Recovery (%) | RSD (%, n = 3) | Recovery (%) | RSD (%, n = 3) | ||
| Aminocarb | 104 | 5.99 | 109 | 4.35 | 2,3,5-Trimethacarb | 80 | 1.78 | 103 | 0.71 |
| Carbaryl | 81.8 | 3.91 | 99.9 | 8.49 | 3,4,5-Trimethylphenol | 86.4 | 4.62 | 101 | 2.91 |
| Carbendazim | 120 | 3.77 | 85.6 | 4.04 | Acephate | 102 | 4.75 | 116 | 4.83 |
| Carbofuran | 92.1 | 6.42 | 94 | 3.82 | Aldicarb sulfone | 94.7 | 10.2 | 103 | 4.07 |
| Chlordimeform | 81.7 | 4.96 | 85 | 3.17 | Aldicarb sulfoxide | 86.6 | 6.19 | 103 | 5.97 |
| Coumaphos | 105 | 7.77 | 109 | 8.11 | Aldicard | 89.9 | 18.2 | 105 | 2.97 |
| Dimethoate | 110 | 11.1 | 107 | 10.7 | Avermectin B1a | 91.4 | 7.87 | 84.5 | 4.24 |
| Dodemorph | 95.2 | 7.08 | 82.1 | 2.96 | Bendiocarb | 80.7 | 3.5 | 88.9 | 7.96 |
| Famphur | 113 | 7.1 | 111 | 5.44 | Bifenthrin | 86.5 | 21 | 86.7 | 5.1 |
| Fenobucarb | 82.3 | 3.33 | 105 | 2.89 | Chlorpyrifos-methyl | 94.5 | 23 | 124 | 10.1 |
| Fuberidazole | 111 | 5.44 | 85 | 4.01 | Deltamethrin | 77.2 | 9.61 | 79.2 | 4.54 |
| Imazalil | 92.6 | 5.67 | 82.2 | 4.31 | Dichlorvos | 113 | 7.61 | 117 | 7.23 |
| Indoxacarb | 84.2 | 7.71 | 72.9 | 4.11 | Dioxacarb | 96 | 5.6 | 104 | 5.34 |
| Isocarbophos | 96.9 | 12.3 | 104 | 8.42 | Doramectin | 75.1 | 8.76 | 86.6 | 4.26 |
| Malathion | 88 | 6.52 | 113 | 6.66 | Ethoxyquin | 94.4 | 5.48 | 30.2 | 16.5 |
| Methiocarb | 86.1 | 8.01 | 104 | 5.37 | Fenvalerate | 90.5 | 21.6 | 78.8 | 1.83 |
| Mevinphos | 84.8 | 10.2 | 115 | 1.98 | Fipronil | 80.8 | 9.54 | 89.3 | 2.1 |
| Monocrotophos | 113 | 5.67 | 121 | 4.98 | Fipronil-desulfinyl | 88 | 8.67 | 80.8 | 6.54 |
| Omethoate | 123 | 12.7 | 117 | 12.7 | Fipronil-sulfide | 83.1 | 8.68 | 86.6 | 3.43 |
| PCP Na | 83.1 | 7.62 | 88 | 0.989 | Fipronil-sulfone | 82.9 | 6.88 | 80.8 | 4.43 |
| Phoratoxon sulfoxide | 92.2 | 14 | 110 | 4.59 | Flucythrinate | 97.9 | 7.69 | 80 | 2.09 |
| Phosalone | 105 | 7.34 | 103 | 4.11 | Flumethrin | 65.3 | 5.66 | 77.9 | 0.732 |
| Phoxim | 111 | 10 | 102 | 7.12 | Isoprocarb | 80 | 1.78 | 103 | 0.71 |
| Pirimicarb | 85.5 | 7.96 | 99.7 | 2.84 | Ivermectin B1a | 59.7 | 4.64 | 86.3 | 1.29 |
| Pirimiphos-methyl | 113 | 8.83 | 119 | 3.26 | Methamidophos | 108 | 6.42 | 124 | 6.08 |
| Promecarb | 89.1 | 5.83 | 102 | 2.98 | Methidathion | 98 | 4.15 | 113 | 4.73 |
| Prometryn | 88.9 | 7.63 | 78.8 | 0.618 | Methomyl | 94 | 6.7 | 111 | 4.89 |
| Propamocarb | 96.3 | 8.1 | 109 | 5.37 | Phorate sulfone | 97.3 | 5.51 | 107 | 1.58 |
| Propazine | 93.1 | 8.22 | 72.5 | 2.52 | Propetamphos | 113 | 5.06 | 123 | 4.27 |
| Propiconazole | 115 | 6.92 | 77.3 | 0.198 | Robenidine | 90 | 12.2 | 64.5 | 1.73 |
| Propoxur | 85.2 | 4.67 | 91.2 | 6.94 | Tau-fluvalinate | 65.5 | 13.6 | 83.6 | 4.04 |
| Pyrazophos | 119 | 12.1 | 122 | 6.95 | Thiofanox | 80.6 | 2.06 | 95.4 | 3.46 |
| Quinalphos | 113 | 8.76 | 112 | 5.45 | Thiofanox sulphone | 87.7 | 9.49 | 92.4 | 0.0845 |
| Simazine | 86.7 | 3.21 | 65.7 | 1.7 | Thiofanox -sulphoxide | 82.9 | 3.47 | 101 | 2.42 |
| Simetryne | 98.2 | 4.56 | 76 | 3.28 | XMC | 75.6 | 9.88 | 85.8 | 6.46 |
| Thiabendazole | 119 | 6.16 | 80.9 | 3.43 | Xylazine | 90.5 | 8.82 | 76.8 | 1.8 |
| Thiobencarb | 117 | 6.87 | 76.8 | 1.54 | Amitraz | -— | -— | 61.9 | 14.2 |
| Triazophos | 112 | 5.76 | 116 | 3.33 | Fenitrothion | -— | -— | 124 | 13.8 |
| trichlorfon | 109 | 4.85 | 109 | 6.27 | Phorate | — | — | 125 | 12.1 |
| Chlorpyrifos | 138 | 7.17 | 154 | 7.63 | Prothiofos | -— | -— | 100 | 14.7 |
| Phorate sulfoxide | 109 | 9.55 | 126 | 3.67 | Validamycin | — | — | 59.3 | 6.17 |
| Phosmet | 131 | 10.5 | 177 | 17 | Bromophos ethyl * | — | — | 85.3 | 19.4 |
| Thiophanate-ethyl | 128 | 5.49 | 76.9 | 1.36 | Cyfluthrin * | — | — | 91.5 | 1.13 |
| Thiophanate-methyl | 128 | 4.96 | 77.9 | 1.86 | Parathion * | -— | -— | 105 | 3.53 |
| Tributylphos-phorotrithioate | 150 | 7.98 | 147 | 4.56 | |||||
| Code | Trade Name | Dosage Form | Listed | Detected Compounds | Contents (mg/kg or mg/L) |
|---|---|---|---|---|---|
| 4 | Insecticide for fish | Aqueous solution | NA | Chlorpyrifos | 2.66 |
| 5 | Insecticide for fish and shrimp | Soluble concentrate | Avermectin | Ivermectin B1a | 347 |
| Chlorpyrifos | 1.33 | ||||
| Avermectin B1a | 7479 | ||||
| 6 | Pesticide for water | Soluble concentrate | Bioactive ingredient | Ivermectin B1a | 207 |
| Avermectin B1a | 3482 | ||||
| 14 | Insecticide for fish | Soluble concentrate | NA | Phoxim | 2.20 |
| 15 | Avermectin solution | Soluble concentrate | Avermectin | Avermectin B1a | 5937 |
| 16 | Benzalkonium Bromide Solution | Aqueous solution | NA | Avermectin B1a | 55,587 |
| 17 | Beta-Cypermethrin Solution | Aqueous solution | Cypermethrin | Chlorpyrifos | 9.11 |
| 20 | Insecticide for water | Soluble concentrate | Bioactive ingredient | Ivermectin B1a | 8214 |
| 21 | Pesticide for water | Gel solution | Avermectin | Ivermectin B1a | 121 |
| Avermectin B1a | 3736 | ||||
| 22 | Insecticide for water | Soluble concentrate | Avermectin | Phoxim | 19.7 |
| Avermectin B1a | 1931 |
| Compounds | RT (min) | Extracted Mass (m/z) | Fragment Ions (m/z) | LOD ng/mL | Compounds | RT (min) | Extracted Mass (m/z) | Fragment Ions (m/z) | LOD ng/mL |
|---|---|---|---|---|---|---|---|---|---|
| Bendiocarb | 8.95 | 224.09173 | 167.07027/109.02841 | 1 | Aldicarb sulfone | 5.15 | 223.0747 | 86.06004/76.03930 | 1 |
| Chlorpyrifos | 11.75 | 349.93356 | 114.9615/197.92730 | 1 | Aminocarb | 4.39 | 209.12845 | 152.10699/137.08352 | 1 |
| Coumaphos | 10.96 | 363.02174 | 226.99263/306.95913 | 1 | Carbaryl | 9.27 | 202.08626 | 132.04439/124.08827 | 1 |
| Dimethoate | 7.44 | 230.0069 | 142.99623/170.96978 | 1 | Carbendazim | 6.3 | 192.07675 | 160.05054/132.05562 | 1 |
| Dodemorph | 9.78 | 282.27914 | 116.10699/98.09643 | 1 | Carbofuran | 8.94 | 222.11247 | 123.04406/165.09101 | 1 |
| Famphur | 9.55 | 326.02803 | 93.00999/142.99263 | 1 | Chlordimeform | 6.63 | 197.084 | 117.05730/152.02615 | 1 |
| Fuberidazole | 7.4 | 185.07094 | 157.07602/156.06820 | 1 | Dioxacarb | 7.46 | 224.09173 | 123.04406/167.07027 | 1 |
| Isocarbophos | 9.68 | 312.04299 | 269.99844/236.00554 | 1 | Ethoxyquin | 9.7 | 218.15394 | 148.07569/190.12264 | 1 |
| Malathion | 10.26 | 353.02529 | 195.06031/227.03238 | 1 | Fenobucarb | 10.02 | 208.13321 | 208.13321/95.04914 | 1 |
| Mevinphos | 8.12 | 225.05225 | 127.01547/67.01784 | 1 | Fipronil | 10.62 | 434.93143 | 329.95845/183.01646 | 1 |
| Monocrotophos | 6.65 | 224.06824 | 127.01547/58.02874 | 1 | Fipronil-desulfinyl | 10.54 | 386.96444 | 350.98667/281.99146 | 1 |
| Omethoate | 4.17 | 214.02974 | 214.02974/182.98754 | 1 | Fipronil-sulfide | 10.72 | 418.93651 | 57.9746/170.00863 | 1 |
| Phorate sulfoxide | 9.47 | 277.01502 | 114.96133/142.93848 | 1 | Fipronil-sulfone | 10.85 | 450.92634 | 414.94857/243.98839 | 1 |
| Phoratoxon sulfoxide | 7.61 | 261.03786 | 114.96133/128.97698 | 1 | Imazalil | 9.49 | 297.0556 | 158.97628/69.04472 | 1 |
| Phosalone | 11.06 | 367.99414 | 114.96150/138.01033 | 1 | Indoxacarb | 11.14 | 528.07799 | 203.01866/168.02107 | 1 |
| Phosmet | 9.98 | 318.00181 | 160.03930/133.02841 | 1 | Methiocarb | 10.14 | 226.08963 | 169.06816/121.06479 | 1 |
| Phoxim | 11.1 | 299.06138 | 129.04472/95.04945 | 1 | Pentachlorophenol | 11.74 | 262.83973 | 262.83973/262.83973 | 1 |
| Pirimiphos-methyl | 11.02 | 306.10358 | 108.05562/67.02907 | 1 | Pirimicarb | 8.38 | 239.15025 | 182.12879/72.04439 | 1 |
| Prometryn | 10.22 | 242.14339 | 200.09644/158.04949 | 1 | Promecarb | 10.29 | 208.13321 | 208.13321/109.06479 | 1 |
| Propazine | 10.1 | 230.1167 | 188.06975/146.02280 | 1 | Propamocarb | 4.25 | 189.15975 | 102.05496/74.02365 | 1 |
| Pyrazophos | 11.08 | 374.0934 | 194.05602/222.08732 | 1 | Propiconazole | 10.96 | 342.07706 | 158.97628/69.06988 | 1 |
| Quinalphos | 10.84 | 299.06138 | 147.05529/163.03245 | 1 | Propoxur | 8.89 | 210.11247 | 111.04406/95.04914 | 1 |
| Simazine | 9.01 | 202.0854 | 132.03230/124.08692 | 1 | Robenidine | 10.38 | 334.06208 | 138.01050/155.03705 | 1 |
| Simetryne | 9.13 | 214.11209 | 96.05562/124.08692 | 1 | Thiobencarb | 11.14 | 258.07139 | 258.07139/125.01525 | 1 |
| Thiabendazole | 7.26 | 202.04334 | 175.03245/131.06037 | 1 | Thiophanate-ethyl | 9.68 | 371.08422 | 151.03245/282.03654 | 1 |
| Triazophos | 10.42 | 314.07228 | 162.06619/114.96133 | 1 | Thiophanate-methyl | 8.85 | 343.05292 | 151.03245/311.02671 | 1 |
| Tributyl-phosphorotrithioate | 12.11 | 315.10344 | 57.06988/168.99052 | 1 | Xylazine | 7.26 | 221.1107 | 90.03720/164.05285 | 1 |
| Trichlorfon | 7.2 | 256.92985 | 127.01547/220.95318 | 1 | 2,3,5-Trimethacarb | 9.56 | 194.11756 | 135.04406/107.04914 | 2 |
| Doramectin | 12.29 | 921.49708 | 777.41843/449.25097 | 2 | 3,4,5-Trimethylphenol | 9.75 | 194.11756 | 135.04406/107.04914 | 2 |
| Isoprocarb | 9.56 | 194.11756 | 137.09609/95.04914 | 2 | Phorate sulfone | 9.55 | 293.00993 | 246.96807/114.96133 | 2 |
| Methidathion | 9.86 | 302.96913 | 145.00662/71.02399 | 2 | Thiofanox sulphoxide | 7.14 | 235.11109 | 57.06988/104.01646 | 2 |
| XMC | 9.39 | 180.10191 | 123.08044/113.99744 | 2 | Avermectin B1a | 12.23 | 895.48143 | 123.11683/153.05462 | 5 |
| Aldicard | 8.32 | 213.06682 | 95.04914/141.00593 | 5 | Deltamethrin | 12.04 | 521.00699 | 278.90762/89.05971 | 5 |
| Dichlorvos | 7.18 | 220.95318 | 127.01565/78.99452 | 5 | Flucythrinate | 11.73 | 469.19334 | 114.09134/199.0929 | 5 |
| Propetamphos | 10.34 | 282.09234 | 138.01370/156.02395 | 5 | Flumethrin | 12.33 | 532.0853 | 114.09134/73.02982 | 5 |
| Thiofanox | 9.56 | 241.09812 | 58.06513/184.07906 | 5 | Ivermectin B1a | 12.48 | 897.49708 | 753.41843/329.20872 | 5 |
| Thiofanox sulphone | 7.3 | 251.106 | 251.10600/57.06988 | 5 | Methamidophos | 2.57 | 142.00861 | 142.00861/112.01598 | 5 |
| Bifenthrin | 12.45 | 440.15987 | 181.10118/166.07770 | 10 | Amitraz | 11.97 | 294.19647 | 163.12298/122.09643 | 20 |
| Phlorpyrifos-methyl | 11.29 | 321.90226 | 142.99263/289.87605 | 10 | Tau-fluvalinate | 12.13 | 503.13438 | 181.06479/114.09134 | 20 |
| Acephate | 3.46 | 184.01918 | 113.00250/142.99263 | 20 | Fenitrothion | 10.18 | 278.02466 | 142.99263/149.02332 | 50 |
| Aldicarb sulfoxide | 4.78 | 207.07979 | 89.04195/69.05730 | 20 | Methomyl | 5.84 | 163.05357 | 88.02155/106.03211 | 50 |
| Fenvalerate | 12.05 | 437.16265 | 437.16265/114.09134 | 20 | Phorate | 11.11 | 261.0201 | 261.02010/75.02630 | 50 |
| Validamycin | 1.26 | 498.21812 | 142.08626/124.07569 | 50 | Prothiofos | 12.22 | 344.97009 | 258.92025/132.96046 | 100 |
| Bromophos ethyl | 12.21 | 392.8878 | 336.82520/161.96337 | 500 | Cyfluthrin | 12.01 | 451.0986 | 191.00250/114.09134 | 500 |
| Parathion | 10.86 | 292.04031 | 114.96133/138.00081 | 500 |
© 2019 by the authors. Licensee MDPI, Basel, Switzerland. This article is an open access article distributed under the terms and conditions of the Creative Commons Attribution (CC BY) license (http://creativecommons.org/licenses/by/4.0/).
Share and Cite
Wang, S.-Y.; Kong, C.; Chen, Q.-P.; Yu, H.-J. Screening 89 Pesticides in Fishery Drugs by Ultrahigh Performance Liquid Chromatography Tandem Quadrupole-Orbitrap Mass Spectrometer. Molecules 2019, 24, 3375. https://doi.org/10.3390/molecules24183375
Wang S-Y, Kong C, Chen Q-P, Yu H-J. Screening 89 Pesticides in Fishery Drugs by Ultrahigh Performance Liquid Chromatography Tandem Quadrupole-Orbitrap Mass Spectrometer. Molecules. 2019; 24(18):3375. https://doi.org/10.3390/molecules24183375
Chicago/Turabian StyleWang, Shou-Ying, Cong Kong, Qing-Ping Chen, and Hui-Juan Yu. 2019. "Screening 89 Pesticides in Fishery Drugs by Ultrahigh Performance Liquid Chromatography Tandem Quadrupole-Orbitrap Mass Spectrometer" Molecules 24, no. 18: 3375. https://doi.org/10.3390/molecules24183375
APA StyleWang, S.-Y., Kong, C., Chen, Q.-P., & Yu, H.-J. (2019). Screening 89 Pesticides in Fishery Drugs by Ultrahigh Performance Liquid Chromatography Tandem Quadrupole-Orbitrap Mass Spectrometer. Molecules, 24(18), 3375. https://doi.org/10.3390/molecules24183375