Synthesis of Ergosterol Peroxide Conjugates as Mitochondria Targeting Probes for Enhanced Anticancer Activity


Abstract
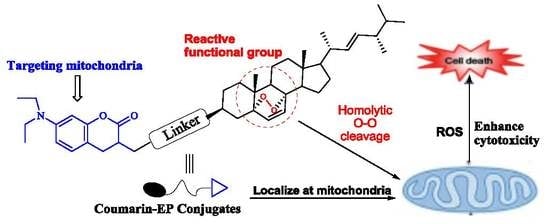
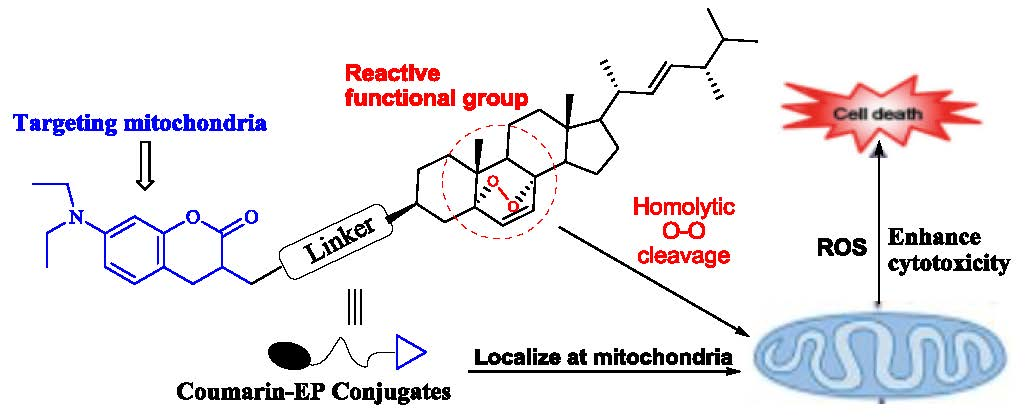
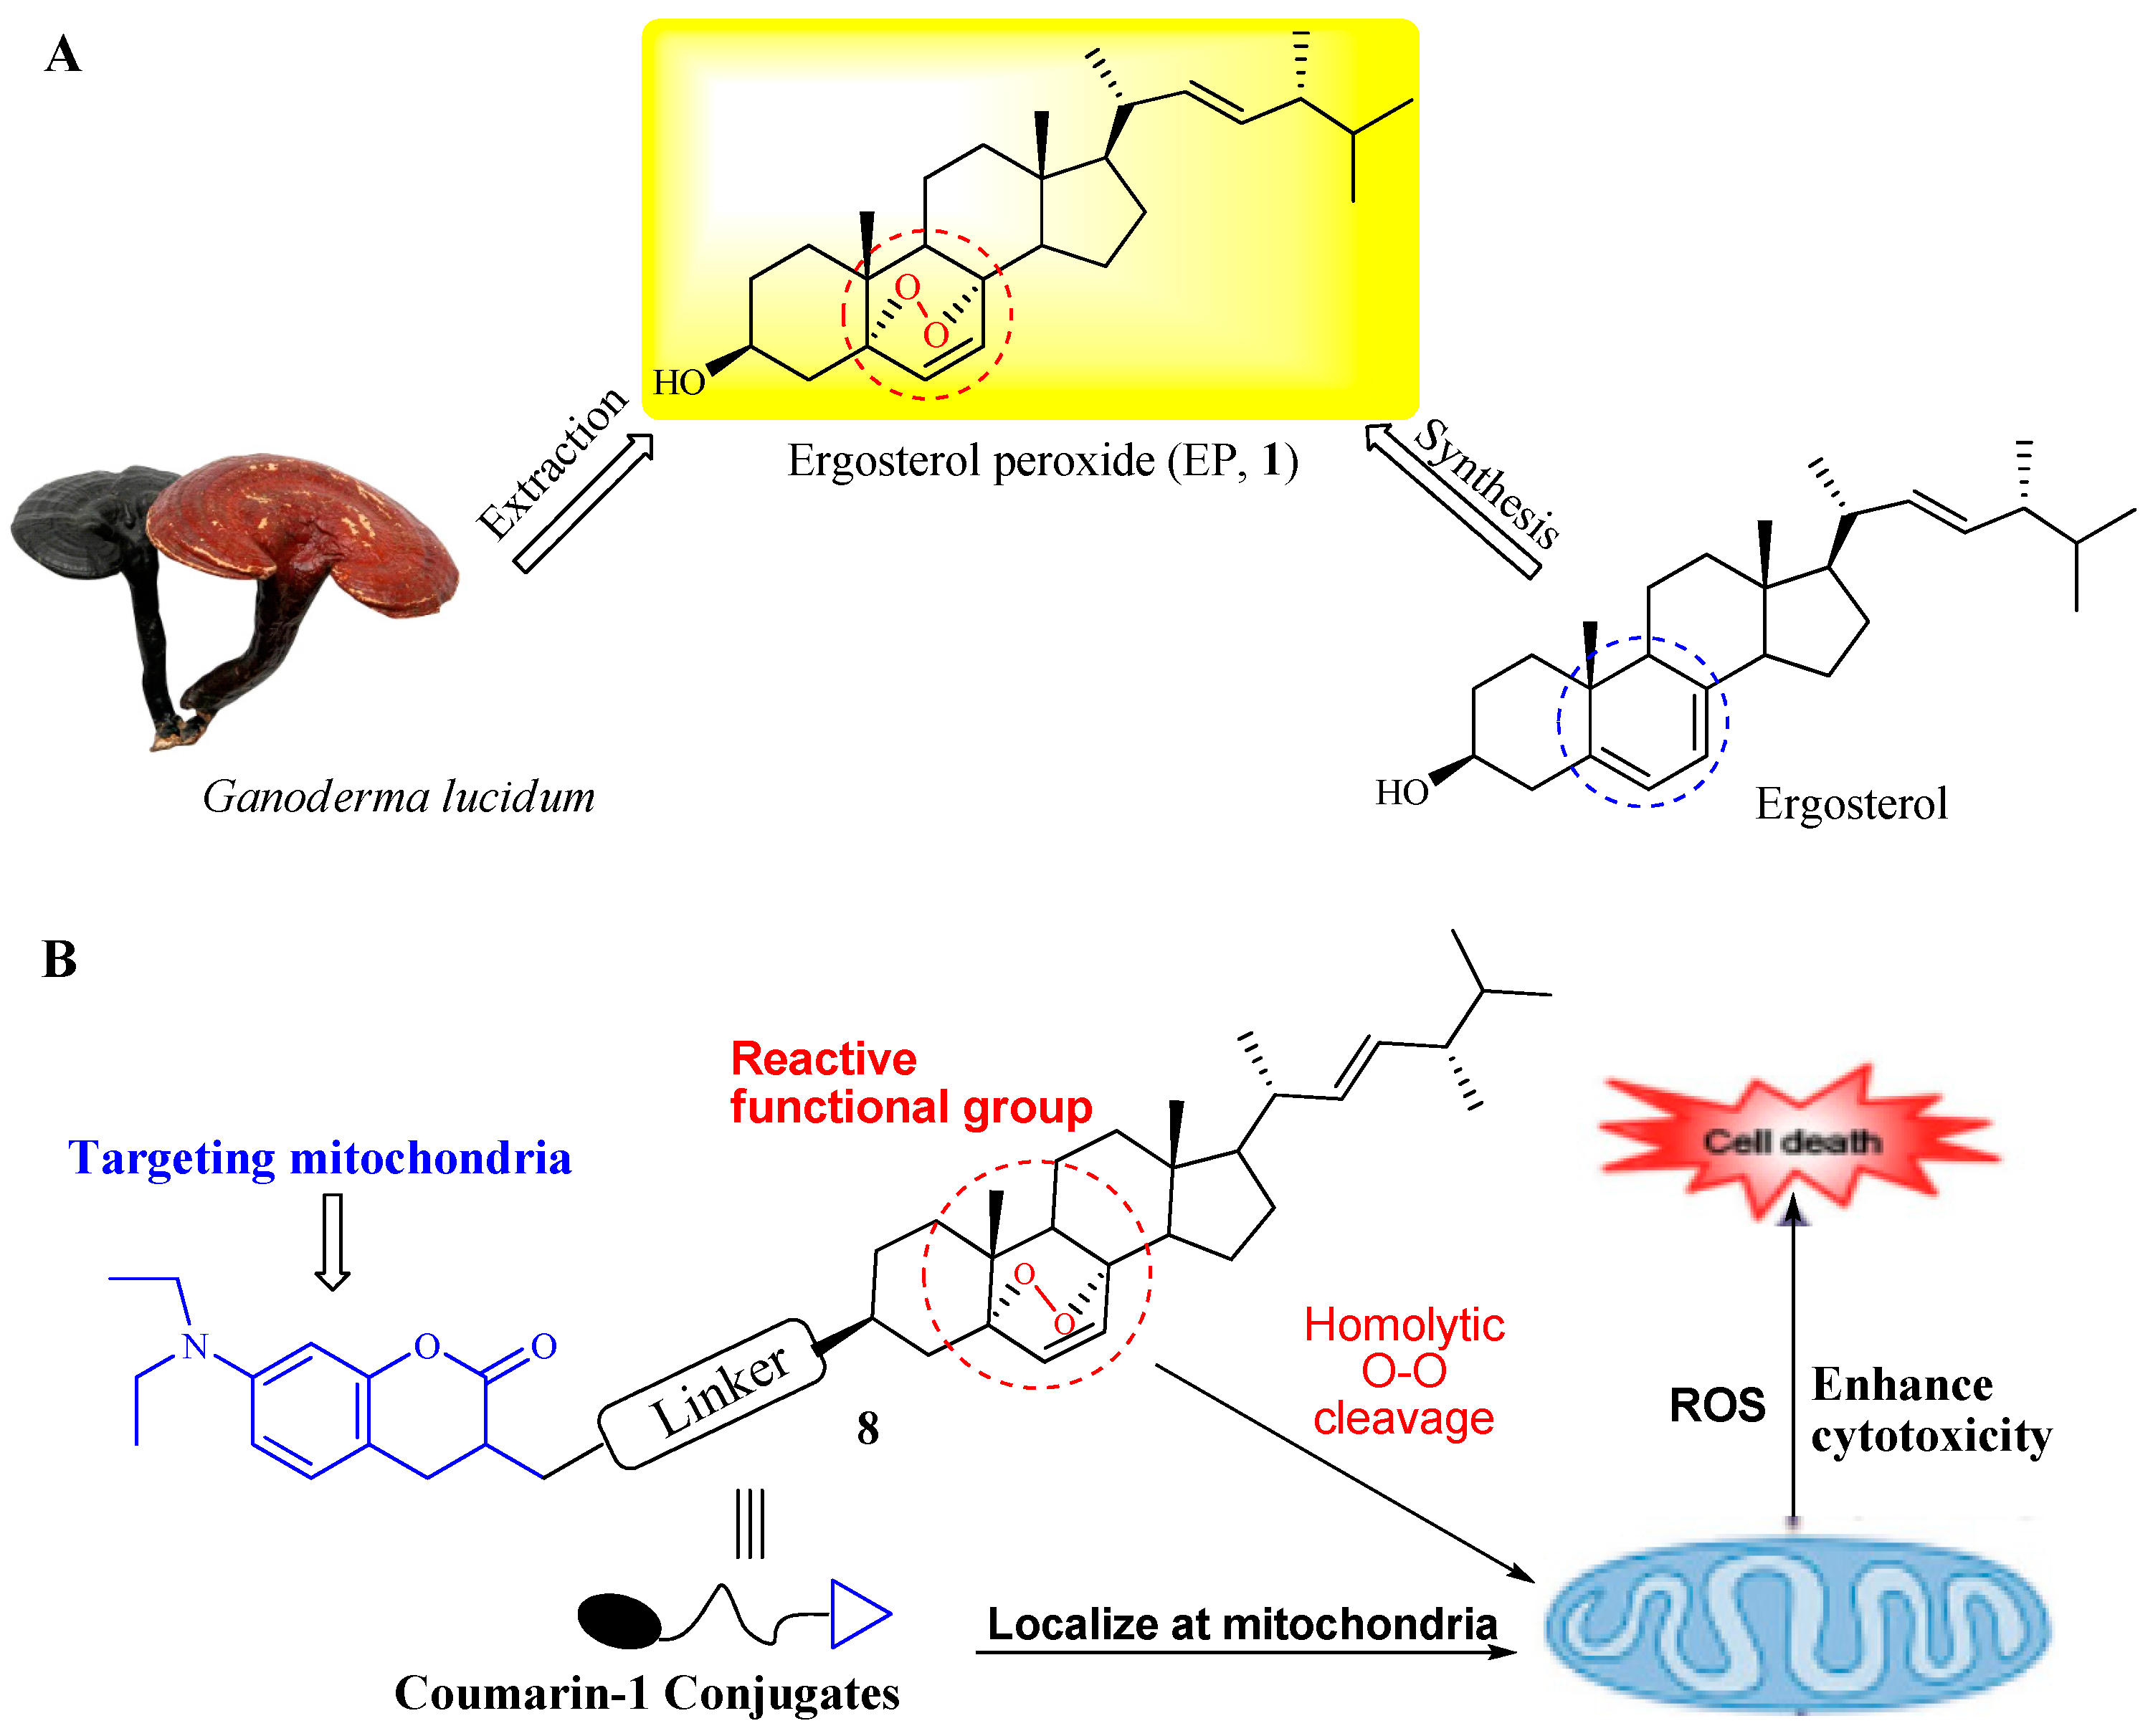
1. Introduction
2. Results and Discussion
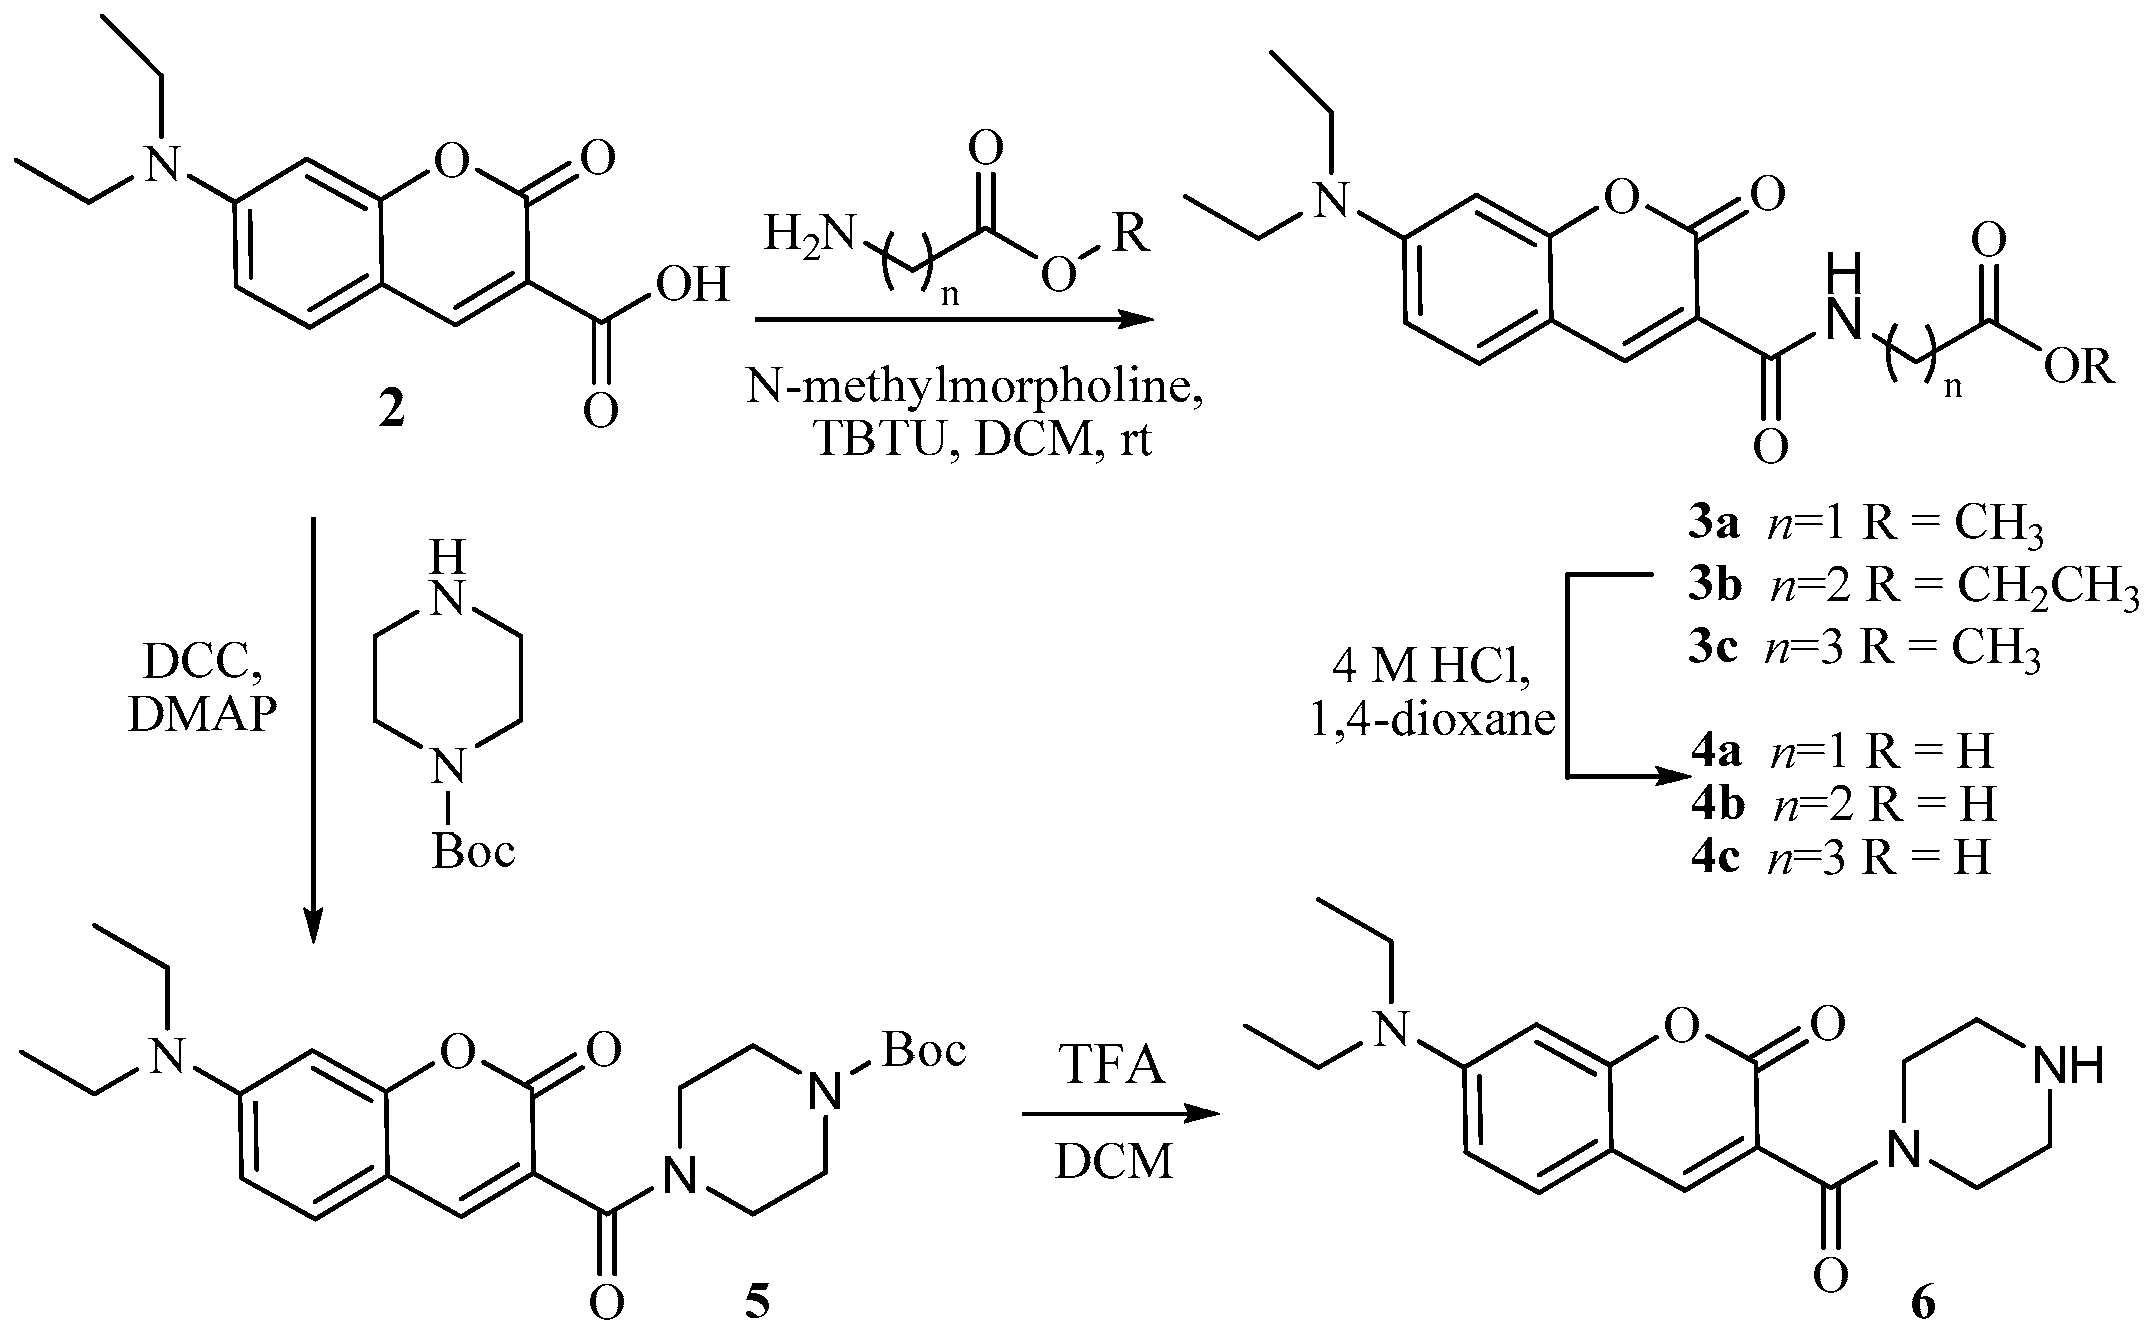
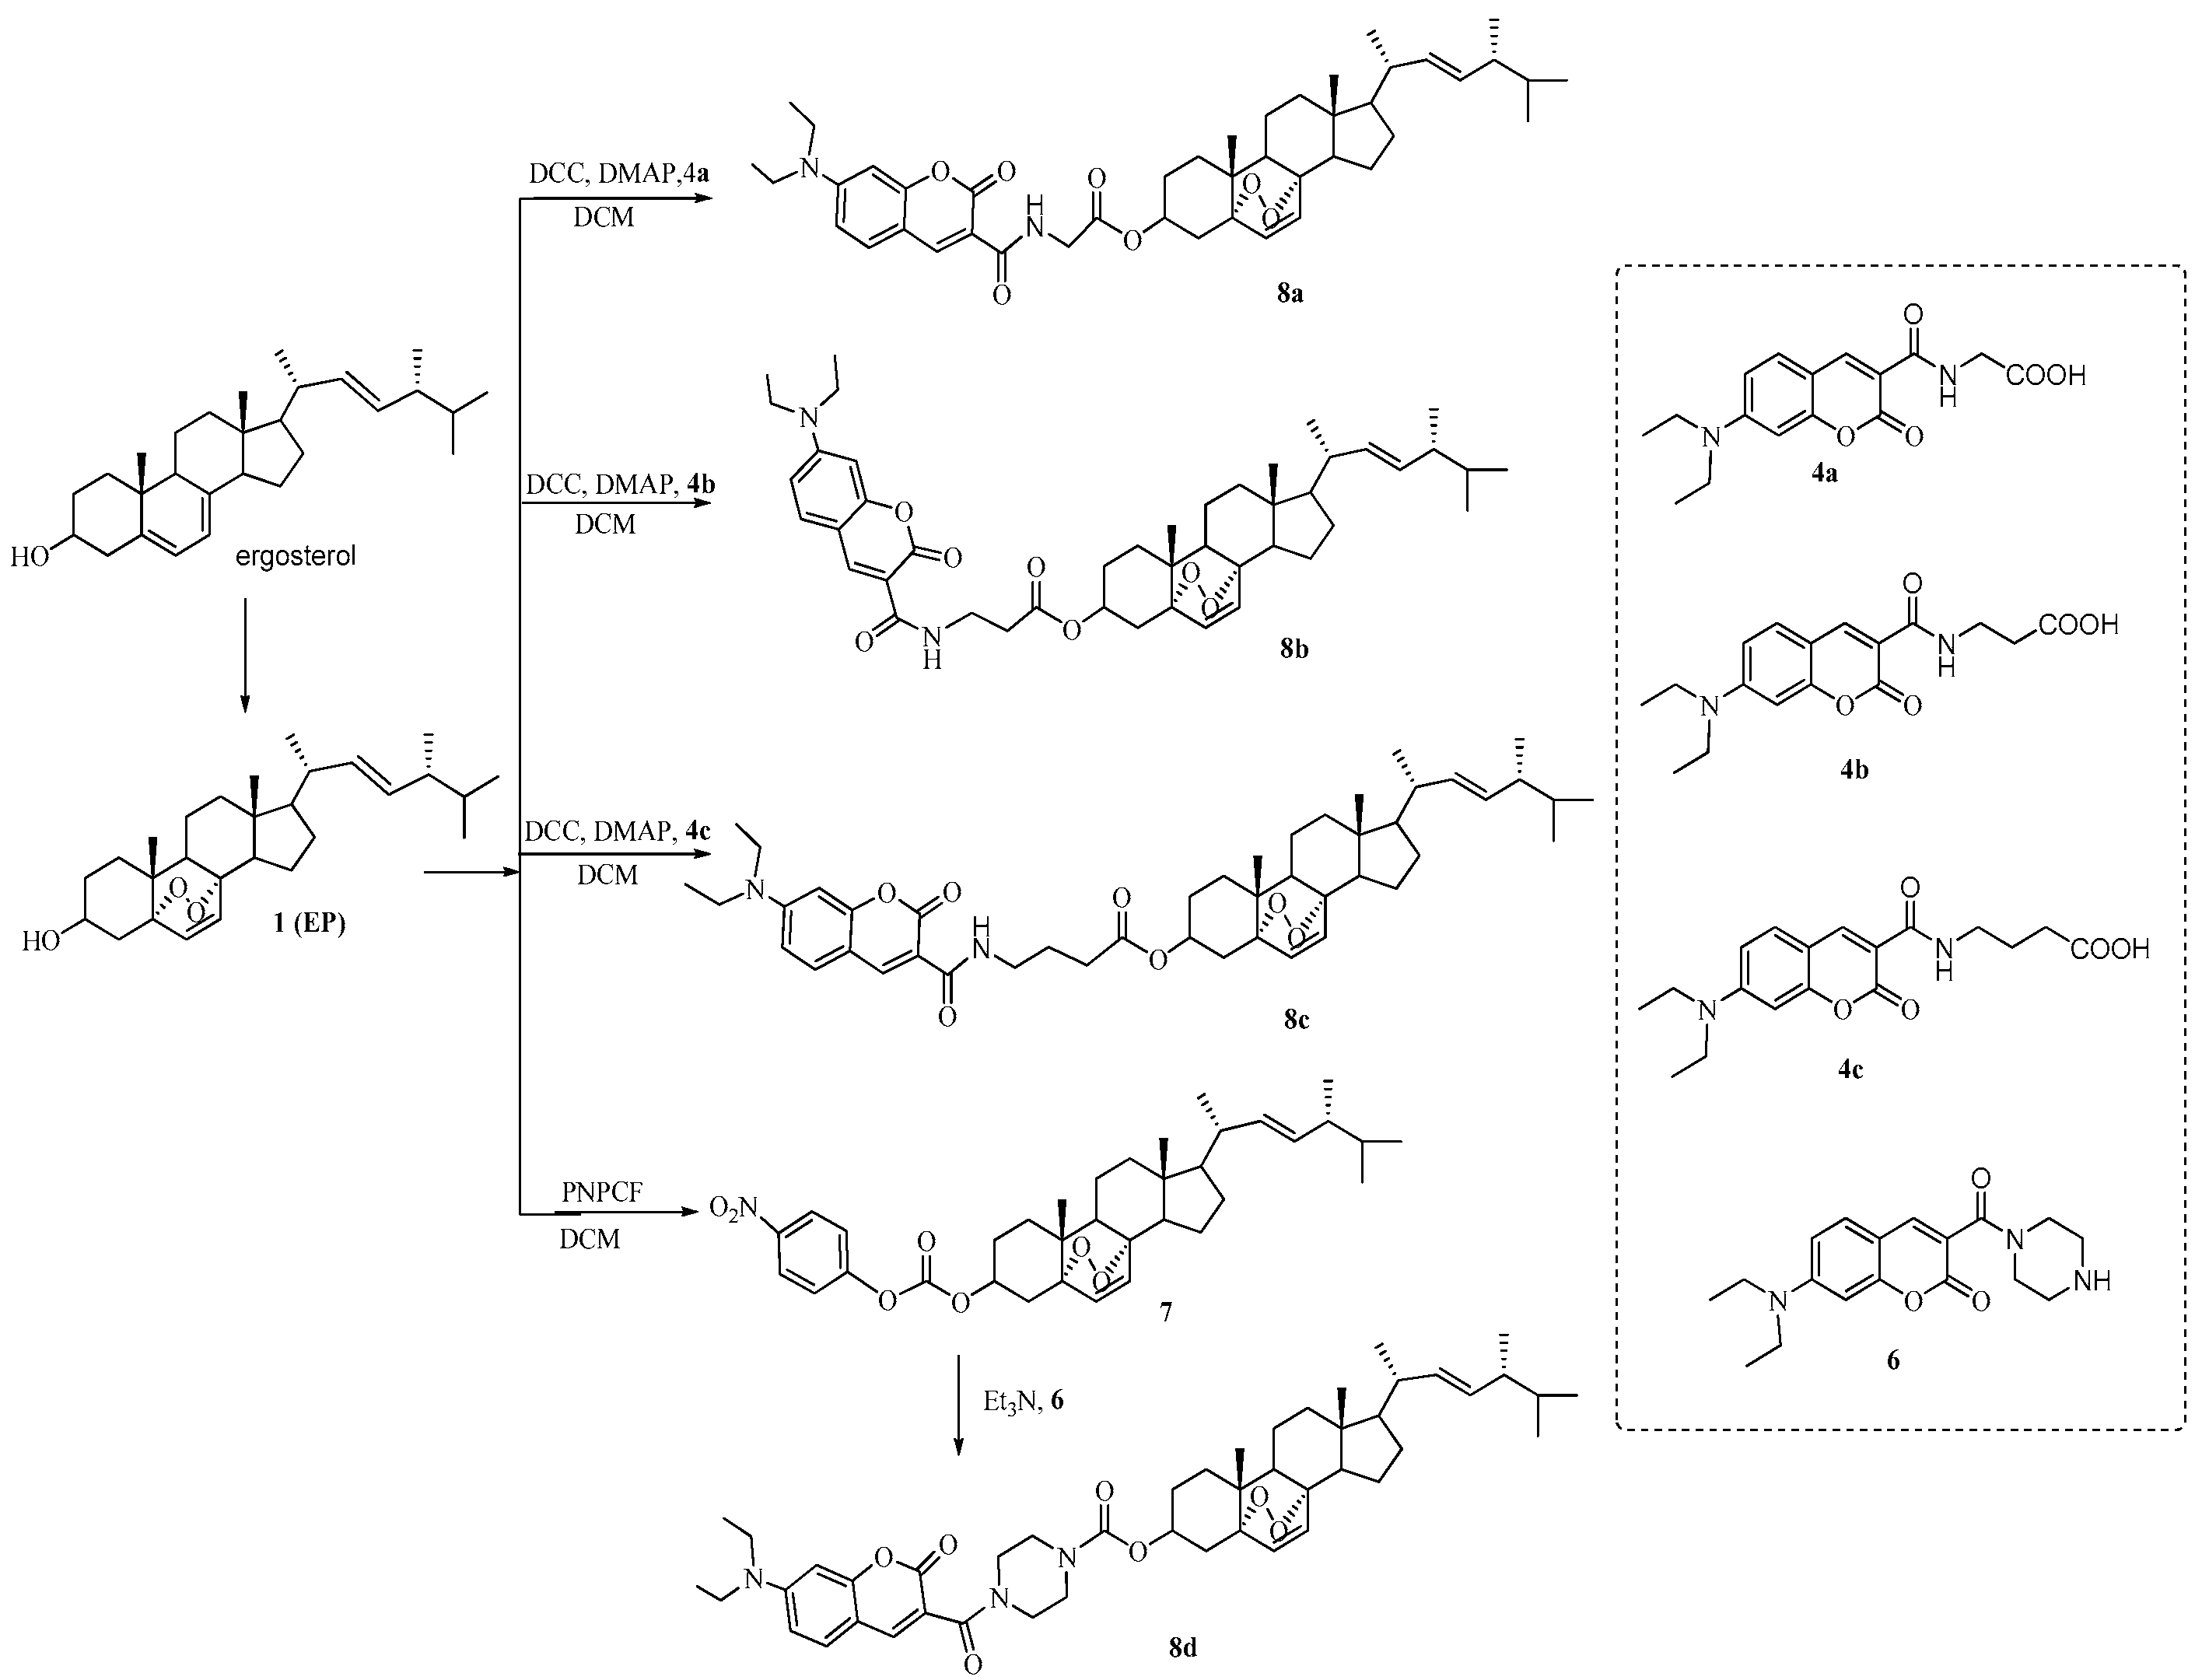
2.1. Chemistry
2.2. Optical Properties and Subcellular Localization
2.3. Biological Evaluation
2.3.1. Cytotoxic Activity
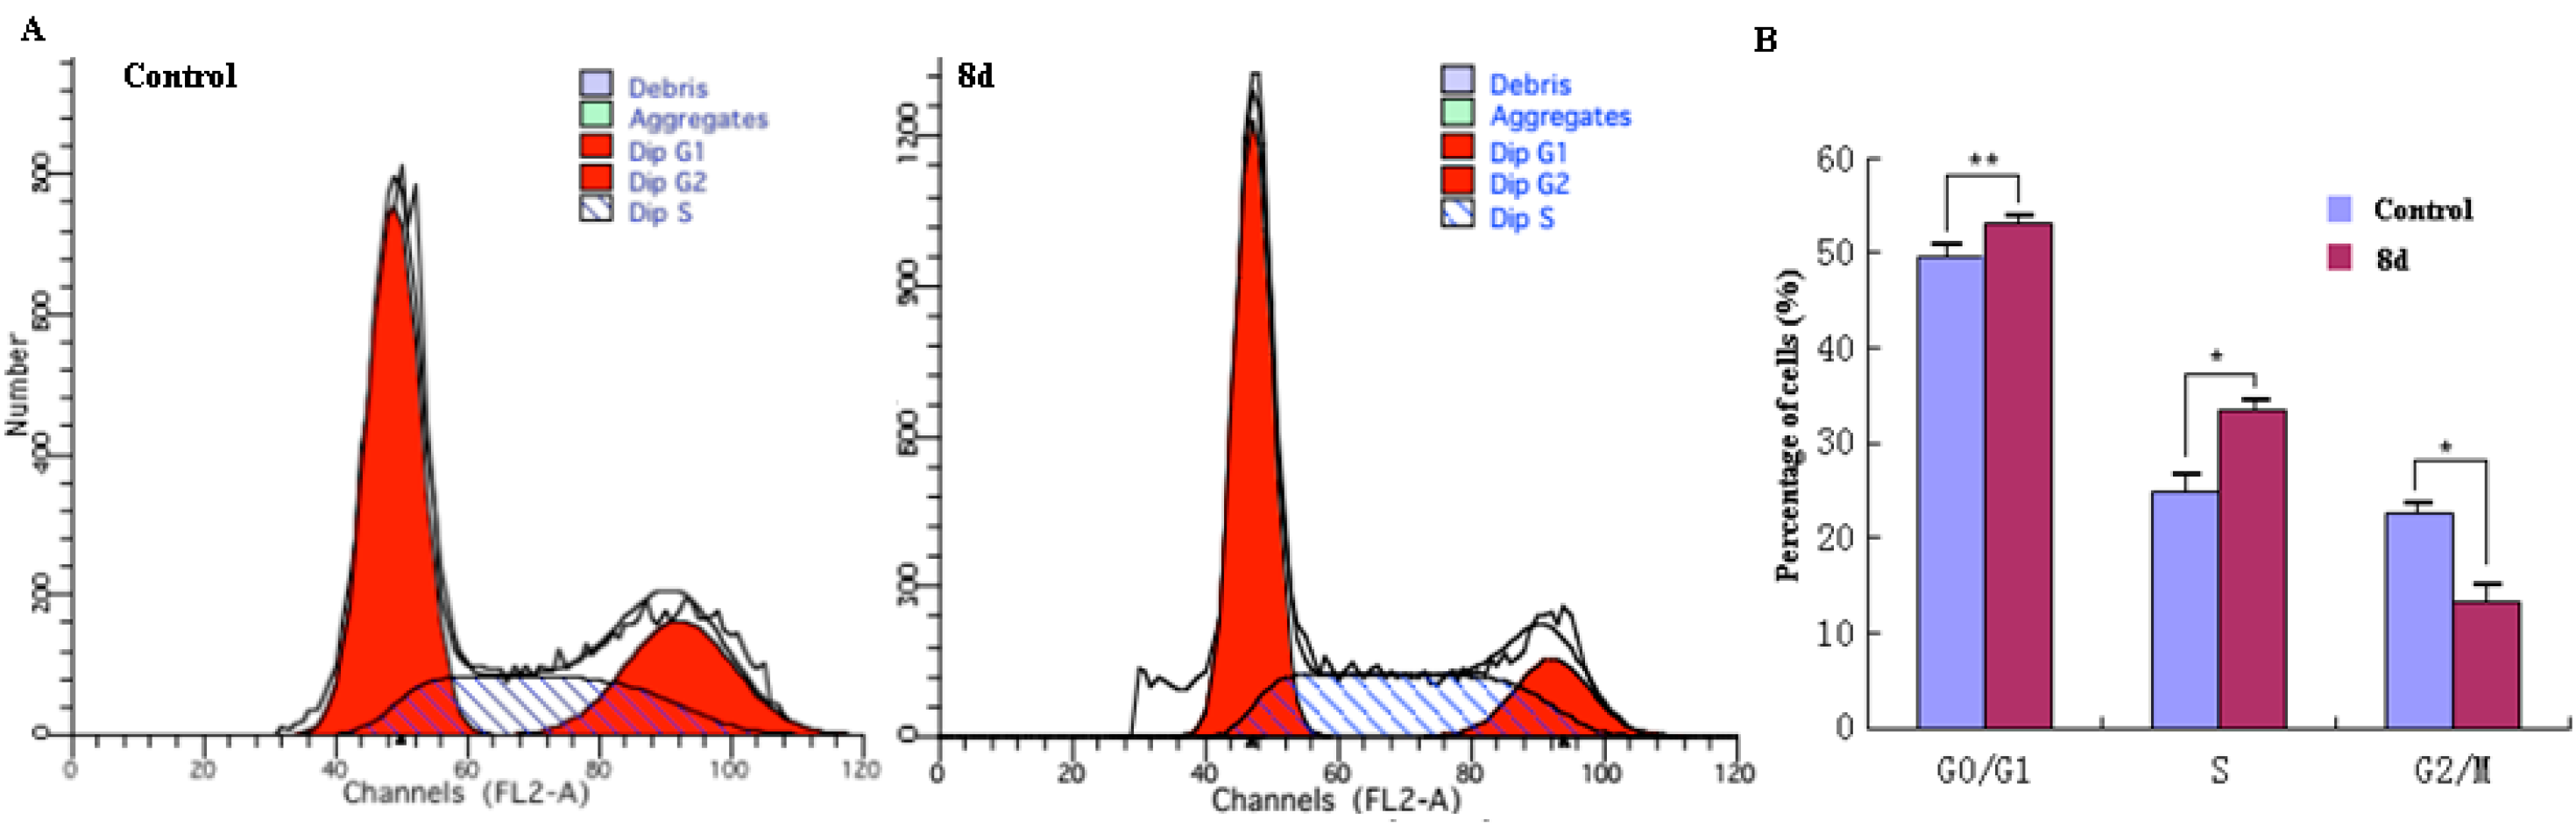
2.3.2. Effect of Probe 8d on the Cell Cycle Distribution
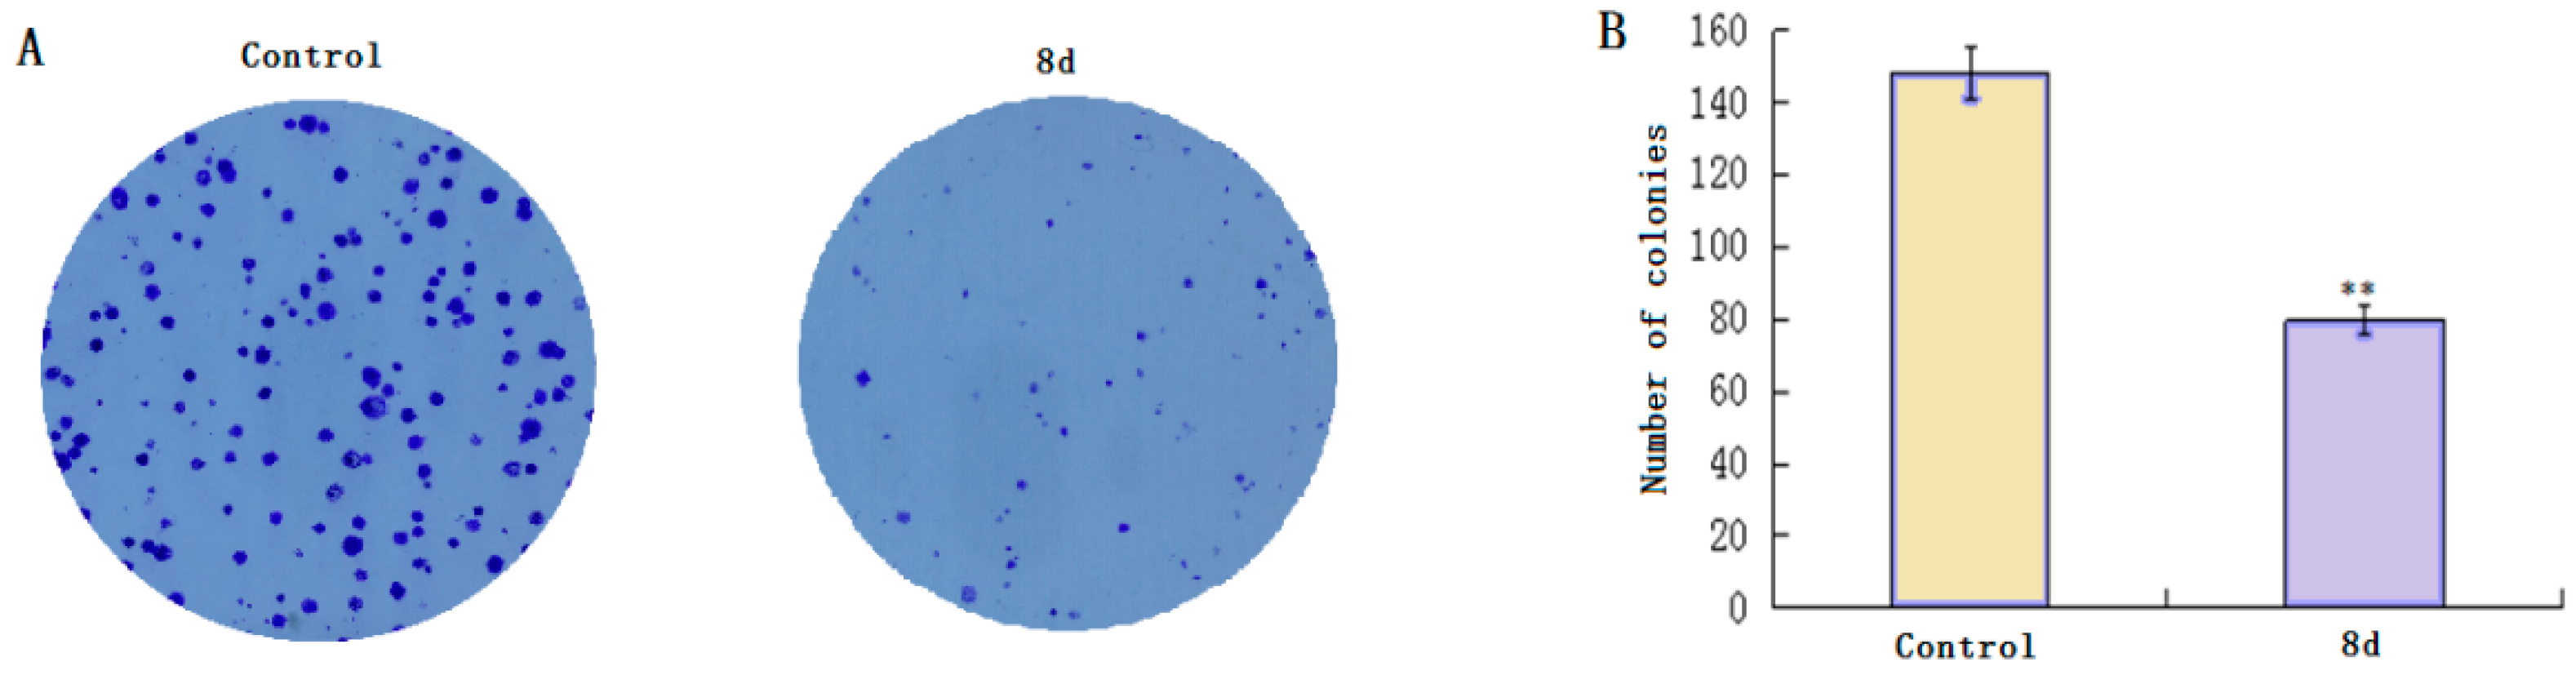
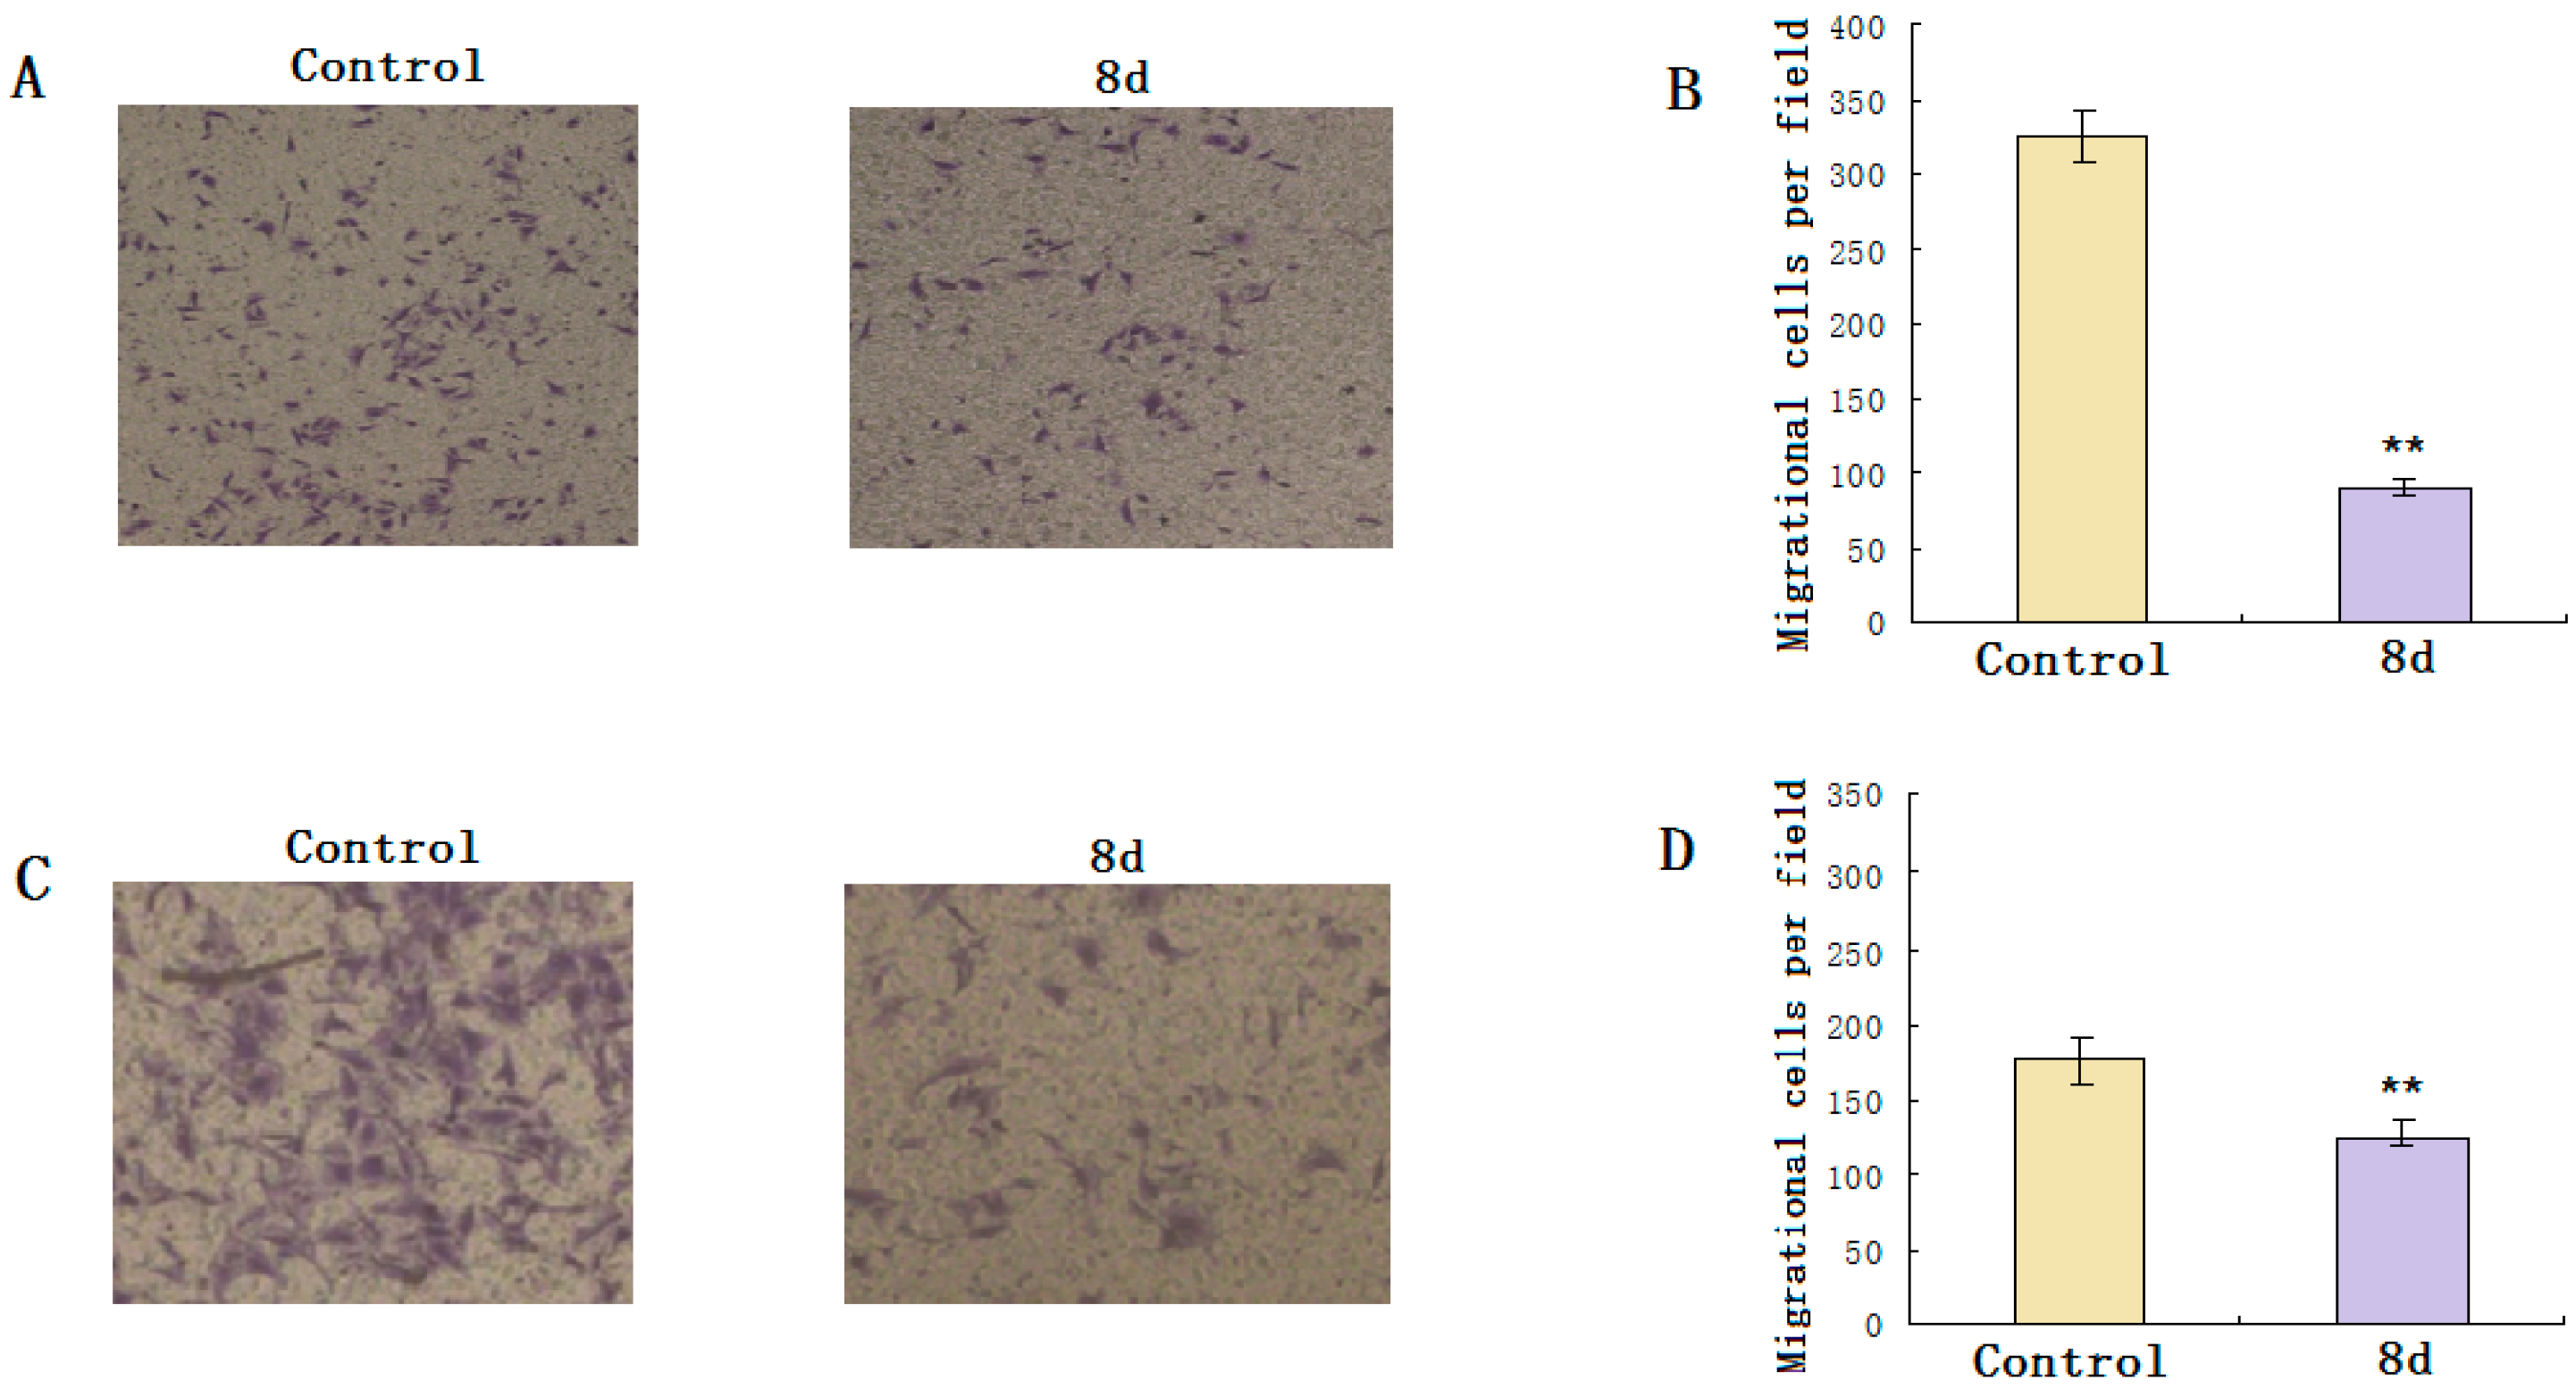
2.3.3. Effect of Probe 8d on the Cell Colony, Migration, and Invasion
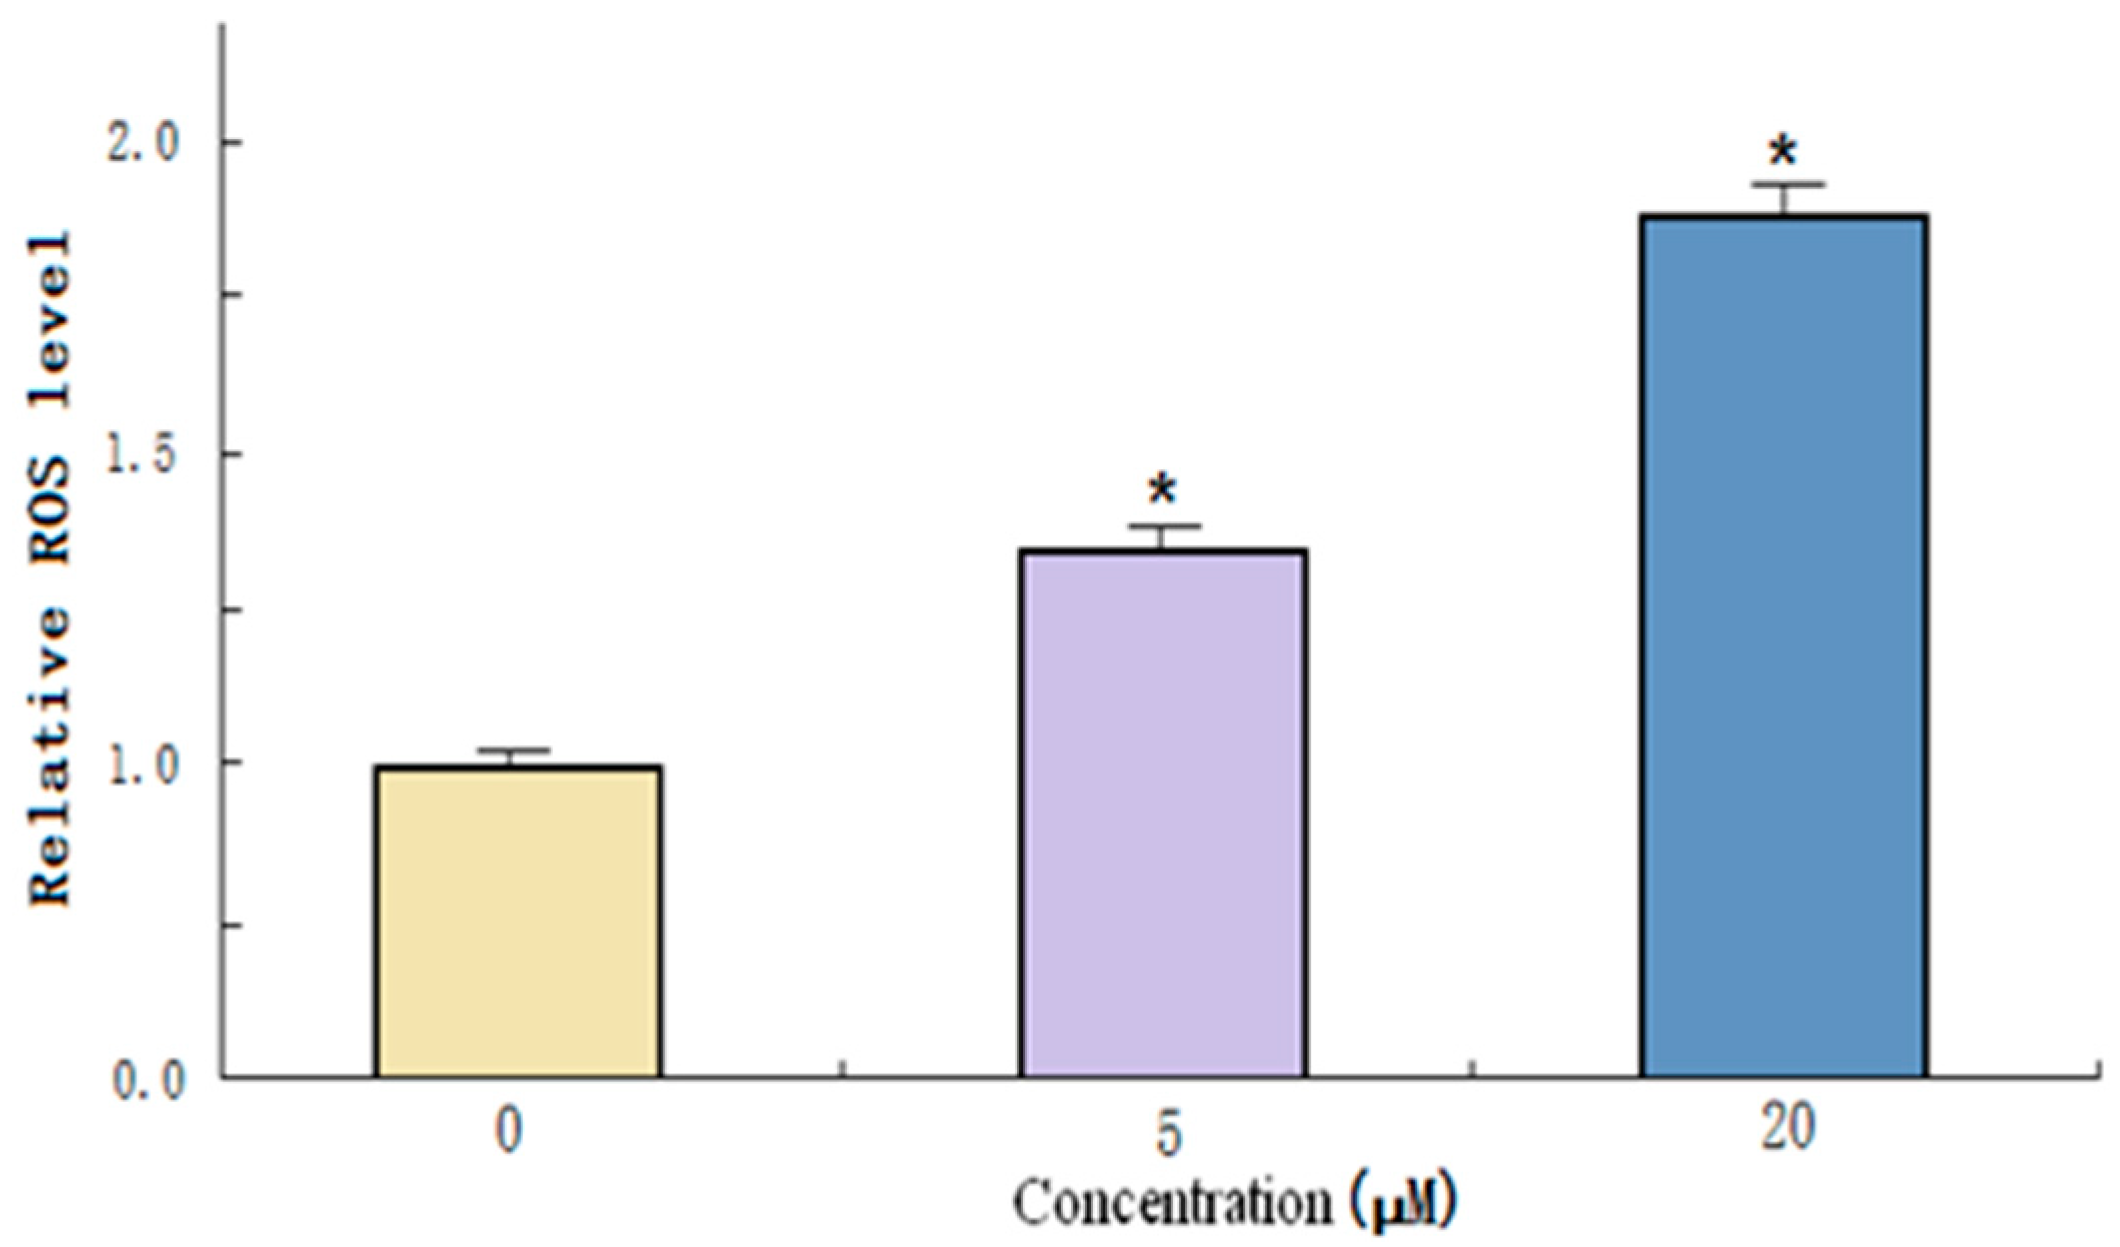
2.3.4. Effect of 8d on the Level of ROS
3. Materials and Methods
3.1. Chemistry
3.1.1. Synthesis of Ergosterol Peroxide (1)
3.1.2. Synthesis of 7-(Diethylamino)-2-Oxo-2H-Chromene-3-Carboxylic Acid (2)
3.1.3. Synthesis of Amino-Acid Ester Derivatives
3.1.4. Synthesis of 2-(7-(Diethylamino)-2-Oxo-2H-Chromene-3-Carboxamido Ester Derivatives 3a–c
3.1.5. Synthesis of 2-(7-(Diethylamino)-2-Oxo-2H-Chromene-3-Carboxamido)Carboxylic Acids 4a–c
3.1.6. Synthesis of Intermediate 6
3.1.7. Synthesis of Intermediate 7
3.1.8. Synthesis of Novel Conjugates 8a–d
3.2. Biological Evaluation
3.2.1. Cell Culture
3.2.2. MTT Assay
3.2.3. Living Cell Staining for Subcellular Localization
3.2.4. Confocal Microscopic Imaging
3.2.5. Cell Cycle Analysis
3.2.6. Colony, Invasion, And Migration Analysis
3.2.7. Measurement of Intracellular ROS in HepG2 Cells
4. Conclusions
Supplementary Materials
Author Contributions
Funding
Conflicts of Interest
Abbreviations
| HepG2, SK-Hep1 | Human liver carcinoma cell line |
| MCF-7 | human breast adenocarcinoma cell line |
| DCC | dicyclohexylcarbodi imide |
| HOBT | 1-hydroxylbenzotriazole |
| DMAP | 4-dimethylaminopyridine |
| EDCI | 1-ethyl-3-(3-dimethylaminopropyl)carbodiimide |
| PNPFC | 4-nitrophenyl chloroformate |
| CM-H2DCFDA | 5-(and-6)-chlorometry-2’,7’-dichlorodihydro-fluorescein diacetate acetyl ester |
| TBTU | 2-(1H-Benzotriazole-1- yl)-1,1,3,3-tetramethyluronium tetrafluoroborate |
| DIPEA | N,N-diisopropylethylamine |
References
- Bu, M.; Yang, B.B.; Hu, L. Natural Endoperoxides as Drug Lead Compounds. Curr. Med. Chem 2016, 23, 383–405. [Google Scholar] [CrossRef] [PubMed]
- Cui, J.; Liu, L.; Zhao, D.; Gan, C.; Huang, X.; Xiao, Q.; Qi, B.; Yang, L.; Huang, Y. Synthesis, characterization and antitumor activities of some steroidal derivatives with side chain of 17-hydrazone aromatic heterocycle. Steroids 2015, 95, 32–38. [Google Scholar] [CrossRef] [PubMed]
- Plaza-Parrochia, F.; Romero, C.; Valladares, L.; Vega, M. Endometrium and steroids, a pathologic overview. Steroids 2017, 126, 85–91. [Google Scholar] [CrossRef] [PubMed]
- Zaki, A.A.; Ali, Z.; Wang, Y.-H.; El-Amier, Y.A.; Khan, S.I.; Khan, I.A. Cytotoxic steroidal saponins from Panicum turgidum Forssk. Steroids 2017, 125, 14–19. [Google Scholar] [CrossRef]
- Callaway, E.; Cyranoski, D. Anti-parasite drugs sweep Nobel prize in medicine 2015. Nat. News 2015, 526, 174–175. [Google Scholar] [CrossRef]
- Jung, M.; Kim, H.; Lee, K.; Park, M. Naturally Occurring Peroxides with Biological Activities. Mini-Reviews Med. Chem. 2003, 3, 159–165. [Google Scholar] [CrossRef]
- Imamura, Y.; Yukawa, M.; Ueno, M.; Kimura, K.-I.; Tsuchiya, E. 3,6-Epidioxy-1,10-bisaboladiene inhibits G1-specific transcription through Swi4/Swi6 and Mbp1/Swi6 via the Hog1 stress pathway in yeast. FEBS J. 2014, 281, 4612–4621. [Google Scholar] [CrossRef]
- He, F.; Pu, J.X.; Huang, S.X.; Wang, Y.Y.; Xiao, W.L.; Li, L.M.; Liu, J.P.; Zhang, H.B.; Li, Y.; Sun, H.D. Schinalactone A, a new cytotoxic triterpenoid from Schisandrasphenanthera. Org. Lett. 2010, 12, 1208–1211. [Google Scholar] [CrossRef]
- Li, H.; Huang, H.; Shao, C.; Huang, H.; Jiang, J.; Zhu, X.; Liu, Y.; Liu, L.; Lu, Y.; Li, M.; et al. Cytotoxic Norsesquiterpene Peroxides from the Endophytic FungusTalaromyces flavusIsolated from the Mangrove PlantSonneratia apetala. J. Nat. Prod. 2011, 74, 1230–1235. [Google Scholar] [CrossRef]
- Noori, S.; Hassan, Z.M. Tehranolide inhibits cell proliferation via calmodulin inhibition, PDE, and PKA activation. Tumor Biol. 2014, 35, 257–264. [Google Scholar] [CrossRef][Green Version]
- Kim, D.-H.; Jung, S.J.; Chung, I.-S.; Lee, Y.-H.; Kim, D.-K.; Kim, S.-H.; Kwon, B.-M.; Jeong, T.-S.; Park, M.-H.; Seoung, N.-S.; et al. Ergosterol Peroxide from Flowers of Erigeron annuus L. as an Anti-Atherosclerosis Agent. Arch. Pharmacal Res. 2005, 28, 541–545. [Google Scholar] [CrossRef]
- Nowak, R.; Drozd, M.; Mendyk, E.; Lemieszek, M.; Krakowiak, O.; Kisiel, W.; Rzeski, W.; Szewczyk, K. A new method for the isolation of ergosterol and peroxyergosterol as active compounds of hygrophoropsis aurantiaca and in vitro antiproliferative activity of isolated ergosterol peroxide. Molecules 2016, 21, 946. [Google Scholar] [CrossRef] [PubMed]
- Kobori, M.; Yoshida, M.; Ohnishi-Kameyama, M.; Shinmoto, H. Ergosterol peroxide from an edible mushroom suppresses inflammatory responses in RAW264.7 macrophages and growth of HT29 colon adenocarcinoma cells. Br. J. Pharmacol. 2007, 150, 209–219. [Google Scholar] [CrossRef] [PubMed]
- Wu, Q.-P.; Xie, Y.-Z.; Deng, Z.; Li, X.-M.; Yang, W.; Jiao, C.-W.; Fang, L.; Li, S.-Z.; Pan, H.-H.; Yee, A.J.; et al. Ergosterol Peroxide Isolated from Ganoderma lucidum Abolishes MicroRNA miR-378-Mediated Tumor Cells on Chemoresistance. PLoS ONE 2012, 7, e44579. [Google Scholar] [CrossRef] [PubMed]
- Fang, S.-T.; Liu, X.; Kong, N.-N.; Liu, S.-J.; Xia, C.-H. Two new withanolides from the halophyte Datura stramonium L. Nat. Prod. Res. 2013, 27, 1965–1970. [Google Scholar] [CrossRef] [PubMed]
- Ye, G.; Fu, G.; Yang, B.B.; Zhao, S.; Cheng, J.-X.; Peng, C. Ganoderma lucidum exerts anti-tumor effects on ovarian cancer cells and enhances their sensitivity to cisplatin. Int. J. Oncol. 2011, 38, 1319–1327. [Google Scholar]
- Han, J.; Sohn, E.J.; Kim, B.; Kim, S.; Won, G.; Yoon, S.; Lee, J.; Kim, M.J.; Lee, H.; Chung, K.; et al. Upregulation of death receptor 5 and activation of caspase 8/3 play a critical role in ergosterol peroxide induced apoptosis in DU 145 prostate cancer cells. Cancer Cell Int. 2014, 14, 117. [Google Scholar] [CrossRef]
- Zhu, R.; Zheng, R.; Deng, Y.; Chen, Y.; Zhang, S. Ergosterol peroxide from Cordyceps cicadae ameliorates TGF-β1-induced activation of kidney fibroblasts. Phytomedicine 2014, 21, 372–378. [Google Scholar] [CrossRef] [PubMed]
- Rhee, Y.-H.; Jeong, S.-J.; Lee, H.-J.; Lee, H.-J.; Koh, W.; Jung, J.H.; Kim, S.-H.; Sung-Hoon, K. Inhibition of STAT3 signaling and induction of SHP1 mediate antiangiogenic and antitumor activities of ergosterol peroxide in U266 multiple myeloma cells. BMC Cancer 2012, 12, 28. [Google Scholar] [CrossRef]
- Bu, M.; Cao, T.; Li, H.; Guo, M.; Yang, B.B.; Zeng, C.; Hu, L. Synthesis of 5α,8α-Ergosterol Peroxide 3-Carbamate Derivatives and a Fluorescent Mitochondria-Targeting Conjugate for Enhanced Anticancer Activities. ChemMedChem 2017, 12, 466–474. [Google Scholar] [CrossRef]
- Bu, M.; Cao, T.; Li, H.; Guo, M.; Yang, B.B.; Zeng, C.; Zhou, Y.; Zhang, N.; Hu, L. Synthesis and biological evaluation of novel steroidal 5α,8α-epidioxyandrost-6-ene-3β-ol-17-(O-phenylacetamide)oxime derivatives as potential anticancer agents. Bioorganic Med. Chem. Lett. 2017, 27, 3856–3861. [Google Scholar] [CrossRef] [PubMed]
- Bu, M.; Cao, T.; Li, H.; Guo, M.; Yang, B.B.; Zhou, Y.; Zhang, N.; Zeng, C.; Hu, L. Synthesis and biological evaluation of novel steroidal 5α,8α-endoperoxide derivatives with aliphatic side-chain as potential anticancer agents. Steroids 2017, 124, 46–53. [Google Scholar] [CrossRef] [PubMed]
- Li, X.; Wu, Q.; Bu, M.; Hu, L.; Du, W.W.; Jiao, C.; Pan, H.; Sdiri, M.; Wu, N.; Xie, Y.; et al. Ergosterol peroxide activates Foxo3-mediated cell death signaling by inhibiting AKT and c-Myc in human hepatocellular carcinoma cells. Oncotarget 2016, 7, 33948–33959. [Google Scholar] [CrossRef] [PubMed]
- Jia, M.; Zhao, R.; Xu, B.; Yan, W.; Chu, F.; Gu, H.; Xie, T.; Xiang, H.; Ren, J.; Chen, D.; et al. Synthesis and biological activity evaluation of novel peroxo-bridged derivatives as potential anti-hepatitis B virus agents. MedChemComm 2016, 8, 148–151. [Google Scholar] [CrossRef] [PubMed]
- Kovacic, P.; Somanathan, R. Recent developments in the mechanism of anticancer agents based on electron transfer, reactive oxygen species and oxidative stress. Anti-Cancer Agents Med. Chem. 2011, 11, 658–668. [Google Scholar] [CrossRef]
- Li-Weber, M. Targeting apoptosis pathways in cancer by Chinese medicine. Cancer Lett. 2013, 332, 304–312. [Google Scholar] [CrossRef] [PubMed]
- Bauch, M.; Klaper, M.; Linker, T. Intermediates in the cleavage of endoperoxides. J. Phys. Org. Chem. 2016, 30, e3607. [Google Scholar] [CrossRef]
- Florean, C.; Song, S.; Dicato, M.; Diederich, M. Redox biology of regulated cell death in cancer: A focus on necroptosis and ferroptosis. Free. Radic. Boil. Med. 2019, 134, 177–189. [Google Scholar] [CrossRef] [PubMed]
- Ling, T.; Lang, W.H.; Martinez-Montemayor, M.M.; Rivas, F. Development of ergosterol peroxide probes for cellular localisation studies. Org. Biomol. Chem. 2019, 17, 5223–5229. [Google Scholar] [CrossRef] [PubMed]
- Jin, H.; Ko, Y.S.; Park, S.W.; Chang, K.C.; Kim, H.J. 13-Ethylberberine Induces Apoptosis through the Mitochondria-Related Apoptotic Pathway in Radiotherapy-Resistant Breast Cancer Cells. Molecules 2019, 24, 2448. [Google Scholar] [CrossRef] [PubMed]
- Zhang, X.; Ba, Q.; Gu, Z.; Guo, D.; Zhou, Y.; Xu, Y.; Wang, H.; Ye, D.; Liu, H. Fluorescent Coumarin-Artemisinin Conjugates as Mitochondria-Targeting Theranostic Probes for Enhanced Anticancer Activities. Chem. - A Eur. J. 2015, 21, 17415–17421. [Google Scholar] [CrossRef] [PubMed]
- Caputo, C.A.; Gross, M.A.; Lau, V.W.-H.; Cavazza, C.; Lotsch, B.V.; Reisner, E. Photocatalytic Hydrogen Production using Polymeric Carbon Nitride with a Hydrogenase and a Bioinspired Synthetic Ni Catalyst**. Angew. Chem. 2014, 126, 11722–11726. [Google Scholar] [CrossRef] [PubMed][Green Version]
- Liu, Y.; Lok, C.-N.; Ko, B.C.-B.; Shum, T.Y.-T.; Wong, M.K.; Che, C.-M. Subcellular Localization of a Fluorescent Artemisinin Derivative to Endoplasmic Reticulum. Org. Lett. 2010, 12, 1420–1423. [Google Scholar] [CrossRef] [PubMed]
- Sun, T.; Guan, X.; Zheng, M.; Jing, X.; Xie, Z. Mitochondria-Localized Fluorescent BODIPY-Platinum Conjugate. ACS Med. Chem. Lett. 2015, 6, 430–433. [Google Scholar] [CrossRef] [PubMed]
- Wu, S.; Cao, Q.; Wang, X.; Cheng, K.; Cheng, Z. Design, synthesis and biological evaluation of mitochondria targeting theranostic agents. Chem. Commun. 2014, 50, 8919–8922. [Google Scholar] [CrossRef] [PubMed]
- Kumar, R.; Han, J.; Lim, H.-J.; Ren, W.X.; Lim, J.-Y.; Kim, J.-H.; Kim, J.S. Mitochondrial Induced and Self-Monitored Intrinsic Apoptosis by Antitumor Theranostic Prodrug: In Vivo Imaging and Precise Cancer Treatment. J. Am. Chem. Soc. 2014, 136, 17836–17843. [Google Scholar] [CrossRef] [PubMed]
- Hu, Q.; Gao, M.; Feng, G.; Liu, B. Mitochondria-Targeted Cancer Therapy Using a Light-Up Probe with Aggregation-Induced-Emission Characteristics. Angew. Chem. 2014, 126, 14449–14453. [Google Scholar] [CrossRef]
- Chao, W.; Lv, W.; Zhen, X.; Long, Y. A fret-based fluorescent probe for imaging H2S in living cells. Tetrahedron Lett. 2013, 54, 6937–6939. [Google Scholar]
- Xie, H.; Mire, J.; Kong, Y.; Chang, M.; Hassounah, H.A.; Thornton, C.N.; Sacchettini, J.C.; Cirillo, J.D.; Rao, J. Rapid point-of-care detection of the tuberculosis pathogen using a BlaC-specific fluorogenic probe. Nat. Chem. 2012, 4, 802–809. [Google Scholar] [CrossRef] [PubMed]
- Wang, L.-H.; Chang, G.-Q.; Zhang, H.-J.; Wang, J.; Lin, Y.-N.; Jin, W.-N.; Li, H.-W.; Gao, W.; Wang, R.-J.; Li, Q.-H.; et al. Neutrophil gelatinase-associated lipocalin regulates intracellular accumulation of Rh123 in cancer cells. Genes Cells 2012, 17, 205–217. [Google Scholar] [CrossRef]
- Wang, H.; Joseph, J.A. Quantifying cellular oxidative stress by dichlorofluorescein assay using microplate reader. Free Radic. Biol. Med. 1999, 27, 612–616. [Google Scholar] [CrossRef]
Sample Availability: Samples of the compounds 8a–d are available from the authors. |


| Entry | Probe | λex (nm) [b] | λem (nm) [c] | Stokes Shift (nm) |
|---|---|---|---|---|
| 1 | 8a | 479 | 422.5 | 56.5 |
| 2 | 8b | 475 | 422 | 53 |
| 3 | 8c | 476 | 421.5 | 54.5 |
| 4 | 8d | 469.5 | 404 | 65.5 |
| 5 | 2 | 470.5 | 406 | 64.5 |
| Comp. | IC50 (μM) [a] | ||
|---|---|---|---|
| HepG2 | SK-Hep1 | MCF-7 | |
| 8a | 12.34 ± 0.49 | 10.43 ± 0.88 | 14.80 ± 0.28 |
| 8b | 9.46 ± 0.35 | 11.70 ± 0.28 | 13.70 ± 0.28 |
| 8c | 6.74 ± 0.32 | 5.92 ± 0.53 | 7.45 ± 0.50 |
| 8d | 6.60 ± 0.16 | 8.10 ± 0.28 | 10.62 ± 0.10 |
| EP(1) | 23.15 ± 0.18 | 19.25 ± 0.60 | 26.06 ± 0.46 |
| 2 | >100 | >100 | >100 |
| Cisplatin | 0.65 ± 0.05 | 2.42 ± 0.06 | 6.64 ± 0.16 |
© 2019 by the authors. Licensee MDPI, Basel, Switzerland. This article is an open access article distributed under the terms and conditions of the Creative Commons Attribution (CC BY) license (http://creativecommons.org/licenses/by/4.0/).
Share and Cite
Bu, M.; Li, H.; Wang, H.; Wang, J.; Lin, Y.; Ma, Y. Synthesis of Ergosterol Peroxide Conjugates as Mitochondria Targeting Probes for Enhanced Anticancer Activity. Molecules 2019, 24, 3307. https://doi.org/10.3390/molecules24183307
Bu M, Li H, Wang H, Wang J, Lin Y, Ma Y. Synthesis of Ergosterol Peroxide Conjugates as Mitochondria Targeting Probes for Enhanced Anticancer Activity. Molecules. 2019; 24(18):3307. https://doi.org/10.3390/molecules24183307
Chicago/Turabian StyleBu, Ming, Hongling Li, Haijun Wang, Jing Wang, Yu Lin, and Yukun Ma. 2019. "Synthesis of Ergosterol Peroxide Conjugates as Mitochondria Targeting Probes for Enhanced Anticancer Activity" Molecules 24, no. 18: 3307. https://doi.org/10.3390/molecules24183307
APA StyleBu, M., Li, H., Wang, H., Wang, J., Lin, Y., & Ma, Y. (2019). Synthesis of Ergosterol Peroxide Conjugates as Mitochondria Targeting Probes for Enhanced Anticancer Activity. Molecules, 24(18), 3307. https://doi.org/10.3390/molecules24183307