Article

Complexes of Glycolic Acid with Nitrogen Isolated in Argon Matrices. I. Structures and Thermal Effects

1
Faculty of Chemistry, University of Wroclaw, Joliot-Curie 14, 50-383 Wroclaw, Poland
2
Department of Chemistry, University of Jyvaskyla, P.O.Box 35, 40014 Jyvaskyla, Finland
*
Authors to whom correspondence should be addressed.
Molecules 2019, 24(18), 3262; https://doi.org/10.3390/molecules24183262
Submission received: 29 July 2019 / Revised: 28 August 2019 / Accepted: 5 September 2019 / Published: 7 September 2019
(This article belongs to the Special Issue Photochemical Reactions at Low Temperature)

Abstract

:
Molecular complexes between glycolic acid and nitrogen were studied in a low-temperature argon matrix with FTIR spectroscopy, and supported by MP2 and BLYPD3 calculations. The calculations indicate 11 and 10 stable complex structures at the MP2 and BLYPD3 levels of theories, respectively. However, only one hydrogen-bonded complex structure involving the most stable SSC conformer of glycolic acid was found experimentally, where the nitrogen molecule is bound with the carboxylic OH group of the SSC conformer. The complex shows a rich site structure variation upon deposition of the matrix in different temperatures and upon annealing experiments, which provide interesting prospects for site-selective chemistry.

Graphical Abstract

1. Introduction

Hydrogen bonding is a significant non-covalent interaction that plays an important role in many areas of biology and chemistry [1,2]. Weakly bound molecular complexes with hydrogen bond or van der Waals interactions are frequently encountered in atmospheric chemistry and are known to affect both chemical and photochemical processes [3,4,5]. In complexes, the electronic, vibrational and rotational levels are disturbed as a result of interaction between complex subunits, and this leads to changes in spectral and photochemical characteristics of the complex components. On the other hand, weakly bound complexes frequently represent shallow energy minima on their potential energy surfaces, which lead to thermodynamic instability of such species at room temperature. From this point of view, the low temperature matrix isolation technique coupled with different spectroscopic methods is a very useful technique to trap and to study weakly bound complexes [6,7]. Recently, it was demonstrated that matrix isolation technique connected with computational studies is a powerful approach to study hydrogen bonds and other intermolecular interactions in complexes involving atmospheric constituents or species related to tropospheric IR-induced chemistry [8,9,10,11,12,13,14].
Glycolic acid (GA), the simplest α-hydroxycarboxylic acid with two OH groups, is capable of forming both intra- and intermolecular hydrogen bonds. As such, GA is a model species to study in order to understand how competing OH-groups in the molecule affect the chemical reactivity and capability to form molecular complexes. Several reports on monomeric GA isolated in low-temperature matrices as well as its transformations have appeared in the literature [15,16,17,18,19,20]. The structures of the three most stable GA species are presented in Figure 1. Among the monomer structures, the most stable conformer is the SSC form, which is stabilized by the O–H⋯O intramolecular hydrogen bond. This conformer is present in the gas phase and in low-temperature matrices with an estimated population at room temperature of ca. 95%. A small amount of two less stable GAC and AAT conformers has also been detected [19,20].
Contrary to the monomeric GA, only two studies on GA complexes in low-temperature matrices have appeared in literature. Recently, a study on GA dimers revealed for the first time information on three cyclic GA dimers identified in an argon matrix [21]. All of these dimers were formed between SSC conformers: one dimer with hydrogen bonds between the two carboxylic OH groups, one structure with hydrogen bonds between the two alcoholic OH groups and a mixed structure with one OH group from the carboxylic group acting as proton donor and the alcoholic OH group on the other subunit acting as proton acceptor. Molecular complexes between GA and molecular nitrogen were identified in a study applying Raman spectroscopy for argon-trapped species upon high vibrational excitation experiments [22]. In that study, nitrogen was found to form complexes with two GA conformers (SSC and AAT) in low temperature argon environment. However, this study did not scrutinise the actual molecular complex structures involved but only made conclusions of different GA⋯N2 systems involved based on their behaviour upon 532 nm irradiation.
These Raman spectroscopy combined with visible light irradiation experiments acted as a prelude to our study presented here. In this paper, we present results of a combined study employing both theoretical methods and FTIR matrix isolation studies on complexes formed between glycolic acid and nitrogen molecule. The target is to study and to identify the 1:1 complexes GA forms with molecular nitrogen. This research is important in order to understand which type of complexes can be formed, if such species are experimentally detected, and, as these formed complexes are used as precursors for near-infrared irradiation experiments, if their photo-induced chemistry differ from isolated GA monomers. The study on the NIR irradiated GA-N2 complexes is reported separately in a following paper taking advantage of the results presented here.

2. Experimental and Computational Details

The matrix samples were prepared by passing mixtures of high purity argon (Messer, 5.0) and nitrogen (Messer, 6.0) with the N2/Ar ratios of 1/4000 through the glass U-tube with glycolic acid (GA) situated outside the cryostat chamber. Optimizing the deposition temperature and matrix flow rate it was possible to obtain matrices containing nearly exclusively monomeric GA and GA⋯N2 complexes of 1:1 stoichiometry. The GA/N2/Ar gaseous mixtures were deposited onto a cold CsI window kept at 15 K or 18 K in an APD-Cryogenics (ARS-2HW) closed cycle cryostat. Annealing experiments were performed upon the deposited samples at 33 K. The sample temperature was maintained by a Scientific Instruments 9700 temperature controller equipped with a silicon diode and a resistive heater. FTIR spectra were collected at 10 K in a transmission mode with a 0.5 cm−1 resolution using a Bruker IFS 66 Fourier Transform spectrometer equipped with a liquid N2 cooled MCT detector.
In order to support the experimental work, computational studies were carried out using the Gaussian16 program package [23]. The calculations were performed for GA:N2 1:1 complexes for the three most stable conformers (SSC, GAC, AAT) at the MP2 [24,25,26,27] and B3LYPD3 [28,29,30,31,32] levels of theory using the 6-311++G(2d,2p) basis set. All geometry optimizations were performed with the Boys-Bernardi full counterpoise method by Dannenberg [33,34]. The topological analysis of the electron density (Atoms-In-Molecules, AIM [35]) was performed at the MP2/6-311++G(2d,2p) level using AIM studio program (Version 12.09.23, Standard) [36]. The harmonic vibrational wavenumbers and infrared intensities were calculated both at MP2 and B3LYPD3 levels for the optimised structures to assist the analysis of the experimental spectra. The computed spectra were used to verify that computed complex structures were stable structures. Interpretation of the infrared spectra is based mainly on the MP2 results and this data is presented in the text.

3. Results and Discussion

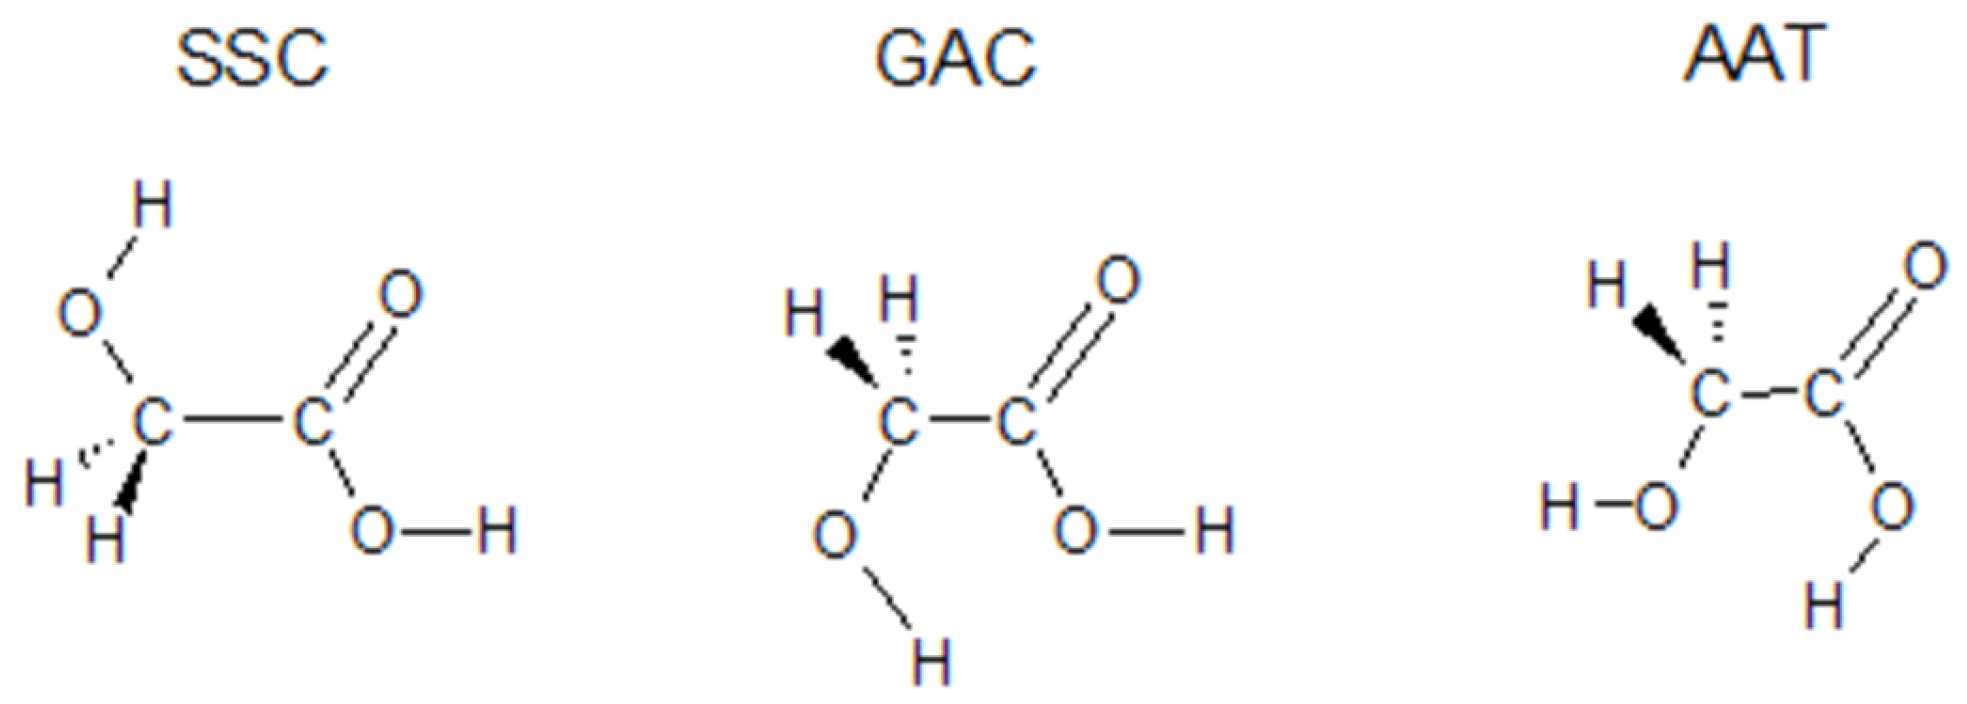
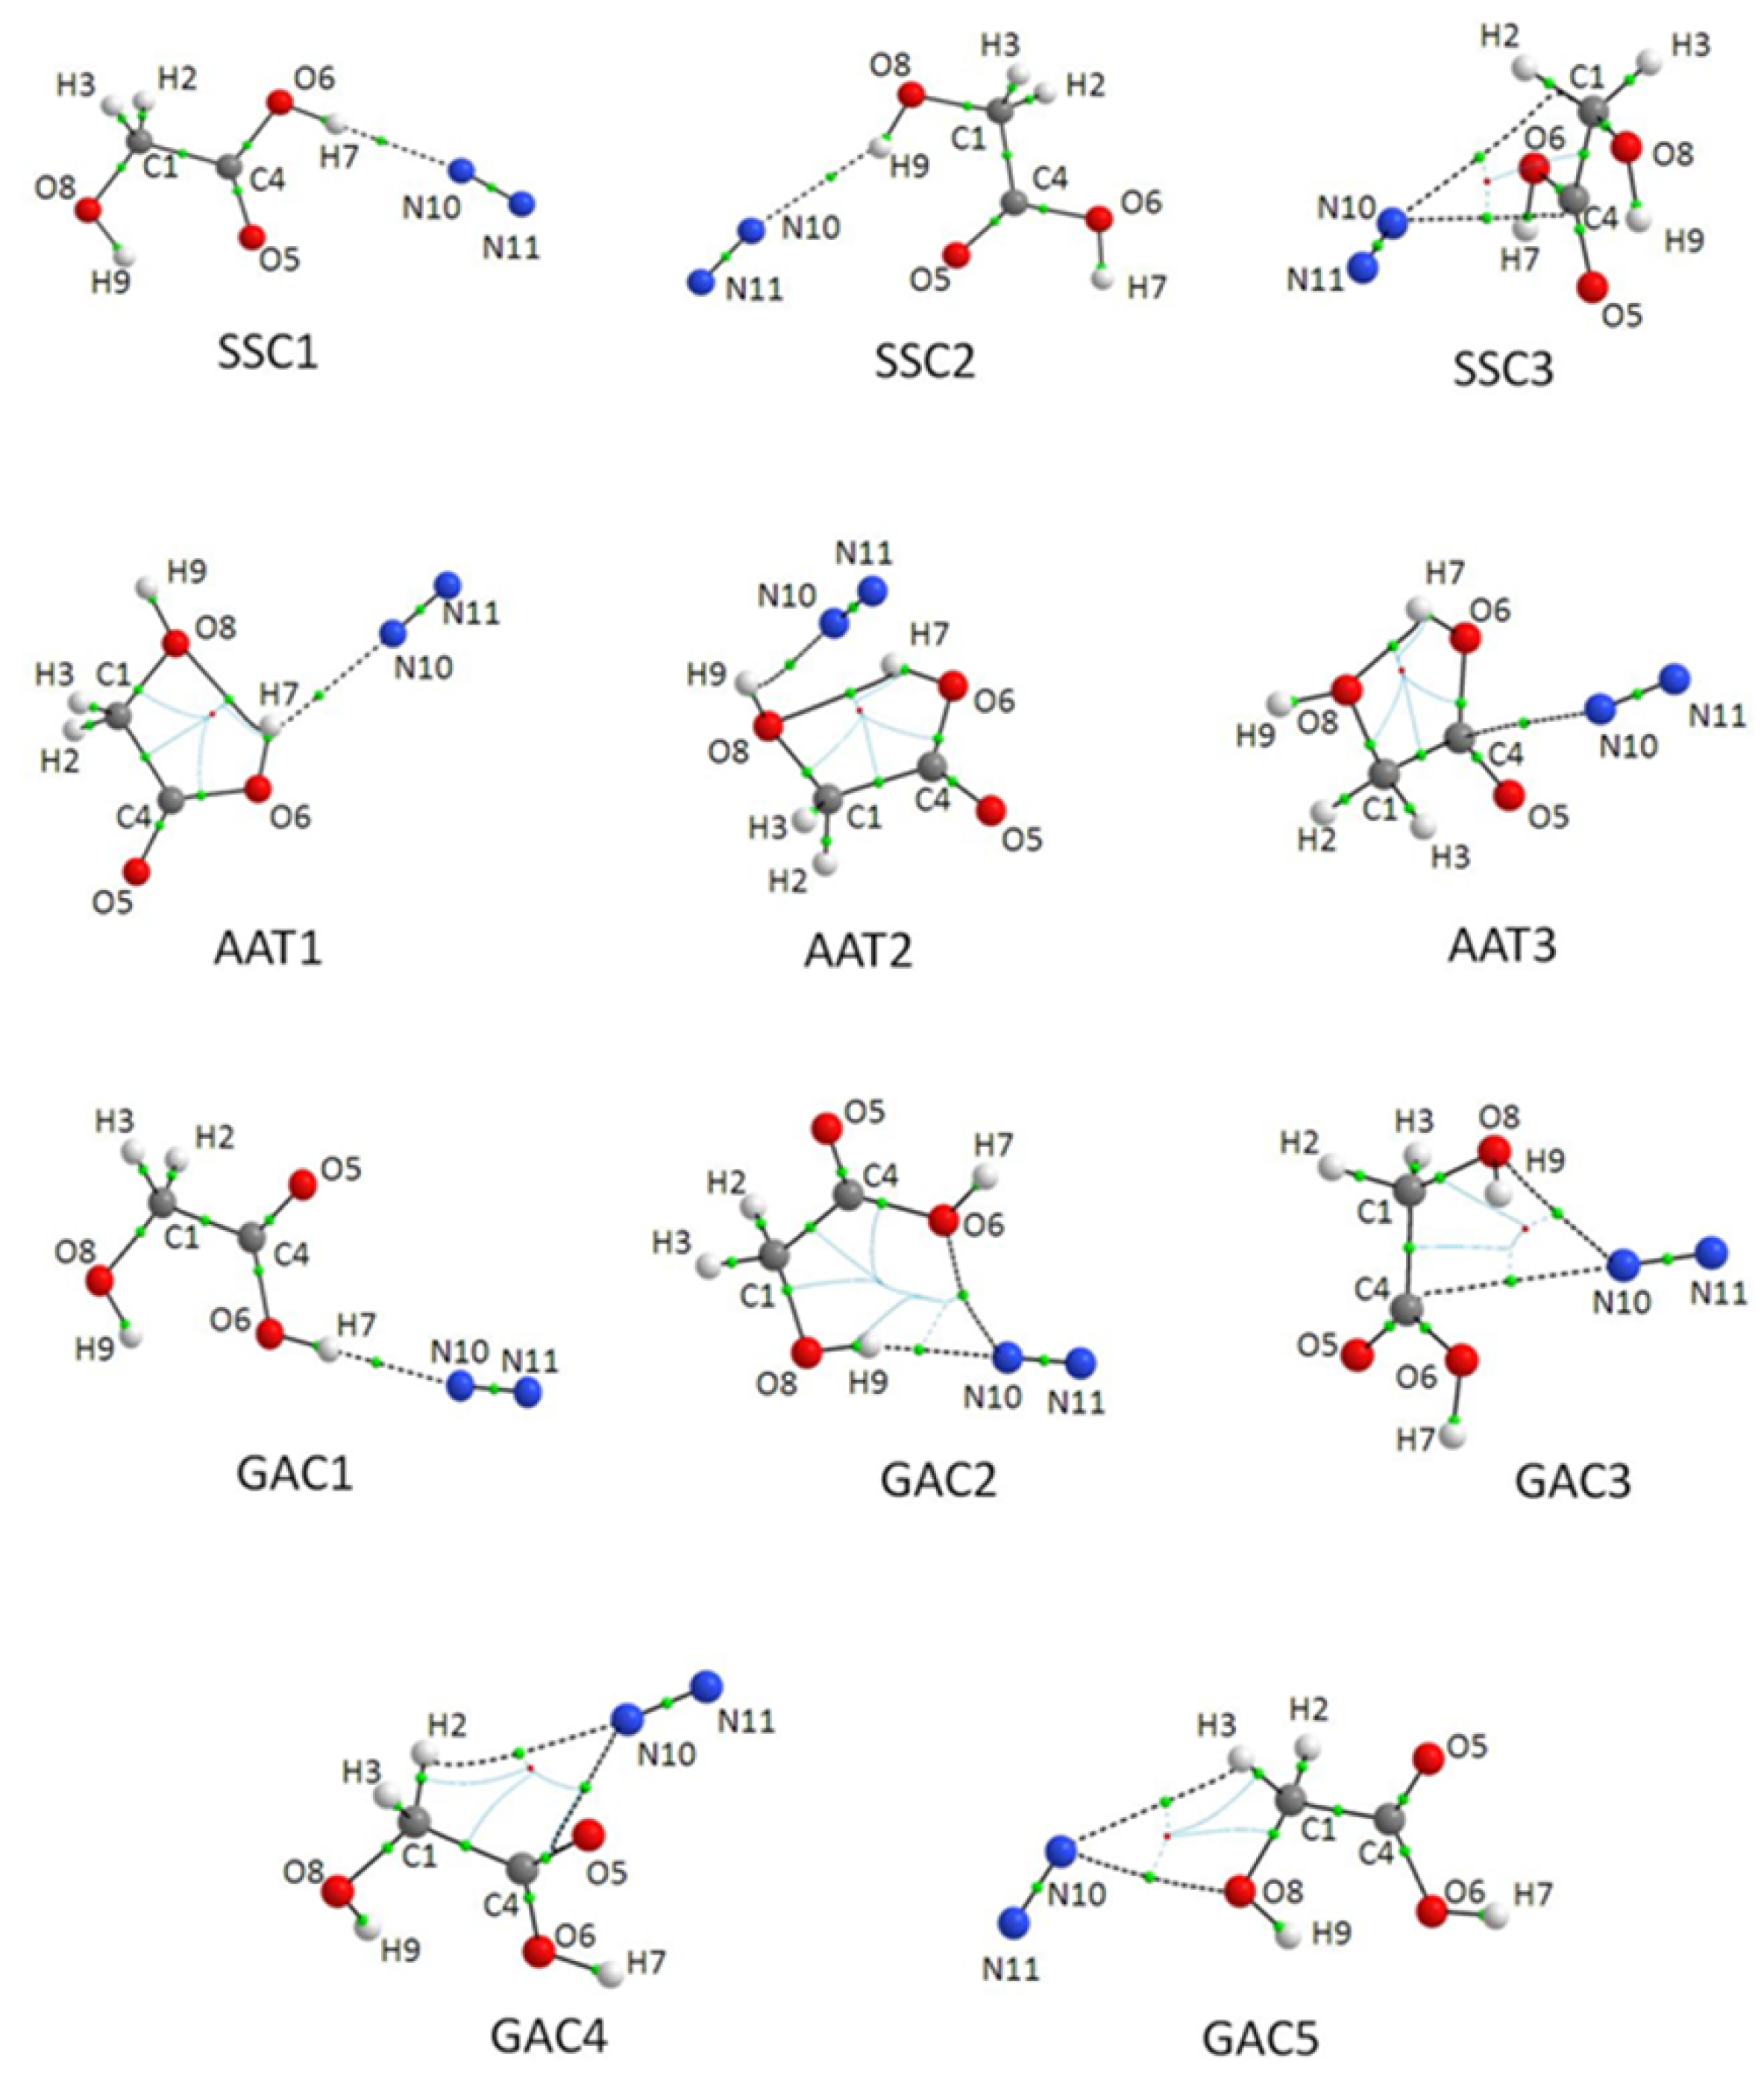
3.1. Structure and Energetics of 1:1 GA⋯N2 Complexes

Out of seven theoretically predicted conformers of glycolic acid monomer (GA) the three most stable forms, SCC, GAC and AAT, were detected in low-temperature noble gas matrices [19,20]. The fourth SST conformer was identified only in nitrogen matrices upon near-IR excitation of the most stable SSC conformer [19]. Therefore, exclusive interaction of the SSC, GAC and AAT conformers with nitrogen are considered here since these conformers of monomeric GA are the most plausible to appear in a solid argon environment.
At the MP2/6-311++G(2d,2p) level of theory 11 energy minima structures were found for 1:1 GA-N2 complexes whereas the calculations performed at the B3LYPD3 level showed the presence of only ten energy minima structures. All optimized GA⋯N2 complex structures are shown in Figure 2. The coordinates of all optimised complexes are presented in Table S1 (Supplementary Materials Information).
The AIM approach based on the topological analysis of electron density becomes nowadays almost routine method providing the characteristics of various types of interactions, among them hydrogen bonds and van der Waals interactions [37,38,39]. Two AIM parameters: the electron density ρ(r) and its Laplacian ∇2ρ(r) at bond critical points (BCP) obtained for all optimized 1:1 structures at MP2/6-311++G(2d,2p), using the MP2 computed density matrix, are collected in Table 1. Additionally, the positions of the bond (3,−1) critical points derived from the AIM calculations are visualised together with the optimised complex structures in Figure 2.
For interaction of SSC with nitrogen three minima were found and two of them contain the O–H⋯N hydrogen bond formed between carboxylic or alcoholic OH group and N2 molecule (species denoted SSC1 and SSC2, respectively). In both of these configurations, the N2 molecule lies in the SSC plane. The intermolecular H⋯N distance equals 2.257 and 2.475 Å in SSC1 and SSC2, respectively. Interaction with the carboxylic OH group results in an almost linear hydrogen bond with the Θ(O6H7N10) angle of 179.0° whereas in SSC2 the O–H⋯N bridge is more bent to Θ(O8H9N10) = 152.8°. In the third SSC-N2 complex (SSC3) the N2 molecule is located above the SSC molecular plane with the N10 atom directed to the centre of the C–C bond. The SSC3 complex also exhibit relatively short N10⋯C1 and N10⋯C4 atomic distances of 3.358 and 3.280 Å, respectively. Based on the AIM analysis two van der Waals interaction paths are found between N10 nitrogen atom and C1 or C4 carbon atoms.
Two hydrogen bonded complexes, analogous to those optimized for SSC⋯N2 were found for both GAC⋯N2 and AAT⋯N2 interactions. The intermolecular H⋯N distances are in the range of 2.262–2.547 Å. Both GAC1 and GAC2 contain almost linear O–H⋯N bridges (178 and 166°, respectively) whereas in AAT1 and AAT2 the hydrogen bond bridges are not linear (in both cases the O–H⋯N angle equals 134°). Similarly to the SSC conformer one non-hydrogen bonded structure (AAT3) was found for AAT. It is characterised by one van der Waals contact between N10 and C1 atoms.
For GAC⋯N2 complexes three non-hydrogen bonded minima were found (GAC3, GAC4 and GAC5) but none of them corresponds strictly to the structural configurations found for SSC3 or AAT3. Two of these species are characterised by the C–H⋯N contact and the N10⋯O5 (GAC4) or N10⋯O8 (GAC5) interaction. In the third structure (GAC3) two van der Waals contacts are present between N10⋯O8 and N10⋯C4. We do recognise here that the AIM method does not always result to bond paths with chemical meaning [40,41]. However, here we use the method to give a brief indication how the complex is built up, and how the nitrogen is connected with the GA subunit, even though some of the AIM bond path charts are very complex and can induce multiple interpretation of the nature of the interaction.
The calculated interaction and relative energies of these species optimised at the MP2 and B3LYPD3 levels are summarised in Table 2.
The most stable structure overall in energy is the SSC1 complex. The other two SSC complexes are about 3 kJ mol−1 higher in energy. The GAC and AAT complexes with nitrogen molecule are about 10–14 and 12–15 kJ mol−1 higher in energy than the complexes of the most stable SSC conformer. These energy differences correspond to the energy differences found for the isolated GA conformers without zero-point nor entropy corrections.
The largest interaction energy among all considered GA⋯N2 structures is found for the AAT2 complex, which equals to −9.12 kJ mol−1. The interaction in AAT2 is characterised by the alcoholic O–H group acting as a proton donor to nitrogen molecule. As can be seen in Table 2 the interaction energies of all other GA complexes are in the range between −4.02 to −9.12 kJ mol−1. Interestingly, both GAC2 and AAT2 complexes with alcoholic OH group interacting with N2 are characterised by larger interaction energy than that found for the SSC2 form. The GAC and AAT conformers of the GA monomer were found to be about 9.5 and 12.0 kJ mol−1 less stable than SSC whereas, for interaction of N2 with the OH alcoholic group, the situation is reversed. Such an observation was described for glyoxylic acid–water complexes [10] as well.
Looking at the AIM results performed for GAC2 the above situation can be related to the presence of a second weak van der Waals interaction between nitrogen molecule and oxygen atom of the carboxylic OH group. In turn, according to the AIM calculations, the intramolecular hydrogen bond, existing already in monomeric AAT, formed between the carboxylic OH and oxygen of the alcoholic OH becomes stronger in AAT2 complex contributing to its overall stability. In general, the formation of an additional van der Waals contact with either of the two OH groups of the GA subunit strengthens the intermolecular interaction. When no such additional interaction appears, a typical hydrogen-bonded structure as found in SSC1 and GAC1 complexes is prevalent in analogy with previous carboxylic acid complexes with nitrogen molecules [42,43].

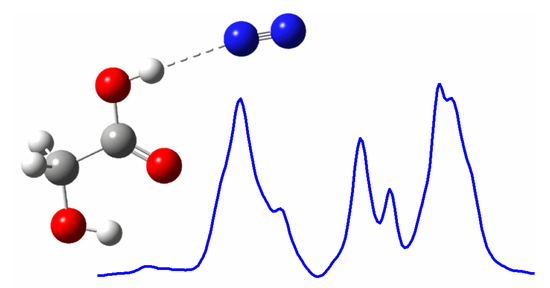
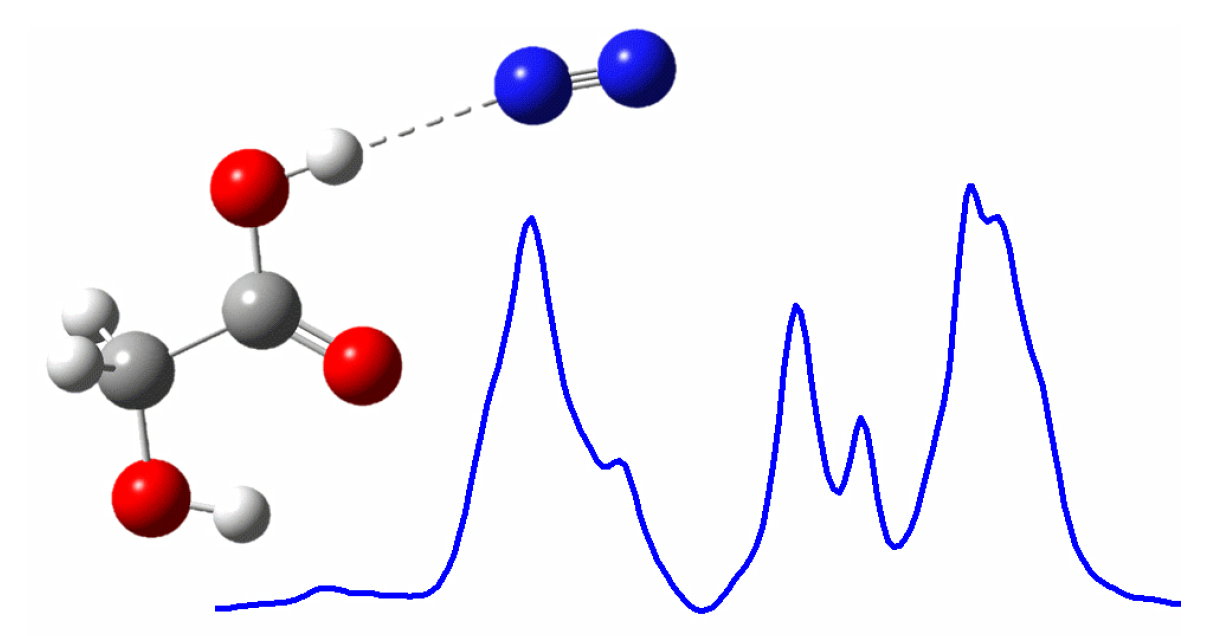
3.2. Computed Spectra

Infrared and Raman spectra were calculated for all the computationally identified complex structures (see Figure 2). The infrared spectra were used to verify that the optimised structures were stable minima on the potential energy surfaces. Additionally, comparison of complex and monomer spectra is useful for understanding the experimental findings. Raman spectra were also computed, and Raman intensities (IRaman) were derived from calculated scattering activities values according to the procedure described by Michalska and co-workers [44,45] employing T = 14 K for the Boltzmann distribution factor and excitation frequency of 532 nm (18 797 cm−1). These values correspond to the experimental conditions used in our previous work on GA⋯N2 [22]. The computational results obtained at the MP2-level of theory are shown in Table 3 for the most stable SSC1 complex. For comparison, the observed Raman bands have been included in Table 3.
The two OH vibrational bands for SSC1 are the alcoholic and carboxylic OH stretching vibrations at 3781 and 3754 cm−1, respectively. Another significant vibrational mode is the carbonyl stretching mode (ν6) that was computed to be at 1789 cm−1. Both of these spectral regions have been probed in the Raman experiments, and GA⋯N2 complexes have been identified. In order to make assignment of the complex structures appearing in the experiments, infrared and computational data is needed. Here, we consider all three SSC complexes found computationally in connection with annealing experiments in solid argon. These results are discussed below that shed light on the complex structures also observed in the Raman experiments [22].

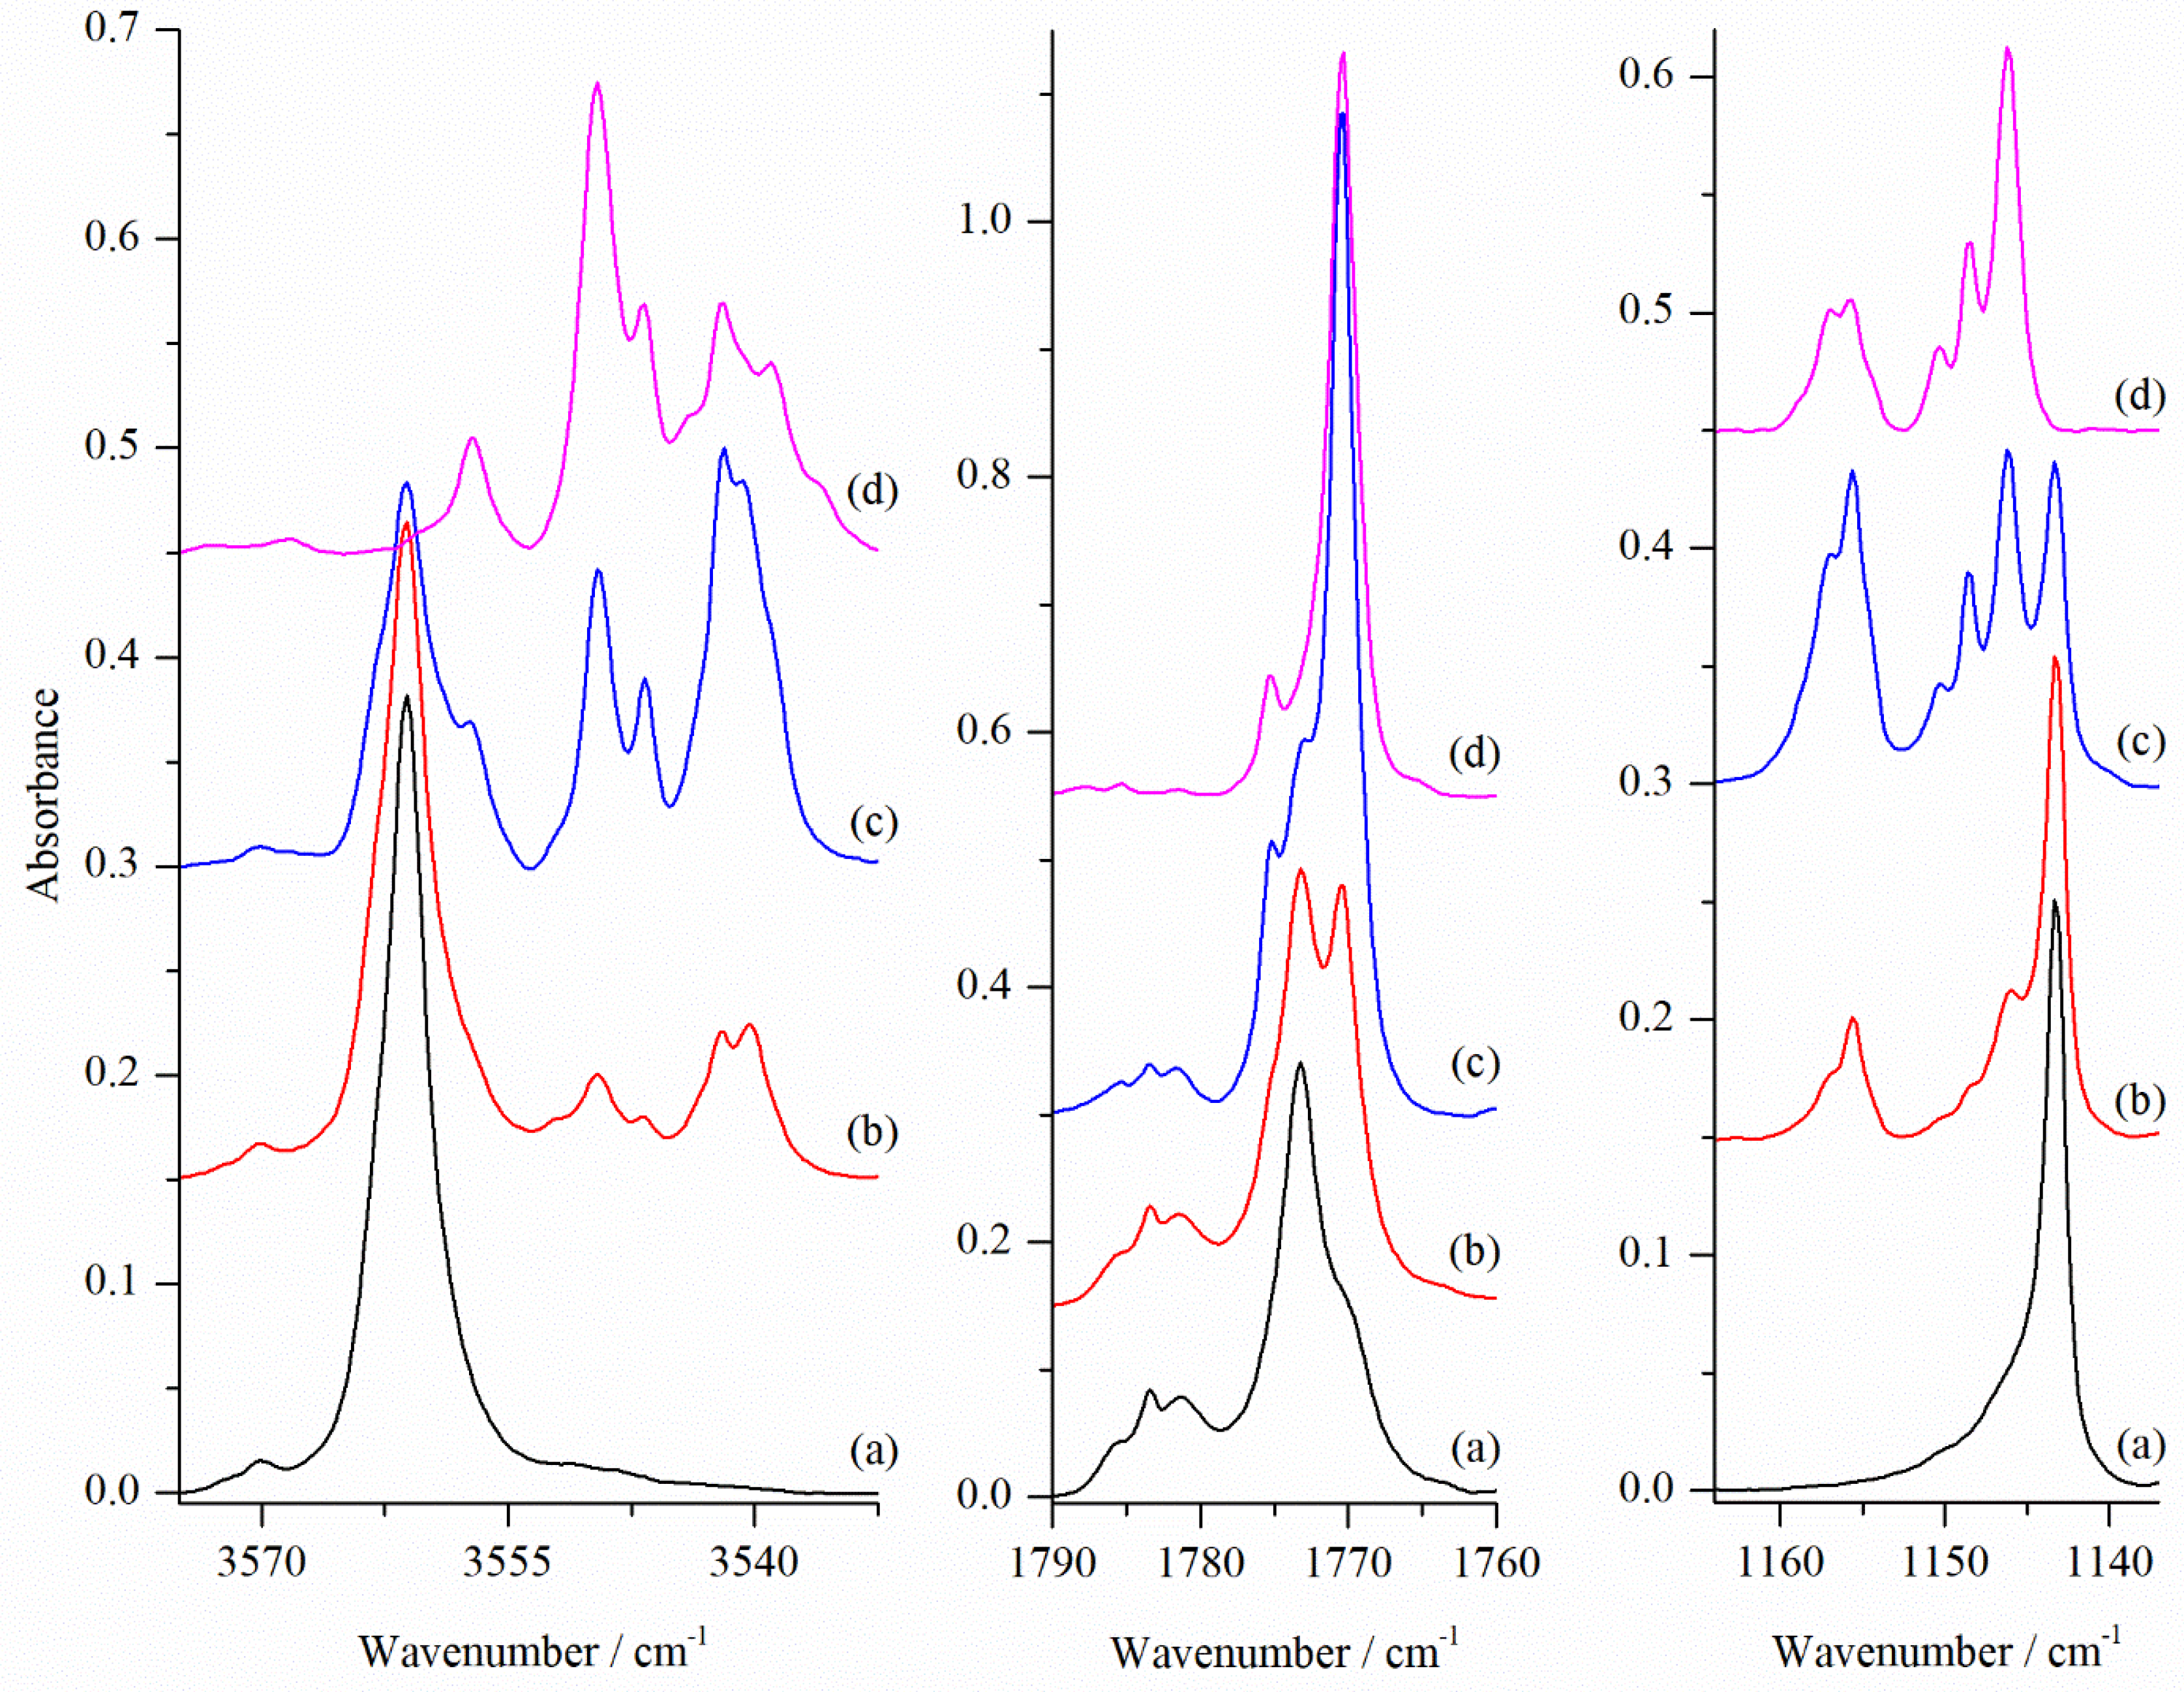
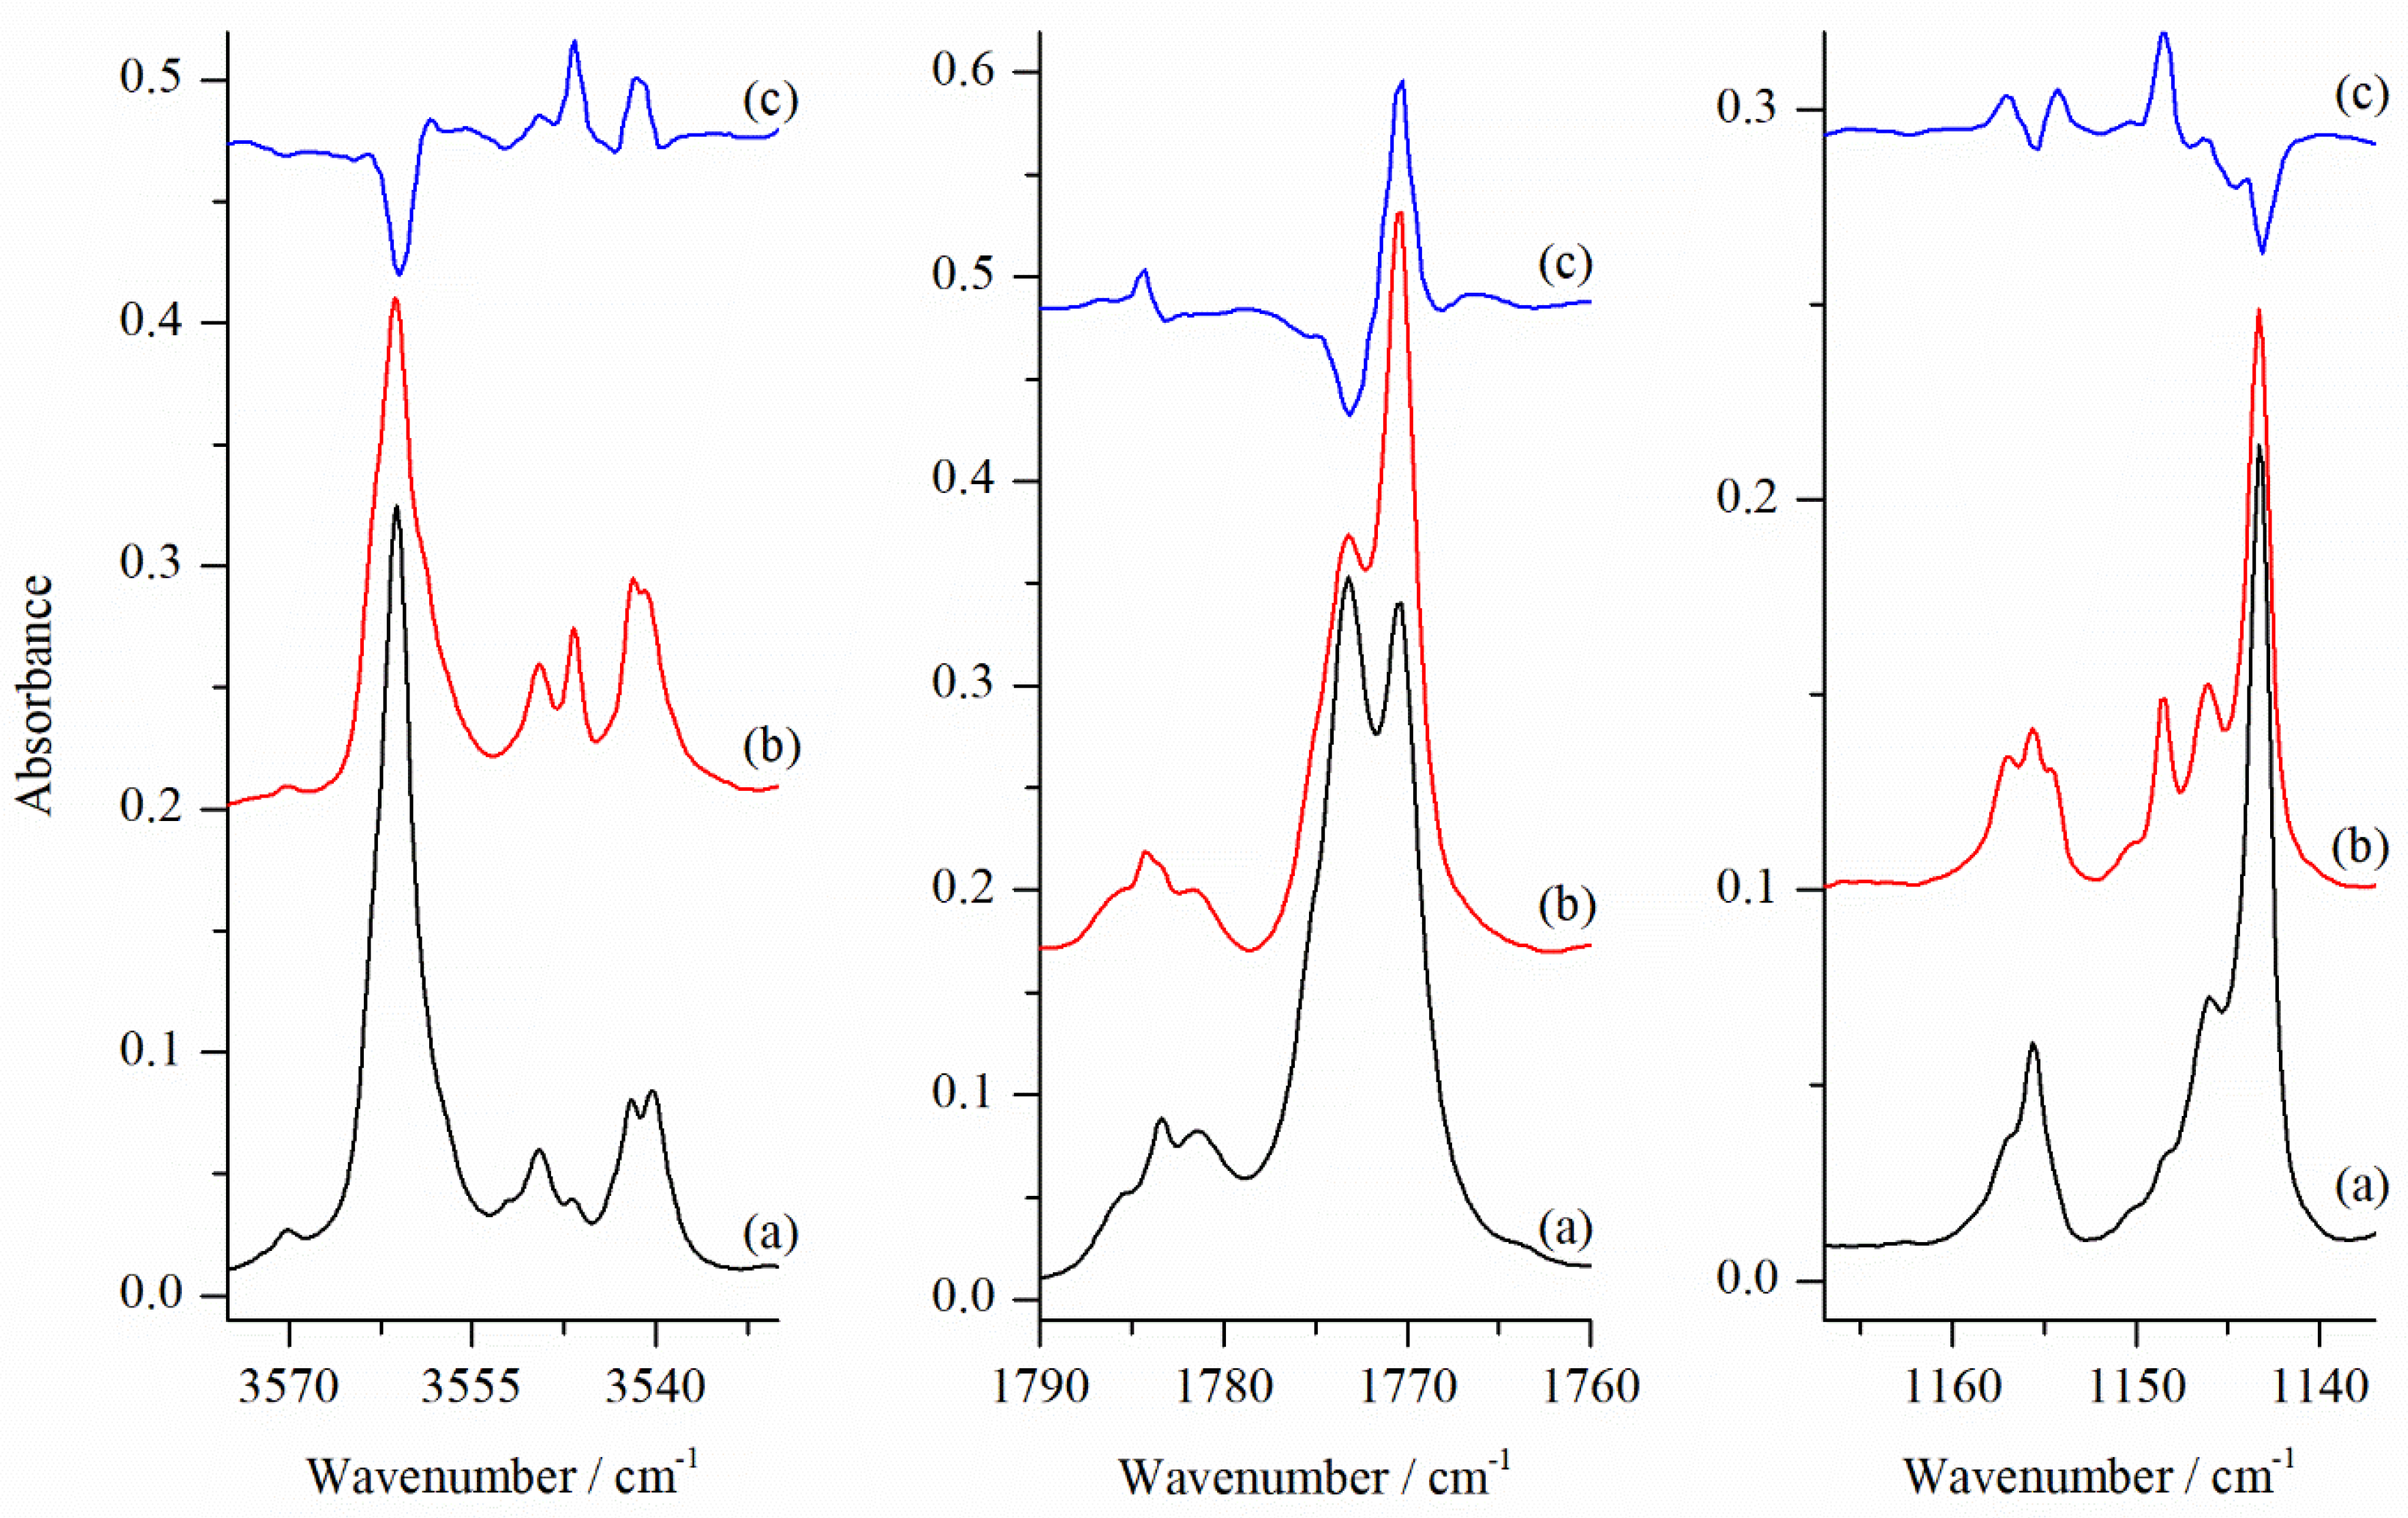
3.3. Experimental Results

At first, blank experiments were performed for GA isolated in solid argon. The deposition of GA at 15 K yielded matrices containing almost exclusively monomers of the acid. The strong bands of the O–H and the C=O stretching vibrations of the SSC conformer were observed at 3561 and 1773 cm−1. Much weaker absorptions of the two less abundant AAT and GAC conformers were barely observed at 3671, 3473 and 1806 cm−1 and 3648, 3561 and 1784 cm−1 for AAT and GAC, respectively, in accordance with the predicted gas phase abundances. When the deposition temperature was higher than 15 K or when the matrix with GA monomers was annealed a number of new weak bands appeared due to the GA dimers [21].
Complex formation between glycolic acid and nitrogen was observed when GA was deposited together with the N2 doped argon with the N2:Ar ratio of 1:4000 or higher. New bands due to the N2 complexes with GA appeared in several spectral regions in the vicinity of the GA monomer absorptions. Table 4 contains the most characteristic wavenumber shifts (Δν = νcomplex − νmonomer) calculated for the 1:1 species of interest compared to the experimental values. From now on the notation OHC and OHA denotes carboxylic and alcoholic OH group, respectively.
Figure 3 shows the stretching νOH, νC=O and in-plane-deformation δOHC regions of the infrared spectra of GA/N2/Ar matrices deposited at three different temperatures and compared to the GA/Ar spectrum. In the νOH stretching region of the spectrum of GA co-deposited at 15 K with the N2/Ar = 1/4000 mixture several new maxima due to the GA⋯N2 complexes are distinguished. They are situated below the νOH of the SSC conformer at 3549.5, 3546.5 and 3542.0/3540.0 (a doublet) cm−1. Additionally, a broadening on the lower wavenumber side of the νOH of the SSC monomer was found at 3556 cm−1 (at 15 K seen as a weak shoulder and better shaped at 18 and 25 K). The same set of bands (being much weaker) was observed in the νOH region when GA was deposited with an extremely diluted N2/Ar (in the case when small leak in the vacuum system was present). This indicates that all mentioned spectral features are due to the 1:1 GA⋯N2 species.
As shown in Figure 3, when matrices were deposited at 15 K and 18 K the most intense of all new bands present in the νOHC region was a doublet at 3542.0/3540.0 cm−1. Each of the bands observed in the νOHC region has its counterpart in the in-plane-bending δOHC region. Here, in the region of 1140–1160 cm−1, where we find the SSC monomer band at 1143.5 cm−1, a new set of bands due to the GA⋯N2 complex appeared at higher wavenumbers. A doublet in the νOHC region at 3542.0/3540.0 cm−1 and a weak band at 3557.0 cm−1 (shifted by −19/−21 cm−1 and −4 cm−1) fit well to the calculated positions of the stretching vibrations of carboxylic and alcoholic groups, respectively, in the most stable SSC1 complex. The calculated ΔνOH shifts in SSC1 form equal to −31 and −5 cm−1 for the hydrogen bonded carboxylic hydroxyl group and for non-hydrogen bonded alcoholic OH, respectively. Similar agreement was also found in other spectral regions as presented in Table 4. For the in-plane-deformation δOHC mode the most intense doublet in the spectra of matrices deposited at 15 and 18K at 1157.0/1155.5 cm−1 is blue-shifted by 13.5 and 12 cm−1 relative to the corresponding monomer absorption. This is also in a very good agreement with the predicted shift of 15 cm−1.
Both in νOHC and δOHC regions additional bands are present, and they are slightly shifted compared with those already assigned above. There are several possible reasons for the observed additional absorptions in the spectra. One of them is that there exists different structures of SSC⋯N2 complexes. As shown in Table 4 the νOH shifts predicted for SSC2 and SSC3 complexes do not fit to any of the observed bands. This indicates that there is only one type of complex in the experimental conditions used instead of three different SSC complexes identified computationally. Consequently, only the SSC1 structure is to be formed in the argon matrix, and another explanation should be found for the additional bands in the νOHC and δOHC regions. The most obvious explanation is the presence of multiple trapping sites in the matrix, which can slightly perturb the structures of the complexes. For the SSC1 structure, the position of the N2 molecule relative to the OH group of the carboxylic moiety is most susceptible to changes induced by the environment. Depending on the local structure of the surrounding argon atoms, the hydrogen-bonded N2 tail is either bent or elongated compared to the most favourable site structure.
This idea of perturbed complex structures giving different spectral features was tested with a relaxed potential energy scan for the bending motion of the N2 molecule in the hydrogen-bonded SSC1 complex. For each step the C4O6N10 angle describing a position of N2 relative to the GA was fixed at values slightly different than that obtained for the global SSC1 minimum (the C4O6N10 angle equals to 104.1 degrees) and all remaining parameters were optimized. The range of angle changes was between 94.0 and 119.0 degrees with a step of 2.5 degrees. Figure 4 shows the changes of the νOH wavenumber calculated for each point of the relaxed potential energy scan. The relative electronic energy of the SSC1 complex and the corresponding changes of the νC=O and δOHC wavenumbers are presented in Figure S1 (Supplementary Materials Information). All points presented in Figure 4 and Figure S1 represent structures that all have positive wavenumbers in their computed spectra. Accordingly, the bending movement of the N2 molecule in the studied range results in very small changes in energy indicating that the potential energy surface is relatively flat. The changes of the wavenumbers of the vibrations depend on how much the nitrogen molecule is averted from its equilibrium position. The highest deviations of the νOHC and δOHC wavenumbers are between 5 and 9 cm−1 whereas that obtained for νC=O is smaller and equals ca. 2 cm−1. The predicted values of the ΔνOHC and ΔδOHC are of the same order as differences in positions of the components of the absorption in the experimental OH stretching and in-plane deformation regions. Therefore, it is plausible to assume that the additional features observed in the spectra are due to the SSC1 complex in different local structures (sites) in the matrix.
In the middle panel of Figure 3, an intense new feature appeared upon complex formation in the νC=O region. The intense band at 1770.5 cm−1 is red shifted by 2.5 cm−1 compared to the νC=O of SSC monomer (1773 cm−1). Its position and intensity are consistent with those predicted computationally for the νC=O in SSC1 structure (see Table 4). No site splitting in the ΔνC=O region was detected in agreement with the small wavenumber changes predicted for this mode upon N2 movement (see Figure S1). This is also in accordance with the explanation of site structures observed for the OH stretching vibrations, which are due to the movement of the nitrogen molecule in the hydrogen-bonded bridge. The νC=O mode is insensitive to these changes.
Figure 5 shows the influence of the matrix annealing in the νOH, νC=O and δOHC regions of the GA/N2/Ar matrices deposited at 15 K. The difference spectra shown in the upper part of the figure indicate that the components of the ν OH absorption were differently affected by rising temperature to 33 K. Combining the information from Figure 4 and Figure 5 indicates that deposition of the matrix at different temperatures favour different local structures of the SSC1 complex. Annealing of the matrix influences the site structure very little. In the OH stretching region, there appear mainly two sites (corresponding to doublet at 3542 and 3540 cm −1, and a band at 3546.5 cm−1) which yield hydrogen-bonded complexes from close contact pairs between nitrogen and GA. The third site, evidenced by a band at 3549.5 cm−1, appears in deposition but it is not growing upon annealing.

4. Conclusions

Matrix isolation FTIR spectroscopy and computational chemistry have been employed to study glycolic acid complexes with a nitrogen molecule in an argon matrix. Computationally, at the MP2 level, 11 different GA⋯N2 complex structures were obtained for the SSC, GAC and AAT glycolic acid monomers. For SSC and GAC the largest interactions between the complex subunits were found for structures, where the nitrogen molecule forms a linear hydrogen-bonded structure with the GA subunit. In the case of AAT a cyclic structure involving both OH groups appeared to be the most tightly bound instead of the linear hydrogen-bonded structure.
In the experimental conditions used, the glycolic acid molecule is prevalently complexed with one nitrogen molecule. Deposition of the matrix in different temperatures indicate that there are three different local site structures of the complex formed. Annealing experiments are helpful in distinguishing the different sites from each other, and here two of the three sites were found to be further enhanced from local near contact pairs. The existence of site structures of one complex is also implied by the computational methods based on the vibrational shifts computed for the complexes. Additionally, these sites are stable enough that they could not be interconverted upon annealing experiments.
In conjunction with recent Raman spectroscopy study [22] and the results obtained here by FTIR and computational methods, it can be concluded that co-depositing GA and N2 in a large excess argon matrix produces only hydrogen bonded SSC⋯N2 complexes occupying three different local matrix sites. In order to gain insight on the local structures and their interconversion dynamics upon annealing molecular dynamics simulations of the doped matrices and irradiation experiments should be performed. The latter approach is employed in the following paper [46], where the site-selective chemistry of SSC⋯N2 is be used to unravel some structural features of the sites and their impact on the photo-induced processes.

Supplementary Materials

The following are available online, Figure S1. Plot showing changes of the energy, νC=O, δOH wavenumbers calculated for each point of the relaxed potential energy scan for the bending movement of the N2 molecule in SSC1 complex calculated at the B3LYPD3 and MP2 levels with 6-311++G(2d,2p) basis set versus deviation of the C4O6N10 angle. Table S1. Cartesian coordinates of N2, GA monomers and GA⋯N2 complexes of the 1:1 stoichiometry calculated at MP2/6-311++G(2d,2p) level.

Author Contributions

Conceptualization: M.W. and J.L.; methodology: M.W., J.L. and J.M.E.A.; formal analysis: J.K., I.K., M.W.; investigation: I.K., J.K., J.M.E.A.; resources: M.W. and J.L.; data curation: M.W., J.M.E.A. and J.L.; writing—original draft preparation: M.W. and J.L.; writing—review and editing: M.W., J.L. and J.M.E.A.; visualization: I.K. and J.K.; supervision: M.W. and J.L.; project administration: M.W. and J.L.; funding acquisition: M.W. and J.L.

Funding

This research was funded by the National Science Centre project no. 2013/11/B/ST4/00500 (at UWr to M.W.) and Academy of Finland project no. 286844 (at JYU to J.L.).

Acknowledgments

Allocation of computer time from the Wrocław Centre for Networking and Supercomputing (Wroclaw, Poland) is gratefully acknowledged.

Conflicts of Interest

The authors declare no conflict of interest.

References

  1. Pimentel, G.C.; McClellan, A.L. Hydrogen Bond; Freeman: San Francisco, CA, USA, 1960. [Google Scholar]
  2. Scheiner, S. Hydrogen Bonding. A Theoretical Perspective; Oxford University Press: New York, NY, USA, 1997. [Google Scholar]
  3. Klemperer, W.; Vaida, V. Molecular complexes in close and far away. Proc. Natl. Acad. Sci. USA 2006, 103, 10584–10588. [Google Scholar] [CrossRef] [PubMed] [Green Version]
  4. Vigasin, A.A.; Slanina, Z. (Eds.) Molecular Complexes in Earth’s, Planetary, Cometary, and Interstellar Atmospheres; World Scientific Publishing Co. Pte. Ltd.: Singapore, 1998. [Google Scholar]
  5. Vaida, V. Perspective: Water cluster mediated atmospheric chemistry. J. Chem. Phys. 2011, 135, 020901. [Google Scholar] [CrossRef] [PubMed]
  6. Khriachtchev, L. Matrix isolation studies of noncovalent interactions: More sophisticated approaches. J. Phys. Chem. A 2015, 119, 2735–2746. [Google Scholar] [CrossRef] [PubMed]
  7. Khriachtchev, L. Physics and Chemistry at Low Temperatures; Pan Stanford Publishing: Singapore, 2012. [Google Scholar]
  8. Wierzejewska, M.; Olbert-Majkut, A. Matrix isolation spectra and ab initio calculations of isothiocyanic acid complexes with carbon monoxide. J. Phys. Chem. A 2003, 107, 1928–1934. [Google Scholar] [CrossRef]
  9. Olbert-Majkut, A.; Lundell, J.; Wierzejewska, M. Light-induced opening and closing of the intramolecular hydrogen bond in glyoxylic acid. J. Phys. Chem. A 2014, 118, 350–357. [Google Scholar] [CrossRef] [PubMed]
  10. Lundell, J.; Olbert-Majkut, A. Isolated glyoxylic acid-water complexes in low temperature argon matrices. Spectrochim. Acta A. 2015, 136, 113–121. [Google Scholar] [CrossRef] [PubMed]
  11. Haupa, K.; Bil, A.; Mielke, Z. Donor-acceptor complexes between ammonia and sulfur trioxide: An FTIR and computational study. J. Phys. Chem. A 2015, 119, 10724–10734. [Google Scholar] [CrossRef] [PubMed]
  12. Haupa, K.; Bil, A.; Barnes, A.; Mielke, Z. Isomers of the acetic acid–water complex trapped in an argon matrix. J. Phys. Chem. A 2014, 119, 2522–2531. [Google Scholar] [CrossRef]
  13. Krupa, J.; Wierzejewska, M. Structural and spectroscopic properties of complexes formed between HNCS and SO2 in low temperature matrices. Spectrochim. Acta A. 2017, 183, 144–149. [Google Scholar] [CrossRef]
  14. Biczysko, M.; Krupa, J.; Wierzejewska, M. Theoretical studies of atmospheric molecular complexes interacting with NIR to UV light. Faraday Discuss. 2018, 212, 421–441. [Google Scholar] [CrossRef]
  15. Hollenstein, H.; Schär, R.W.; Schwizgebel, N.; Grassi, G.; Günthard, H.H. A transferable valence force field for polyatomic molecules. A scheme for glycolic acid and methyl glycolate. Spectrochim. Acta A 1983, 39, 193–213. [Google Scholar] [CrossRef]
  16. Hollenstein, H.; Ha, T.K.; Günthard, H.H. IR induced conversion of rotamers, matrix spectra, ab initio calculation of conformers, assignment and valence force field of trans glycolic acid. J. Mol. Struct. 1986, 146, 289–307. [Google Scholar] [CrossRef]
  17. Reva, I.D.; Jarmelo, S.; Lapinski, L.; Fausto, R. IR-induced photoisomerization of glycolic acid isolated in low-temperature inert matrices. J. Phys. Chem. A 2004, 108, 6982–6989. [Google Scholar] [CrossRef]
  18. Reva, I.D.; Jarmelo, S.; Lapinski, L.; Fausto, R. First experimental evidence of the third conformer of glycolic acid: Combined matrix isolation, FTIR and theoretical study. Chem. Phys. Lett. 2004, 389, 68–74. [Google Scholar] [CrossRef]
  19. Halasa, A.; Lapinski, L.; Reva, I.; Rostkowska, H.; Fausto, R.; Nowak, M.J. Near-infrared laser-induced generation of three rare conformers of glycolic acid. J. Phys. Chem. A 2014, 118, 5626–5635. [Google Scholar] [CrossRef]
  20. Ahokas, J.M.E.; Kosendiak, I.; Krupa, J.; Wierzejewska, M.; Lundell, J. High vibrational overtone excitation-induced conformational isomerization of glycolic acid in solid argon matrix. J. Raman Spectrosc. 2018, 49, 2036–2045. [Google Scholar] [CrossRef]
  21. Ahokas, J.; Kosendiak, I.; Krupa, J.; Lundell, J.; Wierzejewska, M. FTIR matrix isolation and theoretical studies of glycolic acid dimers. J. Mol. Struct. 2018, 1163, 294–299. [Google Scholar] [CrossRef]
  22. Ahokas, J.M.E.; Kosendiak, I.; Krupa, J.; Lundell, J.; Wierzejewska, M. Raman spectroscopy of glycolic acid complexes with N2. J. Mol. Struct. 2019, 1183, 367–372. [Google Scholar] [CrossRef]
  23. Frisch, M.J.; Trucks, G.W.; Schlegel, H.B.G.; Scuseria, E.; Robb, M.A.; Cheeseman, J.R.; Scalmani, G.; Barone, V.; Petersson, G.A.; Nakatsuji, H.; et al. Gaussian 16, Revision A.03; Gaussian Inc.: Wallingford, CT, USA, 2016. [Google Scholar]
  24. Head-Gordon, M.; Pople, J.A.; Frisch, M.J. MP2 energy evaluation by direct methods. Chem. Phys. Lett. 1988, 153, 503–506. [Google Scholar] [CrossRef]
  25. Head-Gordon, M.; Head-Gordon, T. Analytic MP2 frequencies without fifth order storage: Theory and application to bifurcated hydrogen bonds in the water hexamer. Chem. Phys. Lett. 1994, 220, 122–128. [Google Scholar] [CrossRef]
  26. Frisch, M.J.; Head-Gordon, M.; Pople, J.A. Semi-direct algorithms for the MP2 energy and gradient. Chem. Phys. Lett. 1990, 166, 281–289. [Google Scholar] [CrossRef]
  27. Sæbø, S.; Almlöf, J. Avoiding the integral storage bottleneck in LCAO calculations of electron correlation. Chem. Phys. Lett. 1989, 154, 83–89. [Google Scholar] [CrossRef]
  28. Becke, A.D. Density-functional exchange-energy approximation with correct asymptotic behaviour. Phys. Rev. A 1988, 38, 3098–3100. [Google Scholar] [CrossRef] [PubMed]
  29. Lee, C.; Yang, W.; Parr, R.G. Development of the Colle-Salvetti correlation-energy formula into a functional of the electron-density. Phys. Rev. B 1988, 37, 785–789. [Google Scholar] [CrossRef] [PubMed]
  30. Becke, A.D. Density-functional thermochemistry. III. The role of exact exchange. J. Chem. Phys. 1993, 98, 5648–5652. [Google Scholar] [CrossRef]
  31. Miehlich, B.; Savin, A.; Stoll, H.; Preuss, H. Results obtained with the correlation-energy density functionals of Becke and Lee, Yang and Parr. Chem. Phys. Lett. 1989, 157, 200–206. [Google Scholar] [CrossRef]
  32. Grimme, S.; Antony, J.; Ehrlich, S.; Krieg, H. A consistent and accurate ab initio parameterization of density functional dispersion correction (DFT-D) for the 94 elements H-Pu. J. Chem. Phys. 2010, 132, 154104. [Google Scholar] [CrossRef]
  33. Boys, S.F.; Bernardi, F. Calculation of small molecular interactions by differences of separate total energies—Some procedures with reduced errors. Mol. Phys. 1970, 19, 553–566. [Google Scholar] [CrossRef]
  34. Simon, S.; Duran, M.; Dannenberg, J.J. How does basis set superposition error change the potential surfaces for hydrogen bonded dimers? J. Chem. Phys. 1996, 105, 11024–11031. [Google Scholar] [CrossRef]
  35. Bader, R.F.W. Atoms in Molecules. A Quantum Theory; Oxford University Press: Oxford, UK, 1990. [Google Scholar]
  36. Keith, T.A. AIMAll (Version 12.09.23); TK Gristmill Software: Overland Park, KS, USA, 2012; Available online: aim.tkgristmill.com.
  37. Bader, R.F.W.; Essen, H. The characterization of atomic interactions. J. Chem. Phys. 1984, 80, 1943. [Google Scholar] [CrossRef]
  38. Grabowski, S.J. What is the covalency of hydrogen bonding? Chem. Rev. 2011, 111, 2597–2625. [Google Scholar] [CrossRef] [PubMed]
  39. Kumar, P.S.V.; Raghavendra, V.; Subramanian, V. Bader’s Theory of Atoms in Molecules (AIM) and its applications to chemical bonding. J. Chem. Sci. 2016, 128, 1527–1536. [Google Scholar] [CrossRef]
  40. Cerpa, E.; Krapp, A.; Vela, A.; Merino, G. The implications of symmetry of the external potential on bond paths. Chem. Eur. J. 2008, 14, 10232–10234. [Google Scholar] [CrossRef] [PubMed]
  41. Lane, J.R.; Contreras-Garcia, J.; Piquemal, J.-P.; Miller, B.J.; Kjaergaard, H.G. Are bond critical points really critical for hydrogen bonding? J. Chem. Theor. Comput. 2013, 9, 3263–3266. [Google Scholar] [CrossRef] [PubMed]
  42. Lundell, J.; Räsänen, M.; Latajka, Z. Matrix isolation FTIR and ab initio study of complexes between formic acid and nitrogen. Chem. Phys. 1994, 189, 245–260. [Google Scholar] [CrossRef]
  43. Wierzejewska-Hnat, M.; Latajka, Z.; Mielke, Z.; Ratajczak, H. Theoretical and infrared matrix isolation studies of the CF3COOH-N2 system. J. Mol. Struct. 1985, 129, 229–235. [Google Scholar] [CrossRef]
  44. Michalska, D.; Wysokiński, R. The prediction of Raman spectra of platinum(II) anticancer drugs by density functional theory. Chem. Phys. Lett. 2005, 403, 211–217. [Google Scholar] [CrossRef]
  45. Wysokiński, R.; Michalska, D.; Bieńko, D.C.; Ilakiamani, S.; Sundaraganesan, N.; Ramalingam, K. Density functional study on the molecular structure, infrared and Raman spectra, and vibrational assignment for 4-thiocarbamoylpyridine. J. Mol. Struct. 2006, 791, 70–76. [Google Scholar] [CrossRef]
  46. Kosendiak, I.; Ahokas, J.M.E.; Krupa, J.; Lundell, J.; Wierzejewska, M. Complexes of glycolic acid with nitrogen isolated in argon matrices. II. Vibrational overtone excitations. Molecules 2019, 24, 3245. [Google Scholar] [CrossRef]
Sample Availability: Not available.
Figure 1. Structures of the three most stable conformers of glycolic acid monomer.
Molecules 24 03262 g001
Figure 2. The MP2-optimized 1:1 structures of SSC, AAT and GAC complexes with molecular nitrogen.
Molecules 24 03262 g002
Figure 3. The νOH, δOHC and νC=O regions of the infrared spectra of GA co-deposited with N2/Ar = 1/4000 at 15 K, 18 K and 25 K (measurement at 10 K) (traces (bd), respectively, compared with GA/Ar spectrum (a).
Molecules 24 03262 g003
Figure 4. Plot showing changes of the νOH value calculated for each point of the relaxed potential energy scan for the bending movement of the N2 molecule in SSC1 complex calculated at the B3LYPD3 and MP2 levels with 6-311++G(2d,2p) basis set versus deviation of the C4O6N10 angle. The zero value of this angle corresponds to the global minimum value.
Molecules 24 03262 g004
Figure 5. The νOH, δOHC and νC=O regions of the infrared spectra of GA co-deposited with N2/Ar = 1/4000 (a) at 15 K and (b) after annealing at 33 K (measurement at 10 K) and (c) the corresponding difference spectrum (b) minus (a). The bands at 3561.0, 1773.0 and 1143.0 cm−1 belong to the SSC monomer.
Molecules 24 03262 g005
Table 1. Interatomic distances (Å), angles (degree) and electron density parameters of the bond (au) of the SSC, GAC and AAT complexes with N2 (1:1) computed at the MP2/6-311++G(2d,2p) level.
ComplexIntermolecular ParametersAIM Parameters
Interatomic DistancesAngleBCPρ (r)2ρ(r)
H⋯YX⋯YX–H⋯Y
SSC12.2573.226179.0H7⋯N100.0140.053
SSC22.4753.363152.8H9⋯N100.0090.037
SSC3 3.358 C1⋯N100.0060.024
3.280 C4⋯N100.0060.024
Ring critical point 0.0060.025
GAC12.2623.230178.1H7⋯N100.0140.053
GAC22.3633.304166.4H9⋯N100.0120.045
3.410 O6⋯N100.0040.016
Ring critical point 0.0040.016
GAC3 3.249 O8⋯N100.0060.022
3.252 C4⋯N100.0060.026
Ring critical point 0.0050.025
GAC4 3.323 O5⋯N100.0060.023
2.9713.684123.1H2⋯N100.0050.017
Ring critical point 0.0050.018
GAC52.8323.521121.5H3⋯N100.0040.016
3.188 O8⋯N100.0050.018
Ring critical point 0.0040.018
AAT12.4593.212134.2H7⋯N100.0100.040
1.9502.584120.7H7⋯O80.0270.117
Ring critical point 0.0250.143
AAT22.5473.287133.9H9⋯N100.0080.030
1.9852.640122.7H7⋯O80.0280.108
Ring critical point 0.0260.137
AAT31.9222.575122.2H7⋯O80.0290.122
3.184 C4⋯N100.0060.027
Ring critical point 0.0260.151
Table 2. Computed interaction energies and relative energies compared to global minimum SSC1 (in kJ mol−1).
StructureInteraction EnergyRelative Energy
MP2B3LYPD3MP2B3LYPD3
SSC1−7.70−8.410.000.00
SSC2−4.48−5.153.233.27
SSC3−5.40−5.772.352.63
GAC1−7.53−8.2810.7010.49
GAC2−5.61−6.2312.8012.68
GAC3−5.02−5.3113.2813.46
GAC4−4.48−4.9413.7513.78
GAC5−4.02-14.21-
AAT1−4.85−5.5615.7116.23
AAT2−9.12−9.7112.1912.34
AAT3−5.40−5.7315.0815.91
Table 3. Computed band positions for the most stable SSCN2 complex (SSC1) compared to the experimental Raman band positions (cm−1) together with computed infrared (km mol−1) and Raman intensities.
ModeBand PositionIIRIRamanRaman Exp [22]
ν1378179477
ν2375430218803562, 3554, 3545
ν3313071202
ν43087252536
ν521751674
ν617892467391777, 1775
ν7151812509
ν814922106
ν91372124202
ν10131533134
ν1112710355
ν121190161175
ν131112226168
ν141053113
ν15878281107
ν1668910816
ν1765318518
ν185401204
ν1948018528
ν20340777
ν212871232
ν2210201504
ν239281787
ν24805757
ν25792224
ν26230387
ν271812940
Table 4. MP2/6-311++G(2d,2p) calculated wavenumber shifts Δν (cm−1) and intensities (km mol−1) of the SSC complexes a with nitrogen compared to the corresponding experimental shifts.
MP2/6-311++G(2d,2p)Experimental ShiftsAssignment
SSC1SSC2SSC3 *
ΔνIΔνIΔνIΔν
−5793119032−41) νOHA
−3130211170140−11.5, −14.5, −19.0/−21.02) νOHC
−52461274−12492, −36) νC=O
10124−4126112312, 69) δOHA + δOHC + νC–OC
15161−2126013914, 13, 8, 5, 312) δOHC + νC–OC +ωCH2
428−1301286, 4, 215) νC–C + νC–OC
a Corresponding positions for the SSC monomer are: 3786, 3785, 1794, 1362, 1175 and 874 cm−1 (MP2/6-311++G(2d,2p)) and 3561, 3561, 1773, 1332, 1143 and 854 cm−1 (Ar matrix [19]). * In SSC3 the νOHC and νOHA vibrations are coupled.

