
Counterfeit and Substandard Test of the Antimalarial Tablet Riamet® by Means of Raman Hyperspectral Multicomponent Analysis

 ,
, 
Abstract
1. Introduction
2. Results and Discussion
2.1. Development of Partial Least-Squares Regression Model for Ingredient Quantification
2.2. Active Ingredient Concentration Prediction and Interpretation of the Spectral Information of the Model
2.3. Potential of Fiber Array-Based Technique for Counterfeit and Substandard Tablet Testing
3. Materials and Methods
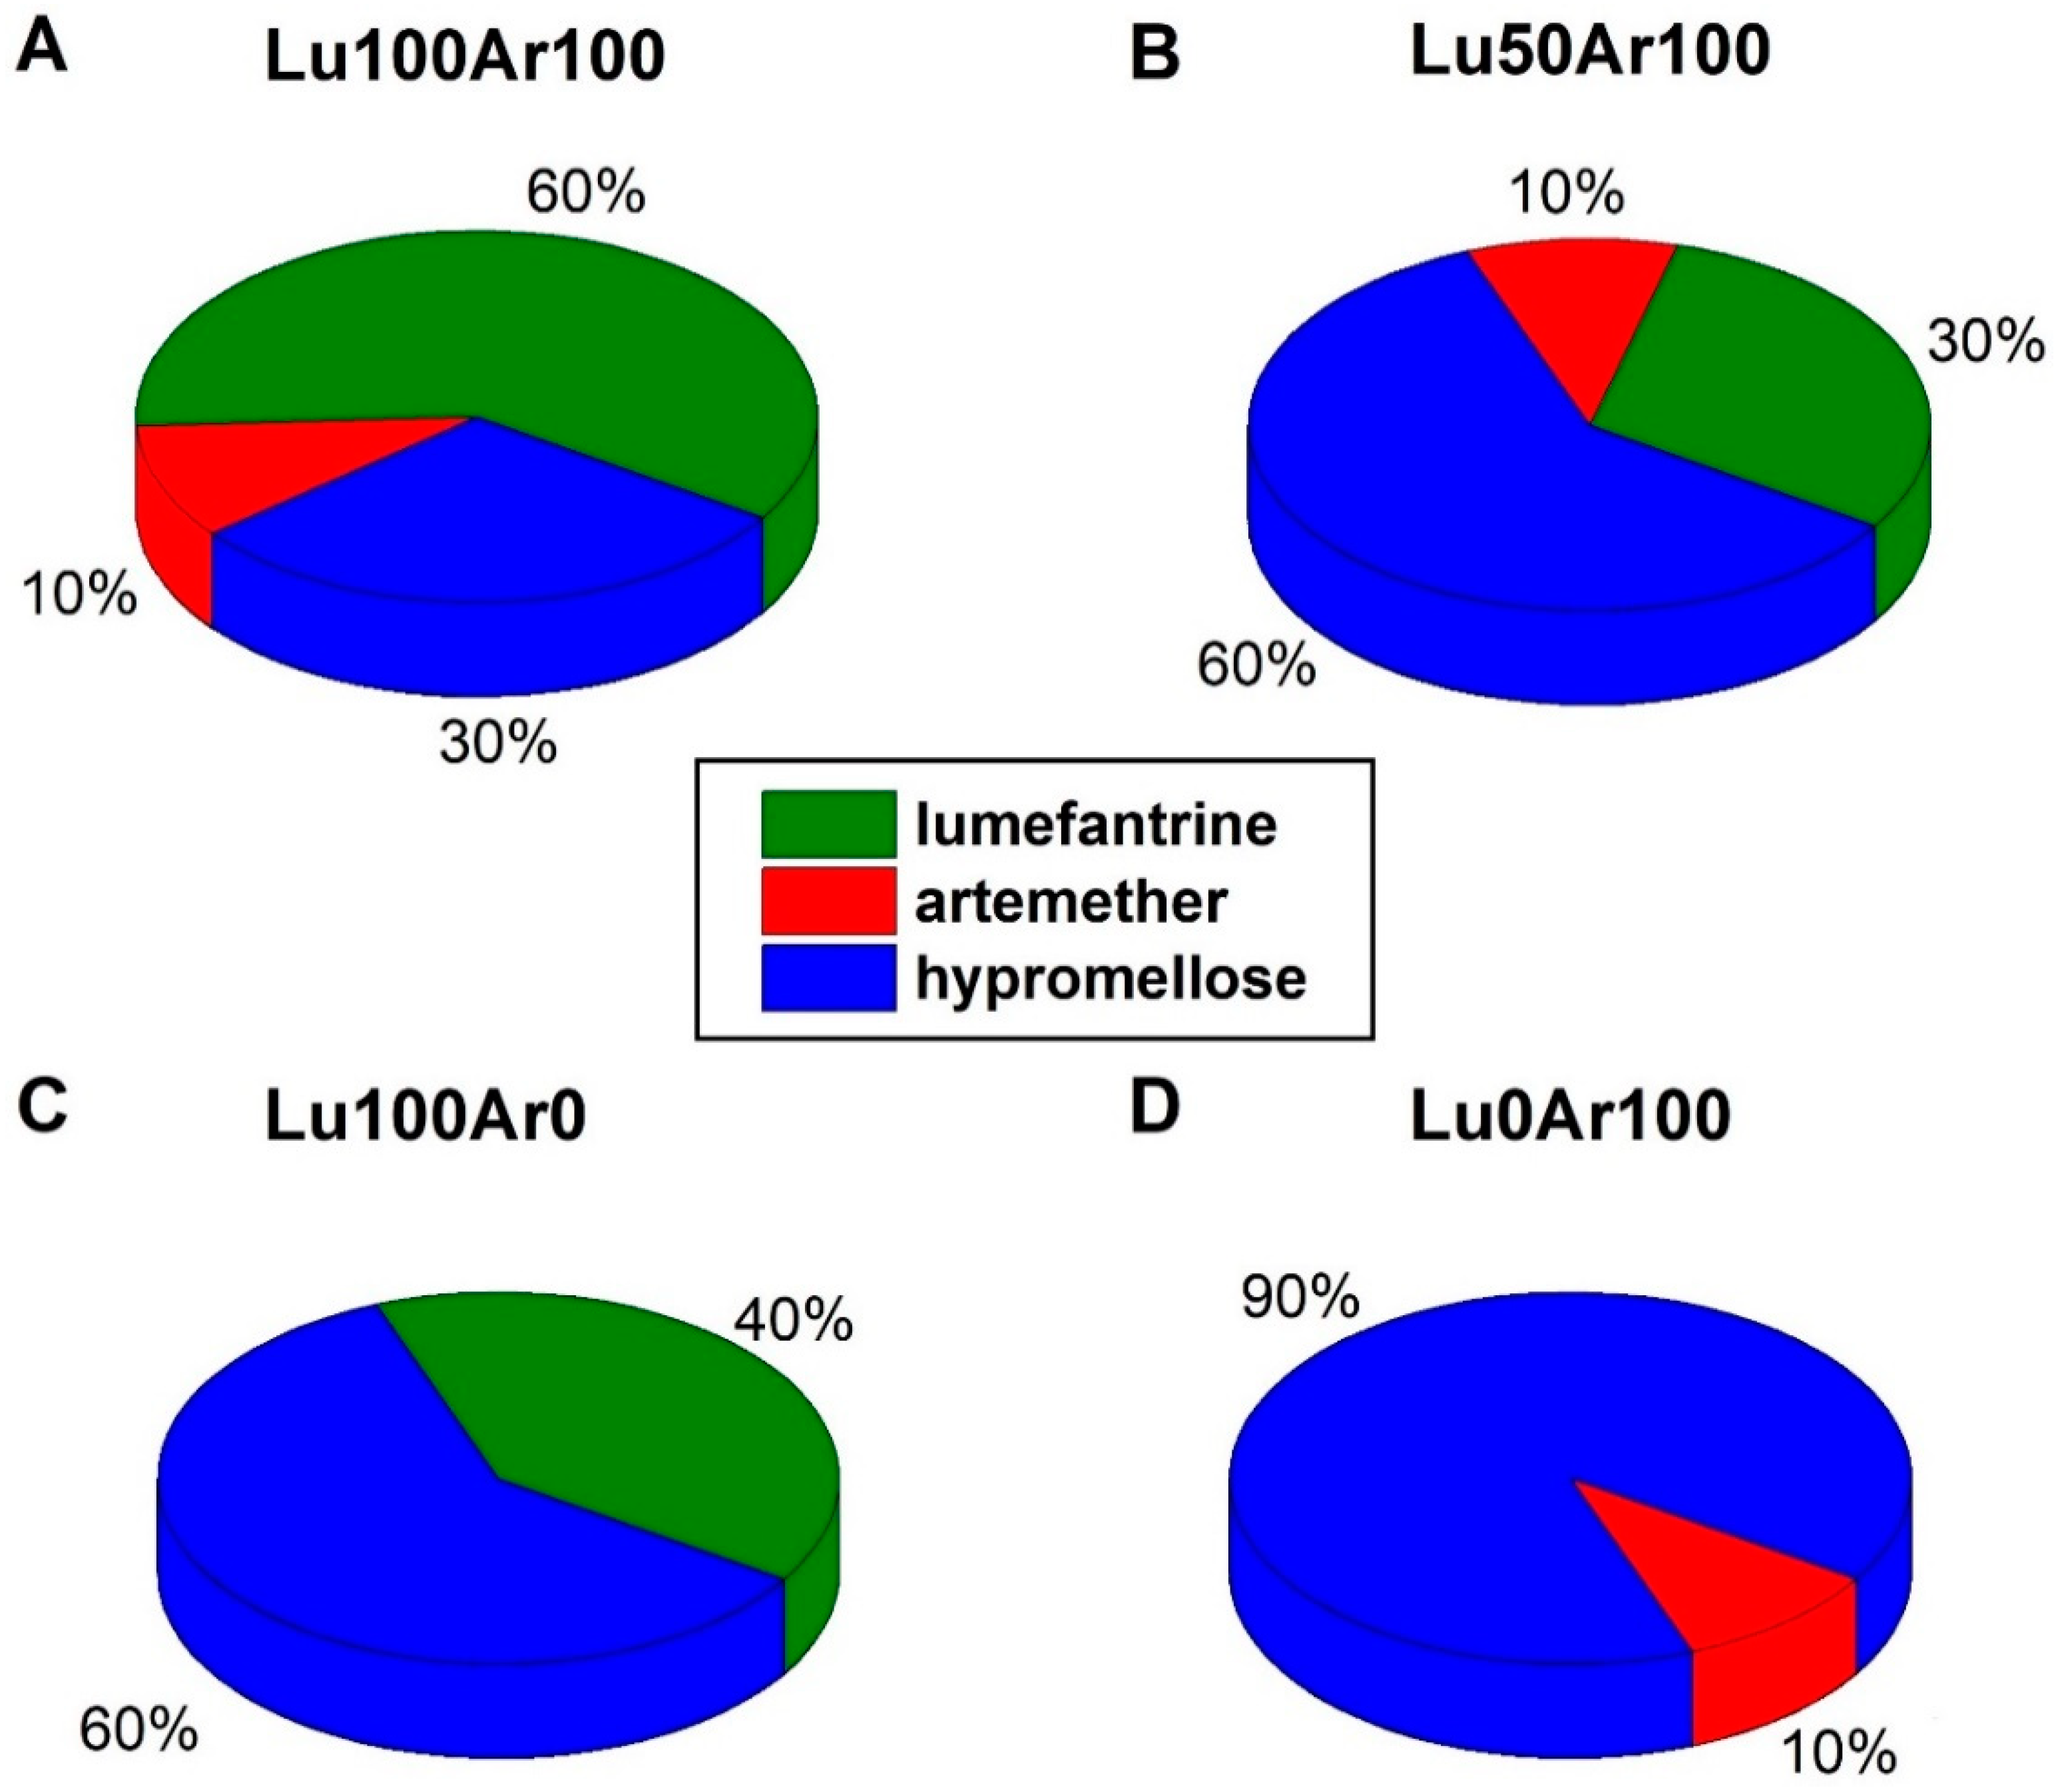
3.1. Chemicals and Tablets
3.2. FT-Raman Spectroscopy
3.3. Density Functional Theory Calculation
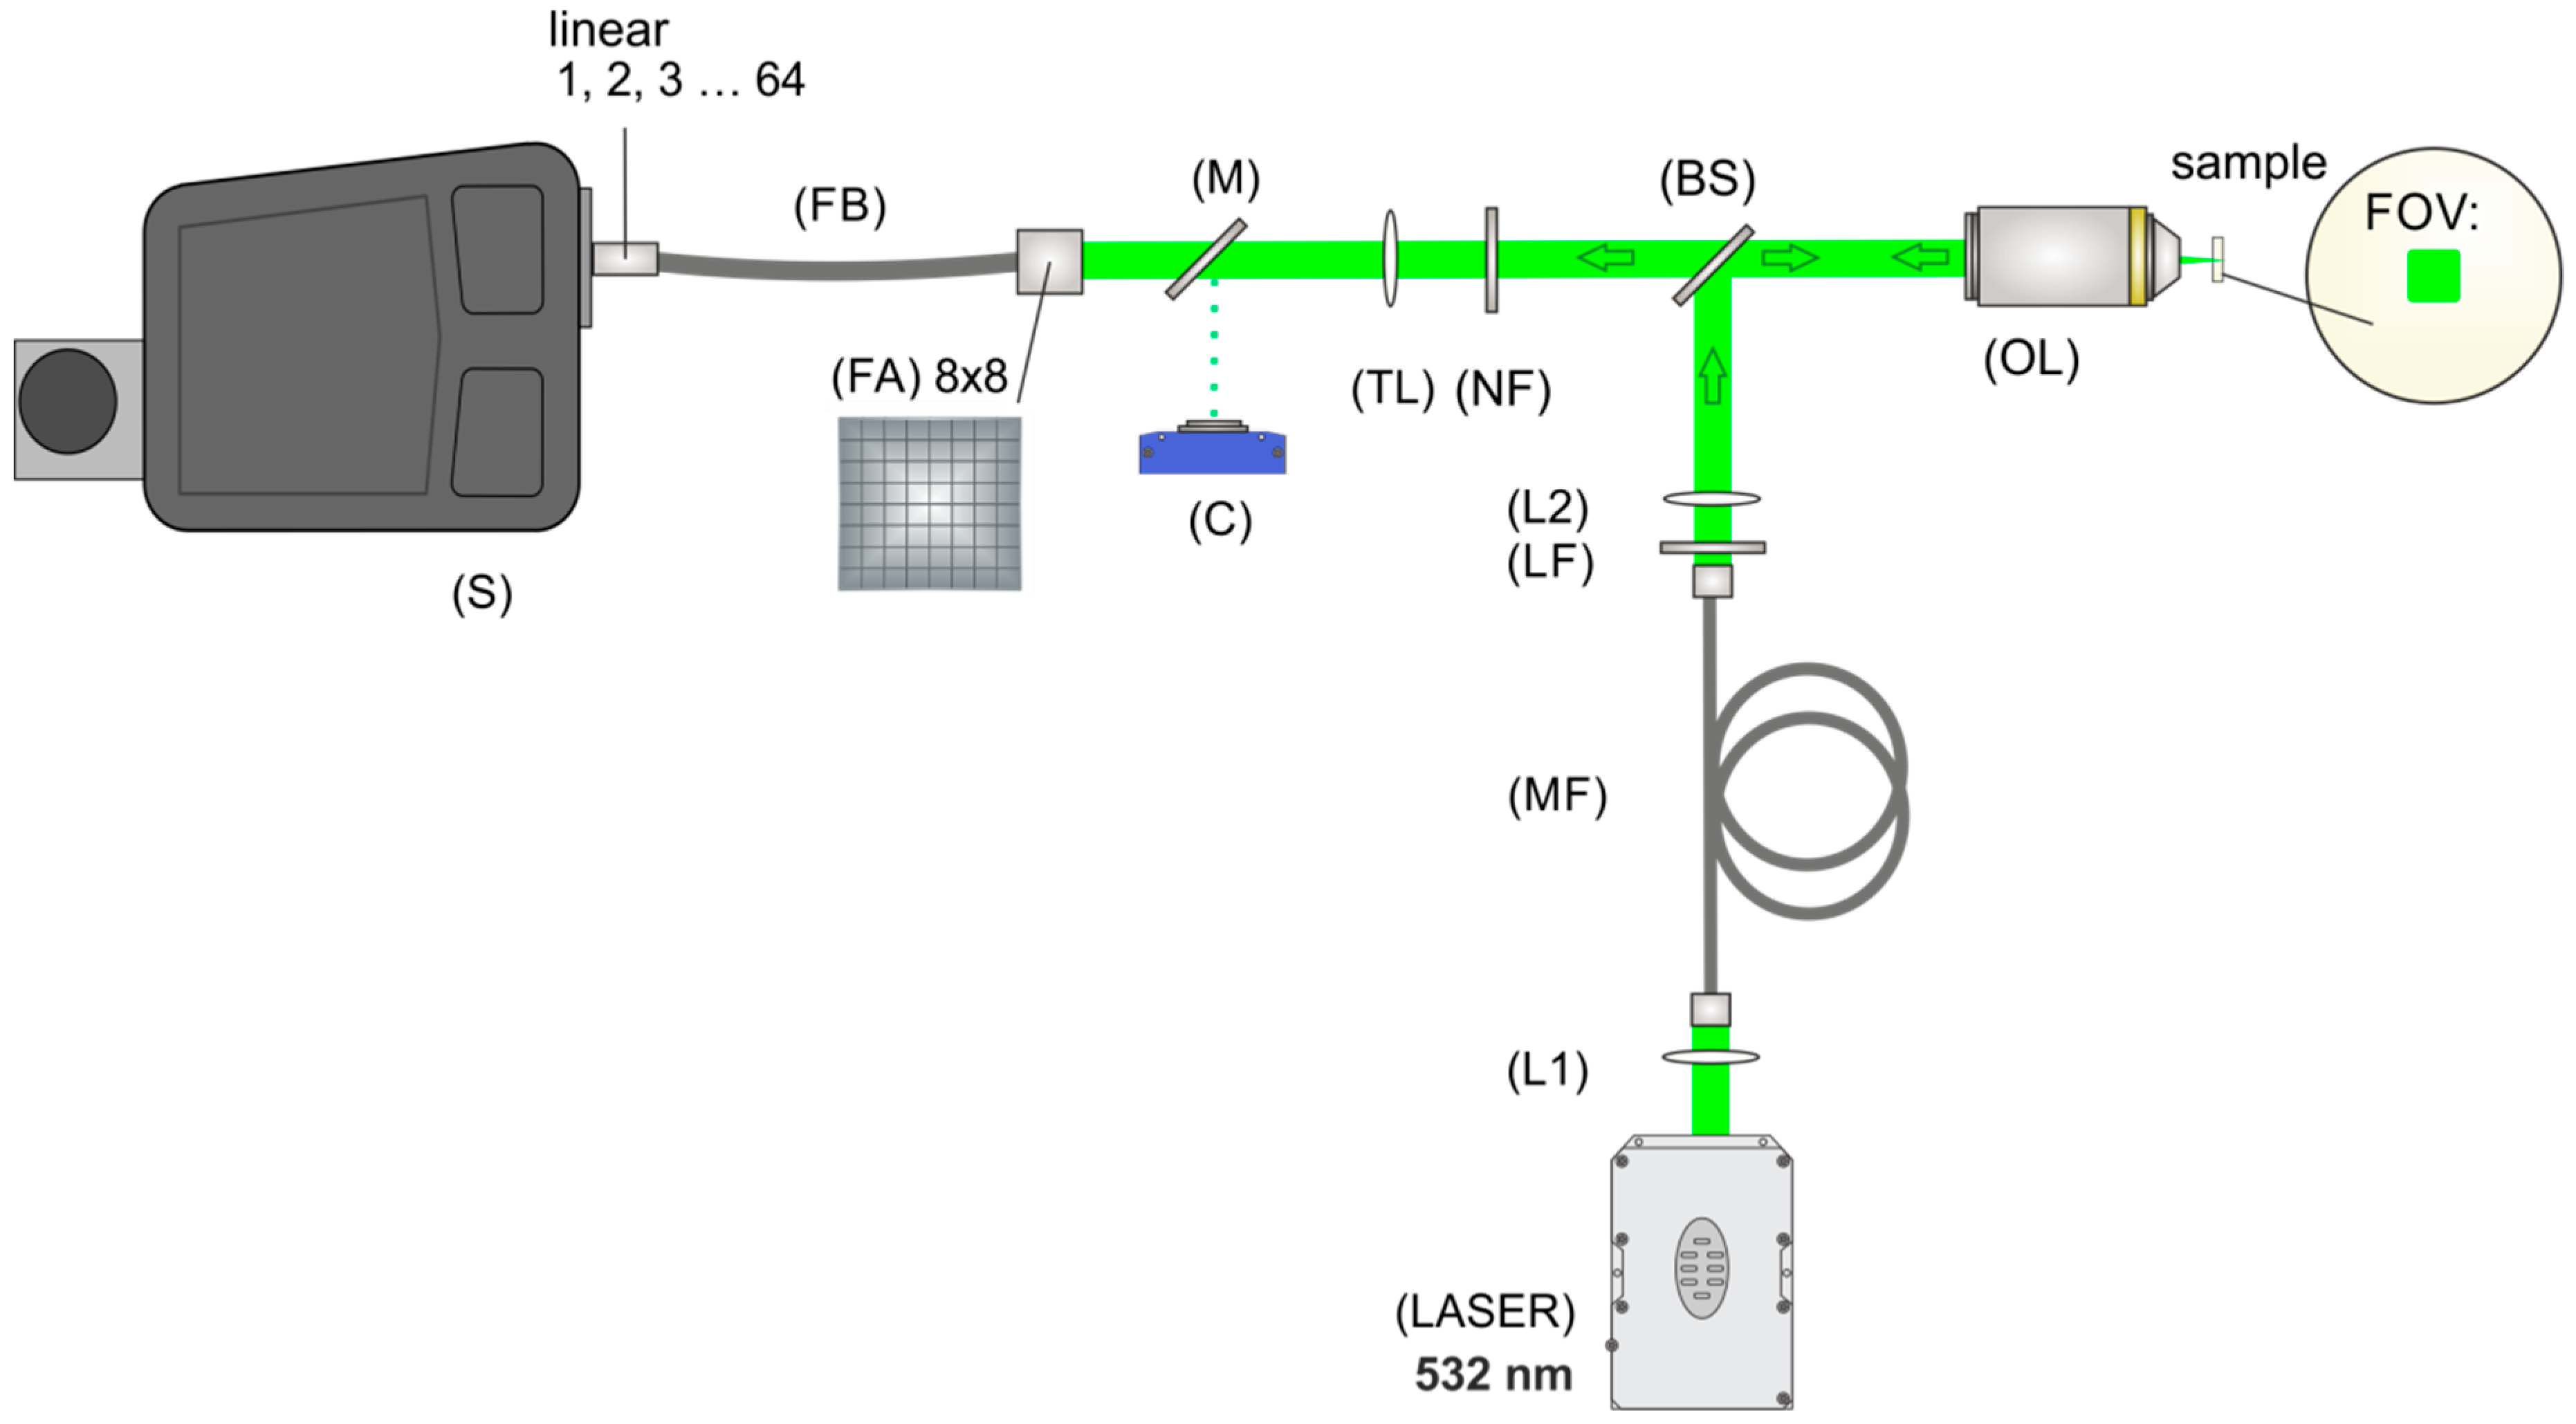
3.4. Fiber-Array Based Hyperspectral Imaging
3.5. Partial Least-Squares Regression Model for the Ingredients’ Quantification
4. Conclusions
Supplementary Materials
Author Contributions
Funding
Conflicts of Interest
References
- WHO. Substandard and Counterfeit Medicines; Fact Sheet 275; WHO Media Centre: Geneva, Switzerland, 2003. [Google Scholar]
- WHO. WHO Global Surveillance and Monitoring System for Substandard and Falsified Medical Products; WHO: Geneva, Switzerland, 2017; ISBN 978-92-4-151342-5. [Google Scholar]
- Newton, P.N.; Green, M.D.; Fernández, F.M.; Day, N.P.; White, N.J. Counterfeit anti-infective drugs. Lancet Infect. Dis. 2006, 6, 602–613. [Google Scholar] [CrossRef]
- Tabernero, P.; Fernández, F.M.; Green, M.; Guerin, P.J.; Newton, P.N. Mind the gaps-the epidemiology of poor-quality anti-malarials in the malarious world-analysis of the WorldWide Antimalarial Resistance Network database. Malar. J. 2014, 13, 139. [Google Scholar] [CrossRef] [PubMed]
- Faucon Benoit, M.C.; Whalen, J. Africa’s Malaria Battle: Fake Drug Pipeline Undercuts Progress. Wall Str. J. 2013. Available online: https://www.wsj.com/articles/thieves-hijacking-malaria-drugs-in-africa-1384216610 (accessed on 3 September 2019).
- FDA. FDA Facts: FDA’s Counterfeit Detection Device CD-3; FDA: Rockville, MD, USA, 2013. [Google Scholar]
- Green, M.D.; Hostetler, D.M.; Nettey, H.; Swamidoss, I.; Ranieri, N.; Newton, P.N. Integration of Novel Low-Cost Colorimetric, Laser Photometric, and Visual Fluorescent Techniques for Rapid Identification of Falsified Medicines in Resource-Poor Areas: Application to Artemether–Lumefantrine. Am. J. Trop. Med. Hyg. 2015, 92 (Suppl. S6), 8–16. [Google Scholar] [CrossRef] [PubMed]
- Knebl, A.; Domes, R.; Yan, D.; Popp, J.; Trumbore, S.; Frosch, T. Fiber-Enhanced Raman Gas Spectroscopy for 18O–13C-Labeling Experiments. Anal. Chem. 2019, 91, 7562–7569. [Google Scholar] [CrossRef] [PubMed]
- Yan, D.; Frosch, T.; Kobelke, J.; Bierlich, J.; Popp, J.; Pletz, M.W.; Frosch, T. Fiber-Enhanced Raman Sensing of Cefuroxime in Human Urine. Anal. Chem. 2018, 90, 13243–13248. [Google Scholar] [CrossRef] [PubMed]
- Yan, D.; Popp, J.; Pletz, M.W.; Frosch, T. Highly Sensitive Broadband Raman Sensing of Antibiotics in Step-Index Hollow-Core Photonic Crystal Fibers. ACS Photonics 2017, 4, 138–145. [Google Scholar] [CrossRef]
- Keiner, R.; Herrmann, M.; Kusel, K.; Popp, J.; Frosch, T. Rapid monitoring of intermediate states and mass balance of nitrogen during denitrification by means of cavity enhanced Raman multi-gas sensing. Anal. Chim. Acta 2015, 864, 39–47. [Google Scholar] [CrossRef] [PubMed]
- Jochum, T.; Michalzik, B.; Bachmann, A.; Popp, J.; Frosch, T. Microbial respiration and natural attenuation of benzene contaminated soils investigated by cavity enhanced Raman multi-gas spectroscopy. Analyst 2015, 140, 3143–3149. [Google Scholar] [CrossRef]
- Frosch, T.; Popp, J. Structural analysis of the antimalarial drug halofantrine by means of Raman spectroscopy and density functional theory calculations. J. Biomed. Opt. 2010, 15, 041516. [Google Scholar] [CrossRef]
- Frosch, T.; Chan, K.L.; Wong, H.C.; Cabral, J.T.; Kazarian, S.G. Nondestructive three-dimensional analysis of layered polymer structures with chemical imaging. Langmuir 2010, 26, 19027–19032. [Google Scholar] [CrossRef] [PubMed]
- Hanf, S.; Fischer, S.; Hartmann, H.; Keiner, R.; Trumbore, S.; Popp, J.; Frosch, T. Online investigation of respiratory quotients in Pinus sylvestris and Picea abies during drought and shading by means of cavity-enhanced Raman multi-gas spectrometry. Analyst 2015, 140, 4473–4481. [Google Scholar] [CrossRef] [PubMed]
- Jochum, T.; Fastnacht, A.; Trumbore, S.E.; Popp, J.; Frosch, T. Direct Raman Spectroscopic Measurements of Biological Nitrogen Fixation under Natural Conditions: An Analytical Approach for Studying Nitrogenase Activity. Anal. Chem. 2017, 89, 1117–1122. [Google Scholar] [CrossRef] [PubMed]
- Jochum, T.; Rahal, L.; Suckert, R.J.; Popp, J.; Frosch, T. All-in-one: A versatile gas sensor based on fiber enhanced Raman spectroscopy for monitoring postharvest fruit conservation and ripening. Analyst 2016, 141, 2023–2029. [Google Scholar] [CrossRef] [PubMed]
- Bogozi, T.; Popp, J.; Frosch, T. Fiber-enhanced Raman multi-gas spectroscopy: What is the potential of its application to breath analysis? Future Sci. Bioanal. 2015, 7, 281–284. [Google Scholar] [CrossRef]
- Yan, D.; Popp, J.; Frosch, T. Analysis of Fiber-Enhanced Raman Gas Sensing Based on Raman Chemical Imaging. Anal. Chem. 2017, 89, 12269–12275. [Google Scholar] [CrossRef] [PubMed]
- Domes, C.; Domes, R.; Popp, J.; Pletz, M.W.; Frosch, T. Ultrasensitive Detection of Antiseptic Antibiotics in Aqueous Media and Human Urine Using Deep UV Resonance Raman Spectroscopy. Anal. Chem. 2017, 89, 9997–10003. [Google Scholar] [CrossRef]
- Yan, D.; Domes, C.; Domes, R.; Frosch, T.; Popp, J.; Pletz, M.W.; Frosch, T. Fiber enhanced Raman spectroscopic analysis as a novel method for diagnosis and monitoring of diseases related to hyperbilirubinemia and hyperbiliverdinemia. Analyst 2016, 141, 6104–6115. [Google Scholar] [CrossRef]
- Yan, D.; Popp, J.; Pletz, M.W.; Frosch, T. Fiber enhanced Raman sensing of levofloxacin by PCF bandgap-shifting into the visible range. Anal. Methods-UK 2018, 10, 586–592. [Google Scholar] [CrossRef]
- Knebl, A.; Yan, D.; Popp, J.; Frosch, T. Fiber enhanced Raman gas spectroscopy. Trac-Trend Anal. Chem. 2018, 103, 230–238. [Google Scholar] [CrossRef]
- Jochum, T.; von Fischer, J.C.; Trumbore, S.; Popp, J.; Frosch, T. Multigas Leakage Correction in Static Environmental Chambers Using Sulfur Hexafluoride and Raman Spectroscopy. Anal. Chem. 2015, 87, 11137–11142. [Google Scholar] [CrossRef] [PubMed]
- Domes, R.; Domes, C.; Albert, C.R.; Bringmann, G.; Popp, J.; Frosch, T. Vibrational spectroscopic characterization of arylisoquinolines by means of Raman spectroscopy and density functional theory calculations. Phys. Chem. Chem. Phys. 2017, 19, 29918–29926. [Google Scholar] [CrossRef] [PubMed]
- Sieburg, A.; Jochum, T.; Trumbore, S.E.; Popp, J.; Frosch, T. Onsite cavity enhanced Raman spectrometry for the investigation of gas exchange processes in the Earth’s critical zone. Analyst 2017, 142, 3360–3369. [Google Scholar] [CrossRef] [PubMed]
- Sieburg, A.; Schneider, S.; Yan, D.; Popp, J.; Frosch, T. Monitoring of gas composition in a laboratory biogas plant using cavity enhanced Raman spectroscopy. Analyst 2018, 143, 1358–1366. [Google Scholar] [CrossRef] [PubMed]
- Keiner, R.; Gruselle, M.C.; Michalzik, B.; Popp, J.; Frosch, T. Raman spectroscopic investigation of 13CO2 labeling and leaf dark respiration of Fagus sylvatica L. (European beech). Anal. Bioanal. Chem. 2015, 407, 1813–1817. [Google Scholar] [CrossRef] [PubMed]
- Mustapha Hajjou, P.L. Potential use of handheld Raman devices as tools for screening medicines for quality. BioPharma Asia 2014, 2014, 15–21. [Google Scholar]
- Ricci, C.; Nyadong, L.; Yang, F.; Fernandez, F.M.; Brown, C.D.; Newton, P.N.; Kazarian, S.G. Assessment of hand-held Raman instrumentation for in situ screening for potentially counterfeit artesunate antimalarial tablets by FT-Raman spectroscopy and direct ionization mass spectrometry. Anal. Chim. Acta 2008, 623, 178–186. [Google Scholar] [CrossRef] [PubMed]
- Eliasson, C.; Matousek, P. Noninvasive authentication of pharmaceutical products through packaging using spatially offset Raman spectroscopy. Anal. Chem. 2007, 79, 1696–1701. [Google Scholar] [CrossRef] [PubMed]
- Visser, B.J.; de Vries, S.G.; Bache, E.B.; Meerveld-Gerrits, J.; Kroon, D.; Boersma, J.; Agnandji, S.T.; van Vugt, M.; Grobusch, M.P. The diagnostic accuracy of the hand-held Raman spectrometer for the identification of anti-malarial drugs. Malar. J. 2016, 15, 160. [Google Scholar] [CrossRef] [PubMed]
- Kandpal, L.M.; Cho, B.-K.; Tewari, J.; Gopinathan, N. Raman spectral imaging technique for API detection in pharmaceutical microtablets. Sens. Actuators B Chem. 2018, 260, 213–222. [Google Scholar] [CrossRef]
- Brueckner, M.; Becker, K.; Popp, J.; Frosch, T. Fiber array based hyperspectral Raman imaging for chemical selective analysis of malaria-infected red blood cells. Anal. Chim. Acta 2015, 894, 76–84. [Google Scholar] [CrossRef] [PubMed]
- Brauchle, E.; Thude, S. Cell death stages in single apoptotic and necrotic cells monitored by Raman microspectroscopy. Sci. Rep. 2014, 4, 4698. [Google Scholar] [CrossRef] [PubMed]
- Zhang, J.; Liu, S.-Z.; Yang, J.; Song, M.; Song, J.; Du, H.-L.; Chen, Z.-P. Quantitative spectroscopic analysis of heterogeneous systems: Chemometric methods for the correction of multiplicative light scattering effects. Rev. Anal. Chem. 2013, 32, 113–125. [Google Scholar] [CrossRef]
- Kessler, W. Multivariate Datenanalyse für die Pharma-, Bio- und Prozessanalytik; Wiley VCH: Weinheim, Germany, 2007. [Google Scholar]
- Salzer, R.; Siesler, H.W. Infrared and Raman Spectroscopic Imaging; Wiley-VCH: Weinheim, Germany, 2014; Volume 2. [Google Scholar]
- Galvao, R.K.H.; Araujo, M.C.U.; José, G.E.; Pontes, M.J.C.; Silva, E.C.; Saldanha, T.C.B. A method for calibration and validation subset partitioning. Talanta 2005, 67, 736–740. [Google Scholar] [CrossRef] [PubMed]
- De Groot, P.J.; Postma, G.J.; Melssen, W.J.; Buydens, L.M.C. Selecting a representative training set for the classification of demolition waste using remote NIR sensing. Anal. Chim. Acta 1999, 392, 67–75. [Google Scholar] [CrossRef]
- USP. <905> Uniformity of Dosage Units; United States Pharmacopeia Convention: Rockville, MD, USA, 2015. [Google Scholar]
- Frisch, M.; Trucks, G.; Schlegel, H.; Scuseria, G.; Robb, M.; Cheeseman, J.; Scalmani, G.; Barone, V.; Mennucci, B.; Petersson, G. GAUSSIAN09; Revision E. 01; Gaussian Inc.: Wallingford, CT, USA, 2009. [Google Scholar]
- Becke, A. Density-functional thermochemistry. II. The effect of the Perdew–Wang generalized-gradient correlation correction. J. Chem. Phys. 1992, 97, 9173–9177. [Google Scholar] [CrossRef]
- Stephens, P.; Devlin, F.; Chabalowski, C.; Frisch, M.J. Ab initio calculation of vibrational absorption and circular dichroism spectra using density functional force fields. J. Phys. Chem. 1994, 98, 11623–11627. [Google Scholar] [CrossRef]
- Lee, C.; Yang, W.; Parr, R. Development of the Colle-Salvetti correlation-energy formula into a functional of the electron density. Phys. Rev. B 1988, 37, 785. [Google Scholar] [CrossRef]
- Dunning, T.H. A road map for the calculation of molecular binding energies. J. Phys. Chem. A 2000, 104, 9062–9080. [Google Scholar] [CrossRef]
- Polavarapu, P. Ab initio vibrational Raman and Raman optical activity spectra. J. Phys. Chem. 1990, 94, 8106–8112. [Google Scholar] [CrossRef]
Sample Availability: Samples of the compounds are not available. |


| Lumefantrine | Artemether | ||||||||
|---|---|---|---|---|---|---|---|---|---|
| Peak Position/cm−1 | Peak Position/cm−1 | ||||||||
| Identification | Measured 532 nm | Measured FT-Raman | Calculated * | Band Assignment | Identification | Measured 532 nm | Measured FT-Raman | Calculated * | Band Assignment |
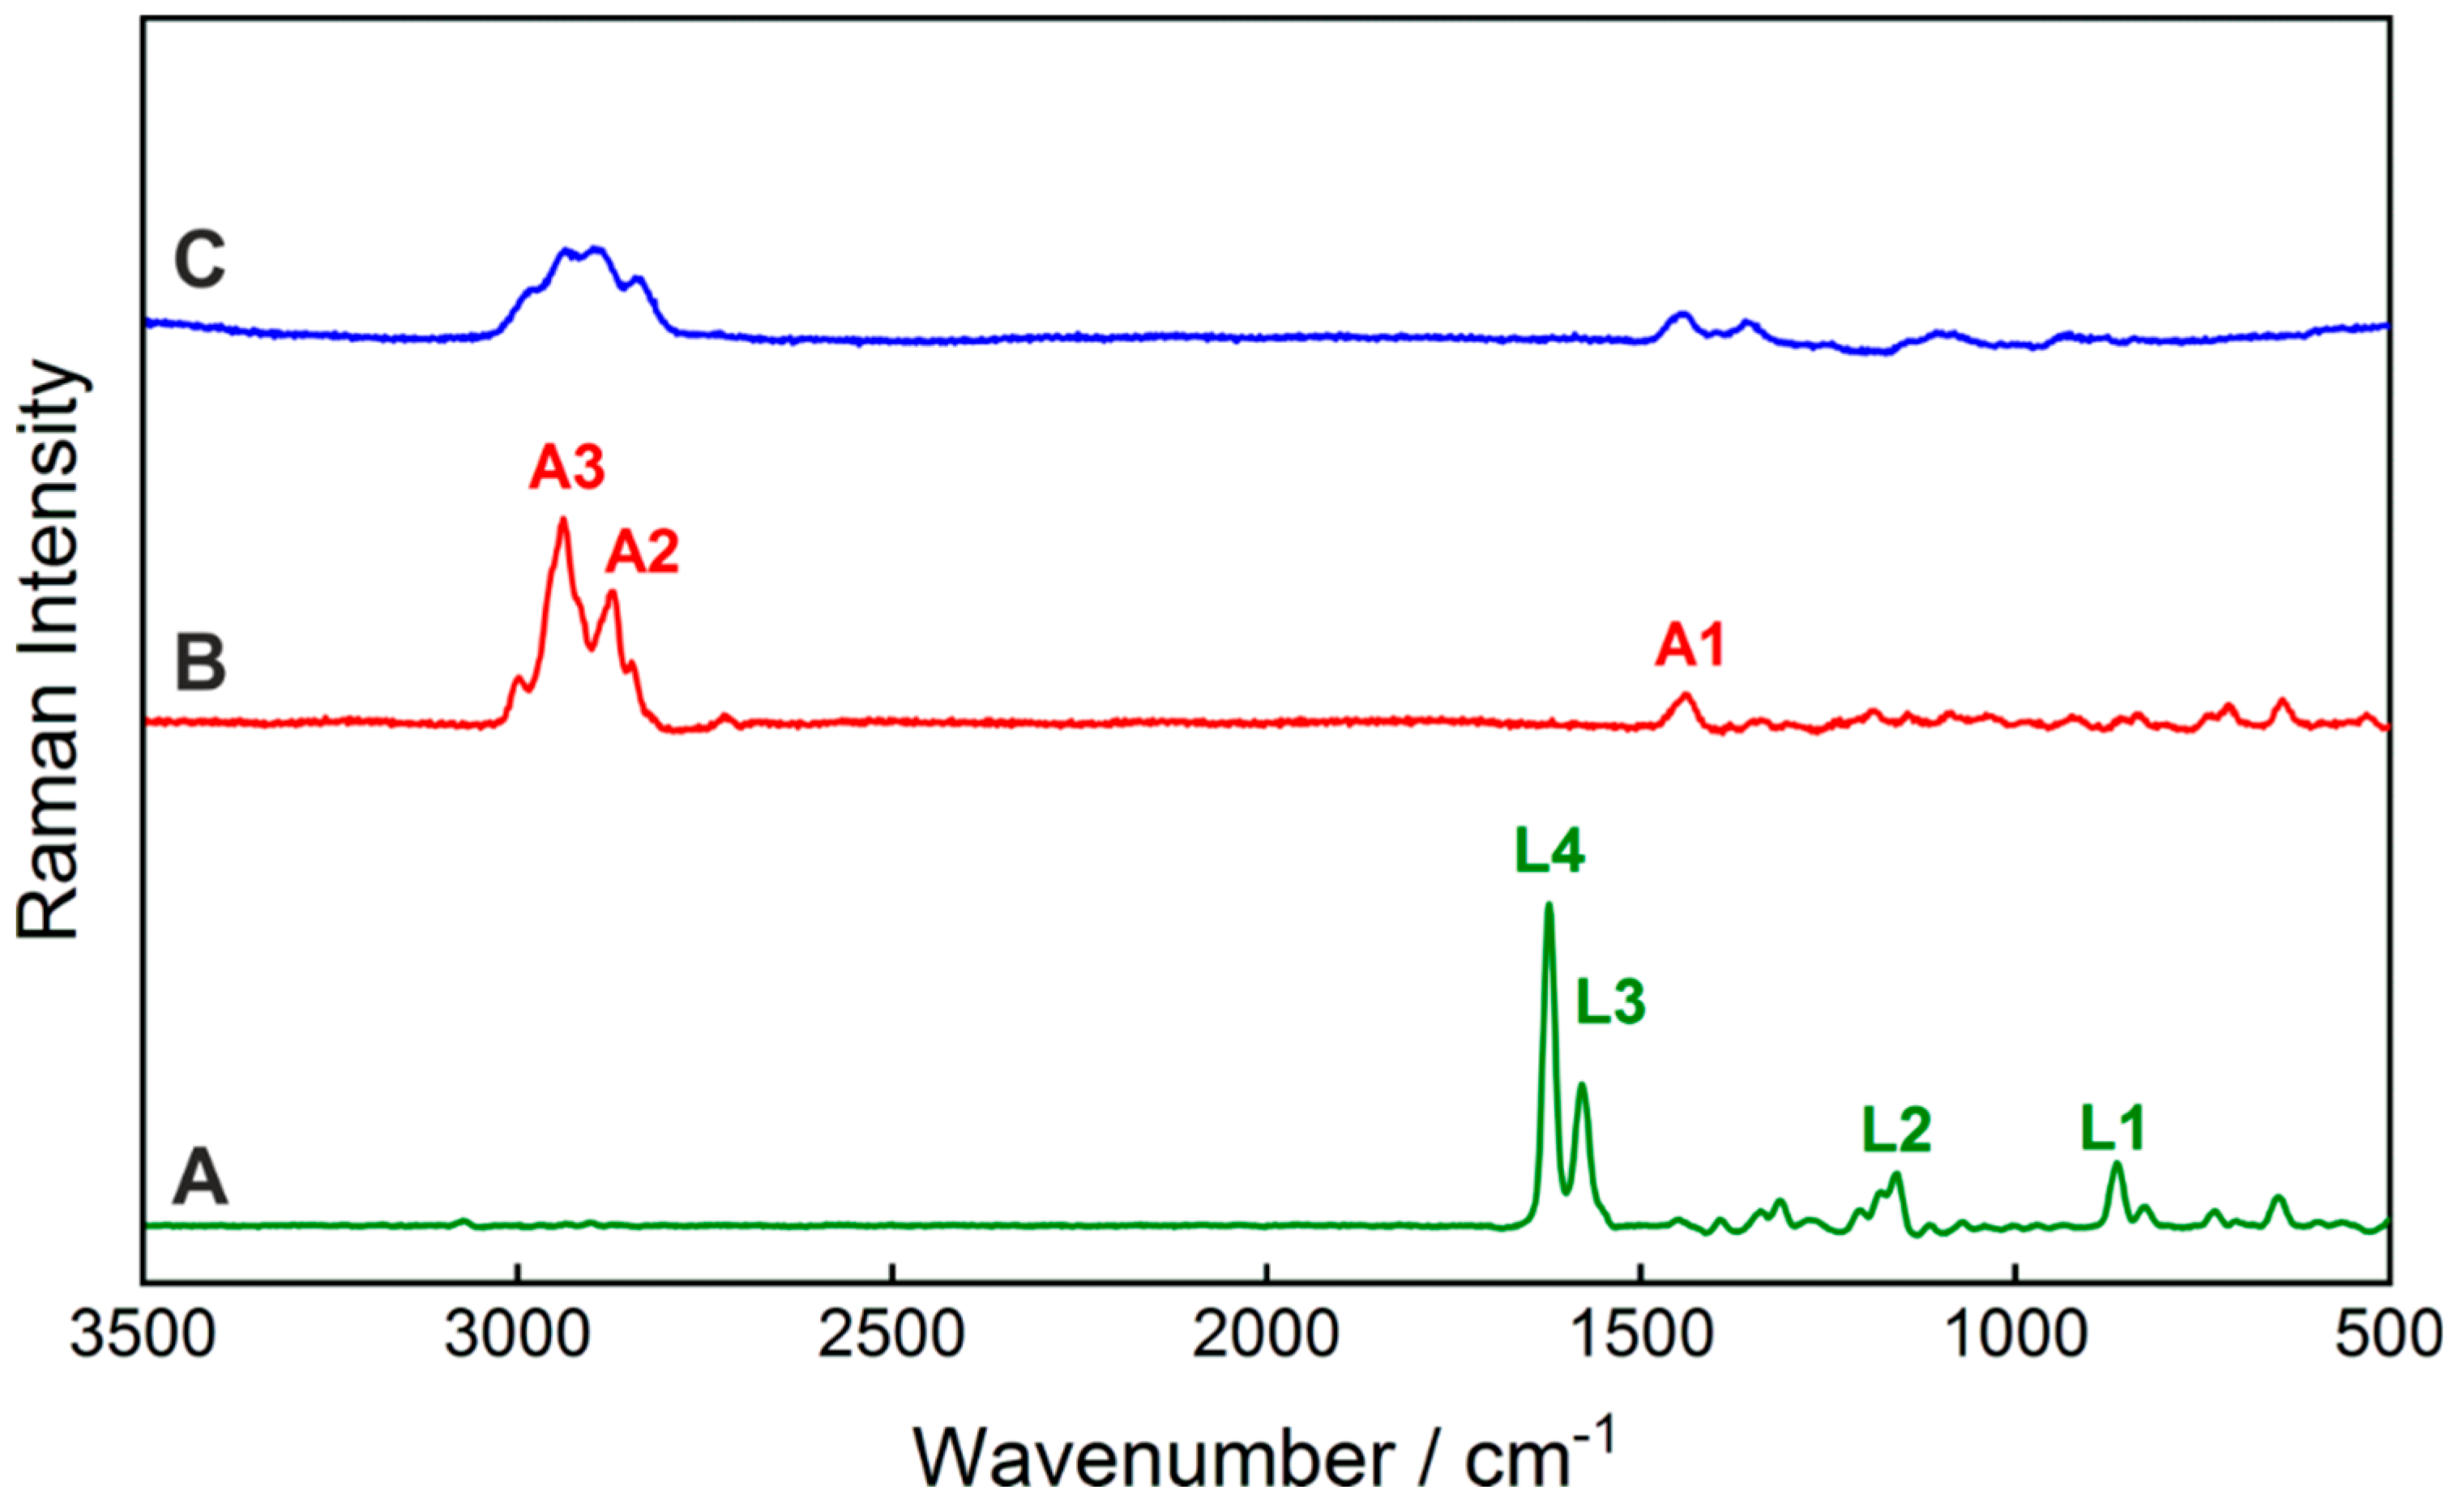
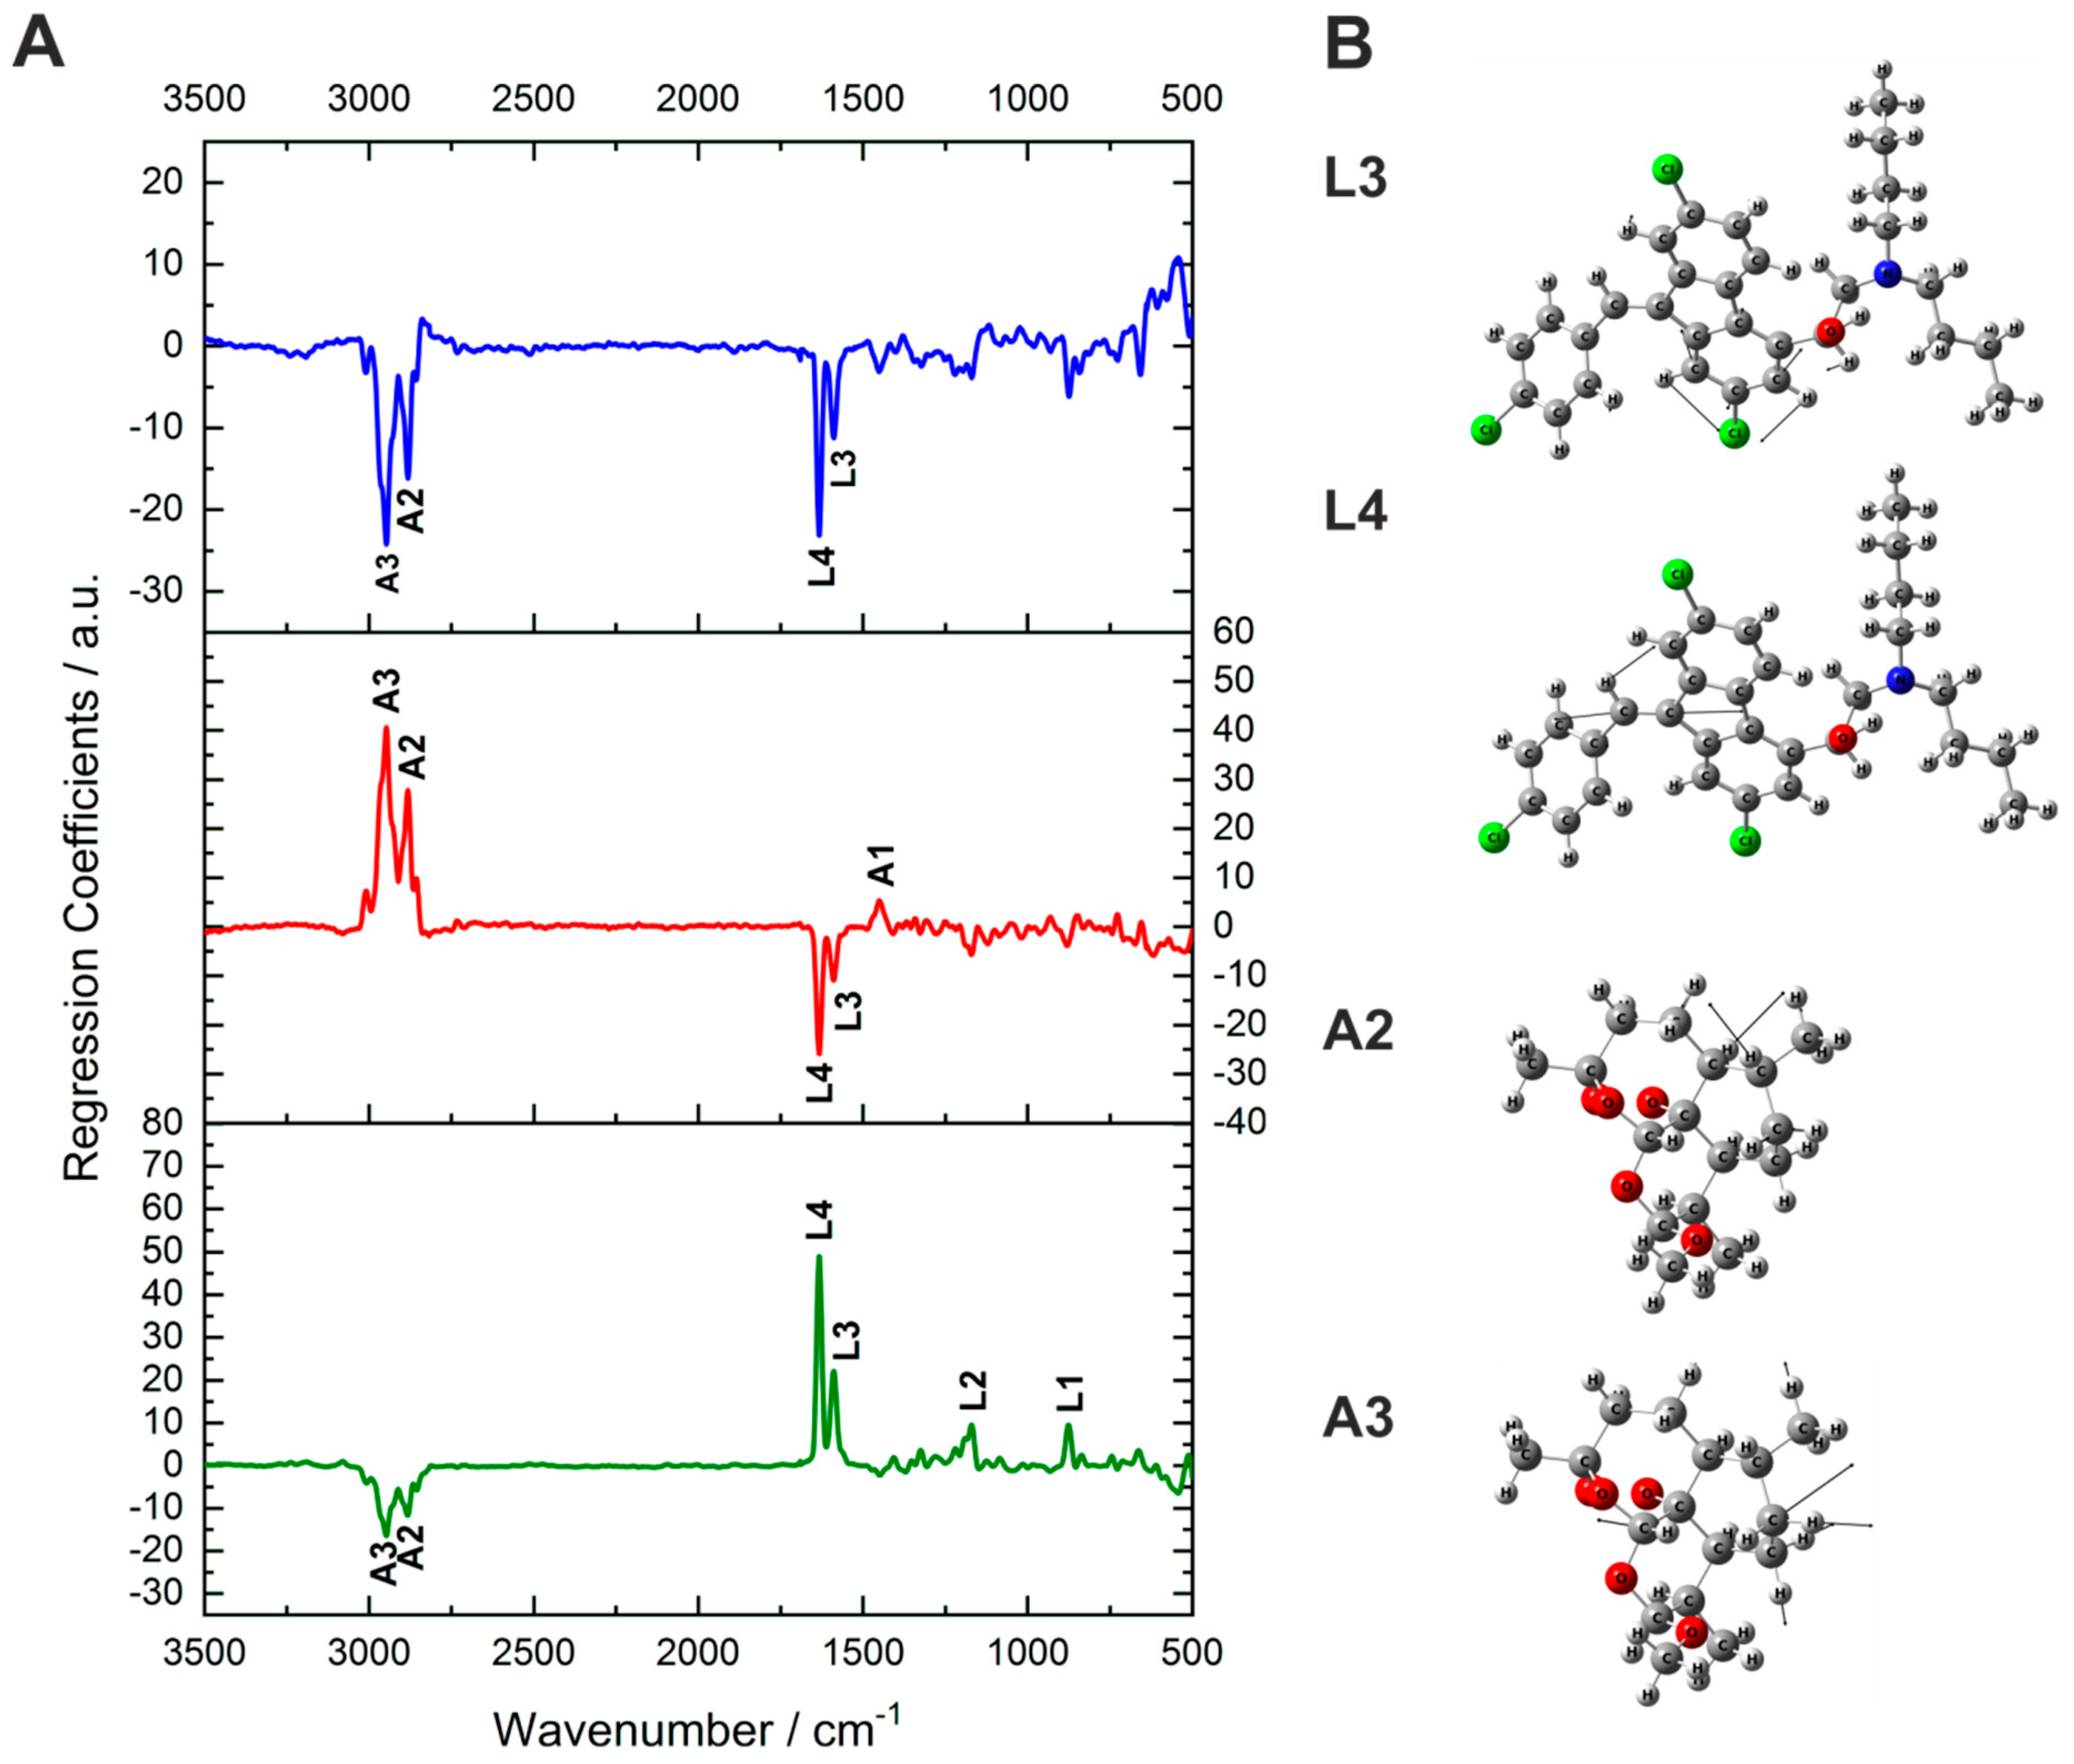
| L1 | 865 | 876 | 875 | δCH + ωCH | A1 | 1442 | 1454 | 1455 | δsCH3 |
| L2 | 1180 | 1172 | 1170 | δCH | A2 | 2872 | 2873 | 2874 | νasCH2 (+ νCH) |
| L3 | 1580 | 1589 | 1587 | νb + δCH | A3 | 2940 | 2937 | 2937 | νasCH2 |
| L4 | 1623 | 1635 | 1640 | νC=C + δCH | |||||
| Tablet | Lumefantrine Concentration/wt% | Artemether Concentration/wt% | ||||
|---|---|---|---|---|---|---|
| Expected | Predicted | ydev | Expected | Predicted | ydev | |
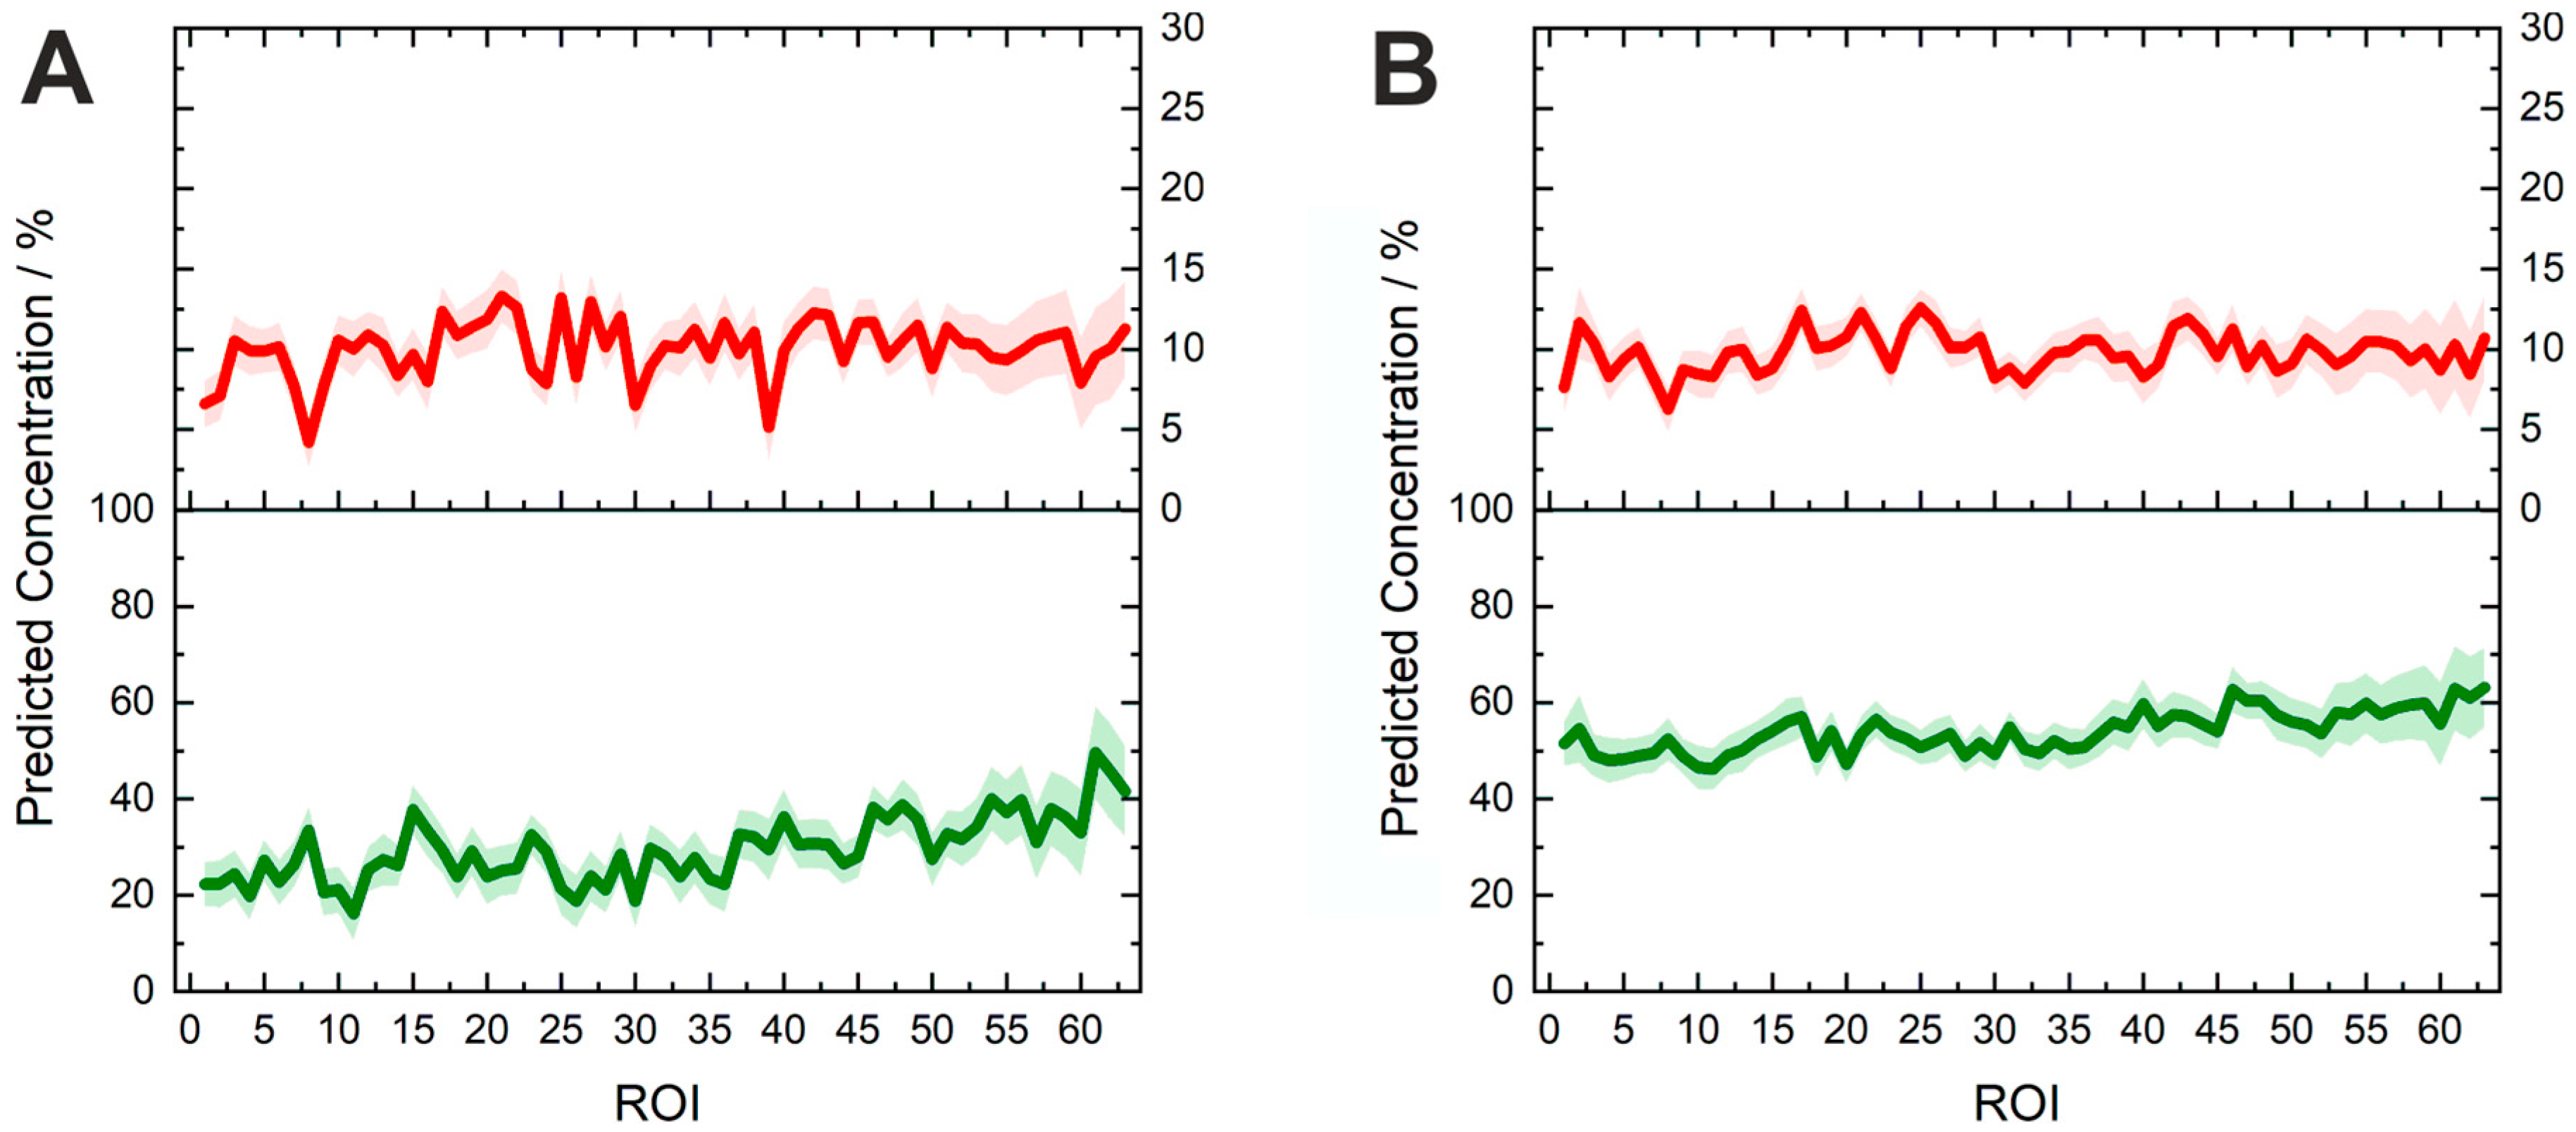
| Lu100Ar100 | 60.0 | 57.8 | 4.5 | 10.0 | 9.5 | 1.4 |
| Lu50Ar100 | 30.0 | 44.1 | 6.1 | 10.0 | 9.1 | 1.9 |
| Lu100Ar0 | 60.0 | 59.8 | 7.7 | 0.0 | 1.0 | 2.4 |
| Lu0Ar100 | 0.0 | 1.2 | 6.3 | 10.0 | 11.4 | 2.0 |
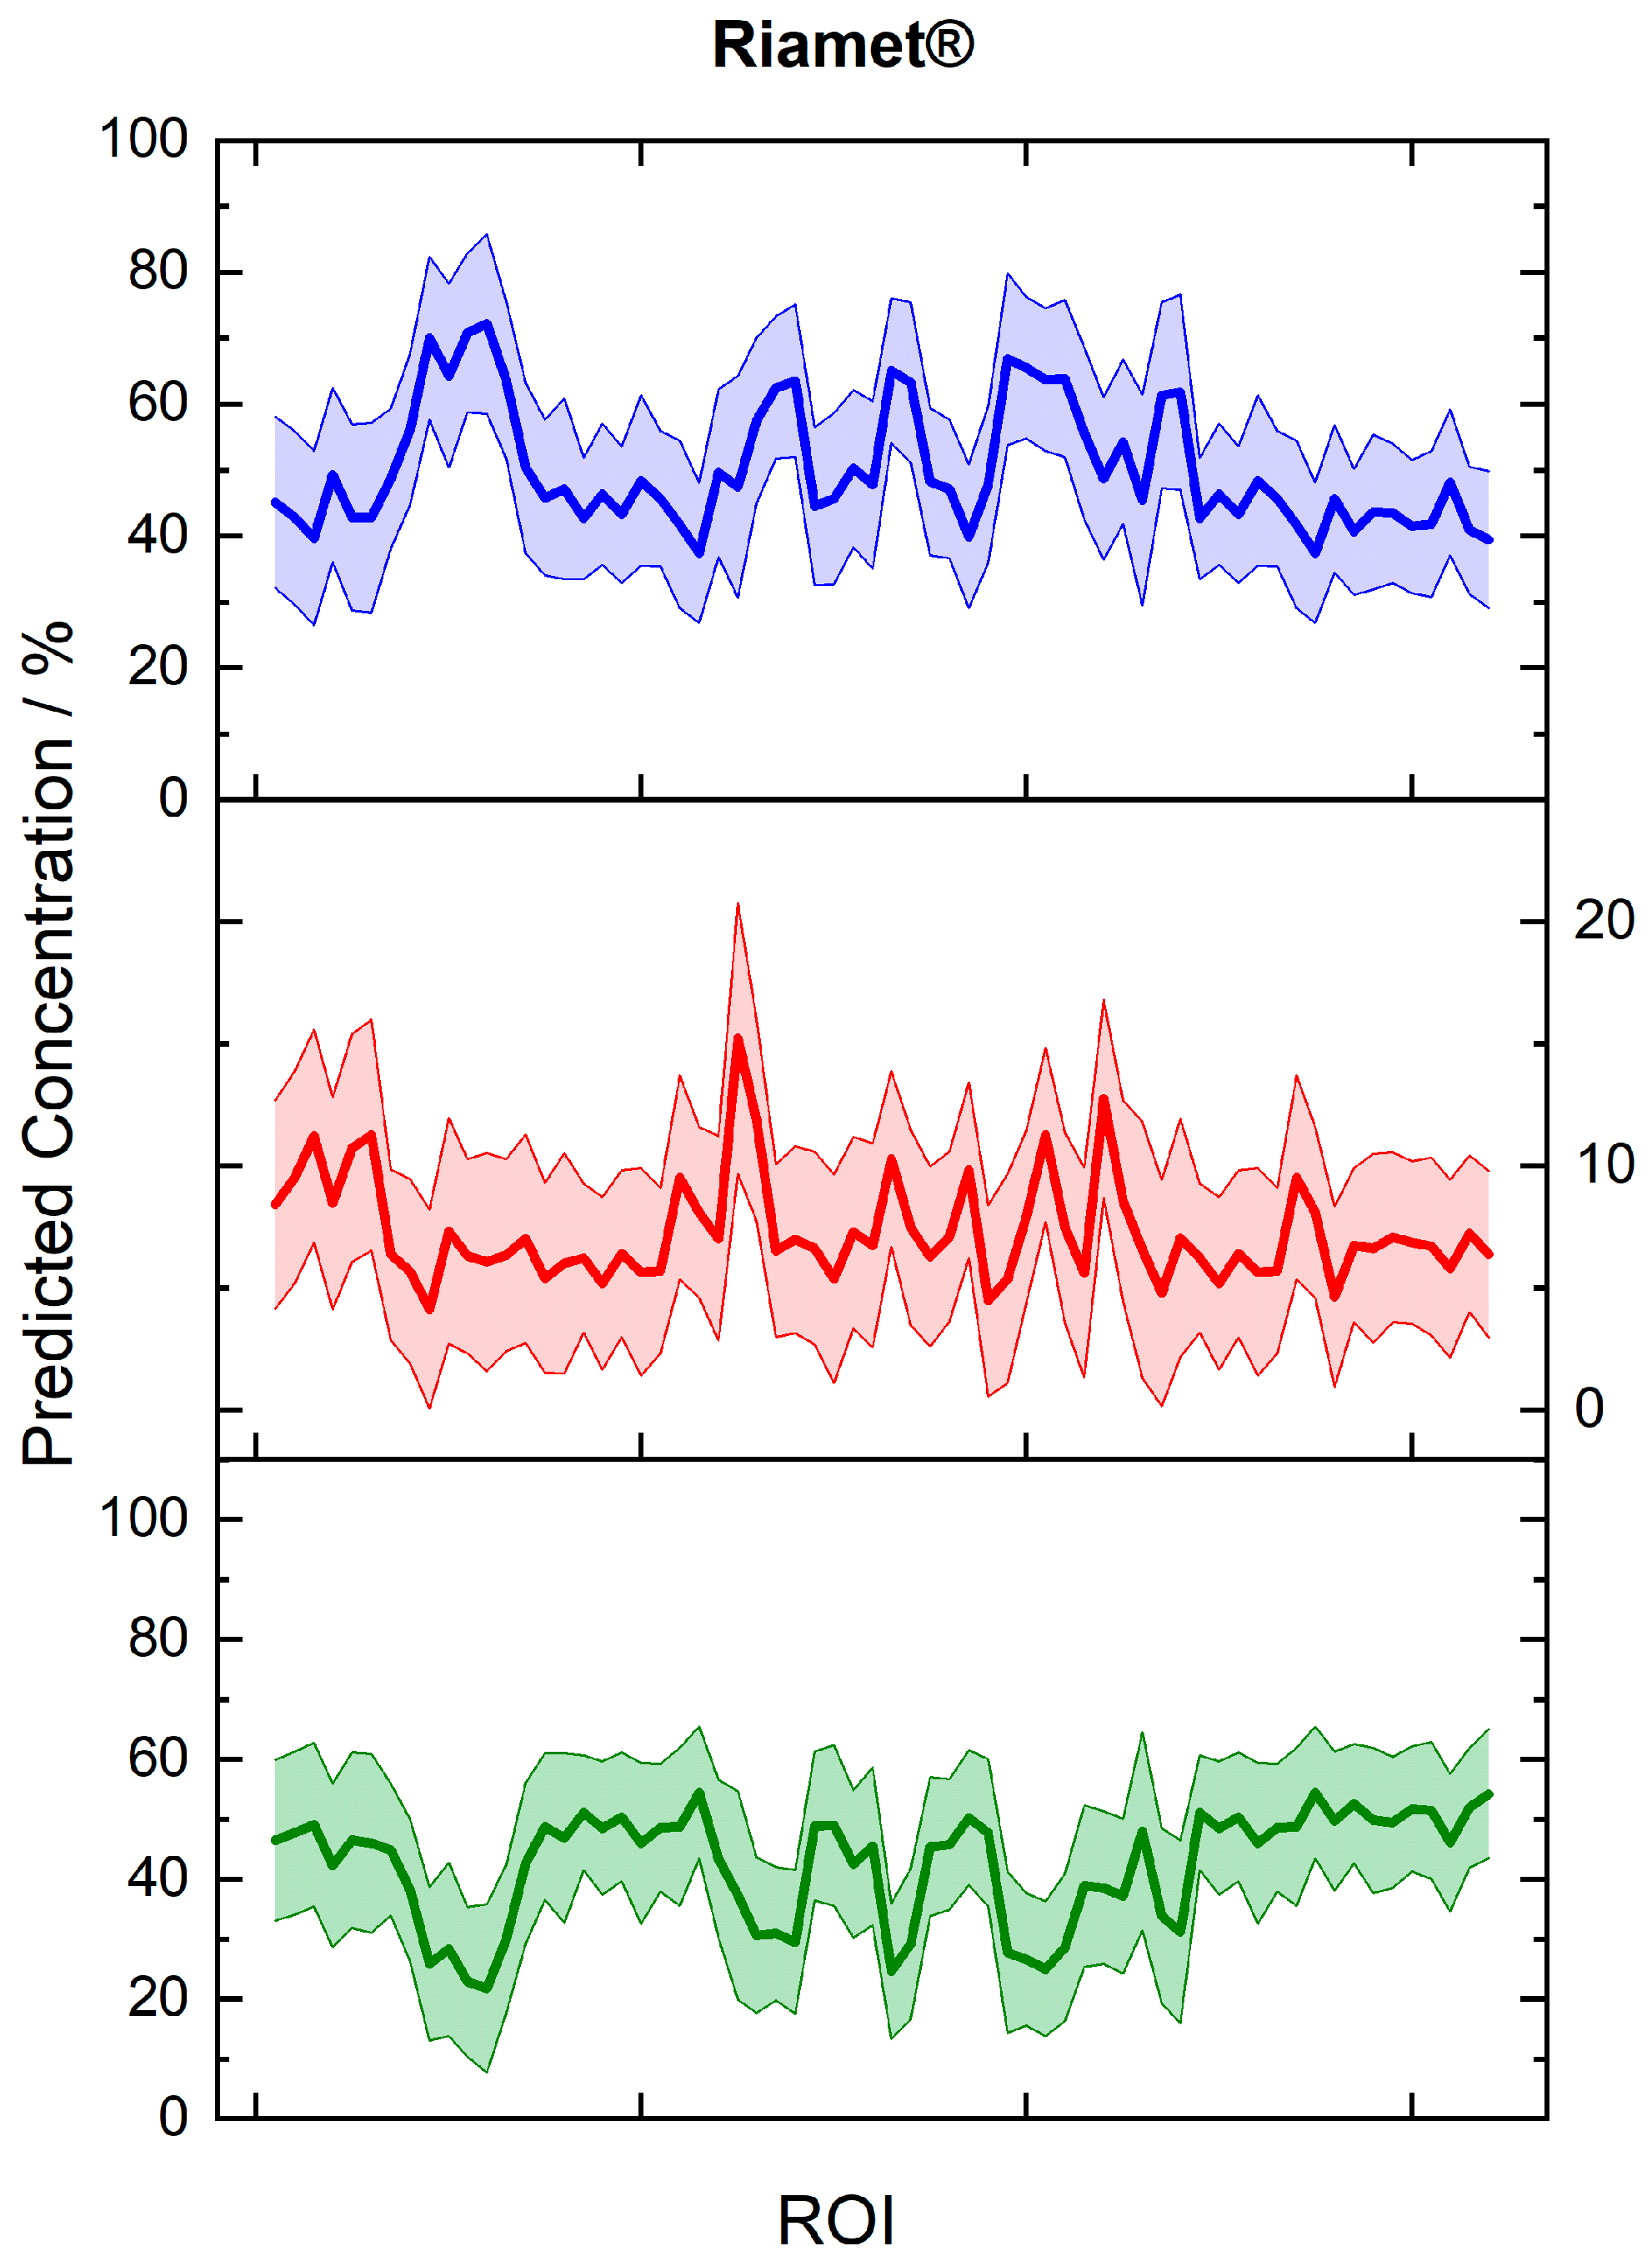
| Riamet® | 50.0 | 44.1 | 14.6 | 8.3 | 5.6 | 4.7 |
© 2019 by the authors. Licensee MDPI, Basel, Switzerland. This article is an open access article distributed under the terms and conditions of the Creative Commons Attribution (CC BY) license (http://creativecommons.org/licenses/by/4.0/).
Share and Cite
Frosch, T.; Wyrwich, E.; Yan, D.; Domes, C.; Domes, R.; Popp, J.; Frosch, T. Counterfeit and Substandard Test of the Antimalarial Tablet Riamet® by Means of Raman Hyperspectral Multicomponent Analysis. Molecules 2019, 24, 3229. https://doi.org/10.3390/molecules24183229
Frosch T, Wyrwich E, Yan D, Domes C, Domes R, Popp J, Frosch T. Counterfeit and Substandard Test of the Antimalarial Tablet Riamet® by Means of Raman Hyperspectral Multicomponent Analysis. Molecules. 2019; 24(18):3229. https://doi.org/10.3390/molecules24183229
Chicago/Turabian StyleFrosch, Timea, Elisabeth Wyrwich, Di Yan, Christian Domes, Robert Domes, Juergen Popp, and Torsten Frosch. 2019. "Counterfeit and Substandard Test of the Antimalarial Tablet Riamet® by Means of Raman Hyperspectral Multicomponent Analysis" Molecules 24, no. 18: 3229. https://doi.org/10.3390/molecules24183229
APA StyleFrosch, T., Wyrwich, E., Yan, D., Domes, C., Domes, R., Popp, J., & Frosch, T. (2019). Counterfeit and Substandard Test of the Antimalarial Tablet Riamet® by Means of Raman Hyperspectral Multicomponent Analysis. Molecules, 24(18), 3229. https://doi.org/10.3390/molecules24183229