
A Method of Calculating the Kamlet–Abboud–Taft Solvatochromic Parameters Using COSMO-RS


Abstract
1. Introduction
2. Results and Discussion
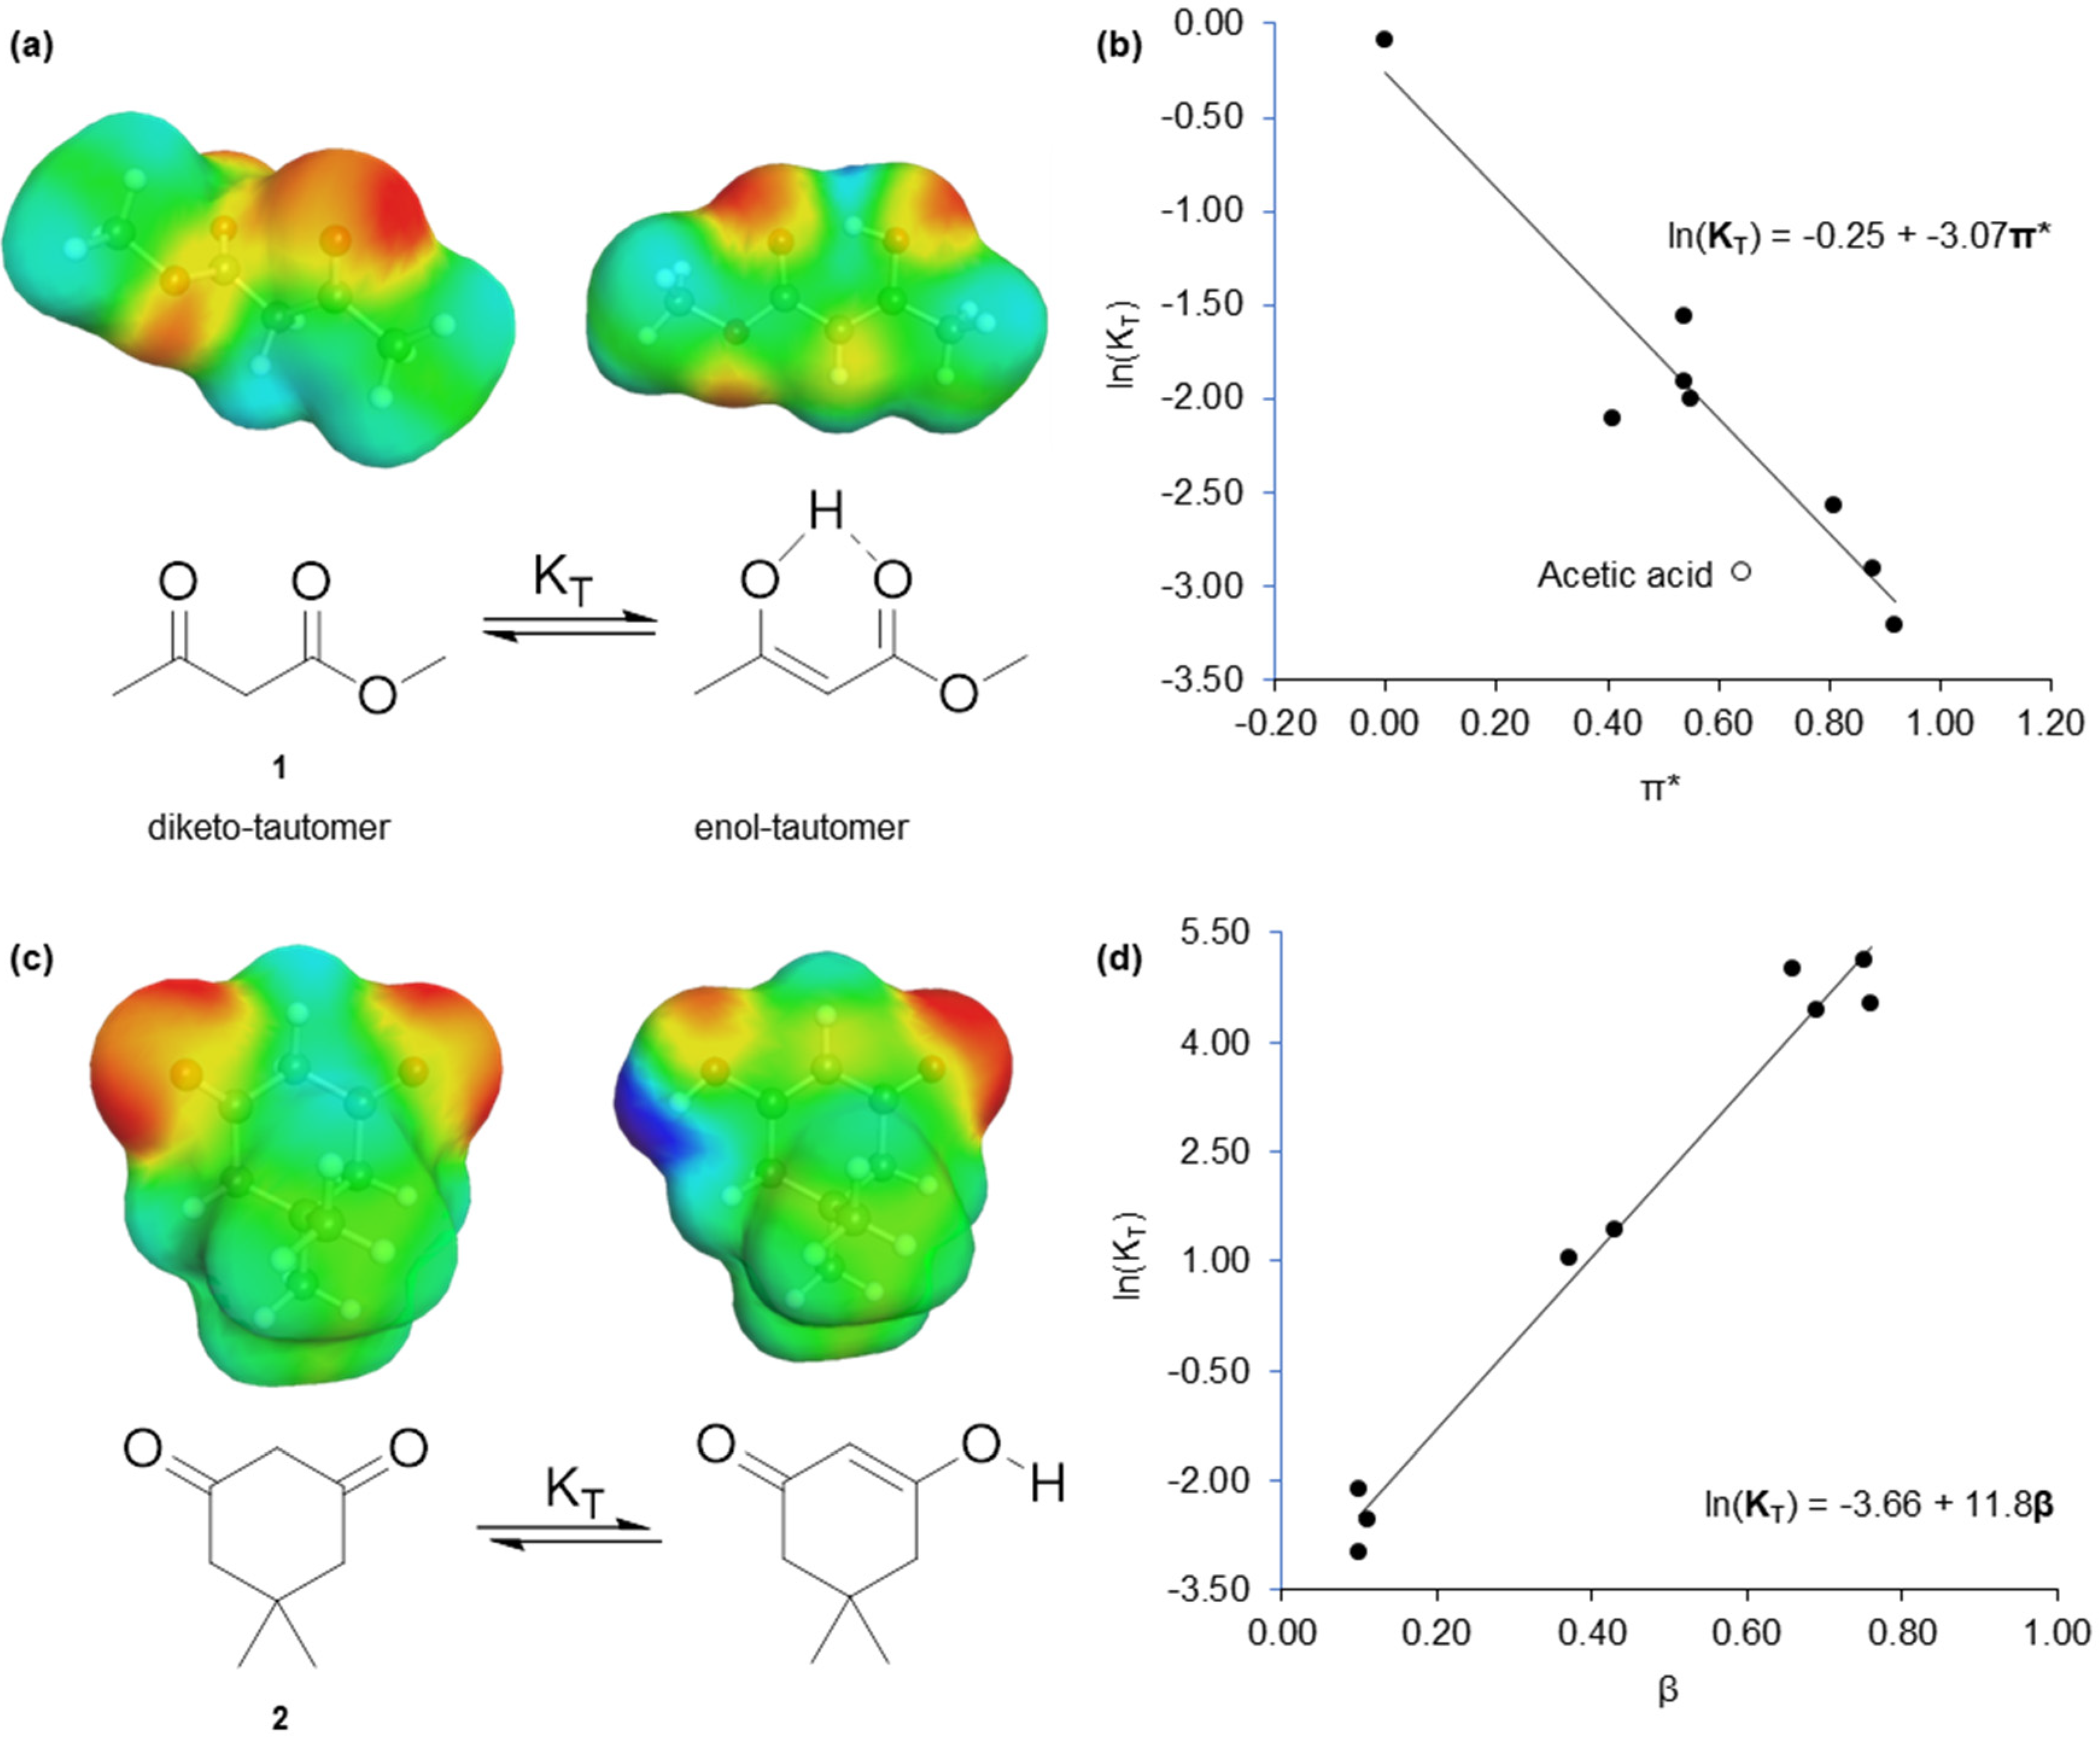
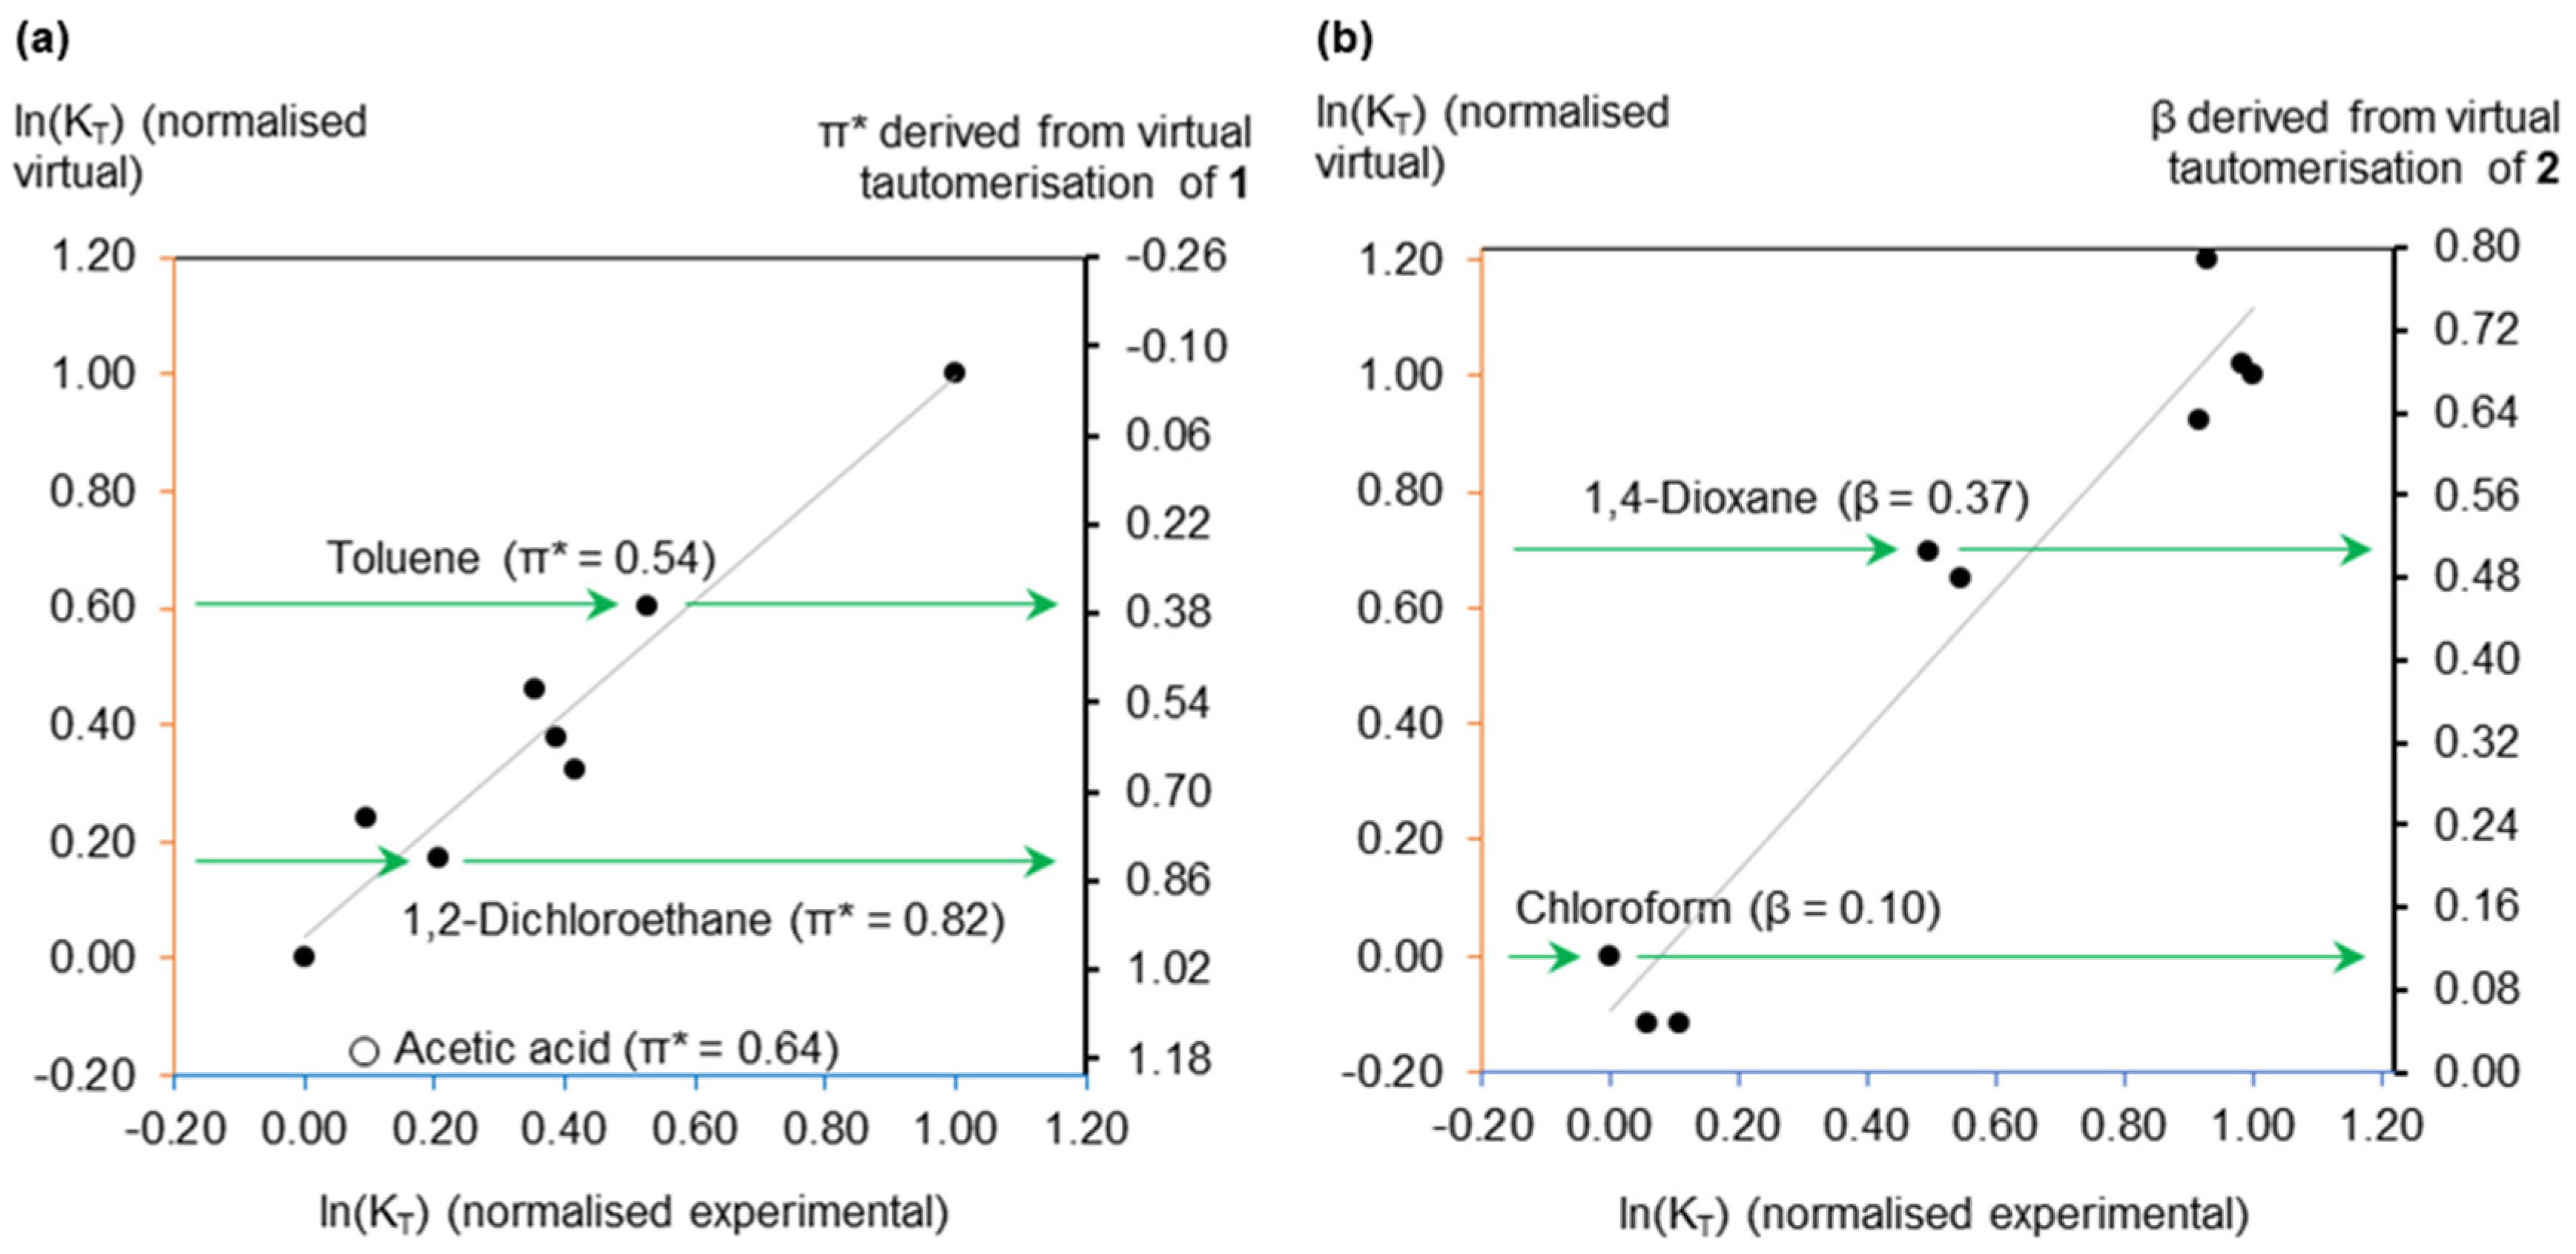
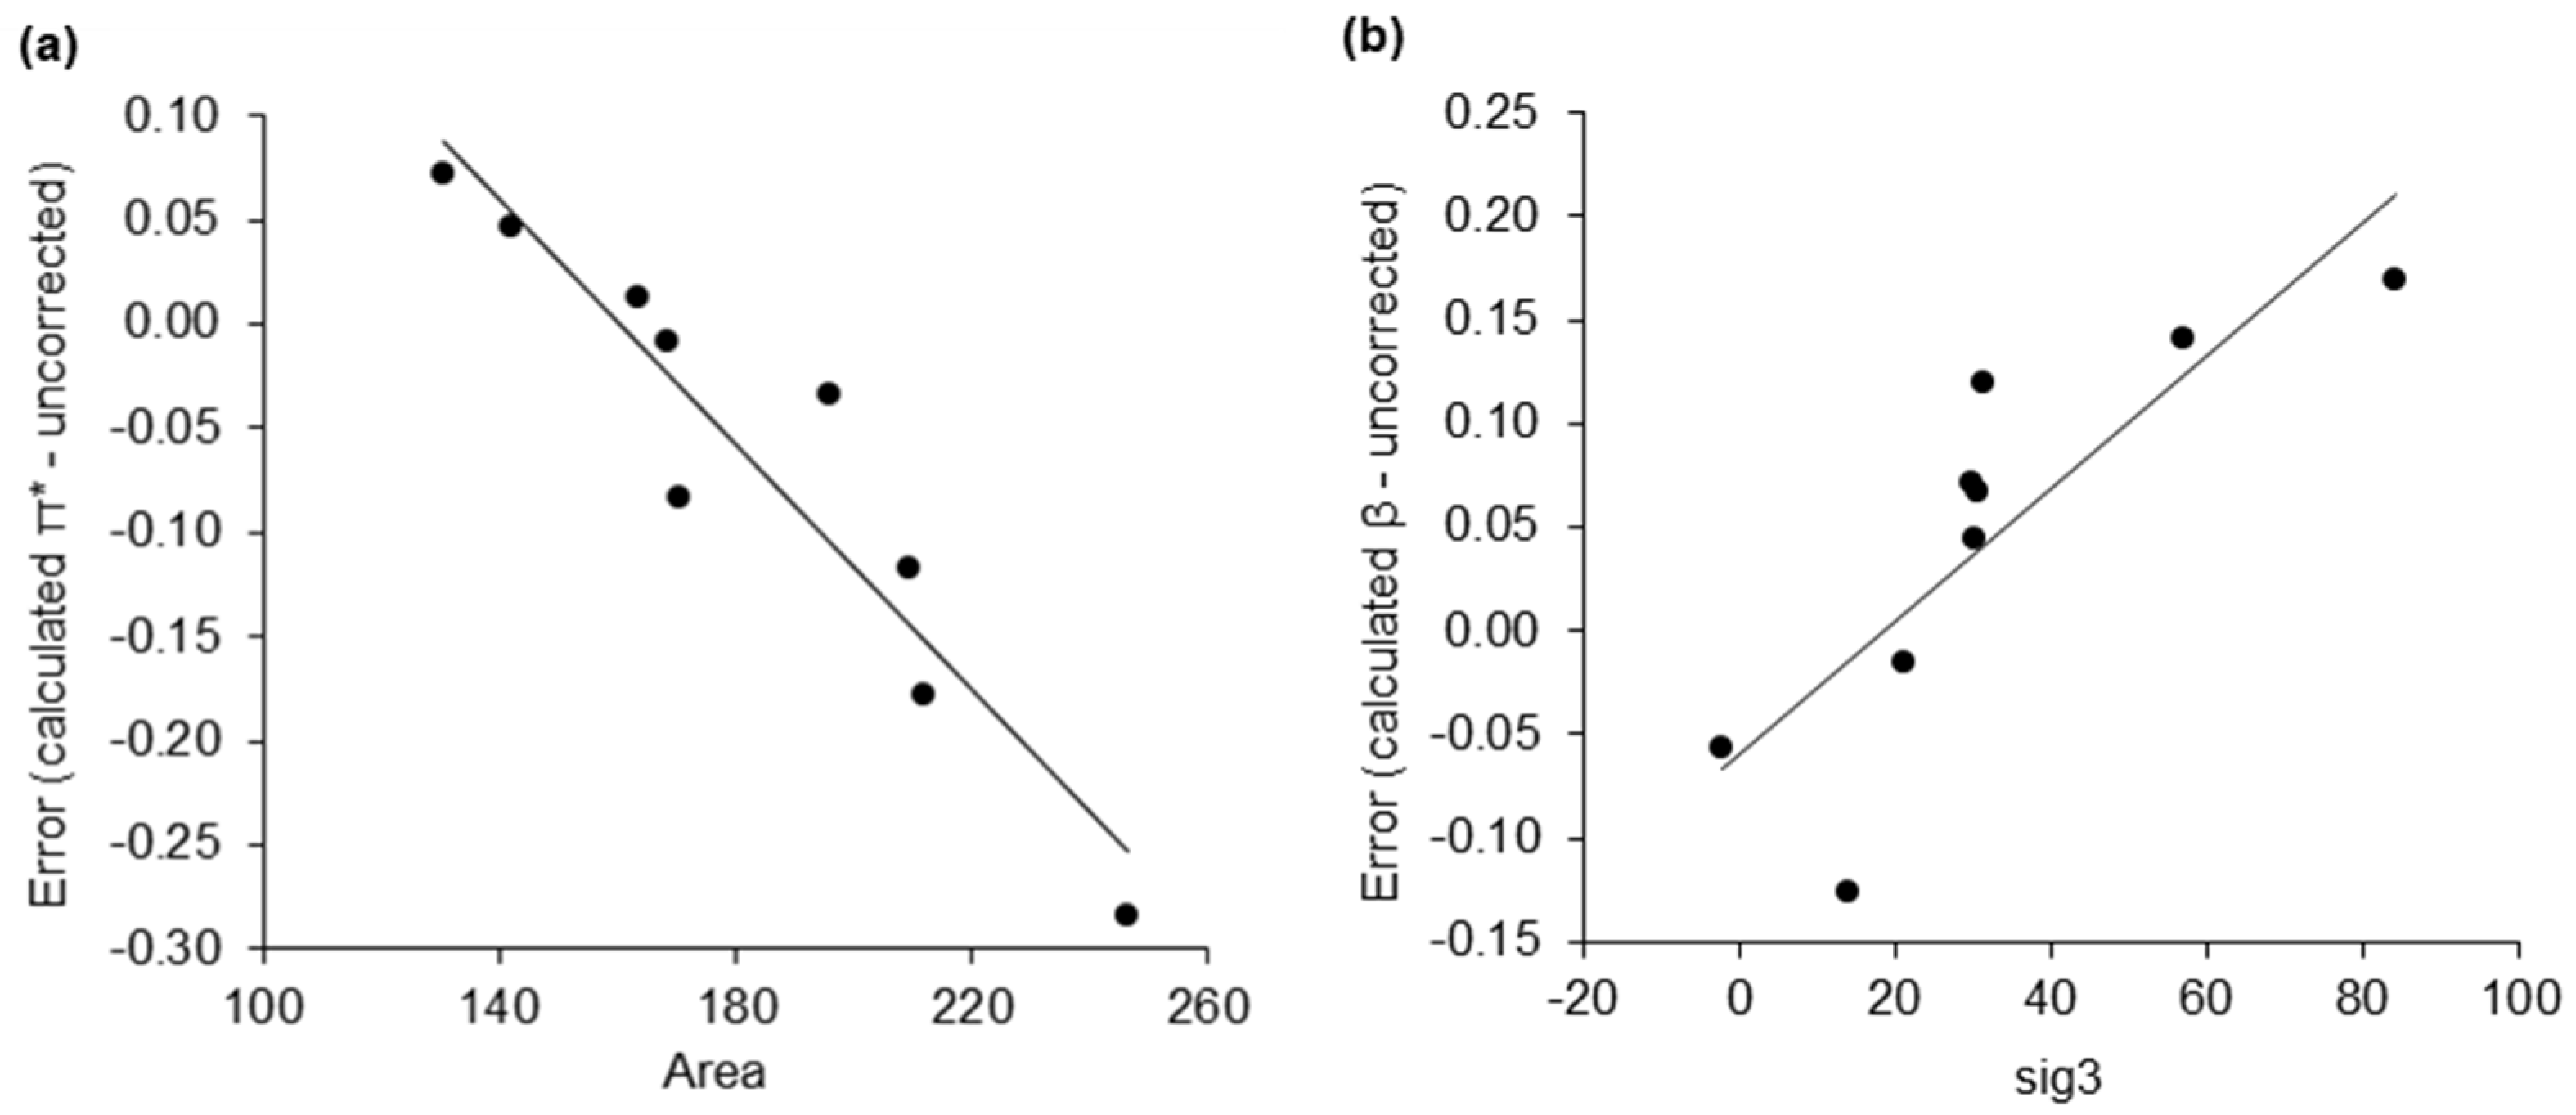
2.1. Virtual Isomerisation Experiments
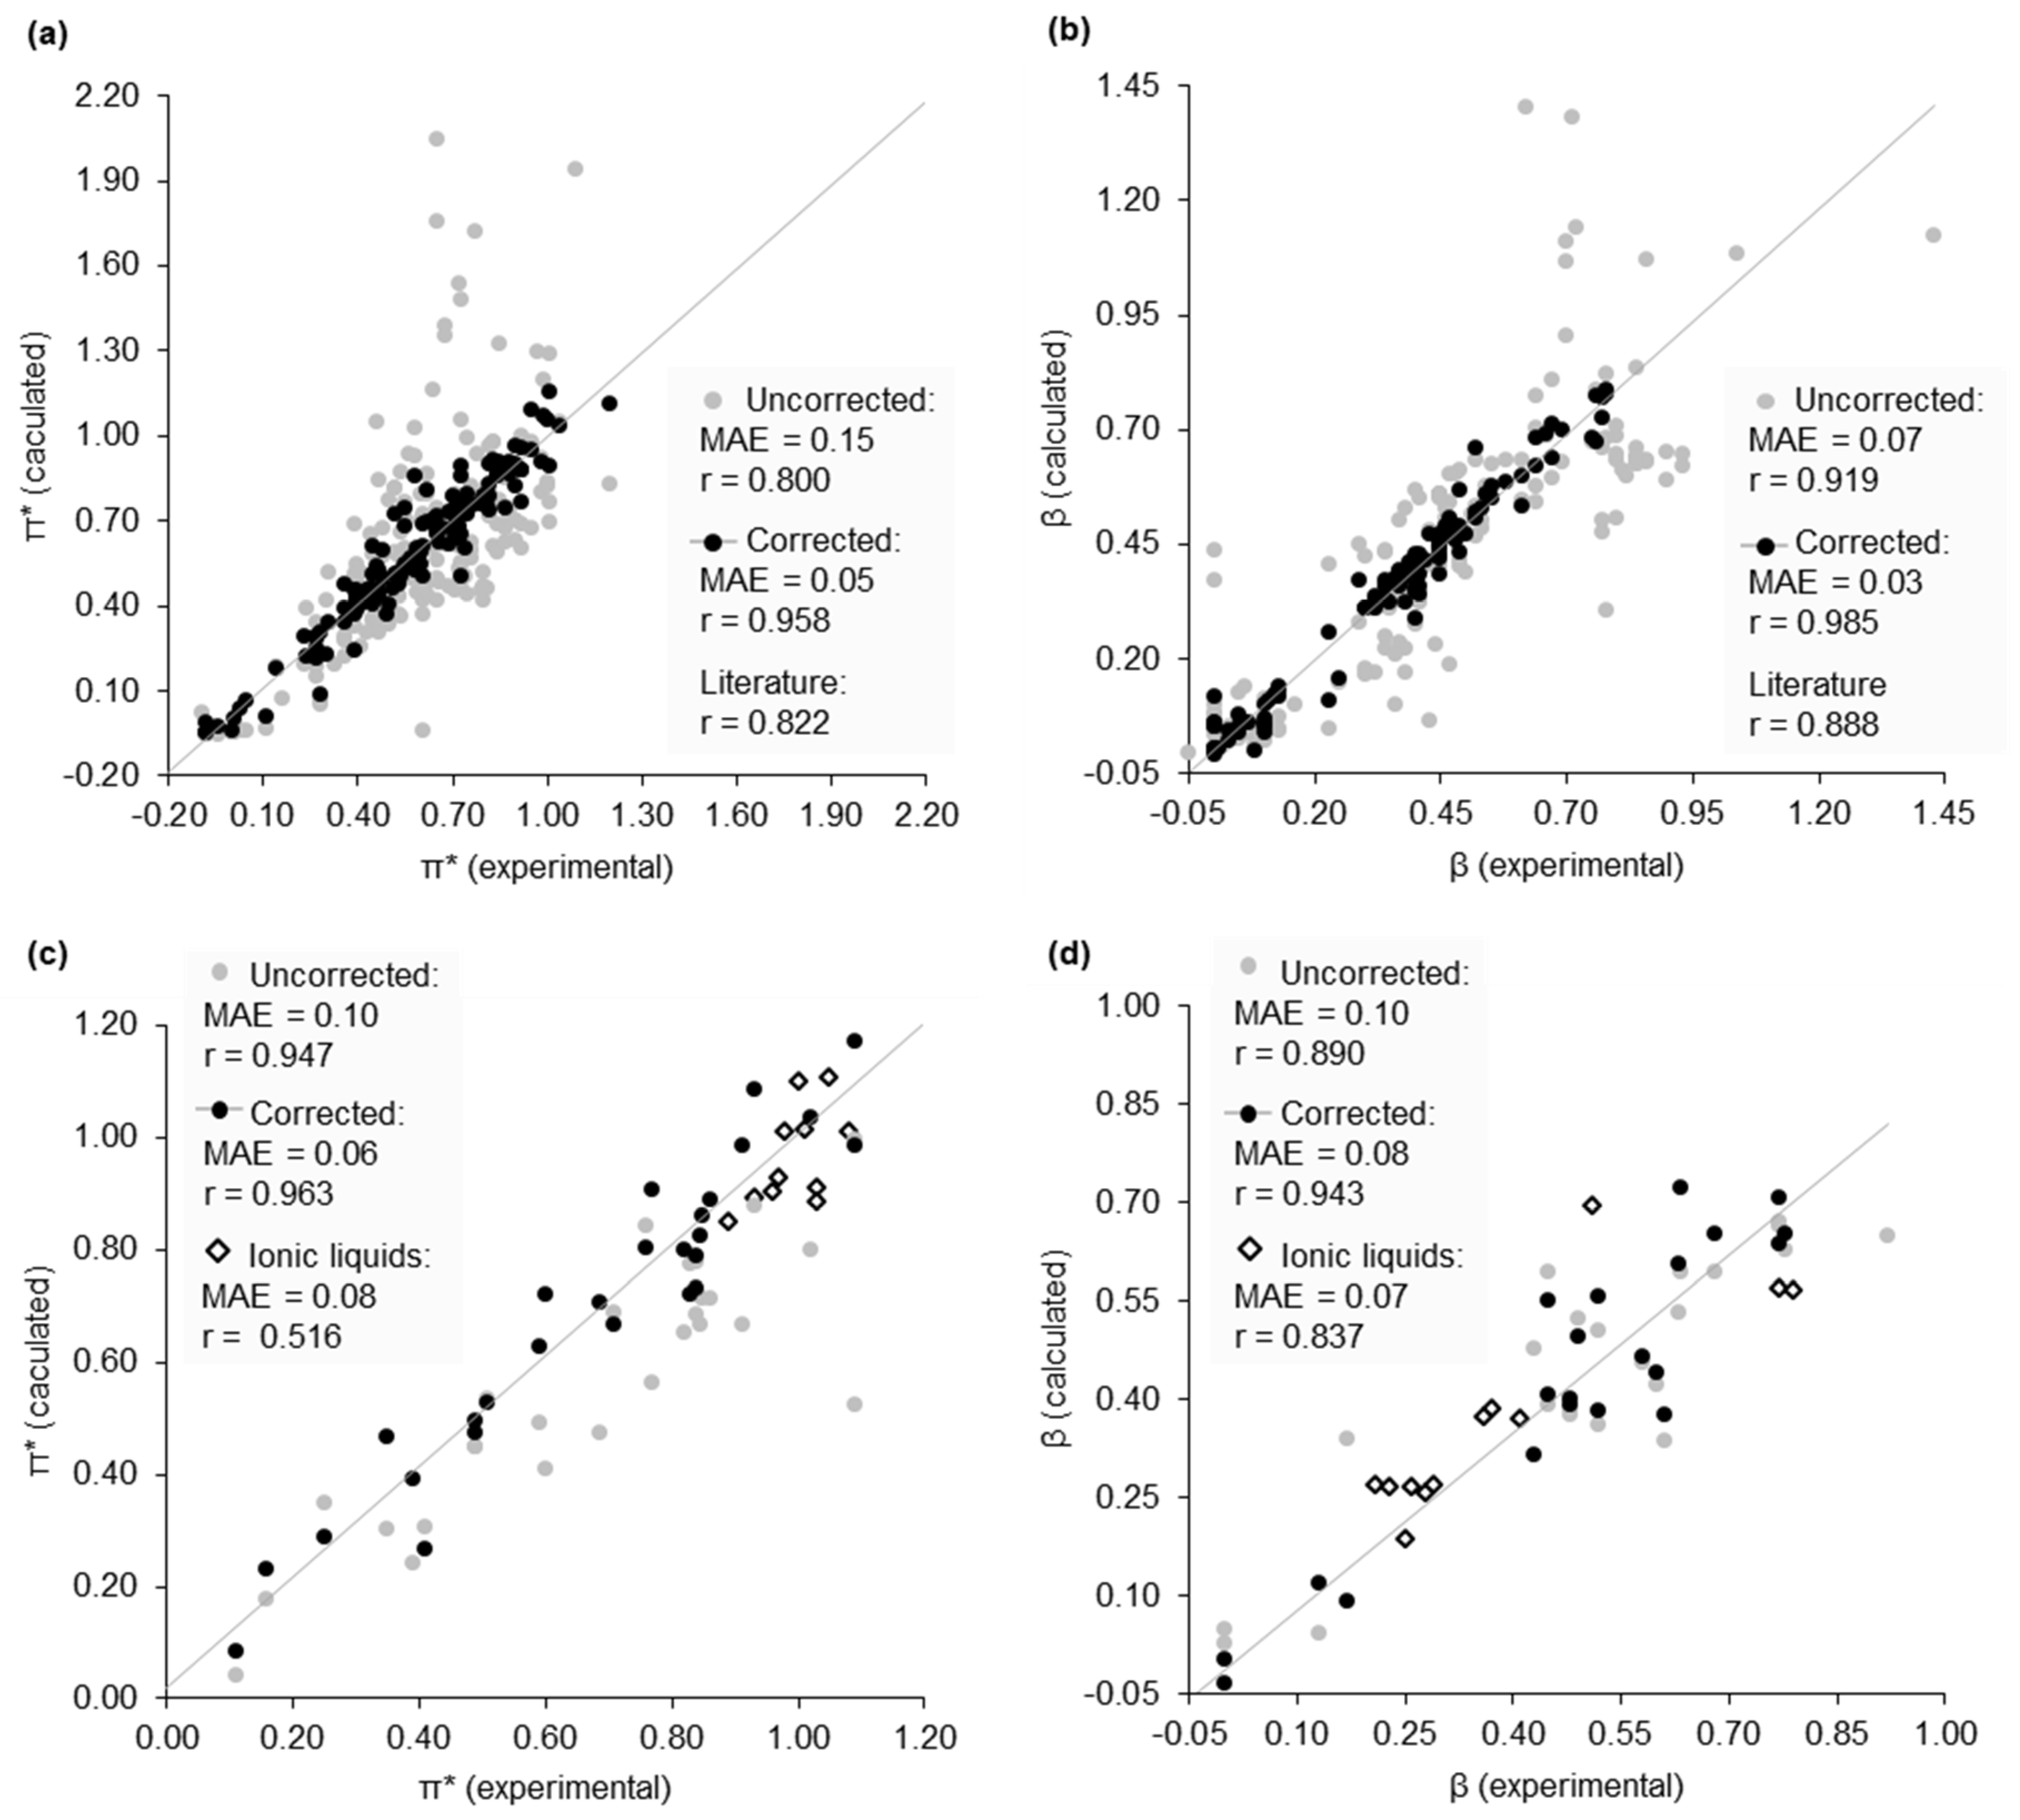
2.2. Dataset of Calculated Kamlet–Abboud–Taft Solvatochromic Parameters
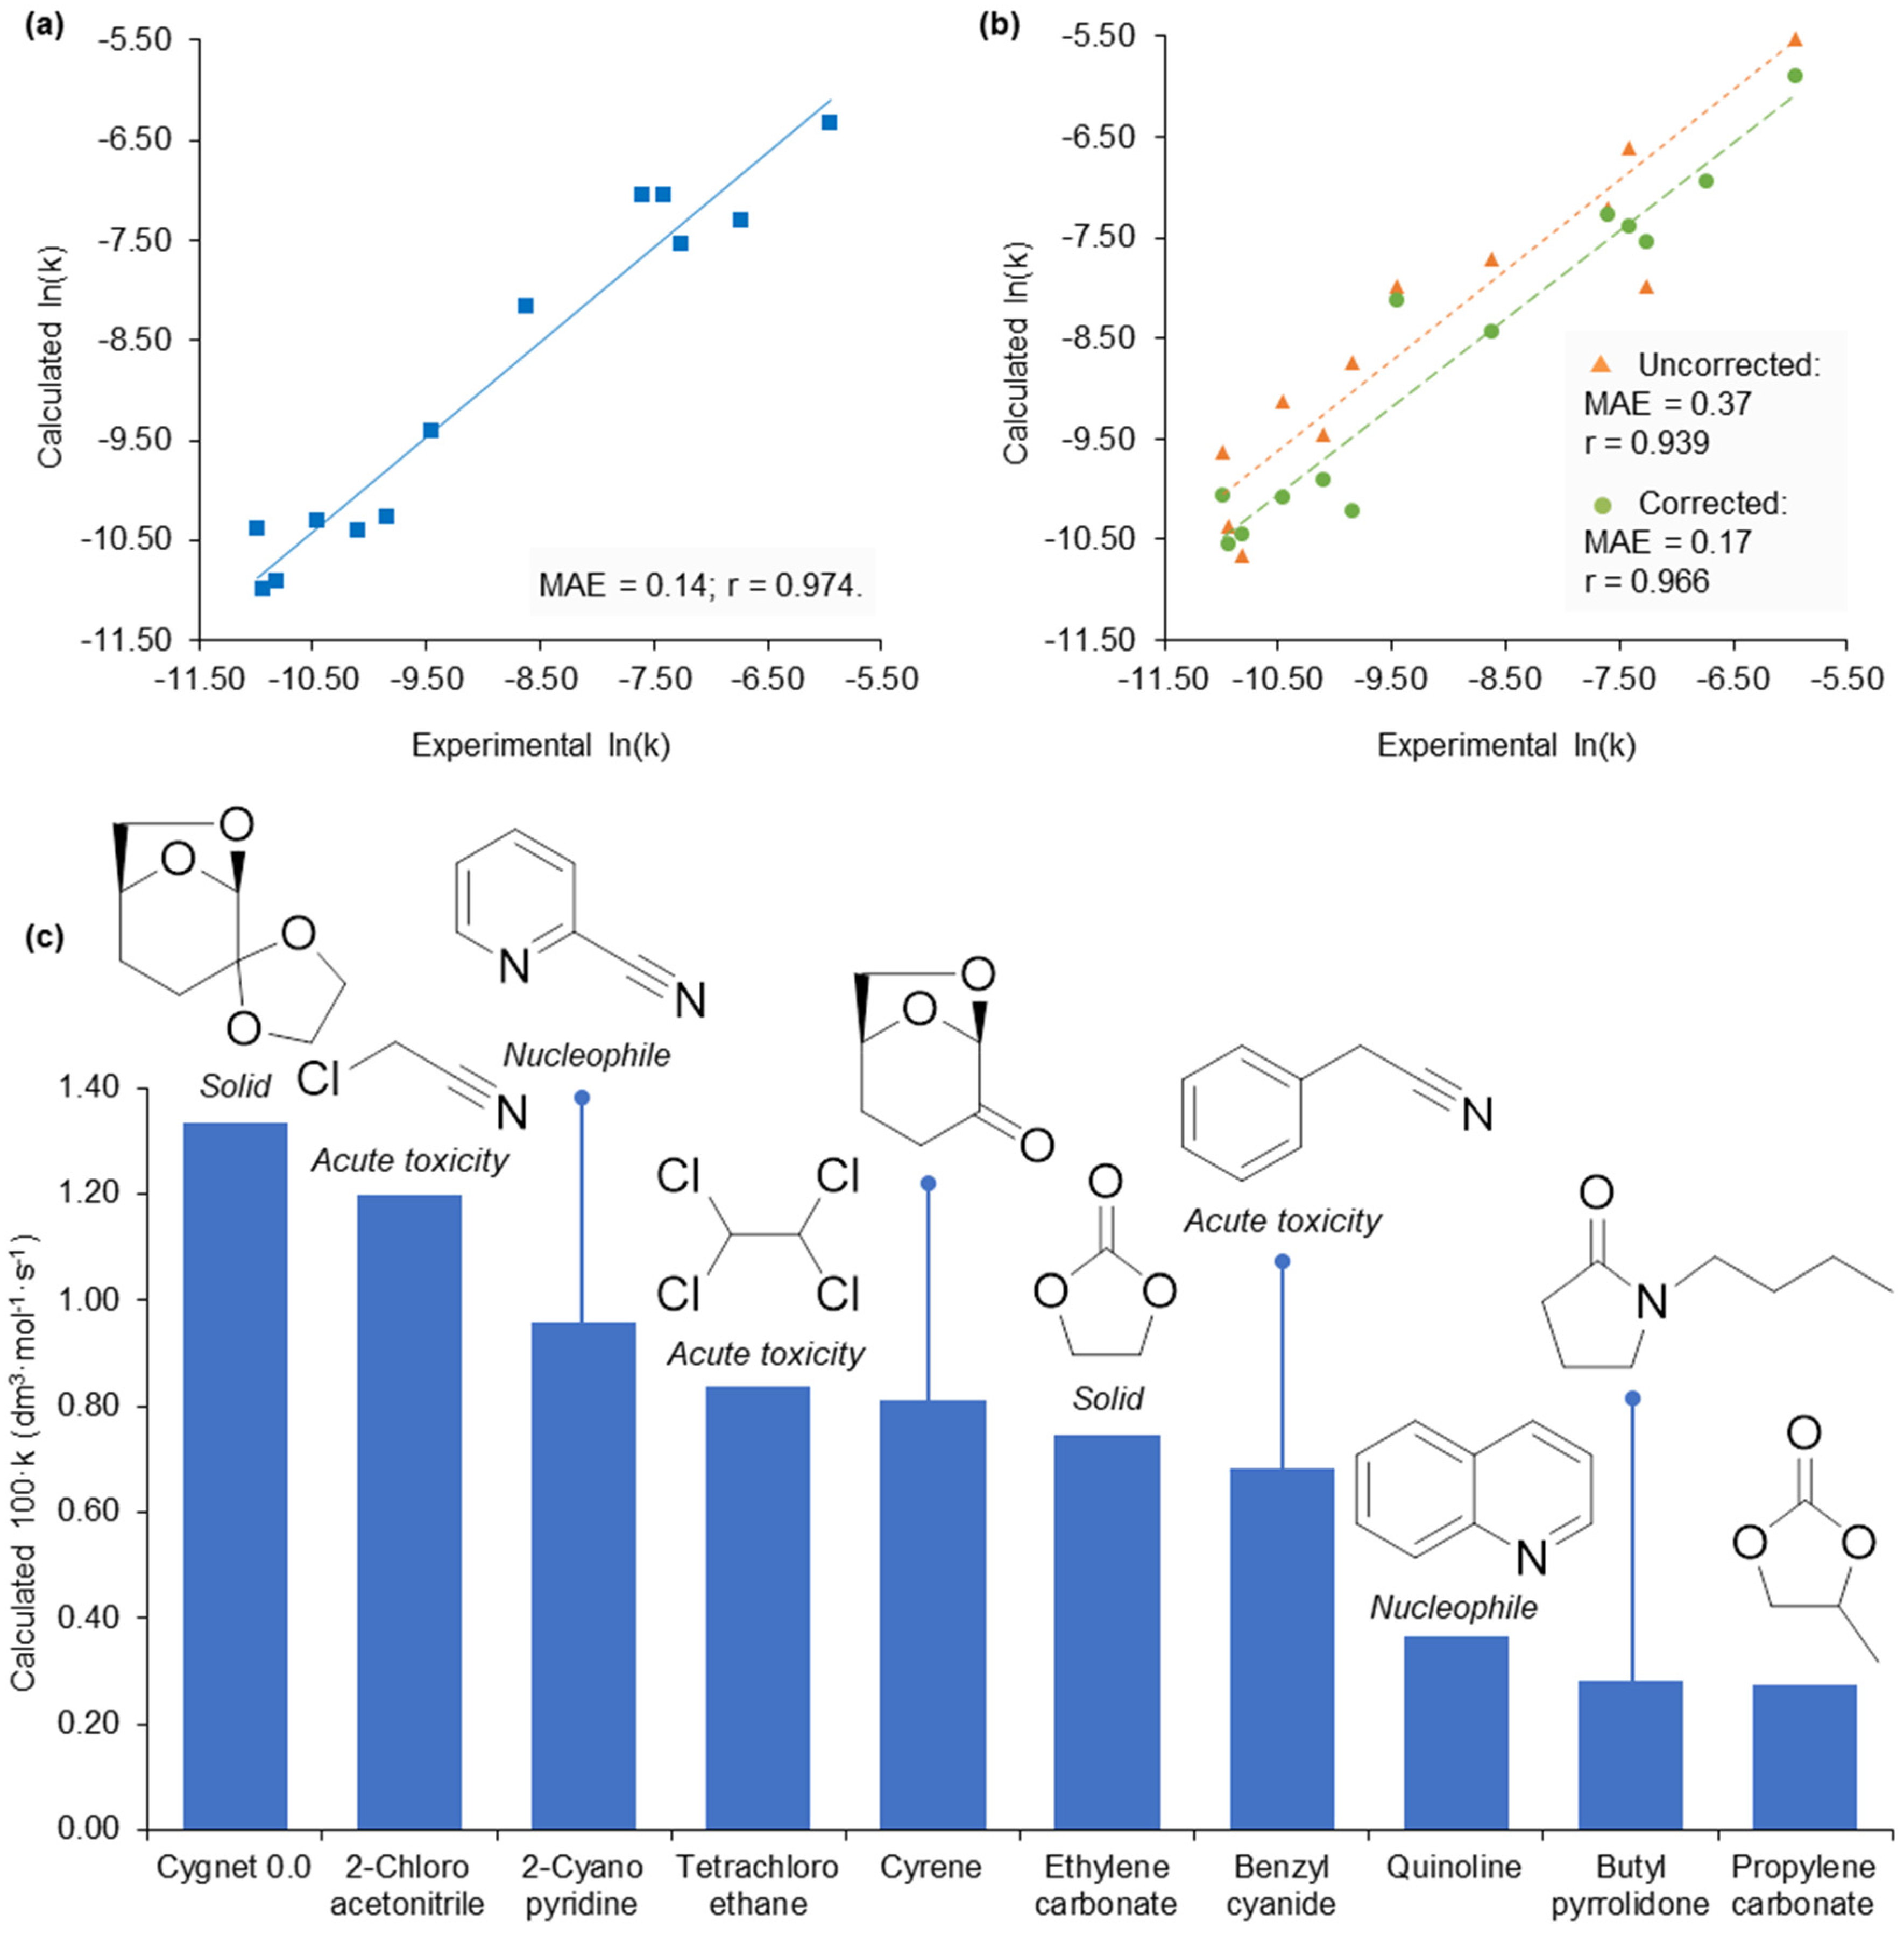
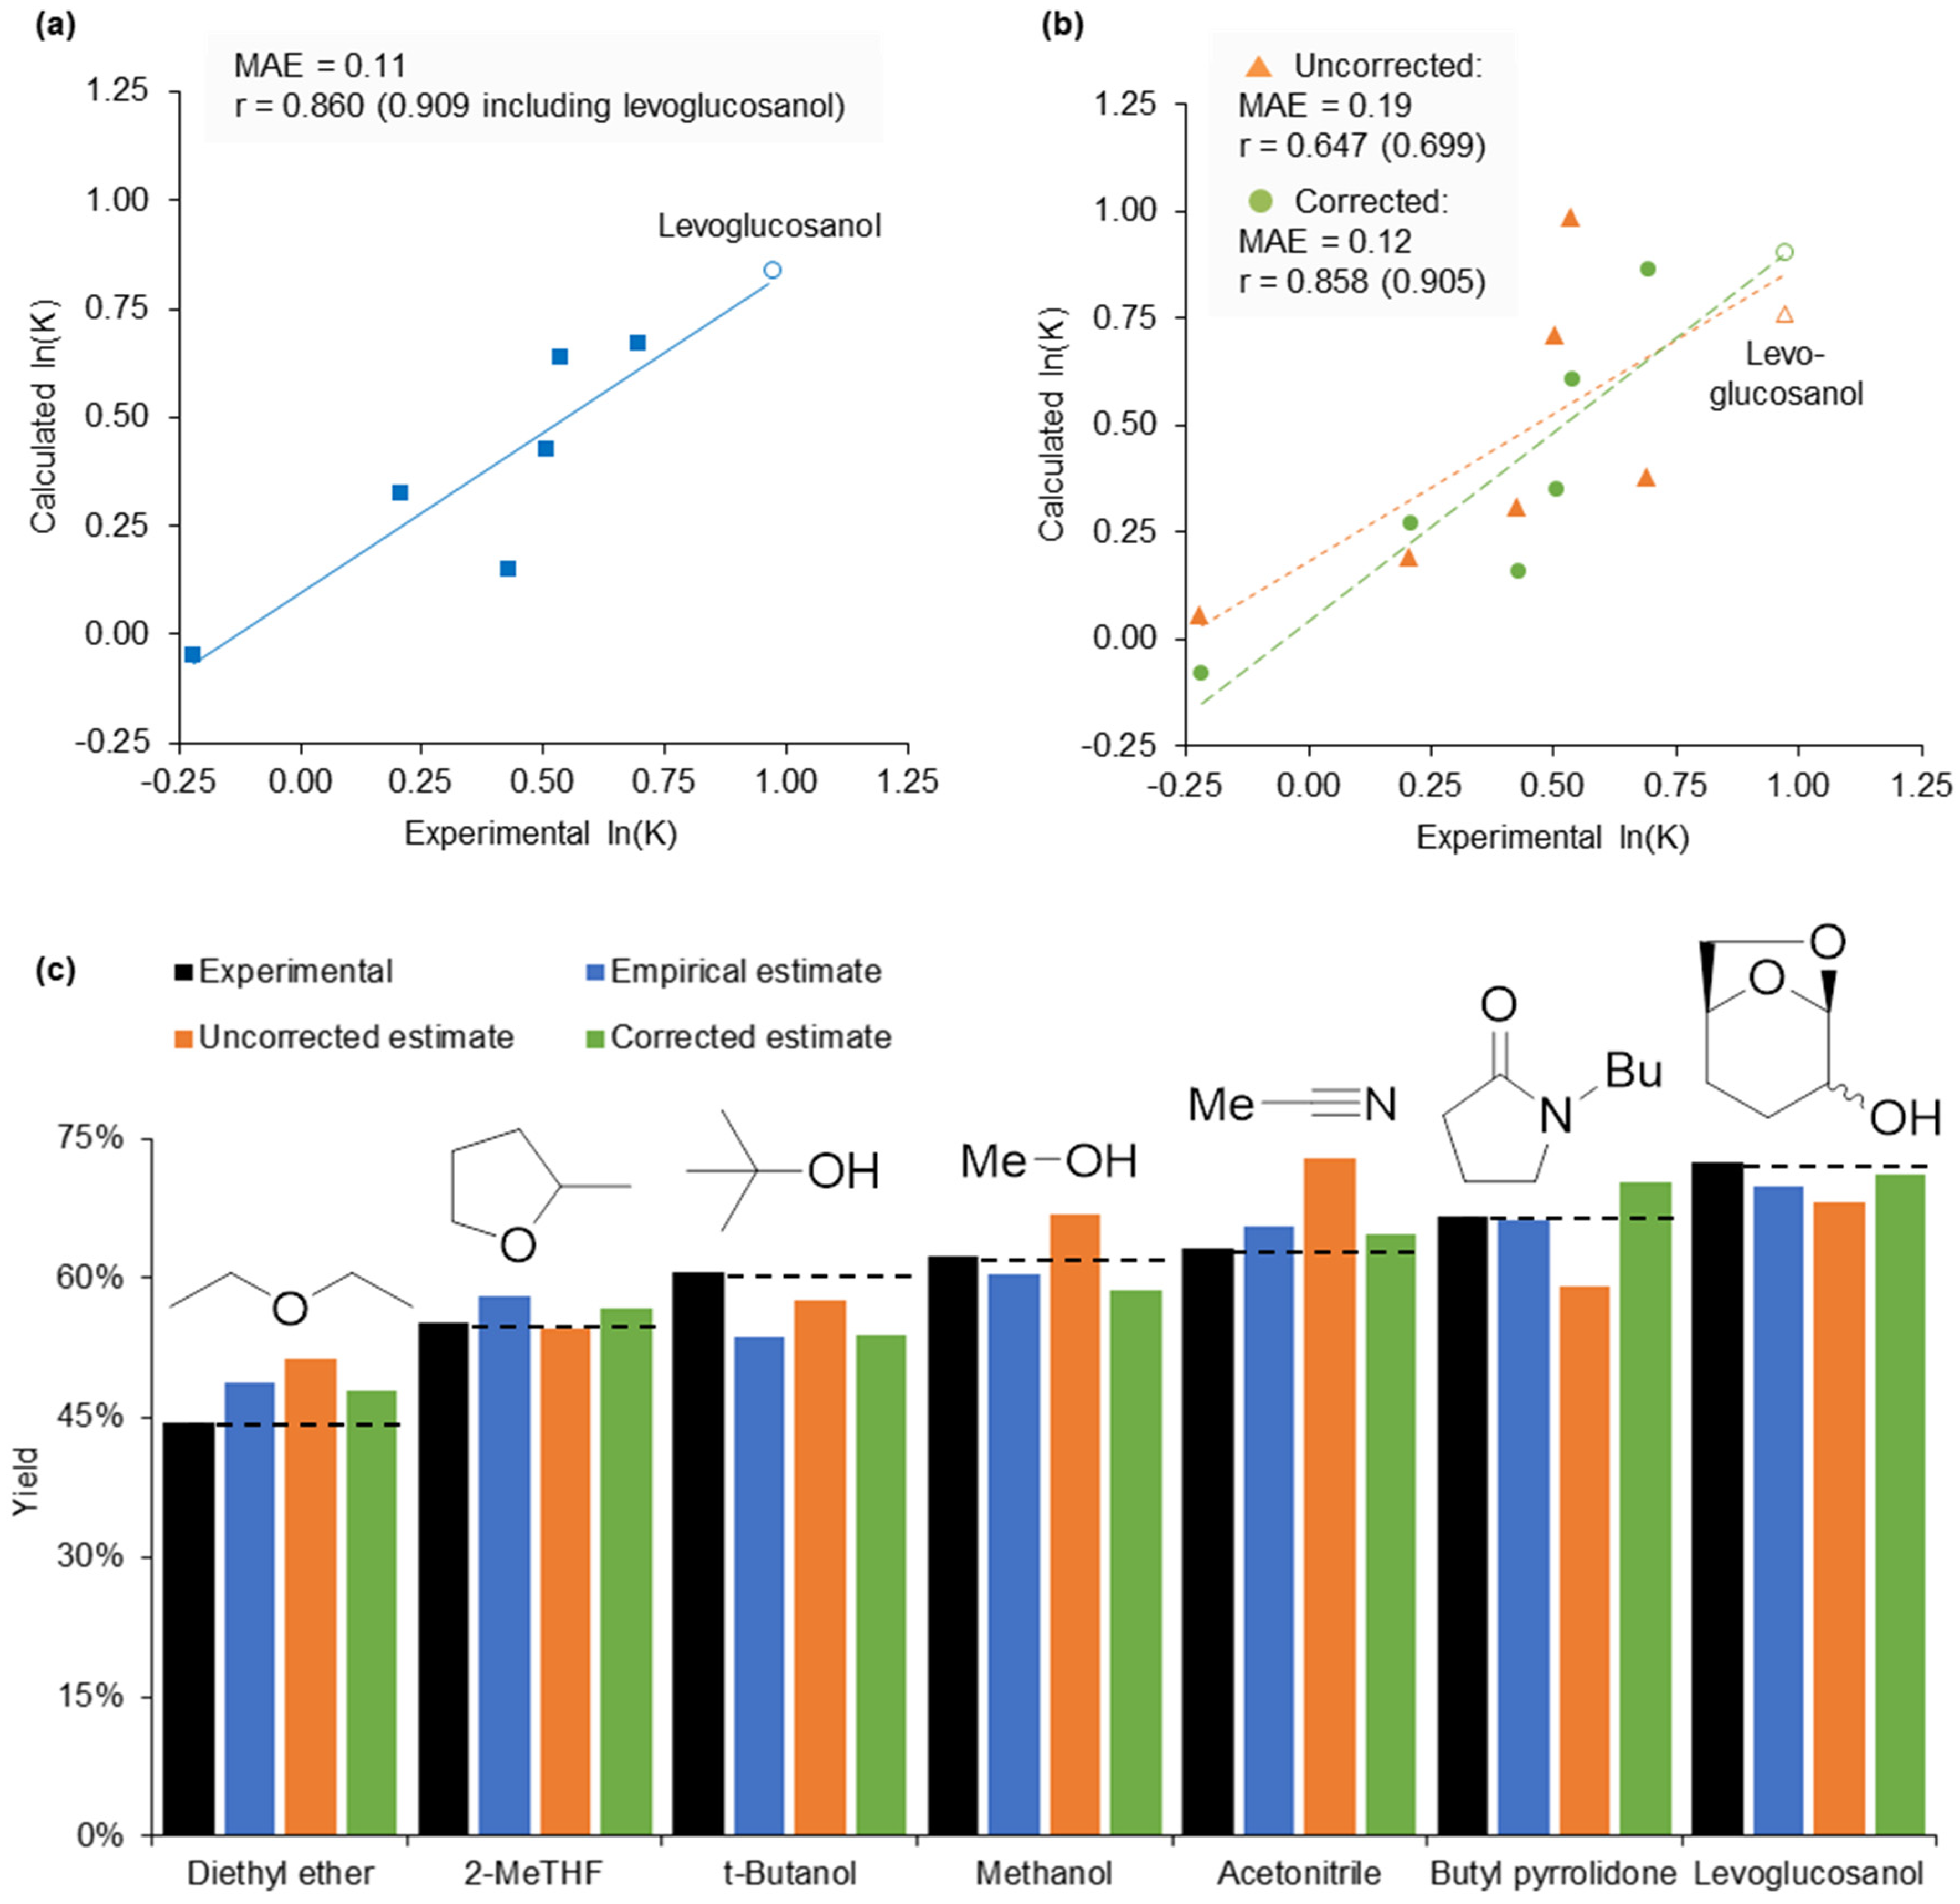
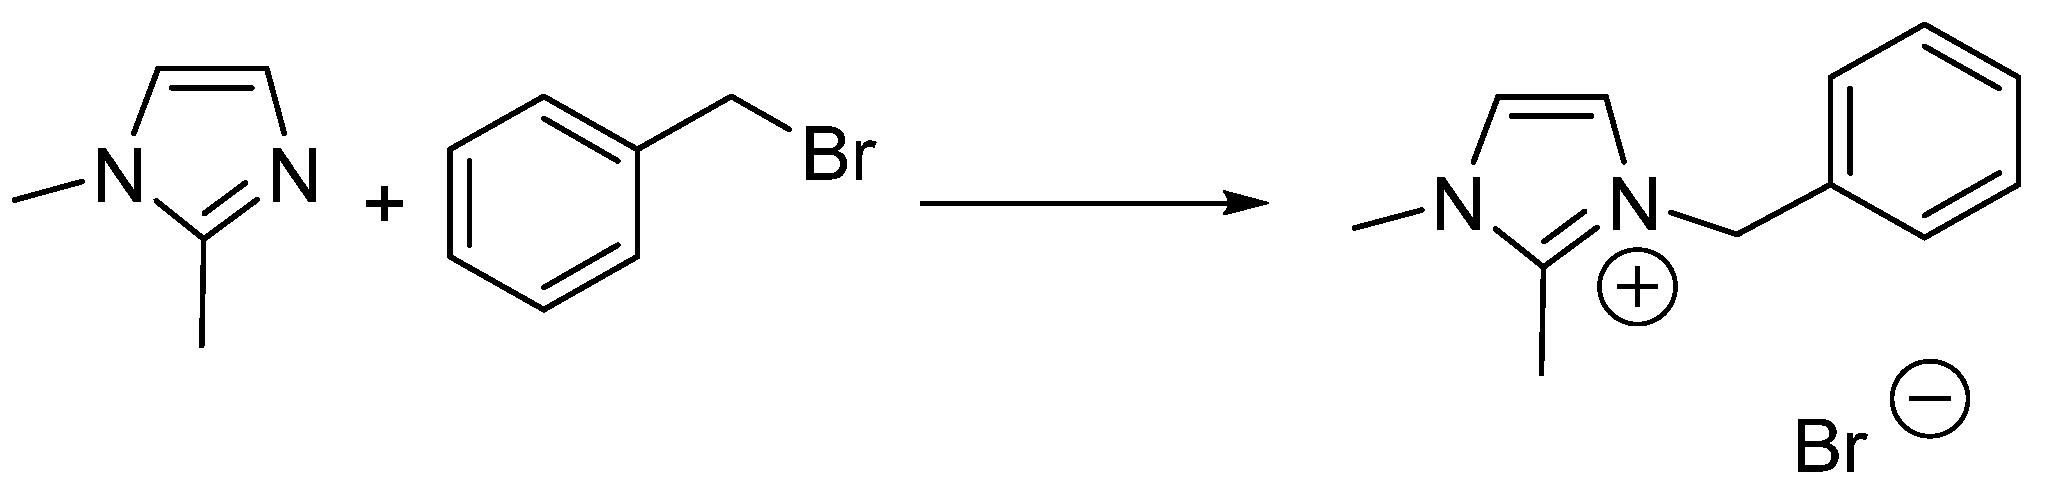
2.3. Application of Calculated KAT Parameters to Free Energy Relationships
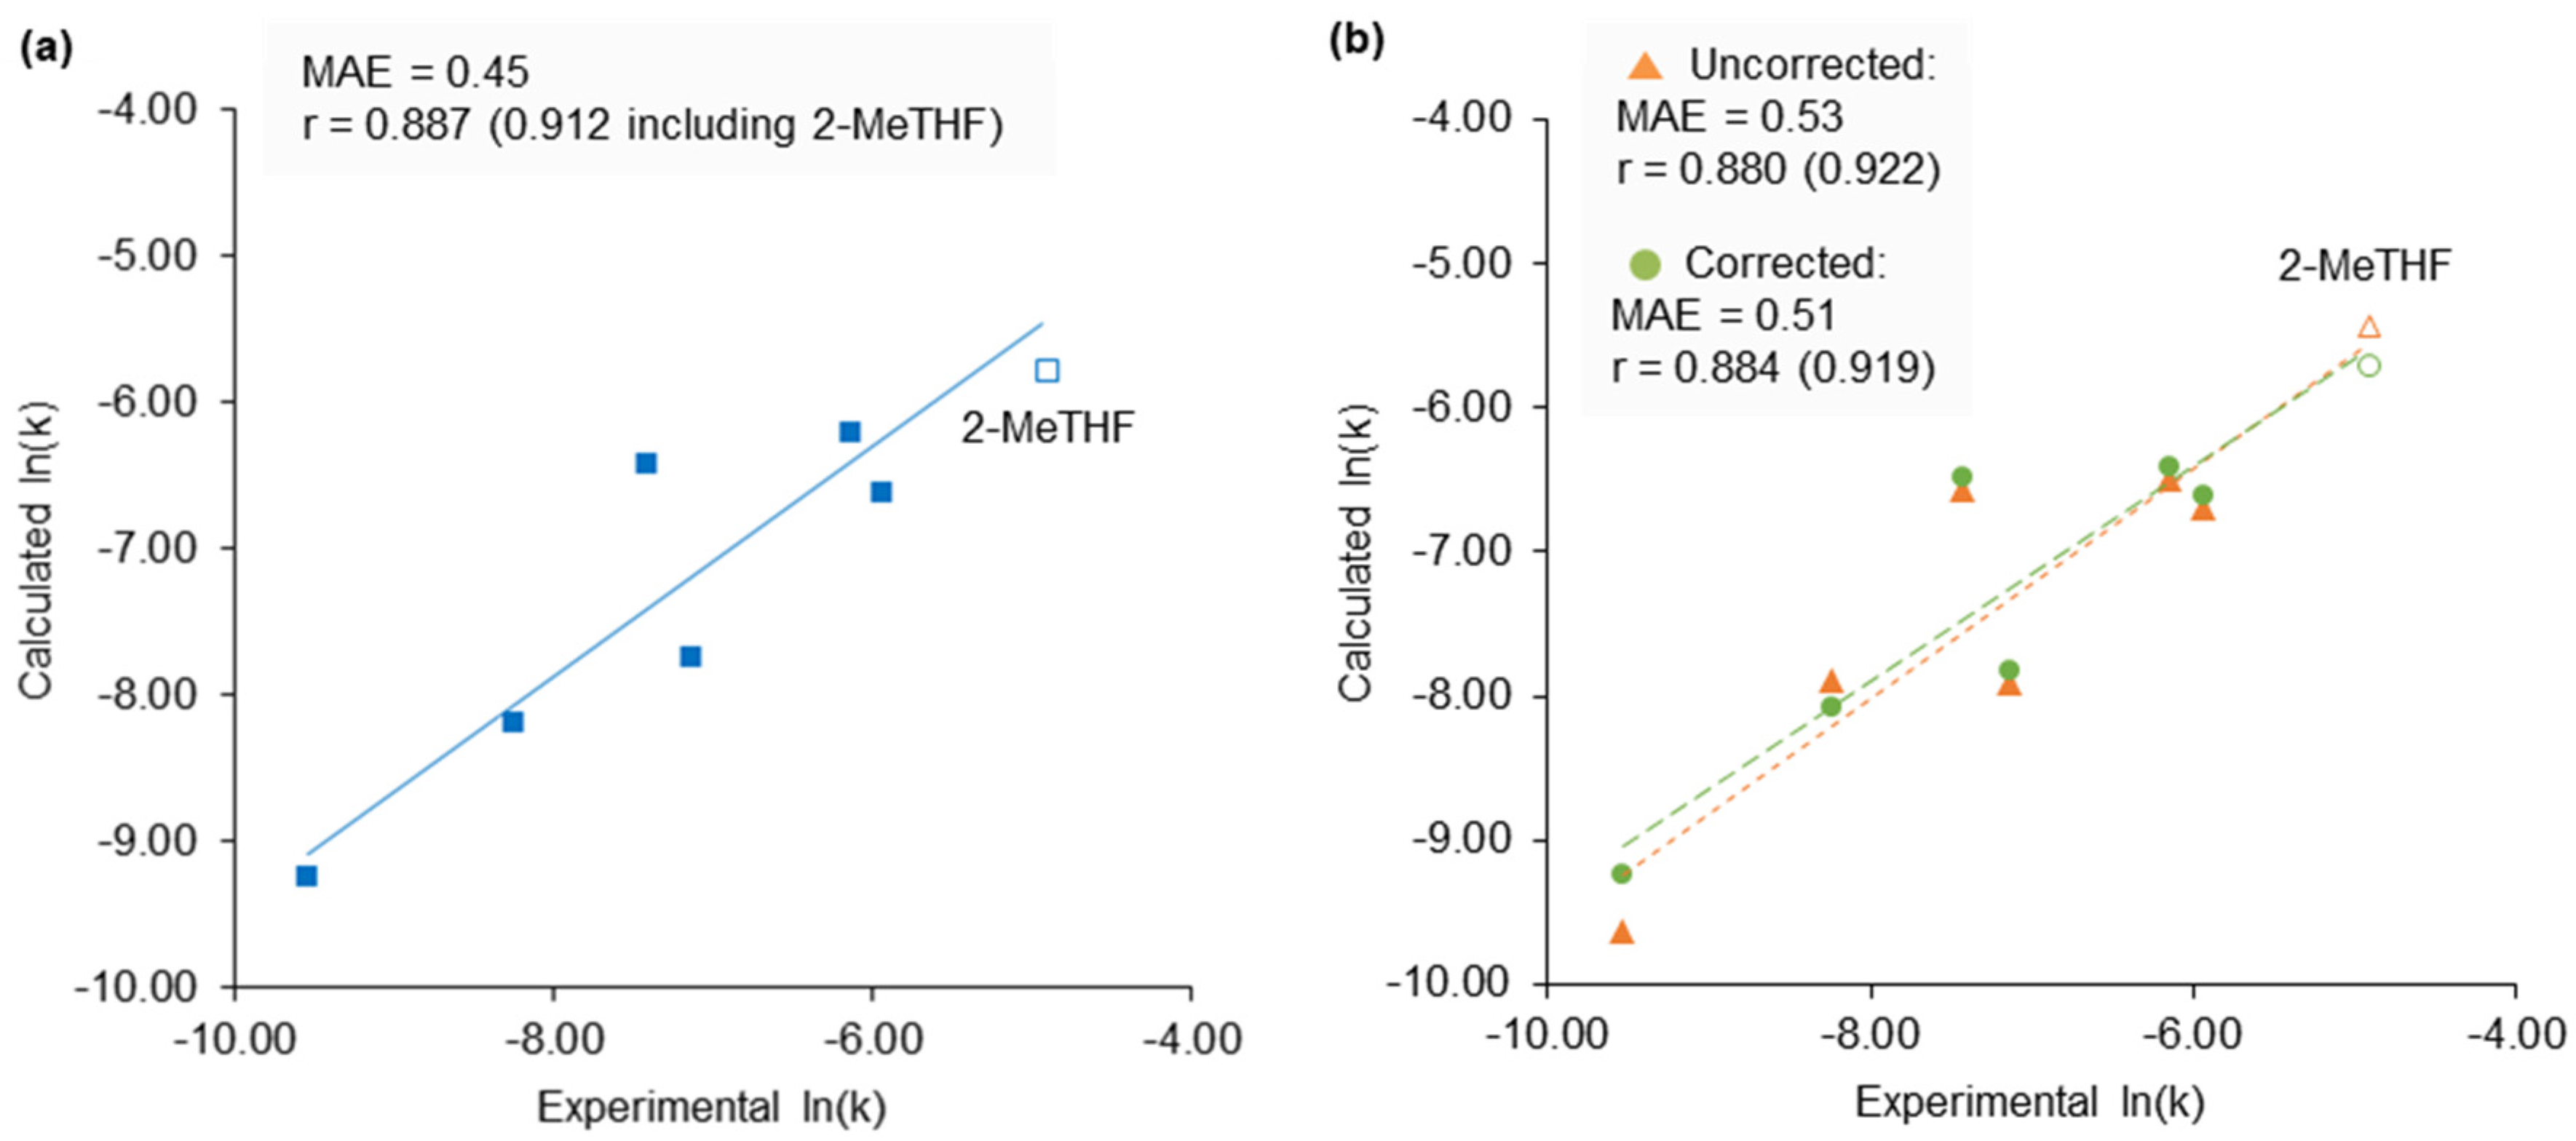
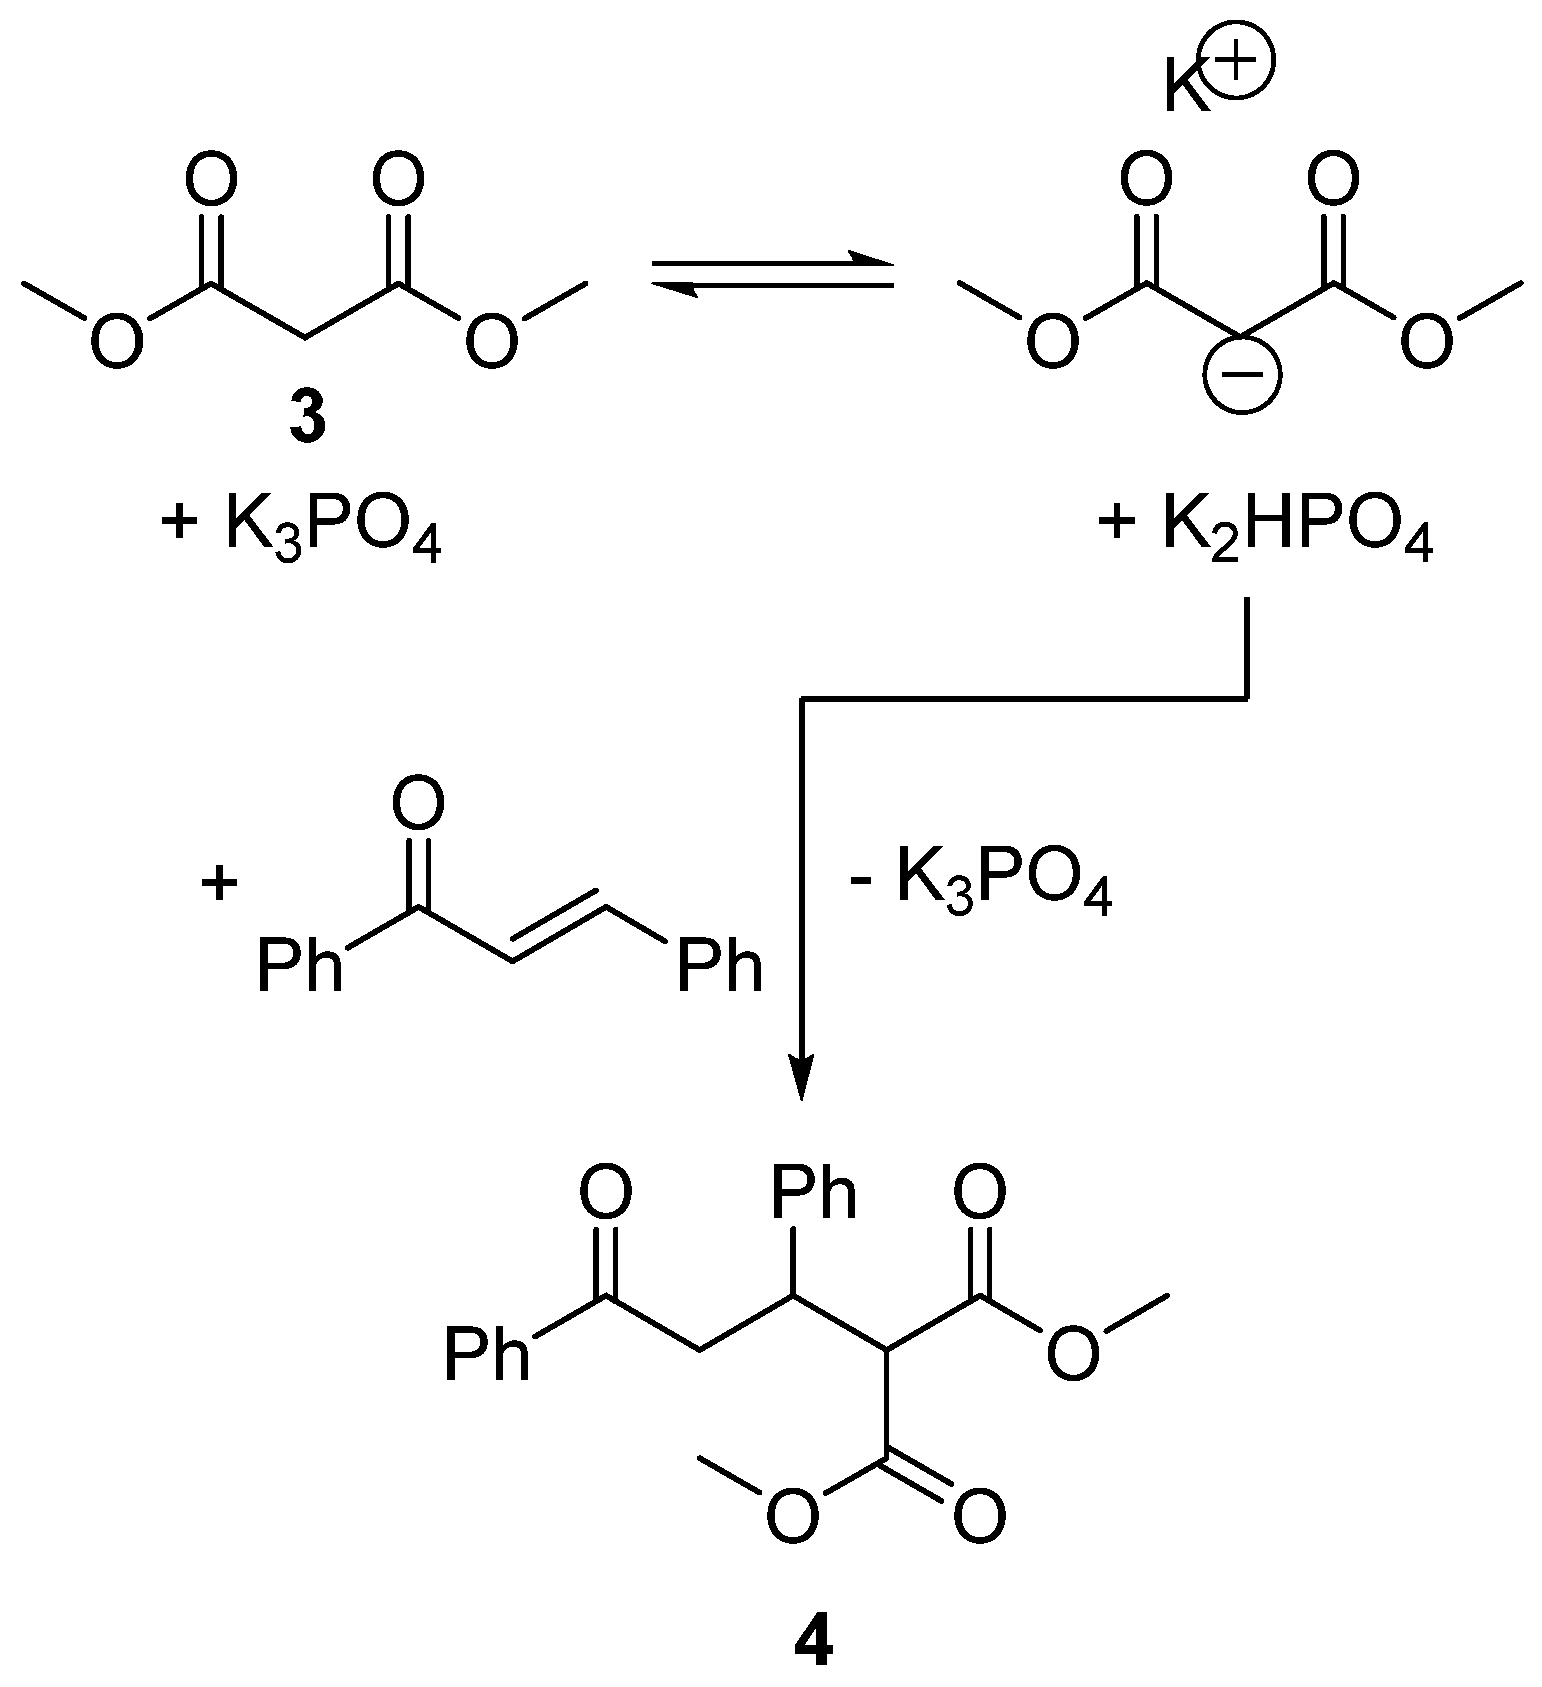
2.4. 2-Methyltetrahydrofuran Identified as a Rate Accelerating Solvent in Michael Addition Chemistry
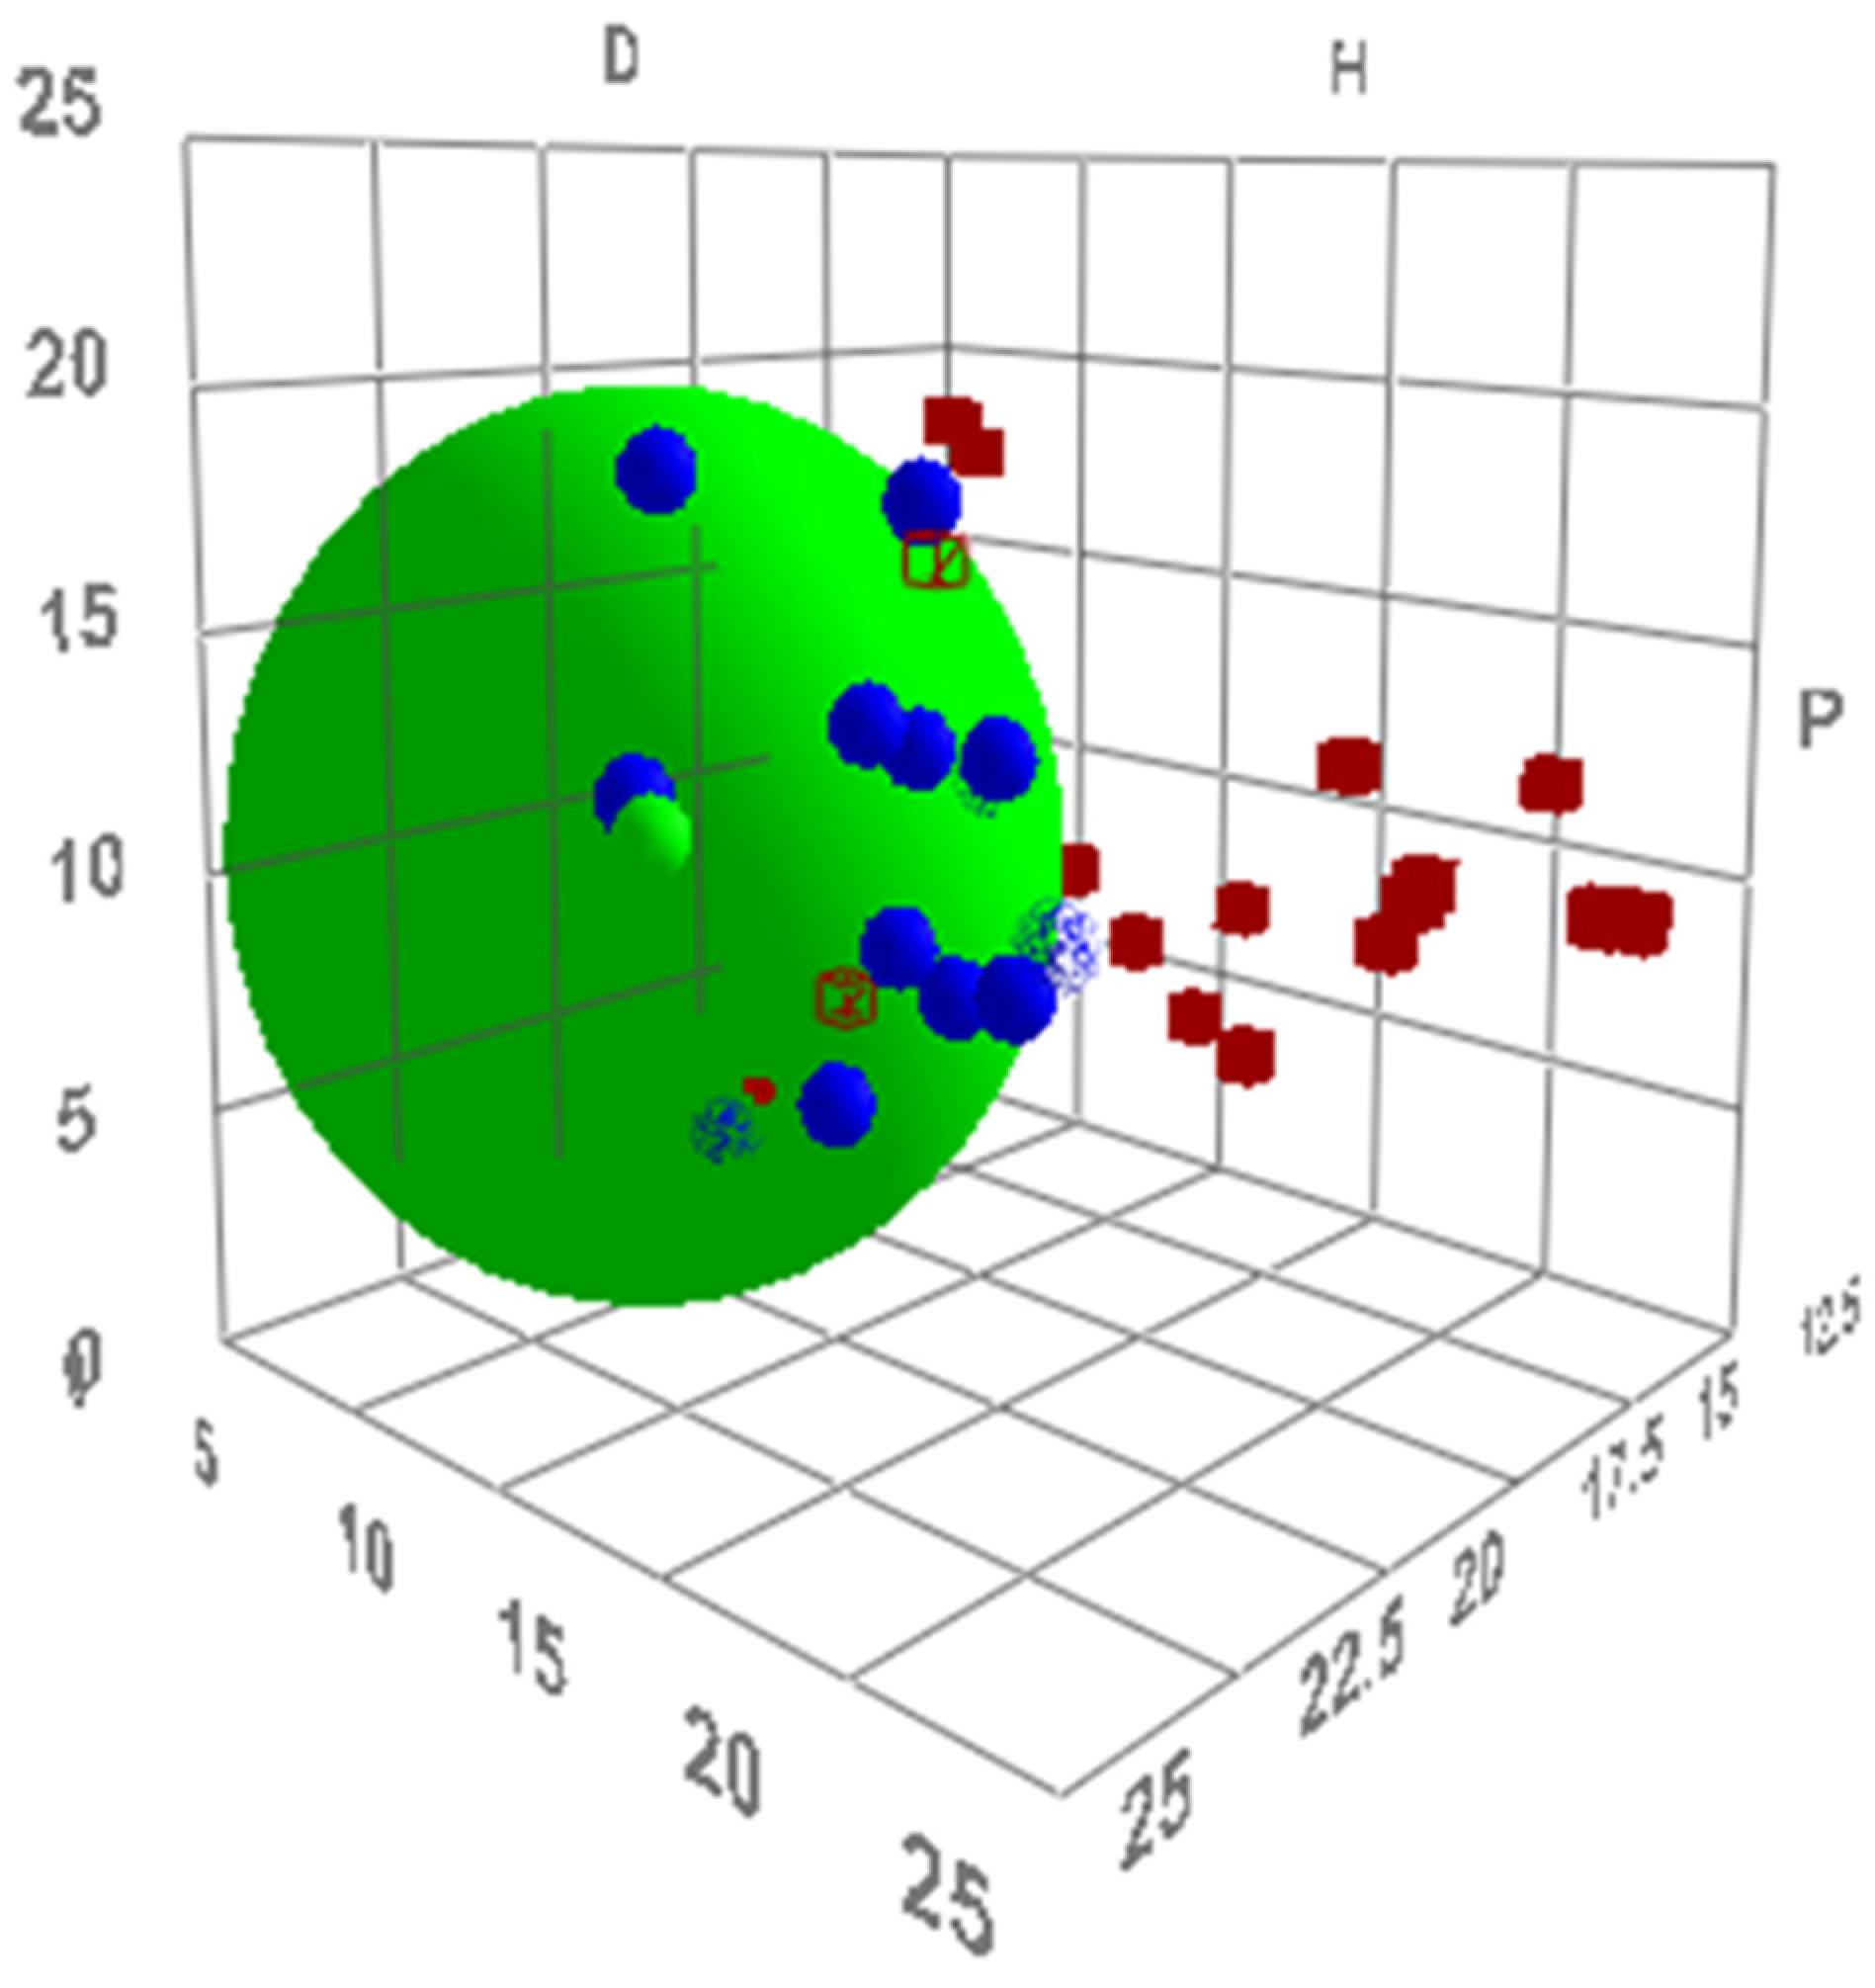
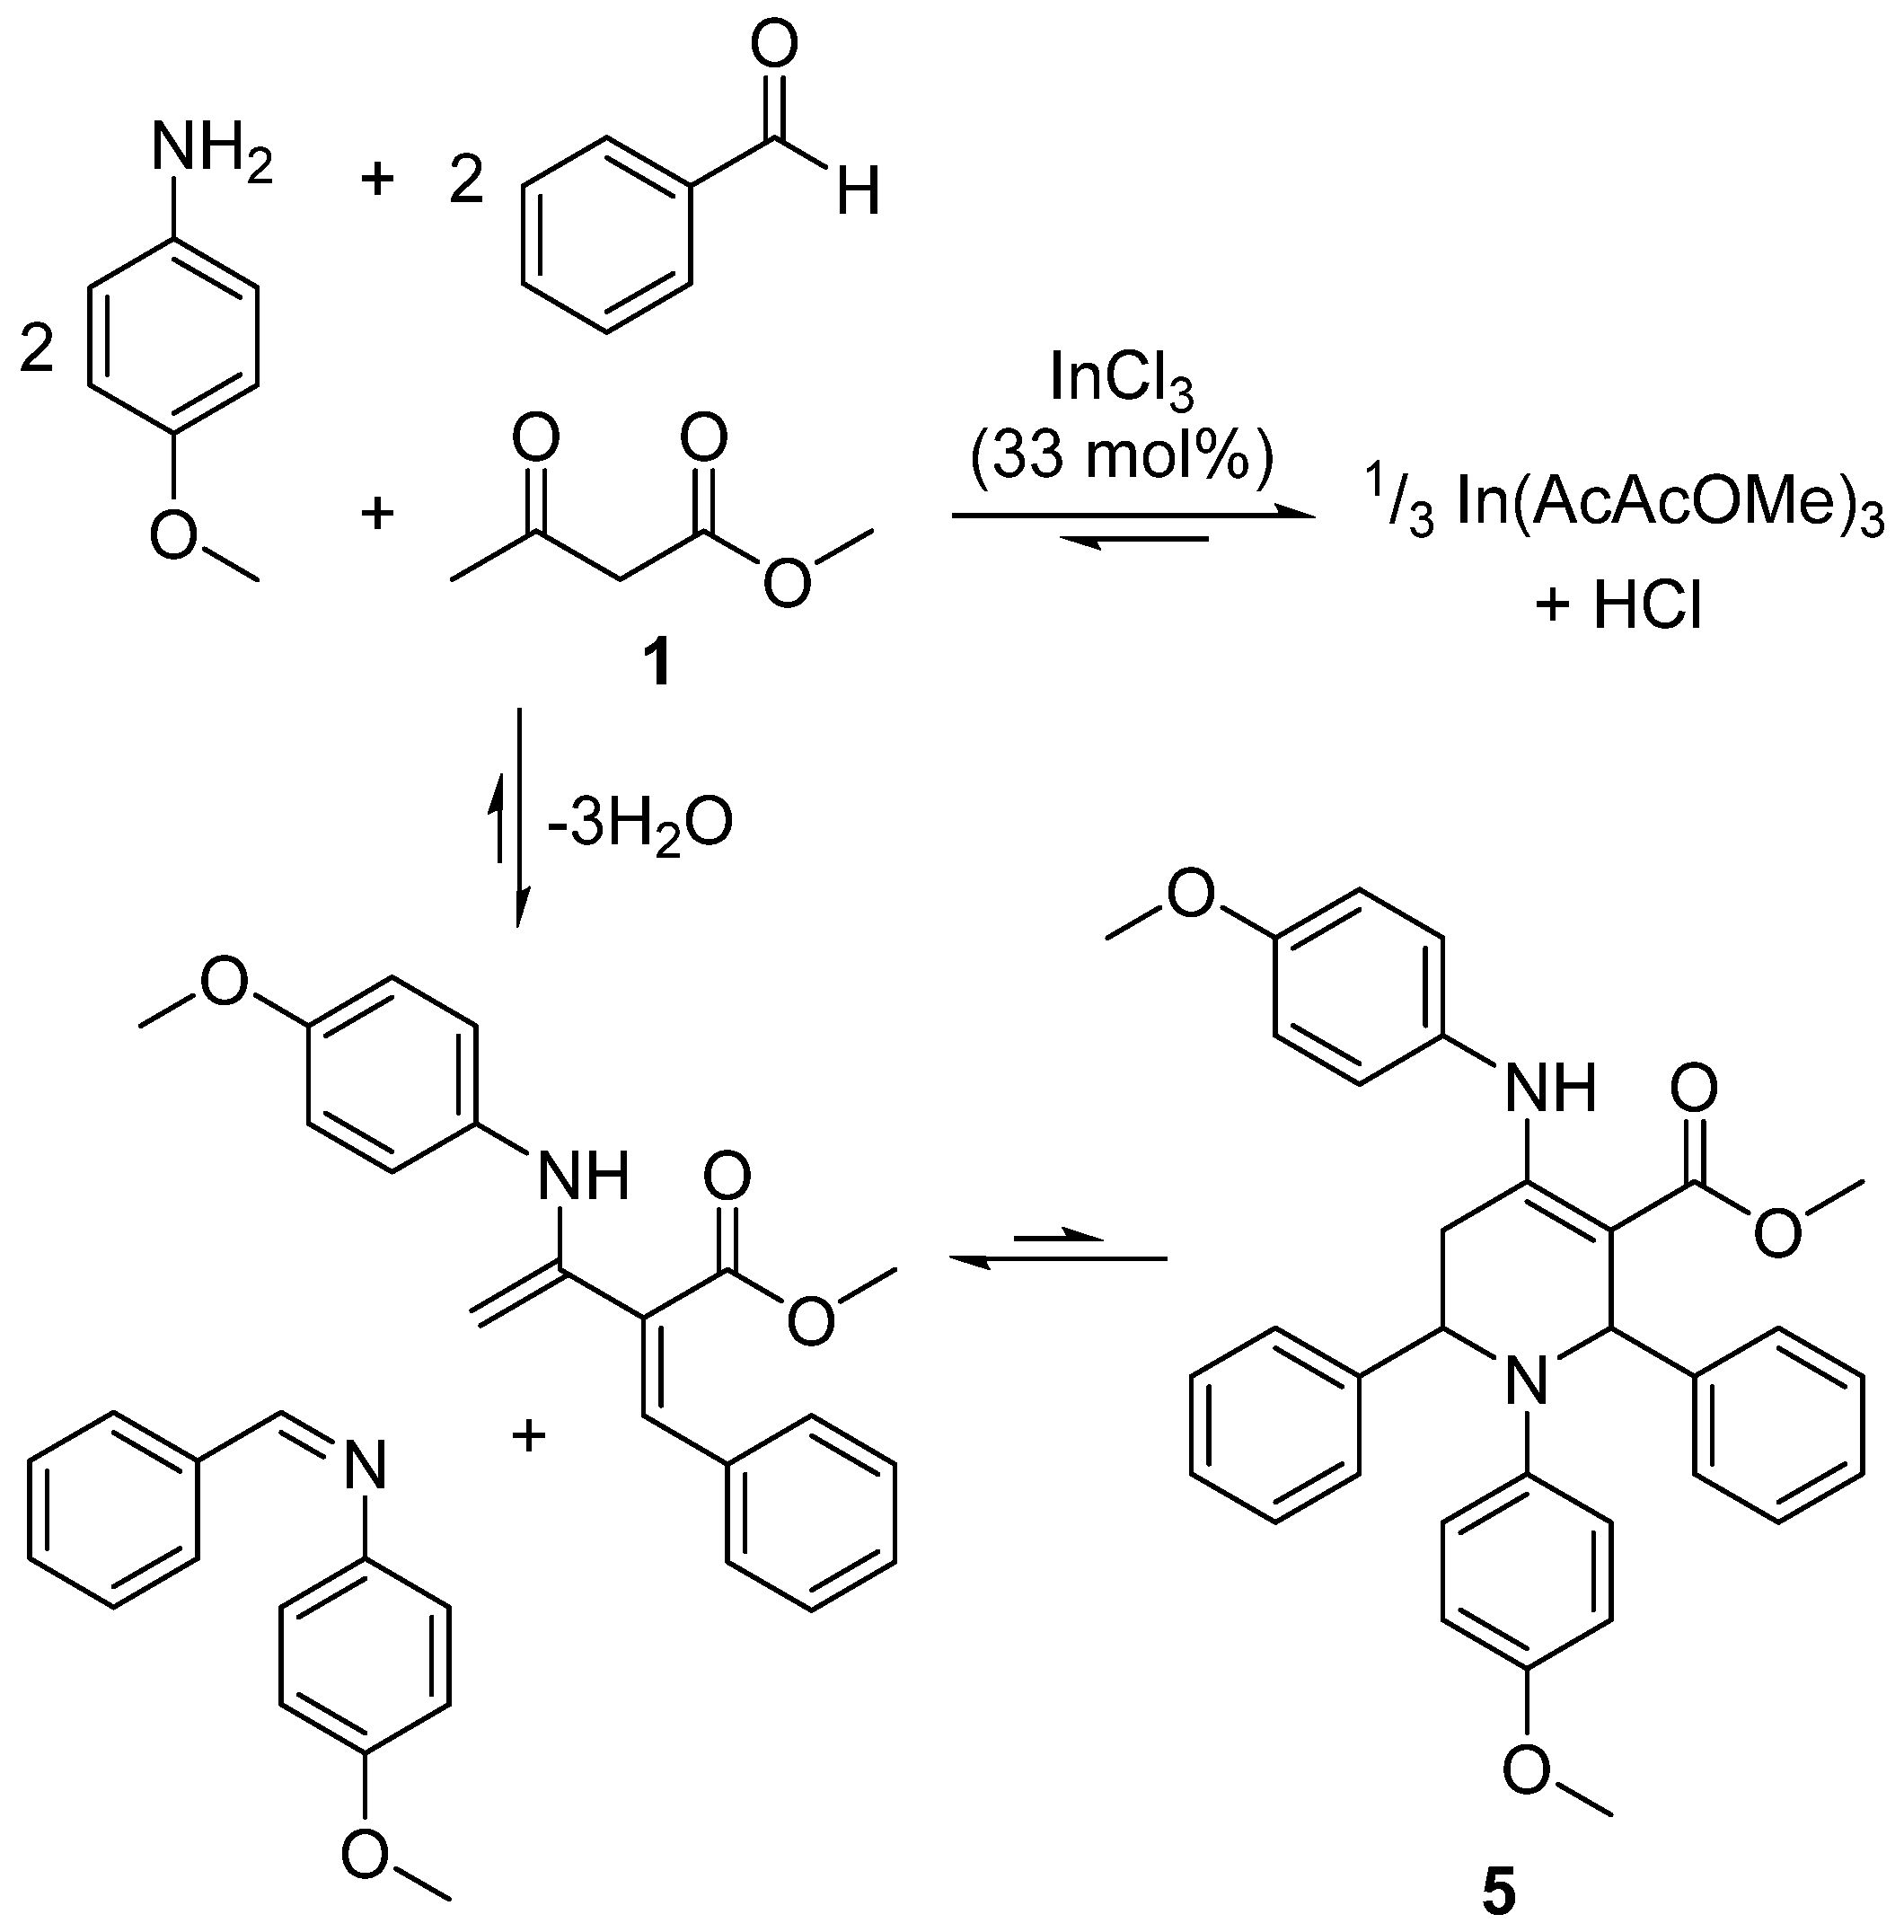
2.5. Design of a Novel Solvent for the Synthesis of Tetrahydropyridines
3. Materials and Methods
4. Conclusions
Supplementary Materials
Author Contributions
Funding
Acknowledgments
Conflicts of Interest
References
- Mellmer, M.A.; Sanpitakseree, C.; Demir, B.; Bai, P.; Ma, K.; Neurock, M.; Dumesic, J.A. Solvent-enabled control of reactivity for liquid-phase reactions of biomass-derived compounds. Nat. Catal. 2018, 1, 199–207. [Google Scholar] [CrossRef]
- Karasawa, T.; Oriez, R.; Kumagai, N.; Shibasaki, M. Anti-selective catalytic asymmetric nitroaldol reaction of α-keto esters: Intriguing solvent effect, flow reaction, and synthesis of active pharmaceutical ingredients. J. Am. Chem. Soc. 2018, 140, 12290–12295. [Google Scholar] [CrossRef] [PubMed]
- Liu, Y.; Baráth, E.; Shi, H.; Hu, J.; Camaioni, D.M.; Lercher, J.A. Solvent-determined mechanistic pathways in zeolite-H-BEA-catalysed phenol alkylation. Nat. Catal. 2018, 1, 141–147. [Google Scholar] [CrossRef]
- Wang, C.-G.; Goto, A. Solvent-selective reactions of alkyl iodide with sodium azide for radical generation and azide substitution and their application to one-pot synthesis of chain-end-functionalized polymers. J. Am. Chem. Soc. 2017, 139, 10551–10560. [Google Scholar] [CrossRef] [PubMed]
- Zhong, J.; Carignano, M.A.; Kais, S.; Zeng, X.C.; Francisco, J.S.; Gladich, I. Tuning the stereoselectivity and solvation selectivity at interfacial and bulk environments by changing solvent polarity: Isomerization of glyoxal in different solvent environments. J. Am. Chem. Soc. 2018, 140, 5535–5543. [Google Scholar] [CrossRef] [PubMed]
- Arjona-Esteban, A.; Stolte, M.; Würthner, F. Conformational switching of π-conjugated junctions from merocyanine to cyanine states by solvent polarity. Angew. Chem. Int. Ed. 2016, 55, 2470–2473. [Google Scholar] [CrossRef] [PubMed]
- Burgess, S.A.; Appel, A.M.; Linehan, J.C.; Wiedner, E.S. Changing the mechanism for CO2 hydrogenation using solvent-dependent thermodynamics. Angew. Chem. Int. Ed. 2017, 56, 15002–15005. [Google Scholar] [CrossRef] [PubMed]
- Grubbs, R.H. Olefin-metathesis catalysts for the preparation of molecules and materials (Nobel lecture). Angew. Chem. Int. Ed. 2006, 45, 3760–3765. [Google Scholar] [CrossRef]
- Negishi, E.-I. Magical power of transition metals: Past, present, and future (Nobel lecture). Angew. Chem. Int. Ed. 2011, 50, 6738–6764. [Google Scholar] [CrossRef]
- Jessop, P.G.; Heldebrant, D.J.; Li, X.; Eckert, C.A.; Liotta, C.L. Reversible nonpolar-to-polar solvent. Nature 2005, 436, 1102. [Google Scholar] [CrossRef]
- Giri, N.; Del Pópolo, M.G.; Melaugh, G.; Greenaway, R.L.; Rätzke, K.; Koschine, T.; Pison, L.; Costa Gomes, M.F.; Cooper, A.I.; James, S.L. Liquids with permanent porosity. Nature 2015, 527, 216–220. [Google Scholar] [CrossRef] [PubMed]
- Abou-Shehada, S.; Clark, J.H.; Paggiola, G.; Sherwood, J. Tunable solvents: Shades of green. Chem. Eng. Process. 2016, 99, 88–96. [Google Scholar] [CrossRef]
- Yang, J.C.; Niu, D.; Karsten, B.P.; Lima, F.; Buchwald, S.L. Use of a “catalytic” cosolvent, N,N-dimethyl octanamide, allows the flow synthesis of Imatinib with no solvent switch. Angew. Chem. Int. Ed. 2016, 55, 2531–2535. [Google Scholar] [CrossRef] [PubMed]
- Sherwood, J.; Farmer, T.J.; Clark, J.H. Catalyst: Possible consequences of the N-methyl pyrrolidone REACH restriction. Chem 2018, 4, 2010–2012. [Google Scholar] [CrossRef]
- Sherwood, J. European restrictions on 1,2-dichloroethane: C-H activation research and development should be liberated and not limited. Angew. Chem. Int. Ed. 2018, 57, 14286–14290. [Google Scholar] [CrossRef] [PubMed]
- Jessop, P.G.; Jessop, D.A.; Fu, D.; Phan, L. Solvatochromic parameters for solvents of interest in green chemistry. Green Chem. 2012, 14, 1245–1259. [Google Scholar] [CrossRef]
- Kamlet, M.J.; Abboud, J.L.; Taft, R.W. The solvatochromic comparison method. 6. The π* scale of solvent polarities. J. Am. Chem. Soc. 1977, 99, 6027–6038. [Google Scholar] [CrossRef]
- Kamlet, M.J.; Taft, R.W. The solvatochromic comparison method. I. The β-scale of solvent hydrogen-bond acceptor (HBA) basicities. J. Am. Chem. Soc. 1976, 98, 377–383. [Google Scholar] [CrossRef]
- Taft, R.W.; Kamlet, M.J. The solvatochromic comparison method. 2. The α-scale of solvent hydrogen-bond donor (HBD) acidities. J. Am. Chem. Soc. 1976, 98, 2886–2894. [Google Scholar] [CrossRef]
- Clark, J.H.; Macquarrie, D.J.; Sherwood, J. The combined role of catalysis and solvent effects on the Biginelli reaction: Improving efficiency and sustainability. Chem. Eur. J. 2013, 19, 5174–5182. [Google Scholar] [CrossRef]
- Eckert, F.; Klamt, A. Fast solvent screening via quantum chemistry: COSMO-RS approach. AIChE J. 2002, 48, 369–385. [Google Scholar] [CrossRef]
- Klamt, A.; Jonas, V.; Bürger, T.; Lohrenz, J.C. Refinement and parametrization of COSMO-RS. J. Phys. Chem. A 1998, 102, 5074–5085. [Google Scholar] [CrossRef]
- Klamt, A. Conductor-like screening model for real solvents: A new approach to the quantitative calculation of solvation phenomena. J. Phys. Chem. 1995, 99, 2224–2235. [Google Scholar] [CrossRef]
- Palomar, J.; Torrecilla, J.S.; Lemus, J.; Ferro, V.R.; Rodríguez, F. A COSMO-RS based guide to analyze/quantify the polarity of ionic liquids and their mixtures with organic cosolvents. Phys. Chem. Chem. Phys. 2010, 12, 1991–2000. [Google Scholar] [CrossRef]
- Zissimos, A.M.; Abraham, M.H.; Klamt, A.; Eckert, F.; Wood, J. A comparison between the two general sets of linear free energy descriptors of Abraham and Klamt. J. Chem. Inf. Comput. Sci. 2002, 42, 1320–1331. [Google Scholar] [CrossRef] [PubMed]
- Diorazio, L.J.; Hose, D.R.J.; Adlington, N.K. Toward a more holistic framework for solvent selection. Org. Process Res. Dev. 2016, 20, 760–773. [Google Scholar] [CrossRef]
- Waghorne, W.E.; O’Farrell, C. Solvent basicity, a study of Kamlet-Taft β and Gutmann DN values using computationally derived molecular properties. J. Solut. Chem. 2018, 47, 1609–1625. [Google Scholar] [CrossRef]
- Struebing, H.; Ganase, Z.; Karamertzanis, P.G.; Siougkrou, E.; Haycock, P.; Piccione, P.M.; Armstrong, A.; Galindo, A.; Adjiman, C.S. Computer-aided molecular design of solvents for accelerated reaction kinetics. Nat. Chem. 2013, 5, 952–957. [Google Scholar] [CrossRef]
- Marcus, Y. The properties of organic liquids that are relevant to their use as solvating solvents. Chem. Soc. Rev. 1993, 22, 409–416. [Google Scholar] [CrossRef]
- Klamt, A. The COSMO and COSMO-RS solvation models. WIREs Comput. Mol. Sci. 2018, 8, e1338. [Google Scholar] [CrossRef]
- Niedermeyer, H.; Ashworth, C.; Brandt, A.; Welton, T.; Hunt, P.A. A step towards the a priori design of ionic liquids. Phys. Chem. Chem. Phys. 2013, 15, 11566–11578. [Google Scholar] [CrossRef] [PubMed]
- Skrzypczak, A.; Neta, P. Rate constants for reaction of 1,2-dimethylimidazole with benzyl bromide in ionic liquids and organic solvents. Int. J. Chem. Kinet. 2004, 36, 253–258. [Google Scholar] [CrossRef]
- Sherwood, J.; De bruyn, M.; Constantinou, A.; Moity, L.; McElroy, C.R.; Farmer, T.J.; Duncan, T.; Raverty, W.; Hunt, A.J.; Clark, J.H. Dihydrolevoglucosenone (Cyrene) as a bio-based alternative for dipolar aprotic solvents. Chem. Commun. 2014, 50, 9650–9652. [Google Scholar] [CrossRef] [PubMed]
- Sherwood, J.; Parker, H.L.; Moonen, K.; Farmer, T.J.; Hunt, A.J. N-Butylpyrrolidinone as a dipolar aprotic solvent for organic synthesis. Green Chem. 2016, 18, 3990–3996. [Google Scholar] [CrossRef]
- Alves Costa Pacheco, A.; Sherwood, J.; Zhenova, A.; McElroy, C.R.; Hunt, A.J.; Parker, H.L.; Farmer, T.J.; Constantinou, A.; De bruyn, M.; Whitwood, A.C.; et al. Intelligent approach to solvent substitution: The identification of a new class of levoglucosenone derivatives. ChemSusChem 2016, 9, 3503–3512. [Google Scholar] [CrossRef] [PubMed]
- Abraham, M.H. Solvent effects on the free energies of the reactants and transition states in the Menschutkin reaction of trimethylamine with alkyl halides. J. Chem. Soc. D 1969, 1307–1308. [Google Scholar] [CrossRef]
- Zhou, Y.; Wei, Y.-L.; Rodriguez, J.; Coquerel, Y. Enantioselective organocatalytic four-atom ring expansion of cyclobutanones: Synthesis of benzazocinones. Angew. Chem. Int. Ed. 2019, 58, 456–460. [Google Scholar] [CrossRef] [PubMed]
- Aycock, D.F. Solvent applications of 2-methyltetrahydrofuran in organometallic and biphasic reactions. Org. Process Res. Dev. 2007, 11, 156–159. [Google Scholar] [CrossRef]
- Clarke, P.A.; Ermanis, K. The development of pot, atom and step economic (PASE) synthesis of functionalised tetrahydropyrans, dihydropyrans and piperidines. Curr. Org. Chem. 2013, 17, 2025–2037. [Google Scholar] [CrossRef]
- Khan, M.M.; Khan, S.; Saigal; Iqbala, S. Recent developments in multicomponent synthesis of structurally diversified tetrahydropyridines. RSC Adv. 2016, 6, 42045–42061. [Google Scholar] [CrossRef]
- Shi, F.; Tan, W.; Zhu, R.-Y.; Xing, G.-J.; Tu, S.-J. Catalytic asymmetric five-component tandem reaction: Diastereo-and enantioselective synthesis of densely functionalized tetrahydropyridines with biological importance. Adv. Synth. Catal. 2013, 355, 1605–1622. [Google Scholar] [CrossRef]
- Marcus, Y. The effectiveness of solvents as hydrogen bond donors. J. Solution Chem. 1991, 20, 929–944. [Google Scholar] [CrossRef]
- Crowhurst, L.; Mawdsley, P.R.; Perez-Arlandis, J.M.; Salter, P.A.; Welton, T. Solvent-solute interactions in ionic liquids. Phys. Chem. Chem. Phys. 2003, 5, 2790–2794. [Google Scholar] [CrossRef]
- Durand, M.; Molinier, V.; Kunz, W.; Aubry, J.-M. Classification of organic solvents revisited by using the COSMO-RS approach. Chem. Eur. J. 2011, 17, 5155–5164. [Google Scholar] [CrossRef] [PubMed]
- Reichardt, C. Solvatochromic dyes as solvent polarity indicators. Chem. Rev. 1994, 94, 2319–2358. [Google Scholar] [CrossRef]
- Mouret, A.; Leclercq, L.; Mühlbauer, A.; Nardello-Rataj, V. Eco-friendly solvents and amphiphilic catalytic polyoxometalate nanoparticles: a winning combination for olefin epoxidation. Green Chem. 2014, 16, 269–278. [Google Scholar] [CrossRef]
- Parker, H.L.; Sherwood, J.; Hunt, A.J.; Clark, J.H. Cyclic carbonates as green alternative solvents for the Heck reaction. ACS Sustain. Chem. Eng. 2014, 2, 1739–1742. [Google Scholar] [CrossRef]
- Sherwood, J. Bio-Based Solvents in Organic Synthesis. Ph.D. Thesis, University of York, York, UK, 2013. [Google Scholar]
- Clark, J.H.; Macquarrie, D.J.; Sherwood, J. A quantitative comparison between conventional and bio-derived solvents from citrus waste in esterification and amidation kinetic studies. Green Chem. 2012, 14, 90–93. [Google Scholar] [CrossRef]
- Byrne, F.; Forier, B.; Bossaert, G.; Hoebers, C.; Farmer, T.J.; Clark, J.H.; Hunt, A.J. 2,2,5,5-Tetramethyltetrahydrofuran (TMTHF): a non-polar, non-peroxide forming ether replacement for hazardous hydrocarbon solvents. Green Chem. 2017, 19, 3671–3678. [Google Scholar] [CrossRef]
- Byrne, F.; Forier, B.; Bossaert, G.; Hoebers, C.; Farmer, T.J.; Hunt, A.J. A methodical selection process for the development of ketones and esters as bio-based replacements for traditional hydrocarbon solvents. Green Chem. 2018, 20, 4003–4011. [Google Scholar] [CrossRef]
- Lagalante, A.F.; Wood, C.; Clarke, A.M.; Bruno, T.J. Kamlet–Taft solvatochromic parameters for 25 glycol ether solvents and glycol ether aqueous solutions. J. Solut. Chem. 1998, 27, 887–900. [Google Scholar] [CrossRef]
- Wells, T.P.; Hallett, J.P.; Williams, C.K.; Welton, T. Esterification in ionic liquids: the influence of solvent basicity. J. Org. Chem. 2008, 73, 5585–5588. [Google Scholar] [CrossRef] [PubMed]
- Ab Rani, M.A.; Brant, A.; Crowhurst, L.; Dolan, A.; Lui, M.; Hassan, N.H.; Hallett, J.P.; Hunt, P.A.; Niedermeyer, H.; Perez-Arlandis, J.M.; et al. Understanding the polarity of ionic liquids. Phys. Chem. Chem. Phys. 2011, 13, 16831–16840. [Google Scholar] [CrossRef] [PubMed]
- Bini, R.; Chiappe, C.; Llopsis Mestre, V.; Pomelli, C.S.; Welton, T. A rationalization of the solvent effect on the Diels–Alder reaction in ionic liquids using multiparameter linear solvation energy relationships. Org. Biomol. Chem. 2008, 6, 2522–2529. [Google Scholar] [CrossRef] [PubMed]
- Teles, A.R.R.; Capela, E.V.; Carmo, R.S.; Coutinho, J.A.P.; Silvestre, A.J.D.; Freire, M.G. Solvatochromic parameters of deep eutectic solvents formed by ammonium-based salts and carboxylic acids. Fluid Phase Equilibria 2017, 448, 15–21. [Google Scholar] [CrossRef]
- Dietz, C.H.J.T.; Kroon, M.C.; van sint Annaland, M.; Gallucci, F. Thermophysical properties and solubility of different sugar-derived molecules in deep eutectic solvents. J. Chem. Eng. Data 2017, 62, 3633–3641. [Google Scholar] [CrossRef]
- Abbott, A.P.; Harris, R.C.; Ryder, K.S.; D’Agostino, C.; Gladden, L.F.; Mantle, M.D. Glycerol eutectics as sustainable solvent systems. Green Chem. 2011, 13, 82–90. [Google Scholar] [CrossRef]
- Reichardt, C.; Welton, T. Solvents and Solvent Effects in Organic Chemistry, 4th ed.; Wiley-VCH: Weinheim, Germany, 2011. [Google Scholar]
- Abraham, M.H.; Doherty, R.M.; Kamlet, M.J.; Harris, J.M.; Taft, R.W. Linear solvation energy relationships. part 37. an analysis of contributions of dipolarity–polarisability, nucleophilic assistance, electrophilic assistance, and cavity terms to solvent effects on t-butyl halide solvolysis rates. J. Chem. Soc. Perkin Trans. 1987, 2, 913–920. [Google Scholar] [CrossRef]
- Iemhoff, A.; Sherwood, J.; McElroy, C.R.; Hunt, A.J. Towards sustainable kinetic resolution, a combination of bio-catalysis, flow chemistry and bio-based solvents. Green Chem. 2018, 20, 136–140. [Google Scholar] [CrossRef]
- Adjiman, C.S.; Clarke, A.J.; Cooper, G.; Taylor, P.C. Solvents for ring-closing metathesis reactions. Chem. Commun. 2008, 2806–2808. [Google Scholar] [CrossRef]
- Frost, G.B.; Serratore, N.A.; Ogilvie, J.M.; Douglas, C.J. Mechanistic model for enantioselective intramolecular alkene cyanoamidation via palladium-catalyzed C-CN bond activation. J. Org. Chem. 2017, 82, 3721–3726. [Google Scholar] [CrossRef] [PubMed]
- Roussel, R.; Oteyza de Guerrero, M.; Spegt, P.; Galin, J.C. Solvent effects on the tautomerisation of t-butyl 2-picolyl and t-butyl quinaldyl ketones. J. Heterocyclic Chem. 1982, 19, 785–796. [Google Scholar] [CrossRef]
- Mills, S.G.; Beak, P. Solvent effects on keto-enol equilibria: tests of quantitative models. J. Org. Chem. 1985, 50, 1216–1224. [Google Scholar] [CrossRef]
- Agostinho, M.; Kobayashi, S. Strontium-catalyzed highly enantioselective Michael additions of malonates to enones. J. Am. Chem. Soc. 2008, 130, 2430–2431. [Google Scholar] [CrossRef] [PubMed]
- Clarke, P.A.; Zaytsev, A.V.; Whitwood, A.C. Pot, atom, and step economic (PASE) synthesis of highly substituted piperidines: a five-component condensation. Synthesis 2008, 3530–3532. [Google Scholar] [CrossRef]
- Kadota, K.; Kurusu, T.; Taniguchi, T.; Ogasawara, K. Lipase-mediated synthesis of both enantiomers of levoglucosenone from acrolein dimer. Adv. Synth. Catal. 2011, 343, 618–623. [Google Scholar] [CrossRef]
Sample Availability: Please enquire at http://resolve-bbi.eu/ or contact the corresponding authors. |


| σ-Moment | Description |
|---|---|
| Area | Molecular surface area. |
| sig1 | Charge (zero for organic solvents). |
| sig2 | The global electrostatic polarity of the molecule. |
| sig3 | The asymmetry of the σ-profile, measured by skewness. |
| HBdon | Hydrogen bond donor moment. |
| HBacc | Hydrogen bond acceptor moment. |
© 2019 by the authors. Licensee MDPI, Basel, Switzerland. This article is an open access article distributed under the terms and conditions of the Creative Commons Attribution (CC BY) license (http://creativecommons.org/licenses/by/4.0/).
Share and Cite
Sherwood, J.; Granelli, J.; McElroy, C.R.; Clark, J.H. A Method of Calculating the Kamlet–Abboud–Taft Solvatochromic Parameters Using COSMO-RS. Molecules 2019, 24, 2209. https://doi.org/10.3390/molecules24122209
Sherwood J, Granelli J, McElroy CR, Clark JH. A Method of Calculating the Kamlet–Abboud–Taft Solvatochromic Parameters Using COSMO-RS. Molecules. 2019; 24(12):2209. https://doi.org/10.3390/molecules24122209
Chicago/Turabian StyleSherwood, James, Joe Granelli, Con R. McElroy, and James H. Clark. 2019. "A Method of Calculating the Kamlet–Abboud–Taft Solvatochromic Parameters Using COSMO-RS" Molecules 24, no. 12: 2209. https://doi.org/10.3390/molecules24122209
APA StyleSherwood, J., Granelli, J., McElroy, C. R., & Clark, J. H. (2019). A Method of Calculating the Kamlet–Abboud–Taft Solvatochromic Parameters Using COSMO-RS. Molecules, 24(12), 2209. https://doi.org/10.3390/molecules24122209