Abstract
Polylactic acid (PLA) is limited in its application due to its high price, high brittleness and low glass-transition temperature. Modification methods are currently used to overcome these shortcomings. In this study, Bletilla striata polysaccharide (BSP) was blended with PLA by a solvent method. DMA data showed that the BSP/PLA film had a higher glass-transition temperature, and the glass-transition temperature of the film showed an extreme value of 68 °C when the proportion of the chalk polysaccharide was 0.8%. TG data indicates that the composite film material has good thermal stability. Tensile tests show that the composite film is improved in rigidity and elasticity compared to the pure PLA film. The blending modification of PLA with white peony polysaccharide not only reduces the cost of PLA, but also improves the thermal and mechanical properties of PLA.
1. Introduction
Extracted from Radix Paeoniae Alba, Bletilla striata polysaccharide (BSP), also known as Bletilla hyacinthina gumis, is a polymer with low toxicity and high safety. The main components of BSP are glucose and mannose [1]. The naturally extracted BSP is a powder with a slight sweetness. The powder can dissolve in water to form a viscous solution, which can be used as a film-forming material. As a natural polymer material, BSP exhibits good biocompatibility and biodegradability [2], having excellent application prospects [3,4]. BSP has high safety as a food additive or ingredient, and its unique properties make it widely used in the food industry [5]. Related research shows that using the excellent film-forming properties of BSP, the preparation of fruit coating film preservative can reduce the evaporation of water and achieve the purpose of preservation [6]. BSP has good anti-inflammatory and acid-resistance ability, and is less affected by factors such as pH, inorganic ions and temperature, and can improve the stability of the emulsified product. With the development and clinical needs of modern pharmaceutical technology, BSP is also widely used in pharmacology and clinical practice as mediation therapy, coupling agent, etc. Cai et al. [7] developed a white ultrasonic medical couplant, and compared it with paraffin oil emulsion and Japanese ultrasonic coupling agent, found that the main quality index of white enamel ultrasonic coupling agent exceeds paraffin oil emulsion, which is superior to Japanese products.
Polylactic acid (PLA) is a natural polymer material with a wide range of sources. PLA can be regenerated, is completely biodegradable and nontoxic and it exhibits good biocompatibility and biodegradability [8,9,10]. In addition, PLA has a wide range of applications and is easy to process. It is a green polymer with excellent performance and can blend with other natural polymer materials to form fully biodegradable composites [11,12,13]. With the theme of environmental protection and sustainable development, PLA has attracted increasing attention and has been extensively studied in the fields of industry and agriculture [14,15], biomedicine [16,17] and food packaging [18,19,20]. At present, PLA is considered one of the materials with the most promising development prospects [21]. Ma et al. [22] obtained the PLA/Fe3O4-AZM microspheres by emulsification-solvent evaporation technology, and the sustained release effect was obvious. Tan et al. [23] obtained a PLA/PCL-PVA-CS-Ag nanofiber auxiliary material by electrospinning technology and achieved good antibacterial effects. Swaroop et al. [24] used polylactic acid as a raw material to prepare magnesium oxide nanoparticle-enhanced biofilms by a solvent casting method. The prepared film is transparent, can shield ultraviolet radiation, and has excellent antibacterial properties. It is an excellent food packaging material. However, the high price of PLA has constrained its development [25]. In addition, other factors such as low heat-resistance, poor hydrophilicity, high brittleness, insufficient elasticity, low degradation rate, varied degradation cycle, low mechanical strength, poor moisture vapor barrier property, low crystallization rate and low thermal stability [26,27,28,29] greatly limit the application scope of PLA. Therefore, physical modification, chemical modification and composite preparation have been carried out to modify PLA materials to improve their performance and reduce cost.
Wu et al. [30] used elastomers and PLA to prepare composites. The obtained materials have the advantages of a short plasticizing time, high melt fluidity, and high tensile elongation at break, but they have the disadvantage of significantly decreased tensile strength. Pan et al. [31] prepared a polyacrylic acid grafted starch/PLA composite using a graft copolymerization and blending technique. The obtained products have significantly increased tensile strength and hydrophilicity but exhibit decreased degradation and thermal performance. Similarly, Wu et al. [32] observed increased tensile strength and elongation at break for a polylactic acid grafted starch/PLA composite but it had a significantly decreased initial thermal decomposition temperature and deteriorated thermal stability. Tao et al. [33] prepared aliphatic polycarbonate (PPC)/PLA composites by solution casting. The obtained materials exhibit an increased biodegradation rate that improves the biodegradability of PLA but also exhibit a lower tensile strength and modulus compared with PLA. As such, the thermal properties of the materials are not improved. Zhang et al. [34] modified PLA with biodegradable hyperbranched polyester amide ester (HBP) by melt blending. The obtained PLA composites have increased tensile strength and elongation at break, excellent toughness but poor thermal stability. Li et al. [35] used tetrabutyl titanate to modify a PLA/starch composite. The obtained materials exhibit enhanced flexibility and degradation performance but show no improvement in thermal properties. Zhang et al. [36] prepared and characterized PLA/cellulose nanocrystalline composites. The obtained materials have increased tensile strength but decreased elongation at break and deteriorated toughness. Feng et al. [37] blended polyurethane with PLA. The obtained materials have the advantages of high elongation at break, high impact strength and high tensile strength but exhibit no improvement in thermal properties. Thus, research has shown that using natural polymer materials such as starch or cellulose to modify PLA can only improve either mechanical properties or thermal properties but not both. Therefore, finding a suitable material that can improve both the mechanical properties and thermal properties of PLA is important. Compared with other natural polymer materials, BSP has the advantages of wide availability, low cost, excellent toughness, and natural degradability. The blending of BSP and PLA can not only reduce the cost but also improve the performance of PLA materials. In this study, BSP is selected as the material for modifying PLA. The results show that the obtained composite exhibits improved thermal properties and improved mechanical properties, which is a new highlight in PLA blend modification research.
In this study, BSP was used as the modified material, PLA was used as the raw material, and 1,4-dioxane and ultrapure water were used as solvents to physically blend PLA and BSP to prepare BSP/PLA composite films. The optimum ratio was deduced to achieve the best modification effect. The glass-transition temperature (Tg) of the composite film was determined by dynamic thermomechanical analysis (DMA). The crystal morphology was determined by X-ray diffraction (XRD). The thermal decomposition temperature was determined by thermogravimetry (TG). The thermal stability was determined by differential scanning calorimetry (DSC) and TG. The morphologies of the cross section and surface were observed by scanning electron microscopy (SEM). In addition, the mechanical properties of the composite film were tested on a tensile testing machine.
2. Results and Discussion
2.1. Loss Factor Analysis of DMA
The Tg is an excellent indicator of the application range of a material [38]. The higher the Tg is, the better the processing of the material, the wider the application range, and the higher the upper limit of the plasticity [39]. The DSC and DMA data can both reflect the Tg of the BSP/PLA composite films. However, because the thermal effect of DMA is more obvious and the DMA data are more convincing, we used DMA to measure the Tg of the composite films. To determine the Tg, two tangent lines were drawn on the tanδ-temperature curve and the abscissa of the intersection of the tangent lines was considered the Tg.
PLA1, PLA2, PLA3, PLA4, PLA5, PLA6, PLA7, PLA8 and BSP represent the BSP content of 0%, 0.2%, 0.4%, 0.6%, 0.8%, 1%, 1.2%, 1.4% and 100% of the total mass, respectively.
A dynamic thermomechanical analyzer was used to measure the Tg of the BSP/PLA composite films with different BSP ratios. Figure 1 shows the variation curve of the wear factor with temperature for various BSP/PLA composite films (plotted with Origin v7.0; OriginLab Corp., Northampton, MA, USA). Figure 1 and Table 1 show the Tg of the composite films with various BSP ratios. With increasing BSP ratio, the Tg of the composite films first increases, reaches the peak value at 0.8%, and then gradually decreases as the BSP ratio is increased further. This advantageous property was not observed by Wu [30], Pan [31] or Wu [32]. This is because there is a hydrogen bond between BSP and PLA, which hinders the migration and diffusion of the PLA chain, so the molecular chain rigidity increases and the glass transition temperature increases. With the further increase of the BSP ratio, excessive BSP increases molecular chain distance. Therefore, the Tg decreases as the BSP ratio is increased further [40].
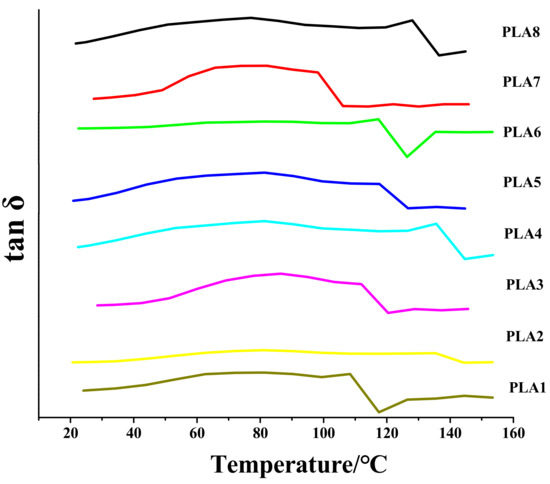
Figure 1.
Analysis of DMA Loss Factor of BSP/PLA Composite Films with Different Proportions. Temperature/Loss Factor diagram.

Table 1.
Glass Transition Temperature of BSP/PLA Composite Films with Different Proportions.
2.2. Energy Storage Modulus Analysis of DMA
Changes in temperature will cause changes in molecules, and changes of related viscoelastic properties such as the energy storage modulus and loss modulus. Figure 2 shows the effects of different ratios of BSP on the system. The results in Figure 2 show that the storage modulus of the composite film is positively correlated with ratio of BSP; i.e., the higher the BSP ratio, the greater the storage modulus of the film. The storage modulus of the two composite films with the highest ratios of BSP is far superior to those of other films at the beginning of the measurement. In addition, when the temperature rises to the Tg, these two films still show a relatively greater storage modulus than the other films, indicating that the introduction of BSP enhances the elasticity of the material. Compared with the films prepared by Zhang et al. [35], the films prepared in this study have certain advantages in terms of storage modulus and elasticity.
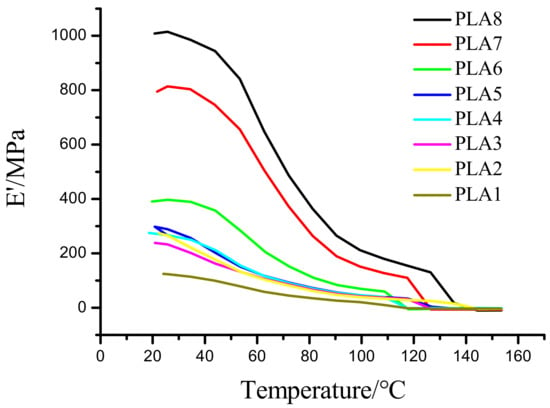
Figure 2.
Analysis of Storage Modulus of BSP/PLA Films. Temperature/storage modulus diagram.
2.3. DSC Analysis of Composite Films
The DSC curves of pure PLA and PLA modified with different ratios of BSP are shown in Figure 3, and the obtained parameters are shown in Table 2 (Tc is the cold crystallization temperature of the material, ΔHc is the enthalpy of crystallization, Tm is the melting temperature, ΔHf is the enthalpy of fusion, and Xc is the crystallinity). At 85.5 °C, pure PLA exhibits a very small cold crystallization peak. After the addition of BSP, the position of the melting peak does not substantially change; however, the intensity of the peak is slightly higher than that of pure PLA. The positions of the cold crystallization peaks generally shift toward higher temperatures, indicating that BSP can promote the heterogeneous nucleation of PLA in the temperature range 80–130 °C. However, the shift of the cold crystallization peak toward lower temperatures also indicates that the modified film can only crystallize at higher temperatures, which makes the formation of crystal nuclei difficult. Therefore, the composite films are more difficult to crystallize at lower temperatures than pure PLA. The Tm of composite films increases with increasing BSP ratio and are all higher than that of pure PLA, although this increase is not obvious. However, the extent of the increase of the Tm shows a trend of first increasing and then decreasing. We speculate that, when the temperature is too high, molecules undergoing intense thermal motion cause the formed nuclei to become unstable; the nuclei are thus susceptible to be affected by the thermal movement of the molecular chain of PLA.
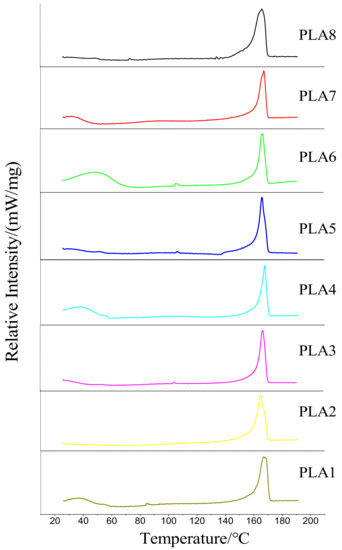
Figure 3.
DSC of BSP/PLA Composite Films. Temperature/heat flow diagram.

Table 2.
Test Data of BSP/PLA Composite Films.
According to the formula, we calculated the crystallinity of each film using the measured enthalpy of fusion and found that the variation trend of crystallinity also first increases and then decreases.
2.4. TG Analysis of Composite Films
Figure 4 shows the TG curve and the DTG curve of the composite films under a nitrogen atmosphere. In Table 3, Tinitial represents the initial decomposition temperature of the material, T10 represents the temperature at which the material has undergone 10% weight loss, Tcomplete represents the temperature at which the material completely decomposes, and Tmax represents the temperature corresponding to highest decomposition rate.
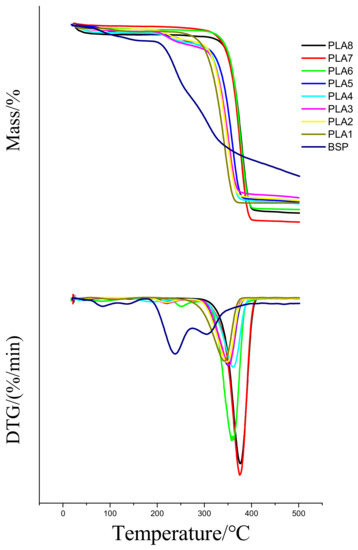
Figure 4.
TG and DTG Curves of Composite Films. Temperature/thermogravimetry and Temperature/differential thermogravimetry dargram

Table 3.
TG and DTG data of composite films.
Figure 4 shows that the weight loss of BSP from 25 to 200 °C is mainly due to the loss of free water and bound water. The weight loss between 200 and 350 °C is mainly due to the loss of polysaccharides. The weight loss above 350 °C might be due to the loss of unburned BSP and carbonized PLA. DTG thermograms of a few composite films show increases in the weight-loss rate at approximately 220 and 250 °C, which may be due to the loss of the unevenly mixed BSP. On the basis of the data in Table 3, with the continuous increase of the BSP ratio, both the T10 and the Tmax of the composite films first increase and then decrease; both are higher than those of pure PLA. When the ratio of BSP is 0.8%, the T10 and the Tmax of the composite films both reach the maximum, which are 116.3 °C and 45.9 °C higher than those of the pure PLA, respectively. The increase of T10 and Tmax is due to the formation of hydrogen bonds between BSP and PLA, which hinders the relative movement of PLA molecules when heated. This improves the thermal stability of the PLA. When the ratio of BSP is increased further, the distance between the molecular chains is increased, and the entanglement of the PLA chain is reduced, so the thermal stability is reduced. This is consistent with the change in crystallinity.
Pure PLA has a Tcomplete of 359.3 °C and a Tinitial of 291.2 °C. With the continuous addition of BSP, the Tcomplete and Tinitial of the composite films also continue to increase until reaching the peak value (398.5 °C for Tcomplete and 351.2 °C for Tinitial) when the BSP ratio is 0.8%. Afterwards, Tcomplete and Tinitial both show a decreasing trend; overall, however, they are both higher than the Tcomplete and Tinitial of PLA: the maximum T complete of the composites is 39.2 °C higher and the maximum Tinitial is 60 °C higher than those of pure PLA, indicating that the composite films exhibit greater thermal stability than pure PLA. Previous studies on PLA modification mostly improved its mechanical properties, not its thermal properties. The composites obtained in this study have the advantages of improved thermal performance.
2.5. XRD Analysis of Composite Films
The XRD patterns of the BSP/PLA composite films are shown in Figure 5. The single crystal diffraction peak of 16.69° corresponds to the α crystal form of polylactic acid, and the single crystal diffraction peak of 18.52° is the diffraction peak of BSP. With increasing BSP ratio, the position of the diffraction peak of the PLA single crystal is significantly shifted to a smaller 2θ angle, and then slightly shift to a larger 2θ angle. According to the Brugg equation , it can be found that the crystal plane spacing first increases significantly and then decreases slightly, and the crystal core stacking first loosens and then compacts.
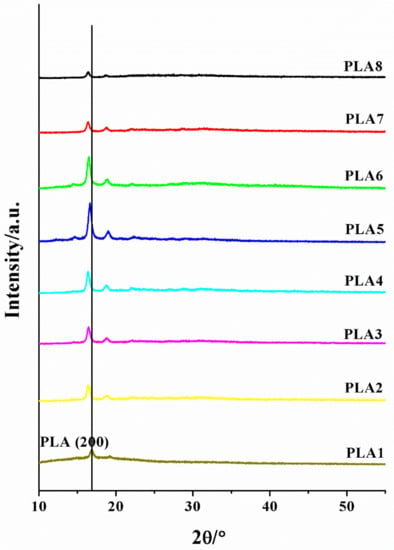
Figure 5.
XRD of composite films. 2θ/ Diffraction peak intensity diagram.
2.6. SEM Analysis of Composite Films
The SEM images of the composite films are shown in Figure 6, and the pore sizes are shown in Table 4. The microstructure of the composite films is a loose and porous network structure. Figure 6a–f present SEM images of the films with a BSP ratio 0.4%, 0.6%, 0.8%, 1.0%, 1.2% and 1.4%, respectively. With increasing BSP ratio, the pores of the composite film are firstly increased and then reduced by the influence of the interplanar spacing, which is consistent with the XRD results.
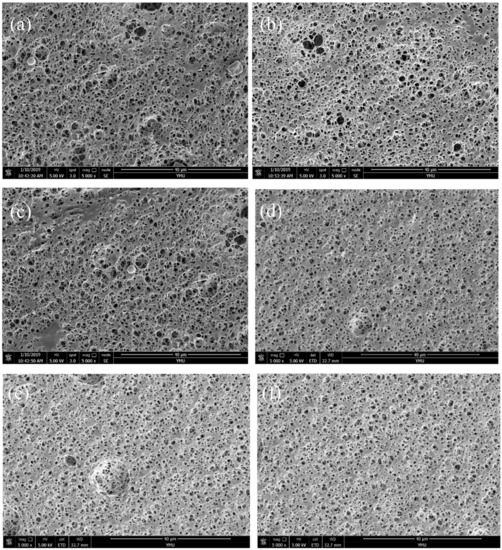
Figure 6.
SEM of composite films. (a) Represents a BSP ratio of 0.4%; (b) represents a BSP ratio of 0.6%; (c) represents a BSP ratio of 0.8%; (d) represents a BSP ratio of 1%; (e) represents a BSP ratio of 1.2%; (f) represents a BSP ratio of 1.4%.

Table 4.
Aperture Size Table of Composite Films.
2.7. Mechanical Analysis of Composite Films
The tensile strength of the BSP/PLA composite film is shown in Figure 7 and Table 5. The elongation at break of the composite films showed a trend of increasing first and then decreasing, reaching the peak value of 53.14% when the BSP ratio is 0.8%. This peak value is 2.46 times greater than that of pure PLA, indicating improved toughness of the material [41]. This is because when the BSP is small, the compatibility of the material is good [42], and the BSP is uniformly dispersed in the PLA, so the elongation at break increases, when the BSP is large, the partial molecular chain of the PLA may be crosslinked to form a gel point, so the elongation at break will decrease. But the tensile strength of the composite films showed a trend of decreasing first and then increasing, this is because when the BSP is small, the intermolecular interaction force is weak, so the tensile strength is reduced, when the BSP content is high, BSP will crosslink with PLA, and the intermolecular interaction force is strong, so the tensile strength is improved. Finally, the addition of BSP also increases the maximum force of the material by as much as 1.98 times that of pure PLA, indicating that BSP can be used to toughen PLA.
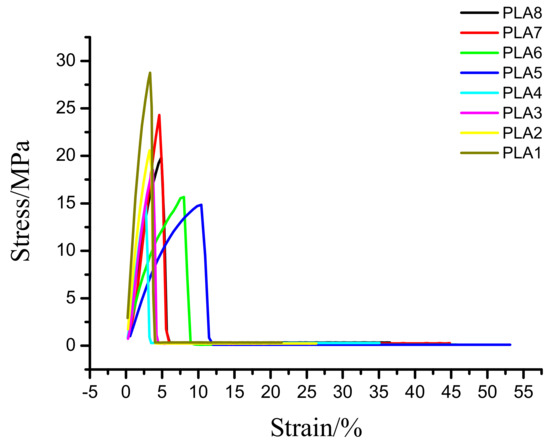
Figure 7.
Plot for tensile data. Stress strain diagram

Table 5.
Tensile test results of BSP/PLA composite film.
2.8. Contact Angle of Composite Films
The smaller the contact angle of the material, the better the hydrophilicity of the material. According to Figure 8 and Table 6, it can be seen that with the increase of BSP, the hydrophilicity of the material is getting better and better.
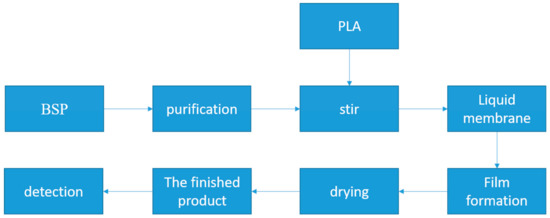
Figure 8.
Membrane preparation.

Table 6.
Contact angle data.
3. Materials and Methods
3.1. Materials
BSP was purchased from Xi’an Tianrui Biotechnology Co., Ltd. (Xi′an, China). Activated carbon was purchased from Jiangsu Agnes Environmental Technology Co., Ltd. (Jiangsu, China). Ethanol and 1,4-dioxane were purchased from Tianjin Damao Chemical Reagent Co. (Tianjin, China). PLA was prepared in our own laboratory, and the average molecular weight was 11.0 × 10⁴. A glass plate with an inner diameter of 20 cm × 20 cm was prepared in our laboratory.
3.2. Purification of BSP
Fifty grams of extracted BSP was dissolved in 1000 mL of distilled water and continuously stirred with a glass rod. After BSP was completely dissolved, the mixture was filtered with gauze 3 times and the filtrate was collected by vacuum filtration. A small amount of activated carbon was added to the collected filtrate, and the mixture was heated with stirring for 1 h. After hot suction filtration, the obtained BSP solution was heated and concentrated to 400 mL. After the solution cooling, ethanol was slowly added with stirring until the glue was completely precipitated. After setting overnight, the precipitate was collected by suction filtration and dried at 80 °C to yield 35 g of BSP.
3.3. Preparation of BSP/PLA Composite Films
The BSP/PLA composite film was prepared by a solvent volatilization technique. Two grams of PLA was added to each of two 100 mL conical flasks. After 50 mL 1,4-dioxane was added, the mixture was stirred for 12 h until complete dissolution of PLA. BSP in amounts of 0%, 0.2%, 0.4%, 0.6%, 0.8%, 1%, 1.2%, 1.4% and 100% of the amount of PLA (referred to hereafter as PLA1, PLA2, PLA3, PLA4, PLA5, PLA6, PLA7, PLA8 and BSP, respectively) was accurately weighed into 1 mL centrifuge tubes, and 0.6 mL of ultrapure water was added to each tube. After BSP was completely dissolved, the solution from one of the centrifuge tubes was added into the conical flask drop by drop and the resultant solution was stirred for 4 h. Afterwards, the mixture was poured onto a flat glass plate sitting on a flat platform. The plate was dried in a wind-free dry environment for 36 h until the solvent had completely evaporated. The dried film, with a thickness range of 50–55 μm, was collected for measurement and subsequent performance evaluation.
3.4. Dynamic Thermomechanical Analysis (DMA) Analysis
A dynamic mechanical analyzer (DMA 242 E, Netzsch, Selb, Germany) was used to collect DMA data. First, samples were made into 5 mm × 15 mm specimens. The experiments were conducted via the dynamic stretching method; the initial frequency was 1 Hz, the absolute amplitude was 120 μm, the maximum dynamic force was 1.5 N, the additional static force was 0.05 N, the heating rate was 2 °C/min, and the temperature range was 25–180 °C.
3.5. Different Scanning Calorimeter(DSC) Analysis
DSC data were collected using a differential scanning calorimeter (DSC 214 Polyma, Netzsch). A sample of 3–5 mg was weighed and sealed in an aluminum crucible. The N2 flow rate was 30 mL/min, the heating rate was 5 °C/min, the temperature range was 25–200 °C. TG-DSC was used to identify and compare the starting temperature where peaks appeared in the thermogram. The crystallinity formula [43] is as follows:
where is the crystallinity of the sample, is the enthalpy of fusion, and is the enthalpy of fusion for the sample with complete PLA crystallization, which is 93.0 J/g.
3.6. Thermogravimetric(TG) Analysis
Thermogravimetric analysis (TGA) data were obtained using a thermogravimetric analyzer (STA449F31, Netzsch). The heating rate was controlled at 10°C/min under a nitrogen atmosphere. The TGA analysis was carried out between 25 and 500 °C.
3.7. X-Ray Diffraction Characterization (XRD)
The samples were subjected to X-ray analysis using a wide-angle X-ray diffractometer (Bruker, Karlsruhe, Germany). A Cu target (λ = 0.154 nm) operated at a working voltage 45 kV and working current 150 mA was used; the scanning-angle range was 5–60°, and the scanning rate as 5°/min.
3.8. Scanning Election Microscopy (SEM )Analysis
SEM (NOVA NANOSEM-450, FEI, Hillsboro, OR, USA) was used to observe the surface and cross-section of the sample. To effectively observe the surface and cross-section, the sample was first quenched in liquid nitrogen and the cross-section was subjected to a gold spray treatment. The accelerating voltage was 5 kV, and the magnification was 5000×. The pore size was analyzed using the Nano-measurer software.
3.9. Mechanical Performance Test
The mechanical properties of the samples were tested using a microcomputer-controlled electronic universal testing machine (CMT 4104, MTS Industrial Systems Co., Inc., Shenzhen, China). First, the sample was made into a 45 mm × 10 mm specimen, and a 50 N sensor was selected for the measurement. The tensile performance test of a plastic film was selected as the measurement mode. The test speed was 100 mm/min. Parallel experiments (seven each) were conducted, and average values were taken.
3.10. Contact Angle Test
Measurements were made using a contact angle measuring instrument model OCA200 (Dataphysics, Stuttgart, Germany). A 2 cm diameter sample was mounted on a clean, smooth glass slide and the drop was dropped onto the surface of the film by hanging drop. The contact angle of water on the surface of the film was measured by a contact angle meter, and each sample was measured twice.
4. Conclusions
In this study, BSP was used to physically modify PLA to improve its performance. The results show that, when the ratio of BSP is 0.8%, the BSP/PLA composite film exhibits the best performance. DMA shows that the addition of BSP can increase the Tg (to a maximum temperature of 68 °C) and improve the rigidity and elasticity of the materials. DSC demonstrates that the modified PLA exhibits increased crystallinity. TGA indicates that the addition of BSP can increase the thermal decomposition temperature to a maximum of 60 °C. XRD shows that the introduction of BSP does not change the crystalline form. SEM shows that BSP can destroy PLA molecular chains, making it difficult to migrate and diffuse. Mechanical analysis shows that, with the continuous addition of BSP, the maximum elongation at break of the film increases by 2.46 times and the maximum force also increases to a peak value that is 1.98 times that of pure PLA. In this study, the BSP/PLA composite film was prepared and characterized for the first time. The PLA modified by BSP could find applications in the green packaging field.
Author Contributions
M.Y. (Minglong Yuan) conceived and designed the experiments; R.Y. and D.W. performed the experiments; X.Z., Y.H. and H.L. analyzed the data; M.Y. (Mingwei Yuan), H.L. and M.Y. (Mingwei Yuan) contributed reagents/materials/analysis tools; R.Y. wrote the paper.
Funding
This work was supported by the National Natural Science Foundation of China (Project Nos. 31460247, 81460542, 81760644), the Biodegradable Materials Innovative Research Team (inScience and Technology) at the University of Yunnan Province and the Innovation Team Based on Research and Application of Biological Functional Materials of Yunnan Minzu University (2017HC034), Yunnan Science and Technology Project - Major Science and Technology Specialities of Biological Medicine (2018ZF008). Graduate Innovation Foundation of Yunnan Minzu University (2018YJCXS268).
Conflicts of Interest
The authors declare no conflict of interest.
References
- Bates, D.O.; Jones, R.O. The role of vascular endothelial growth factor in wound healing. J. Surg. Res. 2009, 153, 347–358. [Google Scholar] [CrossRef] [PubMed]
- Chen, J.; Liu, D.; Shi, B.; Wang, H.; Cheng, Y.; Zhang, W. Optimization of hydrolysis conditions for the production of glucomanno-oligosaccharides from konjac using β-mannanase by response surface methodology. Carbohydr. Polym. 2013, 93, 81–88. [Google Scholar] [CrossRef] [PubMed]
- Diao, H.; Li, X.; Chen, J.; Lou, Y.; Chen, X.; Dong, L.; Wang, C.; Zhang, C.; Zhang, J. Bletilla striata Polysaccharide Stimulates Inducible Nitric Oxide Synthase and Proinflammatory Cytokine Expression in Macrophages. J. Biosci. Bioeng. 2008, 105, 85–89. [Google Scholar] [CrossRef]
- Dong, L.; Xia, S.; Luo, Y.; Diao, H.; Zhang, J.; Chen, J.; Zhang, J. Targeting delivery oligonucleotide into macrophages by cationic polysaccharide from Bletilla striata successfully inhibited the expression of TNF-alpha. J. Control. Release 2009, 134, 214–220. [Google Scholar] [CrossRef] [PubMed]
- He, H.-l.; Gu, G.-p.; Zhang, W.-m. Research on Cherry Tomato Fruits Coated with Bletilla Glucomannan (Bg) Film. Food Sci. 2007, 28, 336–340. [Google Scholar]
- Huang, C.-Q.; Song, T.-S.; Li, M.-J.; Zhao, D.; Xu, Z.Z.; Yang, S.H. Determination of Pollen Vitality and Preserved Method in Bletilla striata (Thunb.) Reichb.f. Northern Hortic. 2011, 3, 182–184. [Google Scholar]
- Cai, J.Y.; Xiong, J.W.; Huang, Y.F.; Zhao, Y.Y.; Zhang, C.Y.; Liu, W.W.; Wei, K.H. Study on ultrasonic- microwave synergistic extraction of polysaccharose from Bletilla striata and its antioxidant activity. Sci. Technol. Food Ind. 2016, 22, 274–284. [Google Scholar]
- Ray, S.S.; Okamoto, M. Biodegradable Polylactide and Its Nanocomposites: Opening a New Dimension for Plastics and Composites. Macromol. Rapid Commun. 2003, 24, 815–840. [Google Scholar] [CrossRef]
- Zhang, Z.; Feng, S.S. The drug encapsulation efficiency, in vitro drug release, cellular uptake and cytotoxicity of paclitaxel-loaded poly(lactide)-tocopheryl polyethylene glycol succinate nanoparticles. Biomaterials 2006, 27, 4025–4033. [Google Scholar] [CrossRef]
- Holger, C.F. Hyperbranched polylactide copolymers. Macromolecules 2006, 39, 1719–1723. [Google Scholar]
- Zhu, K.J.; Xiangzhou, L.; Shilin, Y. Preparation, characterization, and properties of polylactide (PLA)–poly(ethylene glycol) (PEG) copolymers: A potential drug carrier. J. Appl. Polym. Sci. 2010, 39, 1–9. [Google Scholar] [CrossRef]
- Schugens, C.H.; Grandfils, C.H.; Jerome, R.; Teyssie, P.; Delree, P.; Martin, D.; Malgrange, B.; Moonen, G. Preparation of a macroporous biodegradable polylactide implant for neuronal transplantation. J. Biomed. Mater. Res. 1995, 29, 1349–1362. [Google Scholar] [CrossRef] [PubMed]
- Okada, M. Chemical syntheses of biodegradable polymers. Prog. Polym. Sci. 2002, 27, 87–133. [Google Scholar] [CrossRef]
- Liu, X.C.; Zhang, X.; Han, X.; Zheng, S.F. Preparation and characterization of polylactic acid blending membrane. Phosphate Comp. Fertil. 2017, 32, 7–10. [Google Scholar]
- Zhang, N.; Li, Q.; Hou, Z.; Ye, J. Effect of Polylactic Acid-Degradable Film Mulch on Soil Temperature and Cotton Yield. J. Agric. Resour. Environ. 2016, 33, 114–119. [Google Scholar]
- Auras, R.; Harte, B.; Selke, S. An Overview of Polylactides as Packaging Materials. Macromol. Biosci. 2010, 4, 835–864. [Google Scholar] [CrossRef]
- He, Y.; Hu, Z.W.; Ren, M.D.; Ding, C.K.; Chen, P.; Gu, Q.; Wu, Q. Evaluation of PHBHHx and PHBV/PLA fibers used as medical sutures. J. Mater. Sci. Mater. Med. 2014, 25, 561–571. [Google Scholar] [CrossRef]
- Graupner, N. Application of lignin as natural adhesion promoter in cotton fibre-reinforced poly(lactic acid) (PLA) composites. J. Mater. Sci. 2008, 43, 5222–5229. [Google Scholar] [CrossRef]
- Sun, J.H.; Hao, K.K.; Zhang, Y.M.; Zhang, Y.; Qian, C. Preparation and performance investigation of air-thermal bonded waddings of polylactic acid/ES fibes. Tech. Textiles 2016, 34, 21–25. [Google Scholar]
- Mistriotis, A.; Briassoulis, D.; Giannoulis, A.; D’Aquino, S. Design of biodegradable bio-based equilibrium modified atmosphere packaging (EMAP) for fresh fruits and vegetables by using micro-perforated poly-lactic acid (PLA) films. Postharvest Biol. Technol. 2016, 111, 380–389. [Google Scholar] [CrossRef]
- Avinc, O.; Khoddami, A. Overview of Poly(lactic acid) (PLA) Fibre. Fibre Chemistry 2010, 42, 68–78. [Google Scholar] [CrossRef]
- Zhang, Y.; Wei, Z.; Wang, H.-L. Study on Preparation and Performance of PLA/Nano-Fe_3O_4 Loading Azithromycin Sustained Release. Chem. Bioeng. 2014, 1, R94. [Google Scholar]
- Minghao, T.; Liang, Z.; Jixiang, Z.; Xiumei, T.; Fanwen, Y.; Xiaoming, C. Preparation and characterization of Ag-loaded dressing by electrospinning. New Chem. Mater. 2017, 4, 86. [Google Scholar]
- Swaroop, C.; Shukla, M. Nano-magnesium oxide reinforced polylactic acid biofilms for food packaging applications. Int. J. Biol. Macromol. 2018, 113, 729–736. [Google Scholar] [CrossRef] [PubMed]
- Gupta, B.; Revagade, N.; Hilborn, J. Poly(lactic acid) fiber: An overview. Progress Polym. Sci. 2007, 32, 455–482. [Google Scholar] [CrossRef]
- Rasal, R.M.; Hirt, D.E. Toughness decrease of PLA-PHBHHx blend films upon surface-confined photopolymerization. J. Biomed. Mater. Res. Part A 2009, 88, 1079–1086. [Google Scholar] [CrossRef]
- Hiljanen-Vainio, M.; Varpomaa, P.; Seppälä, J.; Törmälä, P. Modification of poly(L-lactides) by blending: mechanical and hydrolytic behavior. Macromol. Chem. Phys. 1996, 197, 1053–1023. [Google Scholar] [CrossRef]
- Grijpma, D.W.; Nijenhuis, A.J.; Van Wijk, P.G.T.; Pennings, A.J. High impact strength as-polymerized, P.L.L.A. Polym. Bull. 1992, 29, 571–578. [Google Scholar] [CrossRef]
- Janorkar, A.V.; And AT, M.; Hirt, D.E. Modification of Poly(lactic acid) Films: Enhanced Wettability from Surface-Confined Photografting and Increased Degradation Rate Due to an Artifact of the Photografting Process. Macromolecules 2004, 37, 9151–9159. [Google Scholar] [CrossRef]
- Huang, J.; Wu, W.; Xiang, A. Study on Blends of PLA/Elastomers. China Plastics. 2010, 11, 54–57. [Google Scholar]
- Lijun, P.; Lei, G.; Yanhong, L. Preparation and Characterization of the Modified Acrylic-Starch/Polylactic Acid Blends. Plastics Sci. Technol. 2009, 37, 28–31. [Google Scholar]
- Wu, J.; Tai, Y.; Qin, Y. Preparation of modified starch/PLA blends. New Chem. Mater. 2011, 39, 125–126. [Google Scholar]
- Wang, S.F.; Tao, J.; Guo, T.Y.; Fu, T.; Yuan, X.Y.; Zheng, J.P.; Song, C.J. Thermal Characteristics, Mechanical Properties and Biodegradability of Polycarbonates/Poly (Lactic Acid) (PPC/PLA) Blends. Ion Exch. Adsorpt. 2007, 23, 1. [Google Scholar]
- Zhang, W.; Zhang, Y. Study on Toughening of Poly (lactic acid) Blended with Poly (ester amide). Synt. Fiber China 2008, 37, 9–11. [Google Scholar]
- Li, Y.; Lu, C.; Cheng, S.J.; Lin, J.P.; Zhou, D.F. Blends of Polylactic Acid /Starch Toughened by Tetrabutyl Titanate. J. Funct. Polym. 2007, 19, 304–308. [Google Scholar]
- Zhang, J.; Ding, C.K.; Duan, J.Y.; Li, Q.; Cheng, B.W. Preparation and Properties of Polylactic Acid/Cellulose Nanocrystal Composites. China Plastics. 2018, 32, 22–26. [Google Scholar]
- Fei, F.; Lin, Y. Study on the Structure and Property of Polylactic Acid/Polyurethane elastomers Blend. China Plastics Ind. 2009, 37, 12–15. [Google Scholar]
- Tiersch, T.R.; Monroe, W.T. Three-dimensional printing with polylactic acid (PLA) thermoplastic offers new opportunities for cryobiology. Cryobiology 2016, 73, 396–398. [Google Scholar] [CrossRef]
- Szymanski, J. The Effects of Temperature and Humidity on Cushioning Properties of Expanded Polylactic Acid Foam. Master’s Thesis, Clemson University, Clemson, SC, USA, 2010. [Google Scholar]
- Shen, M.; Li, H.; Yuan, M.; Jiang, L.; Zheng, X.; Zhang, S.; Yuan, M. Preparation of bergenin-Poly (lactic acid) polymers and in vitro controlled release studies. Int. J. Biol. Macromol. 2018, 116, 354–363. [Google Scholar] [CrossRef]
- Ito, M.; Abe, S.; Ishikawa, M. The fracture mechanism of polylactic acid resin and the improving mechanism of its toughness by addition of acrylic modifier. J. Appl. Polym. Sci. 2010, 115, 1454–1460. [Google Scholar] [CrossRef]
- Zuo, Y.; Gu, J.; Yang, L.; Qiao, Z.; Tan, H.; Zhang, Y. Preparation and characterization of dry method esterified starch/polylactic acid composite materials. Int. J. Biol. Macromol. 2014, 64, 174–180. [Google Scholar] [CrossRef] [PubMed]
- Simões, C.L.; Viana, J.C.; Cunha, A.M. Mechanical properties of poly(ε-caprolactone) and poly(lactic acid) blends. J. Appl. Polym. Sci. 2010, 112, 345–352. [Google Scholar] [CrossRef]
Sample Availability: Samples of the compounds Bletilla striata Polysaccharide and Polylactic Acid are available from the authors. |
© 2019 by the authors. Licensee MDPI, Basel, Switzerland. This article is an open access article distributed under the terms and conditions of the Creative Commons Attribution (CC BY) license (http://creativecommons.org/licenses/by/4.0/).