
Microstructure Optimization of Mg-Alloys by the ECAP Process Including Numerical Simulation, SPD Treatments, Characterization, and Hydrogen Sorption Properties


 ,
,  ,
,  ,
,
Abstract
1. Introduction
2. Results
2.1. Pre-Optimizing ECAP Processing from Numerical Analysis
2.2. Experimental Microstructure Analysis: Grain Refinement, Defects, and Texture
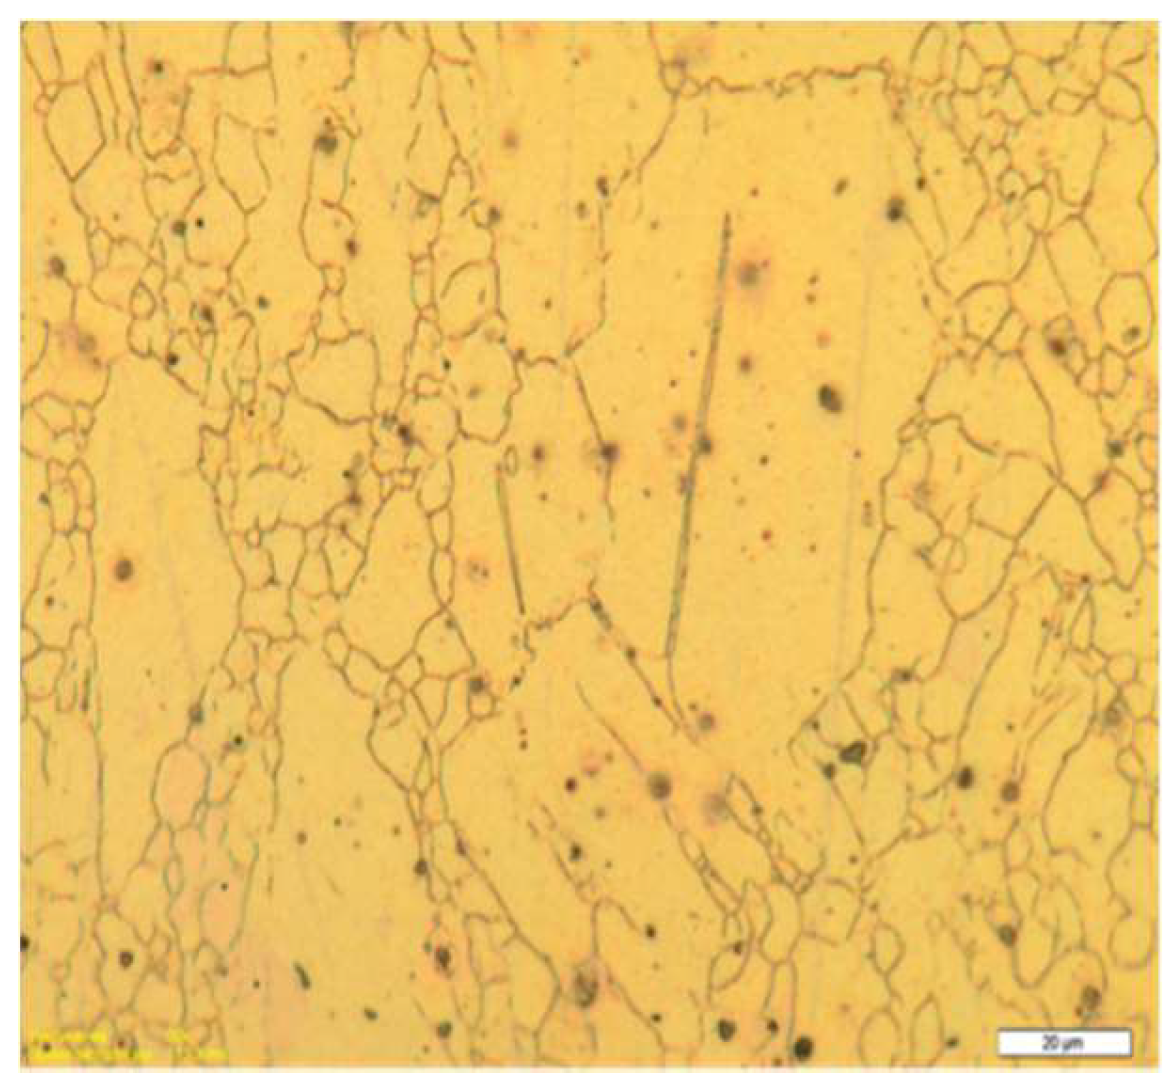
2.2.1. SEM and Optical Microscopy
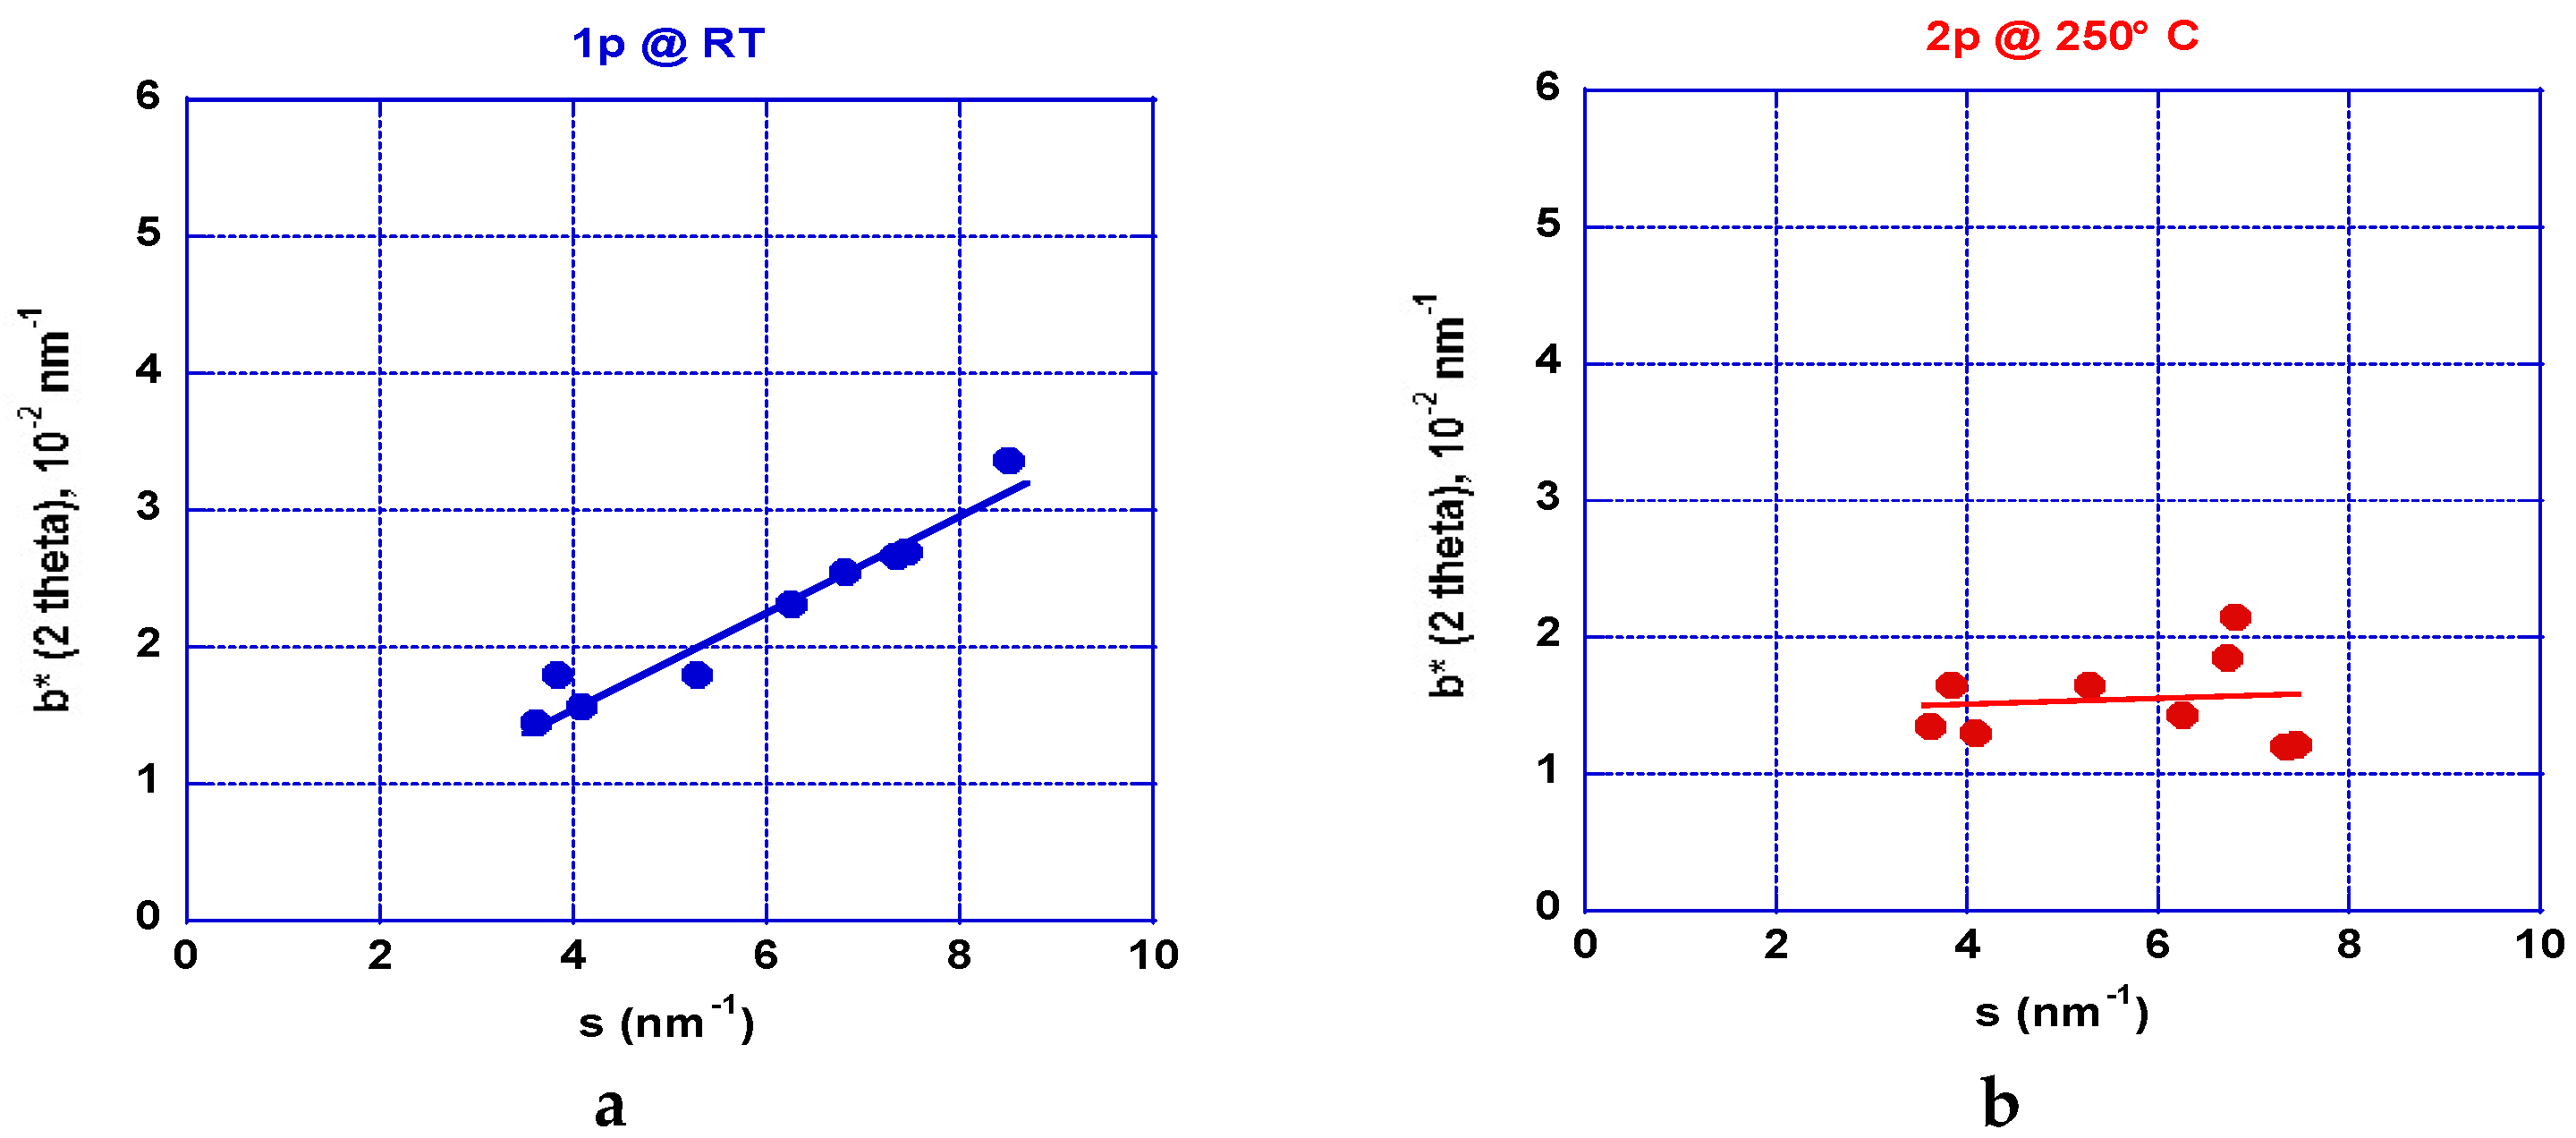
2.2.2. XRD Analyses: Crystallite Size and Stresses Distribution
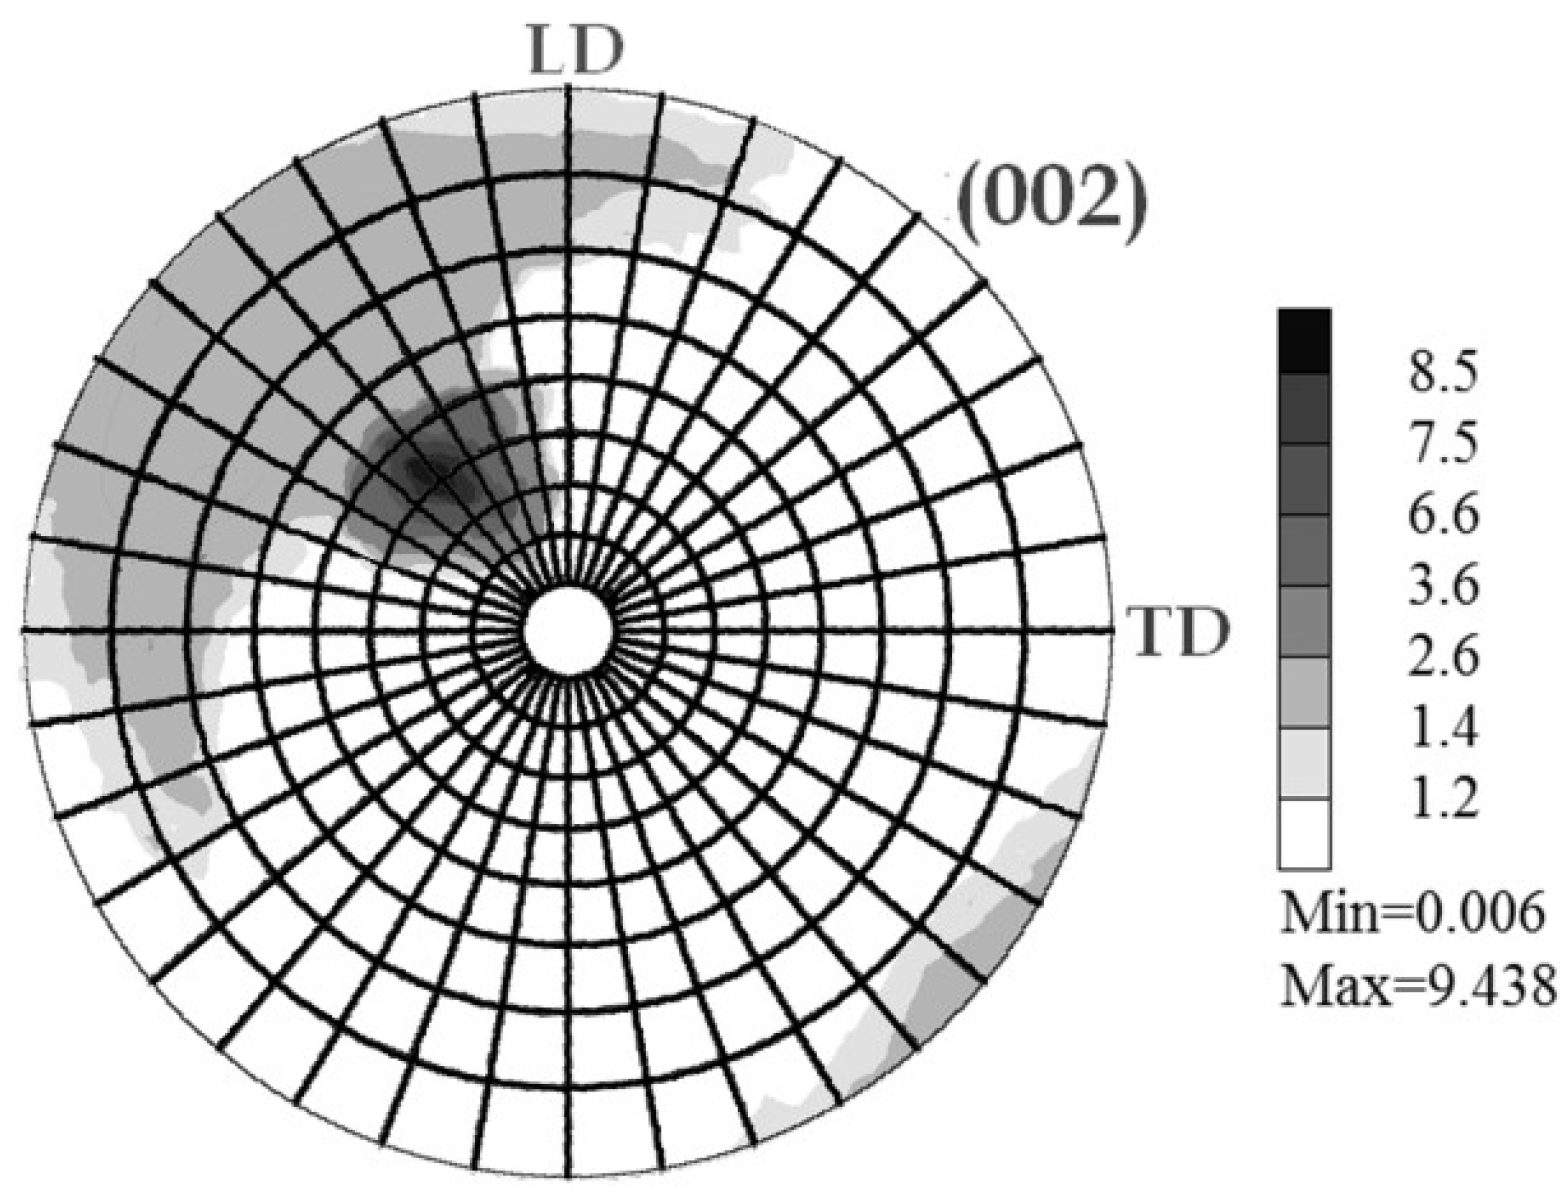
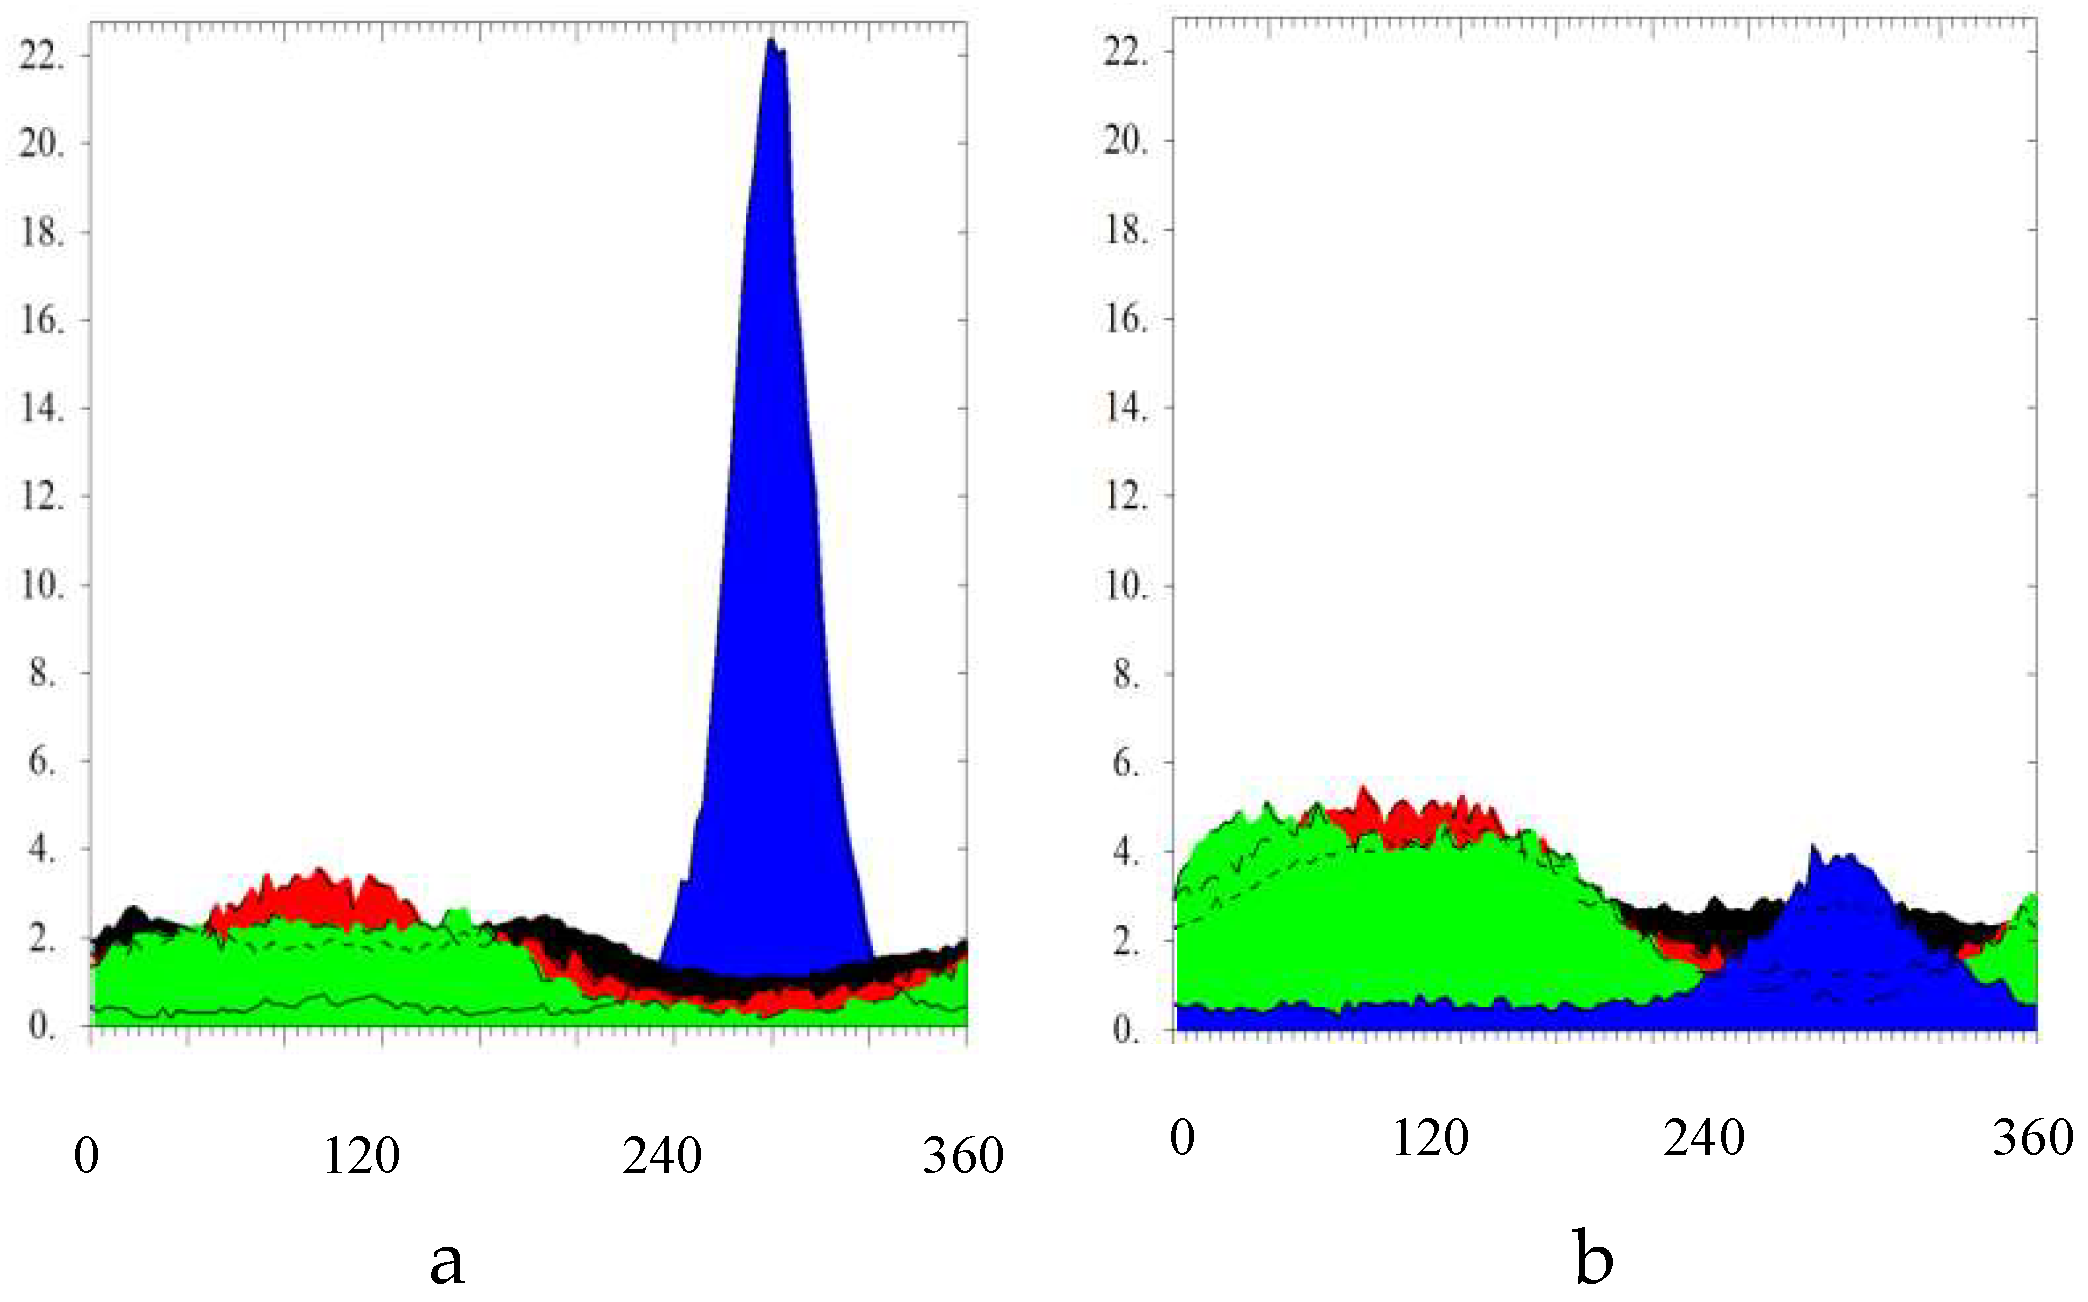
2.2.3. Texture Analysis
2.2.4. Small Angle Neutron Scattering (SANS)
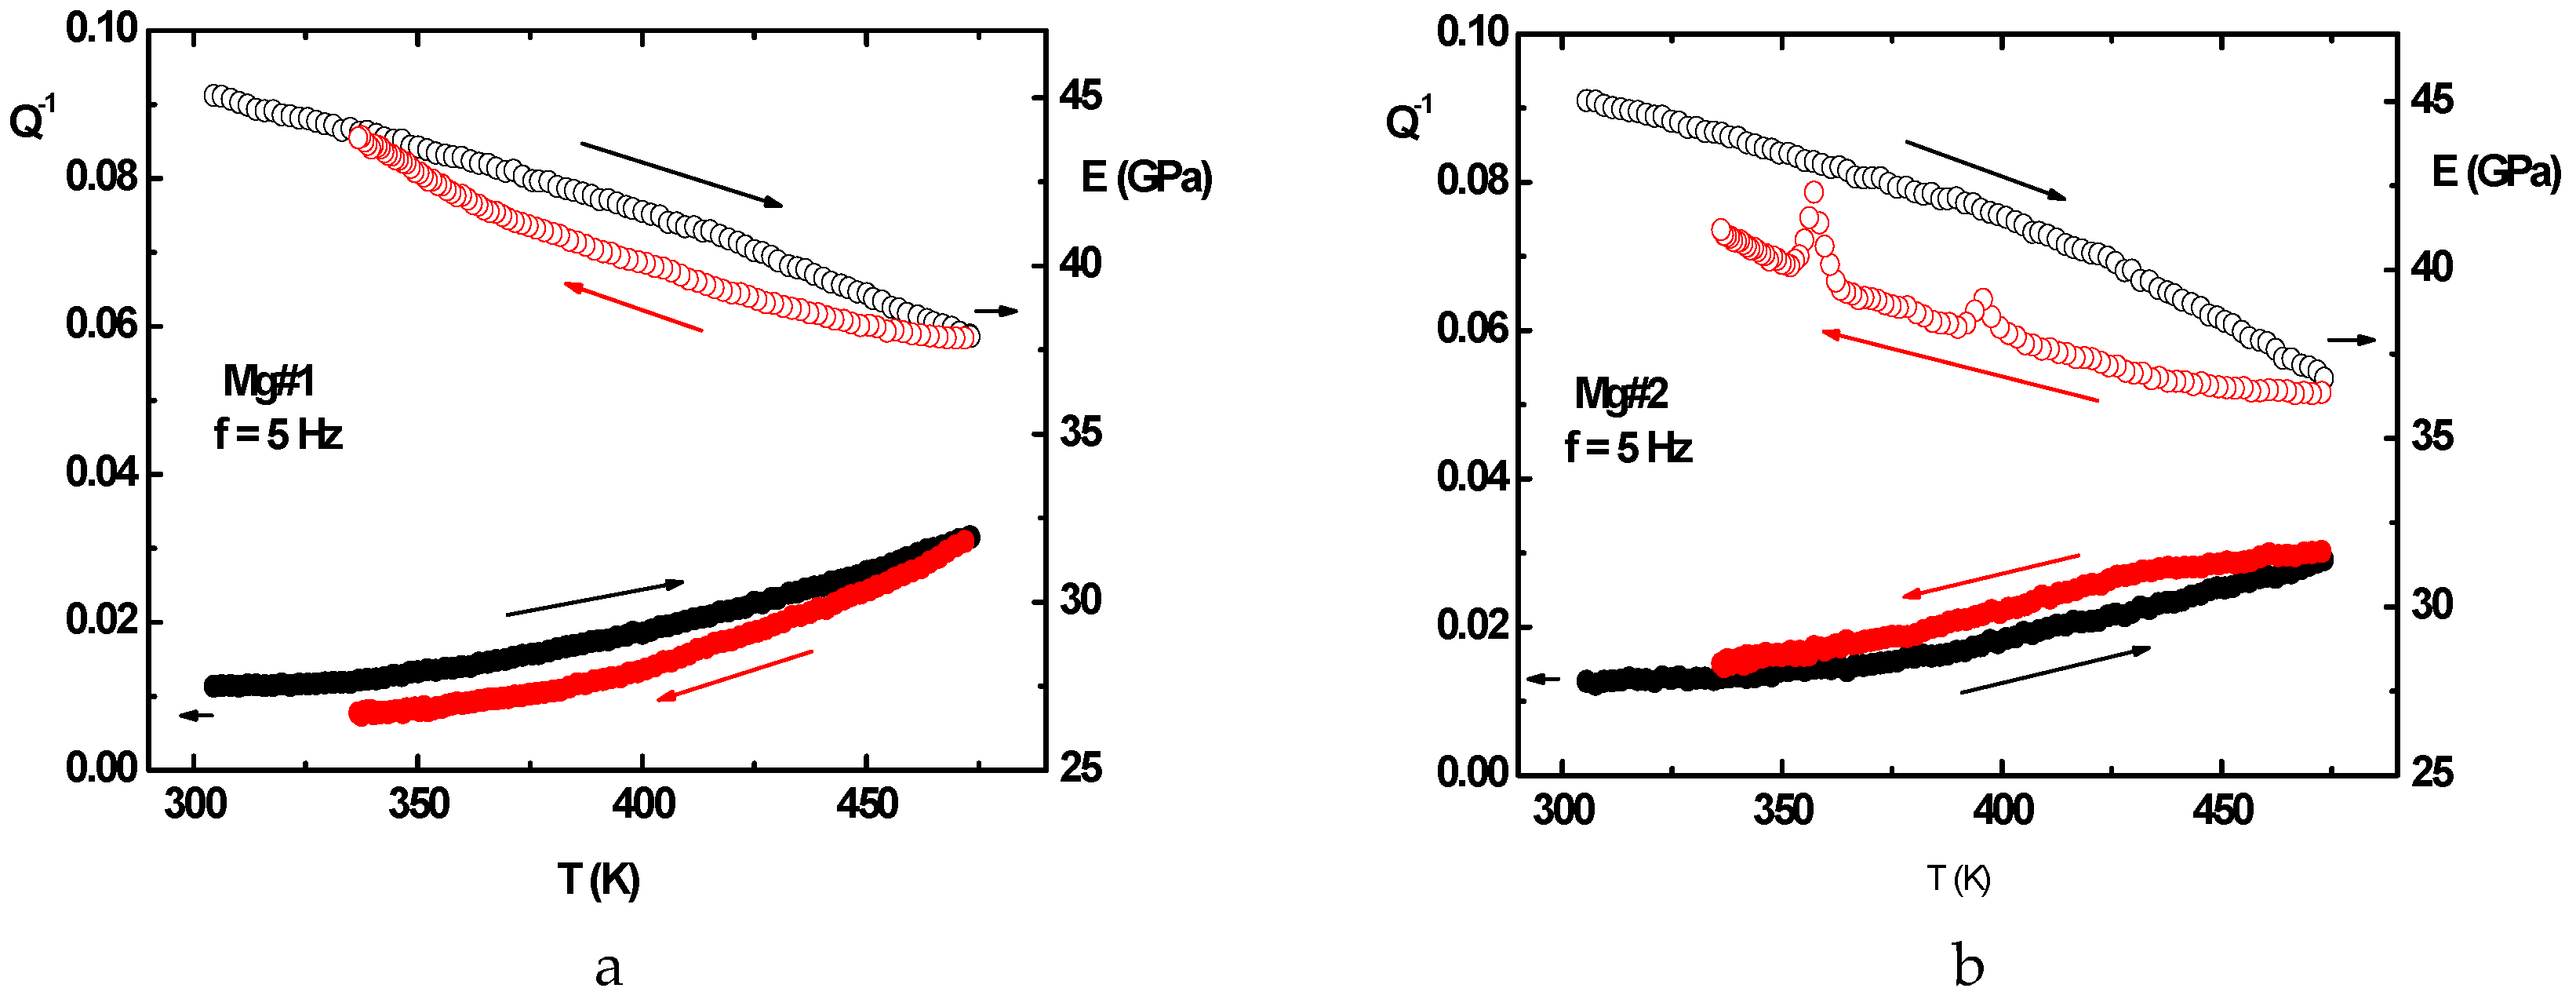
2.2.5. Anelastic Spectroscopy (AS) on Alloys and MgH2 Powders
2.3. Hydrogen Uptake and Kinetics
2.3.1. Route A
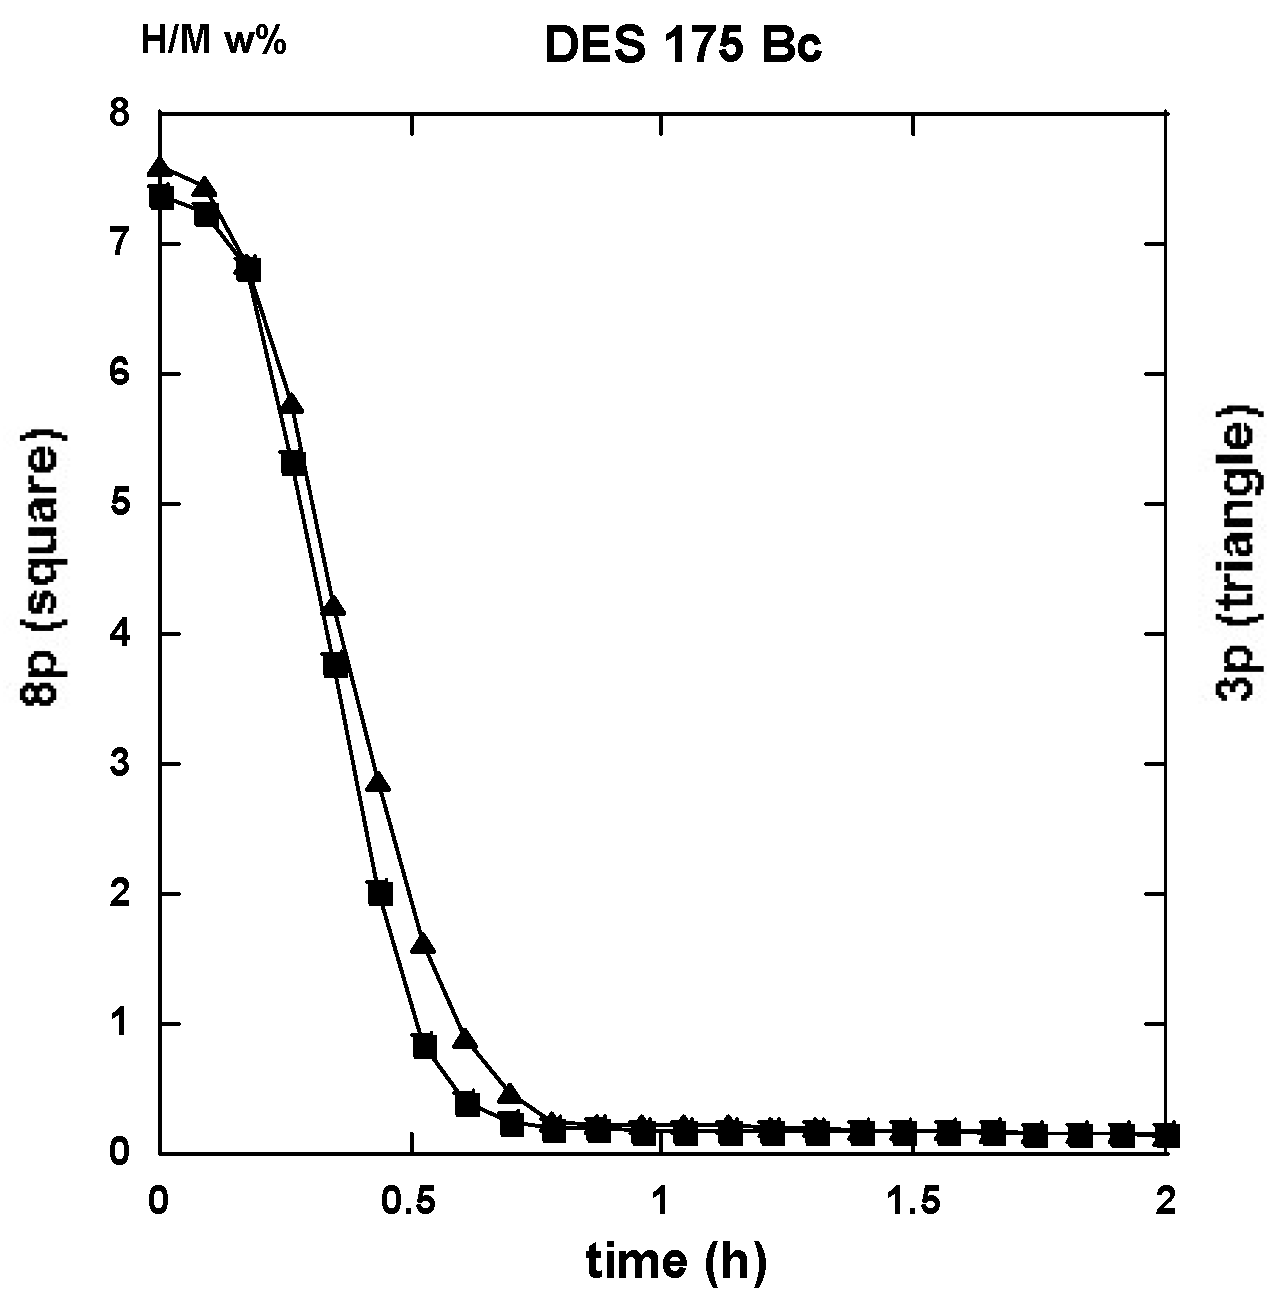
2.3.2. Route BC
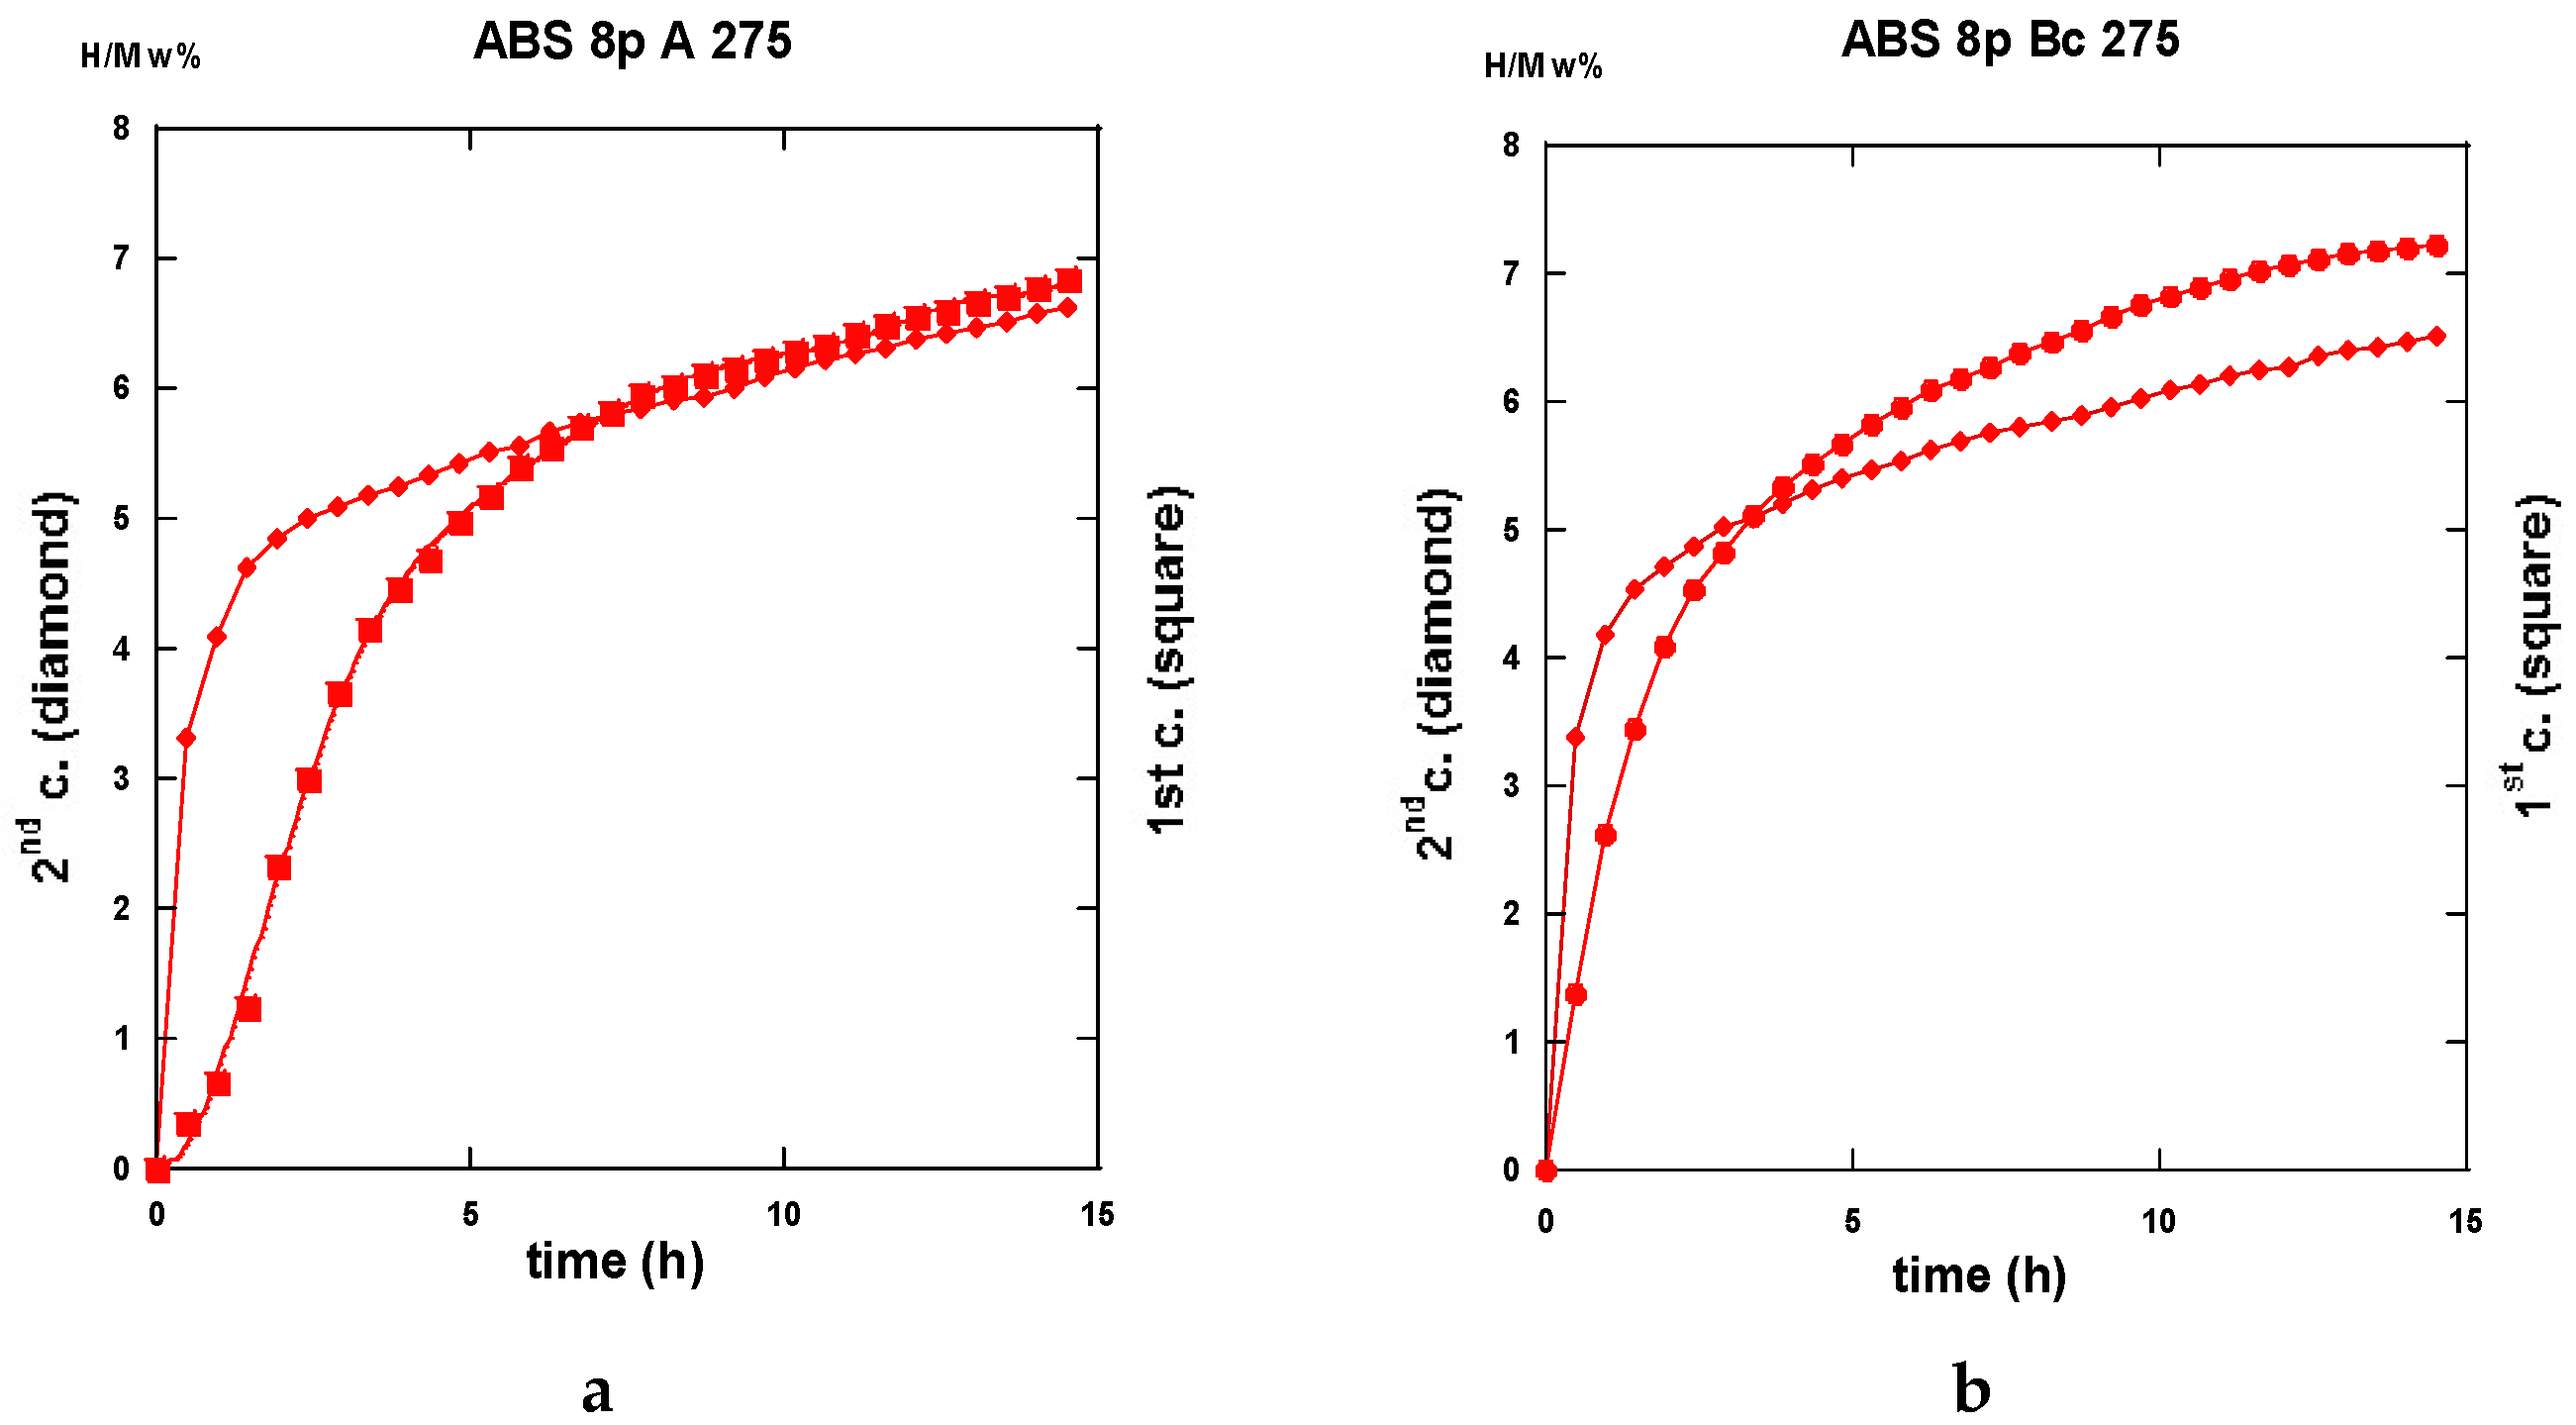
2.3.3. Second Hydrogenation Cycles
2.3.4. Comparisons of Hydrogenation Processes
2.3.5. Interpretation of the Hydrogenation Kinetics
3. Discussion
4. Materials and Methods
5. Conclusions
Author Contributions
Funding
Acknowledgments
Conflicts of Interest
References
- Zehetbauer, M.J.; Valiev, R.Z. Nanomaterials by Severe Plastic Deformation; Wiley-VCH GmbH: Weinheim, Germany, 2004; p. 850. ISBN 3–527–30659-5. [Google Scholar] [CrossRef]
- Kim, H.S.; Estrin, Y. Microstructural modelling of equal channel angular pressing for producing ultrafine grained materials. J. Mater. Process. Technol. 2005, 410–411, 285–289. [Google Scholar] [CrossRef]
- Figueiredo, R.; Langdon, T. Grain refinement and mechanical behavior of a magnesium alloy processed by ECAP. J. Mater. Sci. 2010, 45, 4827–4836. [Google Scholar] [CrossRef]
- Young, J.P.; Askari, H.; Hovanski, Y.; Heiden, M.J.; Field, D.P. Microstructural stability after severe plastic deformation of AZ31 Magnesium. Mater. Charact. 2015, 101, 9–19. [Google Scholar] [CrossRef]
- Yurchenkoa, N.Y.; Stepanova, N.D.; Salishcheva, G.A.; Rokhlinb, L.L.; Rokhlinb, S.V. Effect of multiaxial forging on microstructure and mechanical properties of Mg-0.8Ca alloy. IOP Conf. Ser. Mater. Sci. Eng. 2014, 63, 012075. [Google Scholar] [CrossRef]
- Edalati, K.; Uehiro, R.; Ikeda, Y.; Li, H.W.; Emami, H.; Filinchuk, Y.; Arita, M.; Sauvage, X.; Tanaka, I.; Akiba, E.; et al. Design and synthesis of a magnesium alloy for room temperature hydrogen storage. Acta Mater. 2018, 149, 88–96. [Google Scholar] [CrossRef]
- Huot, J.; Skryabina, N.Y.; Fruchart, D. Application of Severe Plastic Deformation Techniques to Magnesium for Enhanced Hydrogen Sorption Properties. Metals 2012, 2, 329–343. [Google Scholar] [CrossRef]
- Huot, J. Enhancing Hydrogen Storage Properties of Metal Hybrides; Springer Nature Switzerland AG: Basel, Switzerland, 2016; p. 39. ISBN 978-3-319-35107-0. [Google Scholar]
- Estrin, Y.; Vinogradov, A. Extreme grain refinement by severe plastic deformation: A wealth of challenging science. Acta Mater. 2013, 61, 782–817. [Google Scholar] [CrossRef]
- Skripnyuk, V.M.; Rabkin, E.; Estrin, Y.; Lapovok, R. The effect of ball milling and equal channel angular pressing on hydrogen absorption/desorption properties of Mg-4.95 wt% Zn-0.71 wt% Zr (ZK60) alloy. Acta Mater. 2004, 52, 405–414. [Google Scholar] [CrossRef]
- Skripnyuk, V.M.; Rabkin, E.; Estrin, Y.; Lapovok, R. Improving hydrogen storage properties of magnesium based alloys by equal channel angular pressing. Int. J. Hydrogen Energy 2009, 34, 6320–6324. [Google Scholar] [CrossRef]
- Leiva, D.R.; Fruchart, D.; Bacia, M.; Girard, G.; Skryabina, N.; Villela, A.C.S.; Miraglia, S.; dos Santos, D.S.; Botta, W.J. Mg alloys for hydrogen storage processed by SPD. Int. J. Mat. Res. 2009, 100, 1739–1746. [Google Scholar] [CrossRef]
- Krystian, M.; Zehetbauer, M.J.; Kropik, H.; Mingler, B.; Krexner, G. Hydrogen storage properties of bulk nanostructured ZK60 Mg alloy processed by equal channel angular pressing. J. Alloy. Compd. 2011, 509, 449–455. [Google Scholar] [CrossRef]
- Jorge, A.M., Jr.; de Lima, G.F.; Martins Triques, M.R.; Botta, W.J.; Kiminami, C.S.; Nogueira, R.P.; Yavari, A.R.; Langdon, T.G. Correlation between hydrogen storage properties and textures induced in magnesium through ECAP and cold rolling. Int. J. Hydrogen Energy 2014, 39, 3810–3821. [Google Scholar] [CrossRef]
- Huot, J.; Liang, G.; Schulz, R. Mechanically alloyed metal hydride systems. Appl. Phys. 2001, 72, 187–195. [Google Scholar] [CrossRef]
- Hanada, N.; Ichikawa, T.; Fujii, H. Catalytic effect of Ni nanoparticle and Nb oxide on H-desorption properties in MgH2 prepared by ball-milling. J. Alloy. Compd. 2005, 404, 716–719. [Google Scholar] [CrossRef]
- Huot, J.; Swainson, I.; Schulz, R. Phase transformation in magnesium hydride induced by ball milling. Annales de Chimie 2006, 31, 135–144. [Google Scholar] [CrossRef]
- Barkhordarian, G.; Klassen, T.; Bormann, R. Kinetic investigation of the effect of milling time on the hydrogen sorption reaction of magnesium catalyzed with different Nb2O5 contents. J. Alloy. Compd. 2006, 407, 249–255. [Google Scholar] [CrossRef]
- Huot, J.; Ravnsbæk, D.B.; Zhang, J.; Cuevas, F.; Latroche, M.; Jensen, T.R. Mechanochemical synthesis of hydrogen storage materials. Prog. Mater. Sci. 2013, 58, 30–75. [Google Scholar] [CrossRef]
- Lototskyy, M.; Sibanyoni, J.M.; Denys, R.V.; Williams, M.; Pollet, B.G.; Yartys, V.A. Magnesium–carbon hydrogen storage hybrid materials produced by reactive ball milling in hydrogen. Carbon 2013, 57, 146–160. [Google Scholar] [CrossRef]
- Moretto, P.; Zlotea, C.; Dolci, F.; Amieir, A.; Bobet, J.L.; Borgschulte, A.; Chandra, D.; Enoki, H.; de Rango, P.; Fruchart, D.; et al. A Round Robin Test exercise on hydrogen absorption/desorption properties of a magnesium hydride based material. Int. J. Hydrogen Energy 2013, 38, 6704–6717. [Google Scholar] [CrossRef]
- de Rango, P.; Marty, Ph.; Fruchart, D. Integrated with FC H storage systems utilizing magnesium hydride: Experimental studies and modelling. Appl. Phys. A 2016, 122. [Google Scholar] [CrossRef]
- Jehan, M.; Fruchart, D. McPhy-Energy’s proposal for solid state hydrogen storage materials and systems. J. Alloy. Compd. 2013, 580. [Google Scholar] [CrossRef]
- Chaise, A. Etude Expérimentale et Numérique de Réservoirs D’Hydrure de Magnésium. Ph.D. Thesis, Université J. Fourier, Grenoble, France, 19 December 2008. [Google Scholar]
- Segal, V.M. The Method of Material Preparation for Subsequent Working. USSR Patent No 575892, 1977. [Google Scholar]
- Segal, V.M. Plastic Deformation of Crystalline Materials. US Patent 5513512, 1996. [Google Scholar]
- Valiev, R.Z.; Islamgaliev, R.K.; Alexandrov, I.V. Bulk Nanostructured Materials from Severe Plastic Deformation. Prog. Mat. Sci. 2000, 45, 103–189. [Google Scholar] [CrossRef]
- Valiev, R.Z.; Langdon, T.G. Principles of Equal-Channel Angular Pressing as a Processing Tool for Grain Refinement. Progr. Mater. Sci. 2006, 51, 881–981. [Google Scholar] [CrossRef]
- Zrnik, J.; Dobatkin, S.V.; Mamuzic, I. Processing of metals by Severe Plastic Deformation (SPD)–Structure and mechanical properties. Metalurgija 2008, 47, 211–216. [Google Scholar]
- Skryabina, N.Е.; Fruchart, D.; Girard, G.; Miraglia, S.; Pinjugzhanin, V.М.; Leiva, D. Physical principles of nanostructure forming reversible hydrogen absorption alloys. Bull. Perm State Univ. 2010, 1, 91–96. [Google Scholar]
- Kozulyn, A.A.; Skripnyak, V.A.; Krasnoveikin, V.A.; Skripnyak, V.V.; Karavatskii, A.K. An Investigation of Physico-Mechanical Properties of Ultrafine-Grained Magnesium Alloys Subjected to Severe Plastic Deformation. Russ. Phys. J. 2014, 57, 98–104. [Google Scholar] [CrossRef]
- Wang, Y.N.; Huang, J.C. Texture Characteristics and Anisotropic Superplasticity of AZ61 Magnesium Alloy. Mater. Trans. 2003, 44, 2276–2281. [Google Scholar] [CrossRef]
- Muralidhar, A.; Narendranath, S.; Nayaka, H.S. Effect of equal channel angular pressing on AZ31 wrought magnesium alloys. J. Magn. Alloy. 2013, 1, 336–340. [Google Scholar] [CrossRef]
- Svoboda, H.G.; Vago, F. Superplastic behavior of AZ31 processed by ECAP. Proc. Mater. Sci. 2015, 590–598. [Google Scholar] [CrossRef]
- Skryabina, N.E.; Aptukov, V.N.; Romanov, P.V.; Fruchart, D. Impact of equal-channel angular pressing on mechanical behavior and microstructure of magnesium alloy. PNRPU Mech. Bull. 2014, 113–128. [Google Scholar] [CrossRef]
- Girard, G. Etude de Nouvelles Formes de Matériaux Basés sur le Magnésium Pour le Stockage Réversible de Grandes Quantités D’hydrogène–Effets D’addition D’éléments de Transition. Ph.D. Thesis, Université J. Fourier, Grenoble, France, 19 October 2009. [Google Scholar]
- Skryabina, N.Е.; Pinyugzhanin, V.М.; Fruchart, D.; Girard, G.; Miraglia, S. Deformation refinement of AZ31 structure during equal channel angular pressing. Bull. Perm State Univ. Phys. 2011, 1, 82–87. [Google Scholar]
- Skryabina, N.E.; Aptukov, V.N.; Romanov, P.V.; Fruchart, D. A grid method quantifying deformed Mg-alloys by equal-channel angular pressing. PNRPU Mech. Bull. 2015, 3, 133–145. [Google Scholar] [CrossRef]
- Yoon, S.C.; Nagasekhar, A.V.; Yoo, J.H.; Abd El Aal, M.I.; Vaseghi, M.; Kim, H.S. Deformation Characteristics Evaluation of Modified Equal Channel Angular Pressing Processes. Mater. Trans. 2010, 51, 46–50. [Google Scholar] [CrossRef]
- Kachanov, L.M. Fundamentals of the Theory of Plasticity; Nauka: Moscow, Russia, 1969; p. 420. [Google Scholar]
- Engel, U.; Rosochowski, A.; Geiβdörfer, S.; Olejnik, L. Microforming and Nanomaterials. In Advances in Material Forming: Esaform 10 on; Chinesta, F., Cueto, E., Eds.; Springer: Paris, France, 2007; pp. 99–124. ISBN 978-2-287-72142-7. [Google Scholar]
- Robson, J. Design of High Strength Wrought Magnesium Alloys, Engin. Available online: darealloys.org/wp-content/uploads/2016/10/High-Strength-MgAlloys-Robsonv2.pdf (accessed on 19 October 2018).
- Azushima, A.; Kopp, R.; Korhonen, A.; Yang, D.Y.; Micari, F.; Lahoti, G.D.; Groche, P.; Yanagimoto, J.; Tsuji, N.; Rosochowski, A.; et al. Severe Plastic Deformation (SPD) processes for metals. CIRP Ann.-Manuf. Ann.-Manuf. 2008, 57, 716–735. [Google Scholar] [CrossRef]
- Williamson, G.K.; Hall, W.H. X-ray line broadening from filed aluminium and wolfram. Acta Metall. 1953, 1, 22–31. [Google Scholar] [CrossRef]
- SANS, Institut Laue Langevin, Grenoble, France: Instrument Layout. Available online: https://www.ill.eu/users/instruments/instruments-list/d11/description/instrument-layout/ (accessed on 15 October 2018).
- Nallet, F. Introduction à la diffusion aux petits angles. Collection SFN 1 EDP Sci. 2010, 17–42. [Google Scholar] [CrossRef]
- Klyukin, K.; Shelyapina, M.; Fruchart, D. DFT calculations of hydrogen diffusion and phase transformations in magnesium. J. Alloy. Compd. 2015, 644, 371–377. [Google Scholar] [CrossRef]
- Corey, R.L.; Shane, D.T.; Bowman, R.C., Jr.; Conradi, M.S. Atomic motions in LibH4 by NMR. J. Phys. Chem. C 2008, 112, 18706–18710. [Google Scholar] [CrossRef]
- Cantelli, R. The roots and the future of mechanical spectroscopy. Mat. Sci. Eng. 2006, 442, 5–20. [Google Scholar] [CrossRef]
- de Almeida, L.H.; Niemeyer, T.C.; Pires, K.C.C.; Grandini, C.R.; Fonzar-Pintao, C.A.; Florêncio, O. Anelastic relaxation processes due oxygen in Nb–3.1 at.% Ti alloys. Mater. Sci. Eng. A 2004, 370, 96–99. [Google Scholar] [CrossRef]
- Trojanova, Z.; Weidenfeller, B.; Lukac, P.; Riehemann, W.; Stank, M. Anelastic properties of nanocrystalline magnesium. In Nanomaterials by Severe Plastic Deformation; Zehetbauer, M.J., Valiev, R.Z., Eds.; Wiley-VCH GmbH: Weinheim, Germany, 2004; pp. 413–419. ISBN 3-527-30659-5. [Google Scholar]
- Hiura, F. Latent Hardening in Pure Magnesium Single Crystals under Uniaxial Deformation at 298 K. Ph.D. Thesis, McMaster University, Hamilton, ON, Canada, 18 January 2010. [Google Scholar]
- Hu, X.S.; Zhang, Y.K.; Zheng, M.Y.; Wu, K. A study of damping capacities in pure Mg and Mg–Ni alloys. Scripta Mater. 2005, 52, 1141–1145. [Google Scholar] [CrossRef]
- Pang, Y.; Li, Q. A review on kinetic models and corresponding analysis methods for hydrogen storage materials. Int. J. Hydrogen Energy 2016, 41, 18072–18087. [Google Scholar] [CrossRef]
- Nachev, S. Evolution Microstructurale et Comportement Mécanique des Composites à Base de MgH2 au Cours des Cycles D’hydruration. Ph.D. Thesis, Université Grenoble-Alpes, Grenoble, France, 5 October 2015. [Google Scholar]
- Wang, Y.N.; Huang, J.C. Texture analysis in hexagonal materials. Mater. Chem. Phy. 2003, 81, 11–26. [Google Scholar] [CrossRef]
- Zhong, Z.Y.; Saka, H.; Kim, T.H.; Holm, E.A.; Han, Y.F.; Xie, X.S. Grain Refinement and Texture Evolution in AZ31 Alloy during ECAP Process and Their Effects on Mechanical Properties. Mater. Sci. Forum 2005, 475, 549–554. [Google Scholar]
- Nachev, S.; de Rango, P.; Skryabina, N.; Skachkov, A.; Aptukov, V.N.; Fruchart, D.; Marty, P. Mechanical behavior of highly reactive nanostructured MgH2. Int. J. Hydrogen Energy 2015, 40, 17065–17074. [Google Scholar] [CrossRef]
Sample Availability: Samples of the compounds are not available from the authors. |


| Samples | 1st Absorption | 2nd Absorption | ||||||
|---|---|---|---|---|---|---|---|---|
| JMAK | ξL | Jander | GB | JMAK | ξL | Jander | GB | |
| 3pA175 | - | 0.21 | 0.011 | 0.008 | X | X | X | X |
| 3pBc175 | 0.192 | 0.41 | 0.033 | 0.019 | - | 0.76 | 0.012 | 0.007 |
| 3pA275 | 0.098 | 0.42 | 0.014 | 0.009 | X | X | X | X |
| 3pBc275 | 0.361 | 0.58 | 0.037 | 0.019 | 0.409 | 0.75 | 0.011 | 0.006 |
| 8pA175 | 0.287 | 0.59 | - | - | X | X | X | X |
| 8pBc175 | 0.348 | 0.78 | 0.022 | 0.011 | X | X | X | X |
| 8pA275 | 0.382 | 0.78 | 0.019 | 0.010 | 0.600 | 0.61 | 0.012 | 0.007 |
| 8pBc275 | 0.468 | 0.83 | 0.033 | 0.015 | 0.658 | 0.55 | 0.012 | 0.007 |
| Samples | 1st Desorption | 2nd Desorption | ||||||
|---|---|---|---|---|---|---|---|---|
| Angle of Slope (Degrees) | Initial Time (min) | End Time (min) | Desorbed H/Hmax (%) | Angle of Slope (Degrees) | Initial Time (min) | End Time (min) | Desorbed H/Hmax (%) | |
| 3pA175 | 75 | 9.5 | 49 | 0.92 | X | X | X | X |
| 3pBc175 | 76.5 | 10.5 | 31 | 0.85 | 78 | 11 | 40 | 0.90 |
| 3pA275 | 76 | 19 | 48 | 0.98 | X | X | X | X |
| 3pBc275 | 74.5 | 16.5 | 53 | 0.98 | 79 | 9 | 32 | 0.88 |
| 8pA175 | 79 | 6 | 34 | 0.98 | X | X | X | X |
| 8pBc175 | 80 | 9.5 | 33.5 | 0.94 | X | X | X | X |
| 8pA275 | 77.5 | 9.5 | 21 | 0.98 | 81 | 7 | 29 | 0.90 |
| 8pBc275 | 81 | 5.5 | 18 | 0.99 | 82 | 8 | 29 | 0.92 |
© 2018 by the authors. Licensee MDPI, Basel, Switzerland. This article is an open access article distributed under the terms and conditions of the Creative Commons Attribution (CC BY) license (http://creativecommons.org/licenses/by/4.0/).
Share and Cite
Skryabina, N.; Aptukov, V.; Romanov, P.; Fruchart, D.; De Rango, P.; Girard, G.; Grandini, C.; Sandim, H.; Huot, J.; Lang, J.; et al. Microstructure Optimization of Mg-Alloys by the ECAP Process Including Numerical Simulation, SPD Treatments, Characterization, and Hydrogen Sorption Properties. Molecules 2019, 24, 89. https://doi.org/10.3390/molecules24010089
Skryabina N, Aptukov V, Romanov P, Fruchart D, De Rango P, Girard G, Grandini C, Sandim H, Huot J, Lang J, et al. Microstructure Optimization of Mg-Alloys by the ECAP Process Including Numerical Simulation, SPD Treatments, Characterization, and Hydrogen Sorption Properties. Molecules. 2019; 24(1):89. https://doi.org/10.3390/molecules24010089
Chicago/Turabian StyleSkryabina, Nataliya, Valery Aptukov, Petr Romanov, Daniel Fruchart, Patricia De Rango, Gregory Girard, Carlos Grandini, Hugo Sandim, Jacques Huot, Julien Lang, and et al. 2019. "Microstructure Optimization of Mg-Alloys by the ECAP Process Including Numerical Simulation, SPD Treatments, Characterization, and Hydrogen Sorption Properties" Molecules 24, no. 1: 89. https://doi.org/10.3390/molecules24010089
APA StyleSkryabina, N., Aptukov, V., Romanov, P., Fruchart, D., De Rango, P., Girard, G., Grandini, C., Sandim, H., Huot, J., Lang, J., Cantelli, R., & Leardini, F. (2019). Microstructure Optimization of Mg-Alloys by the ECAP Process Including Numerical Simulation, SPD Treatments, Characterization, and Hydrogen Sorption Properties. Molecules, 24(1), 89. https://doi.org/10.3390/molecules24010089