Article

Identification and Pharmacokinetic Studies on Complanatuside and Its Major Metabolites in Rats by UHPLC-Q-TOF-MS/MS and LC-MS/MS

Institute of Clinical Pharmacology, Guangzhou University of Chinese Medicine, No. 12 Jichang Rd, Guangzhou 510405, China
*
Authors to whom correspondence should be addressed.
Molecules 2019, 24(1), 71; https://doi.org/10.3390/molecules24010071
Submission received: 10 December 2018 / Revised: 20 December 2018 / Accepted: 23 December 2018 / Published: 25 December 2018

Abstract

:
The metabolic and pharmacokinetic studies on complanatuside, a quality marker of a Chinese materia medicatonic, Semen Astragali Complanati, were carried out. The UHPLC-Q-TOF/MS (ultra-high performance liquid chromatography coupled with electrospray ionization tandem quadrupole-time-of-flight mass spectrometry) method was applied to identify the metabolites of complanatuside in rat plasma, bile, stool, and urine after oral administration at the dosage of 72 mg/kg. Up to 34 metabolites (parent, 2 metabolites of the parent drug, and 31 metabolites of the degradation products) were observed, including processes of demethylation, hydroxylation, glucuronidation, sulfonation, and dehydration. The results indicated glucuronidation and sulfonation as major metabolic pathways of complanatuside in vivo. Meanwhile, a HPLC-MS method to quantify complanatuside and its two major metabolites—rhamnocitrin 3-O-β-glc and rhamnocitrin—in rat plasma for the pharmacokinetic analysis was developed and validated. The Tmax (time to reach the maximum drug concentration) of the above three compounds were 1 h, 3 h, and 5.3 h, respectively, while the Cmax (maximum plasma concentrations)were 119.15 ng/mL, 111.64 ng/mL, and 1122.18 ng/mL, and AUC(0-t) (area under the plasma concentration-time curve) was 143.52 µg/L·h, 381.73 µg/L·h, and 6540.14 µg/L·h, accordingly. The pharmacokinetic characteristics of complanatuside and its two metabolites suggested that complanatuside rapidly metabolized in vivo, while its metabolites—rhamnocitrin—was the main existent form in rat plasma after oral administration. The results of intracorporal processes, existing forms, and pharmacokinetic characteristics of complanatuside in rats supported its low bioavailability.

Graphical Abstract

1. Introduction

Flavonoids, one of the three most bioactive chemical components (saponins, alkaloids, and flavonoids) in traditional Chinese medicine, are abundant in plants. Thanks to their unique molecular structures, flavonoids have extensive pharmacological effects; for instance, radio-protection [1,2], hepato-protection [3], anti-oxidant [4], anti-hypertension [5], anti-inflammation [6], and anti-aging [7,8] properties. Usually, flavonoids mainly exist as glycosides in plants [9,10]. Previous pharmacokinetic investigations on flavonoids indicate that almost all of them are not absorbed in the small intestines with their prototypes [11], which is consistent with their low bioavailability [12]. Further research on their intracorporal processes reveal that flavonoids have multifarious metabolites in vivo [13], hinting that the metabolites may be the crucial components responsible for the efficacy or safety of their prototypes. Meanwhile, numerous studies have shown that flavonoids and their metabolites, such as flavonoid polyphenols, are capable of scavenging oxygen radicals, and have anti-inflammatory and other biological activities [14,15,16,17]. Therefore, it may be an efficient approach for clarifying the true effective ingredient and their mechanisms by analyzing the metabolites and metabolic behaviors of flavonoids in vivo.
Complanatuside, comprised of a rhamnocitrin and two glucoses at C-3 and C-4′, respectively, exists in Semen Astragali Complanati, a commonly used traditional Chinese medicine tonic that originated from the dried seeds of Astragalus Complanatus R. Br. [18], and functions as a chemical marker for quality control of the drug [19]. A previous pharmacokinetic study on it [20] shows its Tmax (time to reach the maximum drug concentration) at 1.08 h, Cmax (maximum plasma concentration) of 110.8 ng/mL, and AUC0-t (area under the plasma concentration-time curve) of 566.0 ng h/mL at a dosage of 30 mg/kg after oral administration. The above results suggest that complanatuside metabolized rapidly with lower absorption in rats. Furthermore, rhamnocitrin 3-O-β-glc (RNG) and rhamnocitrin (RNC), the degradation products of it, possess evident anti-oxidant [21], anti-inflammatory, and anti-proliferative activities [22]. Thus, complanatuside may act as a pro-drug, and plays pharmacological effects through its metabolites. However, no research on systematic metabolic profiles and pharmacokinetic characteristics of complanatuside and its main metabolites have been reported till now.
Recently, the metabolic profiles based on ultra-high performance liquid chromatography coupled with electrospray ionization tandem quadrupole/time of flight mass spectrometry (UHPLC-Q-TOF/MS and LC-MS/MS), have been demonstrated to be popular approaches for metabolite identification and pharmacokinetic studies of natural products [23,24] with several advantages, such as high sensitivity and good selectivity, and widely applied for the metabolism of flavonoids [25]. As part of our series of studies on bioactivities and pharmacological mechanisms of natural flavonoids, a systemic metabolic profile of complanatuside in rat plasma, bile, stool, and urine was analyzed by UHPLC-Q-TOF/MS. Moreover, a sensitive and rapid LC-MS/MS method was established to simultaneously determine the concentrations of complanatuside together with its two significant metabolites in rat plasma in the present study.

2. Results

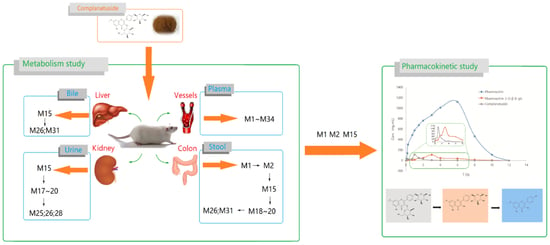
2.1. Metabolites Study

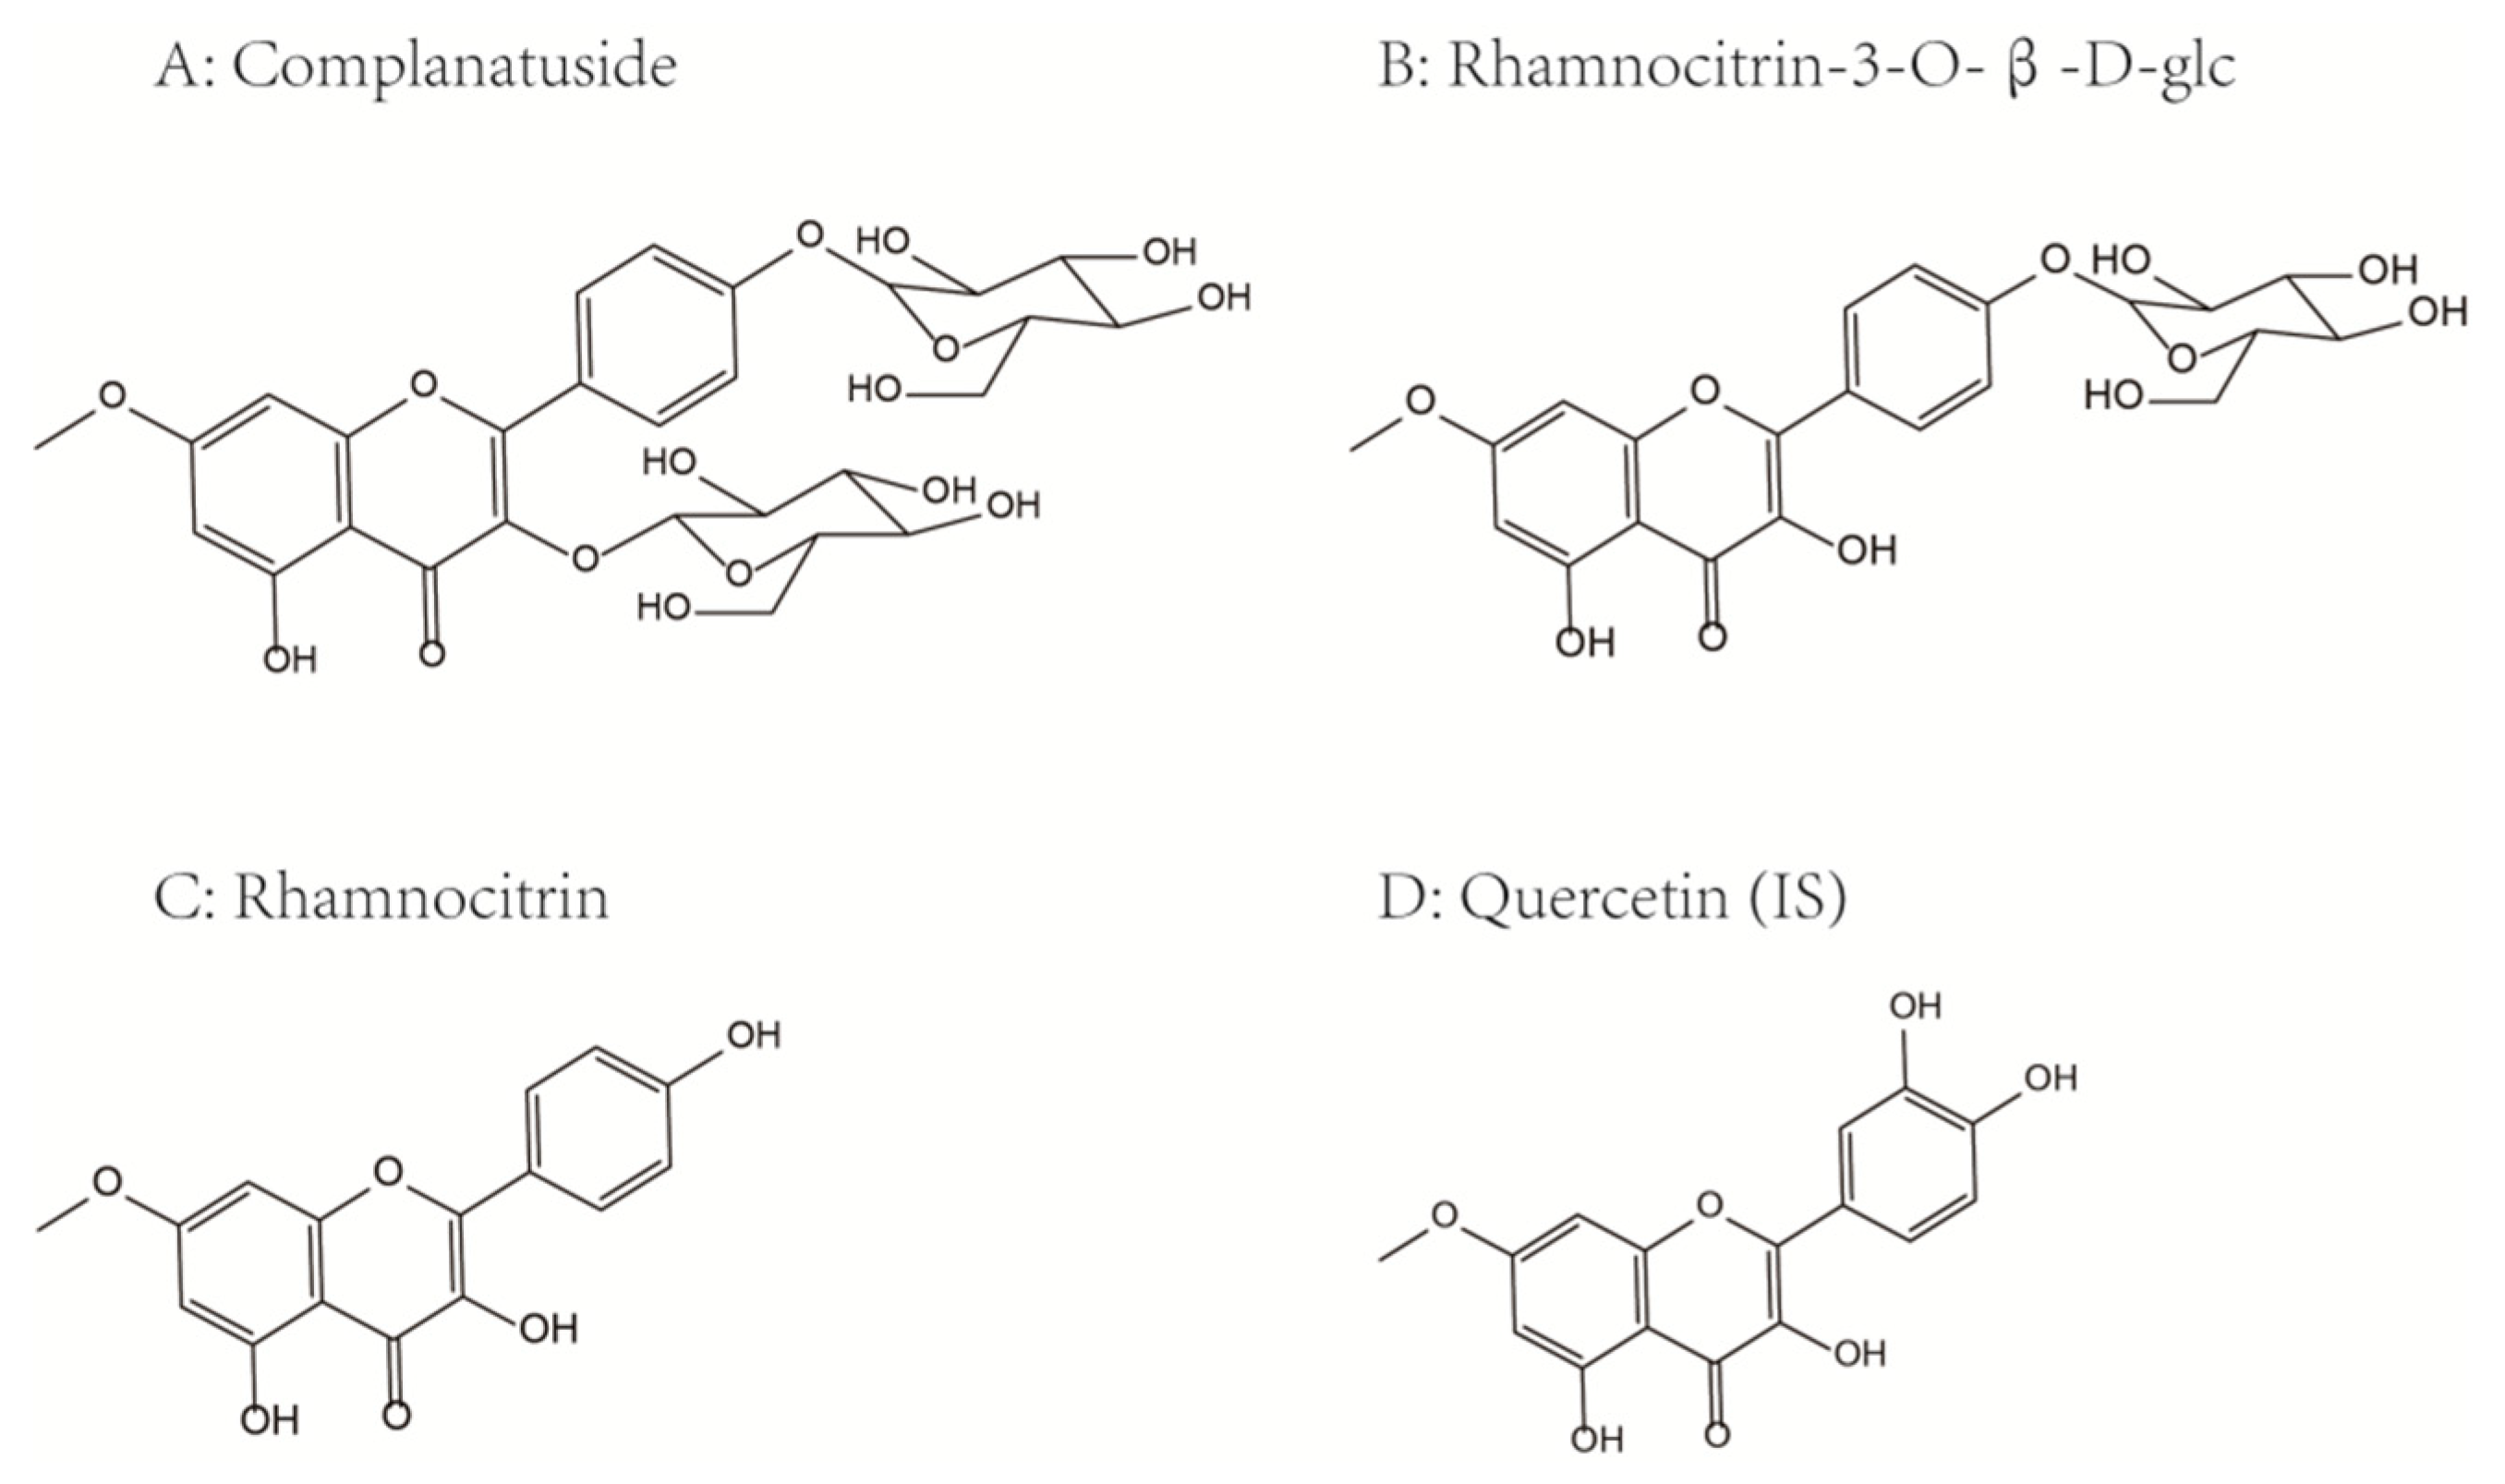
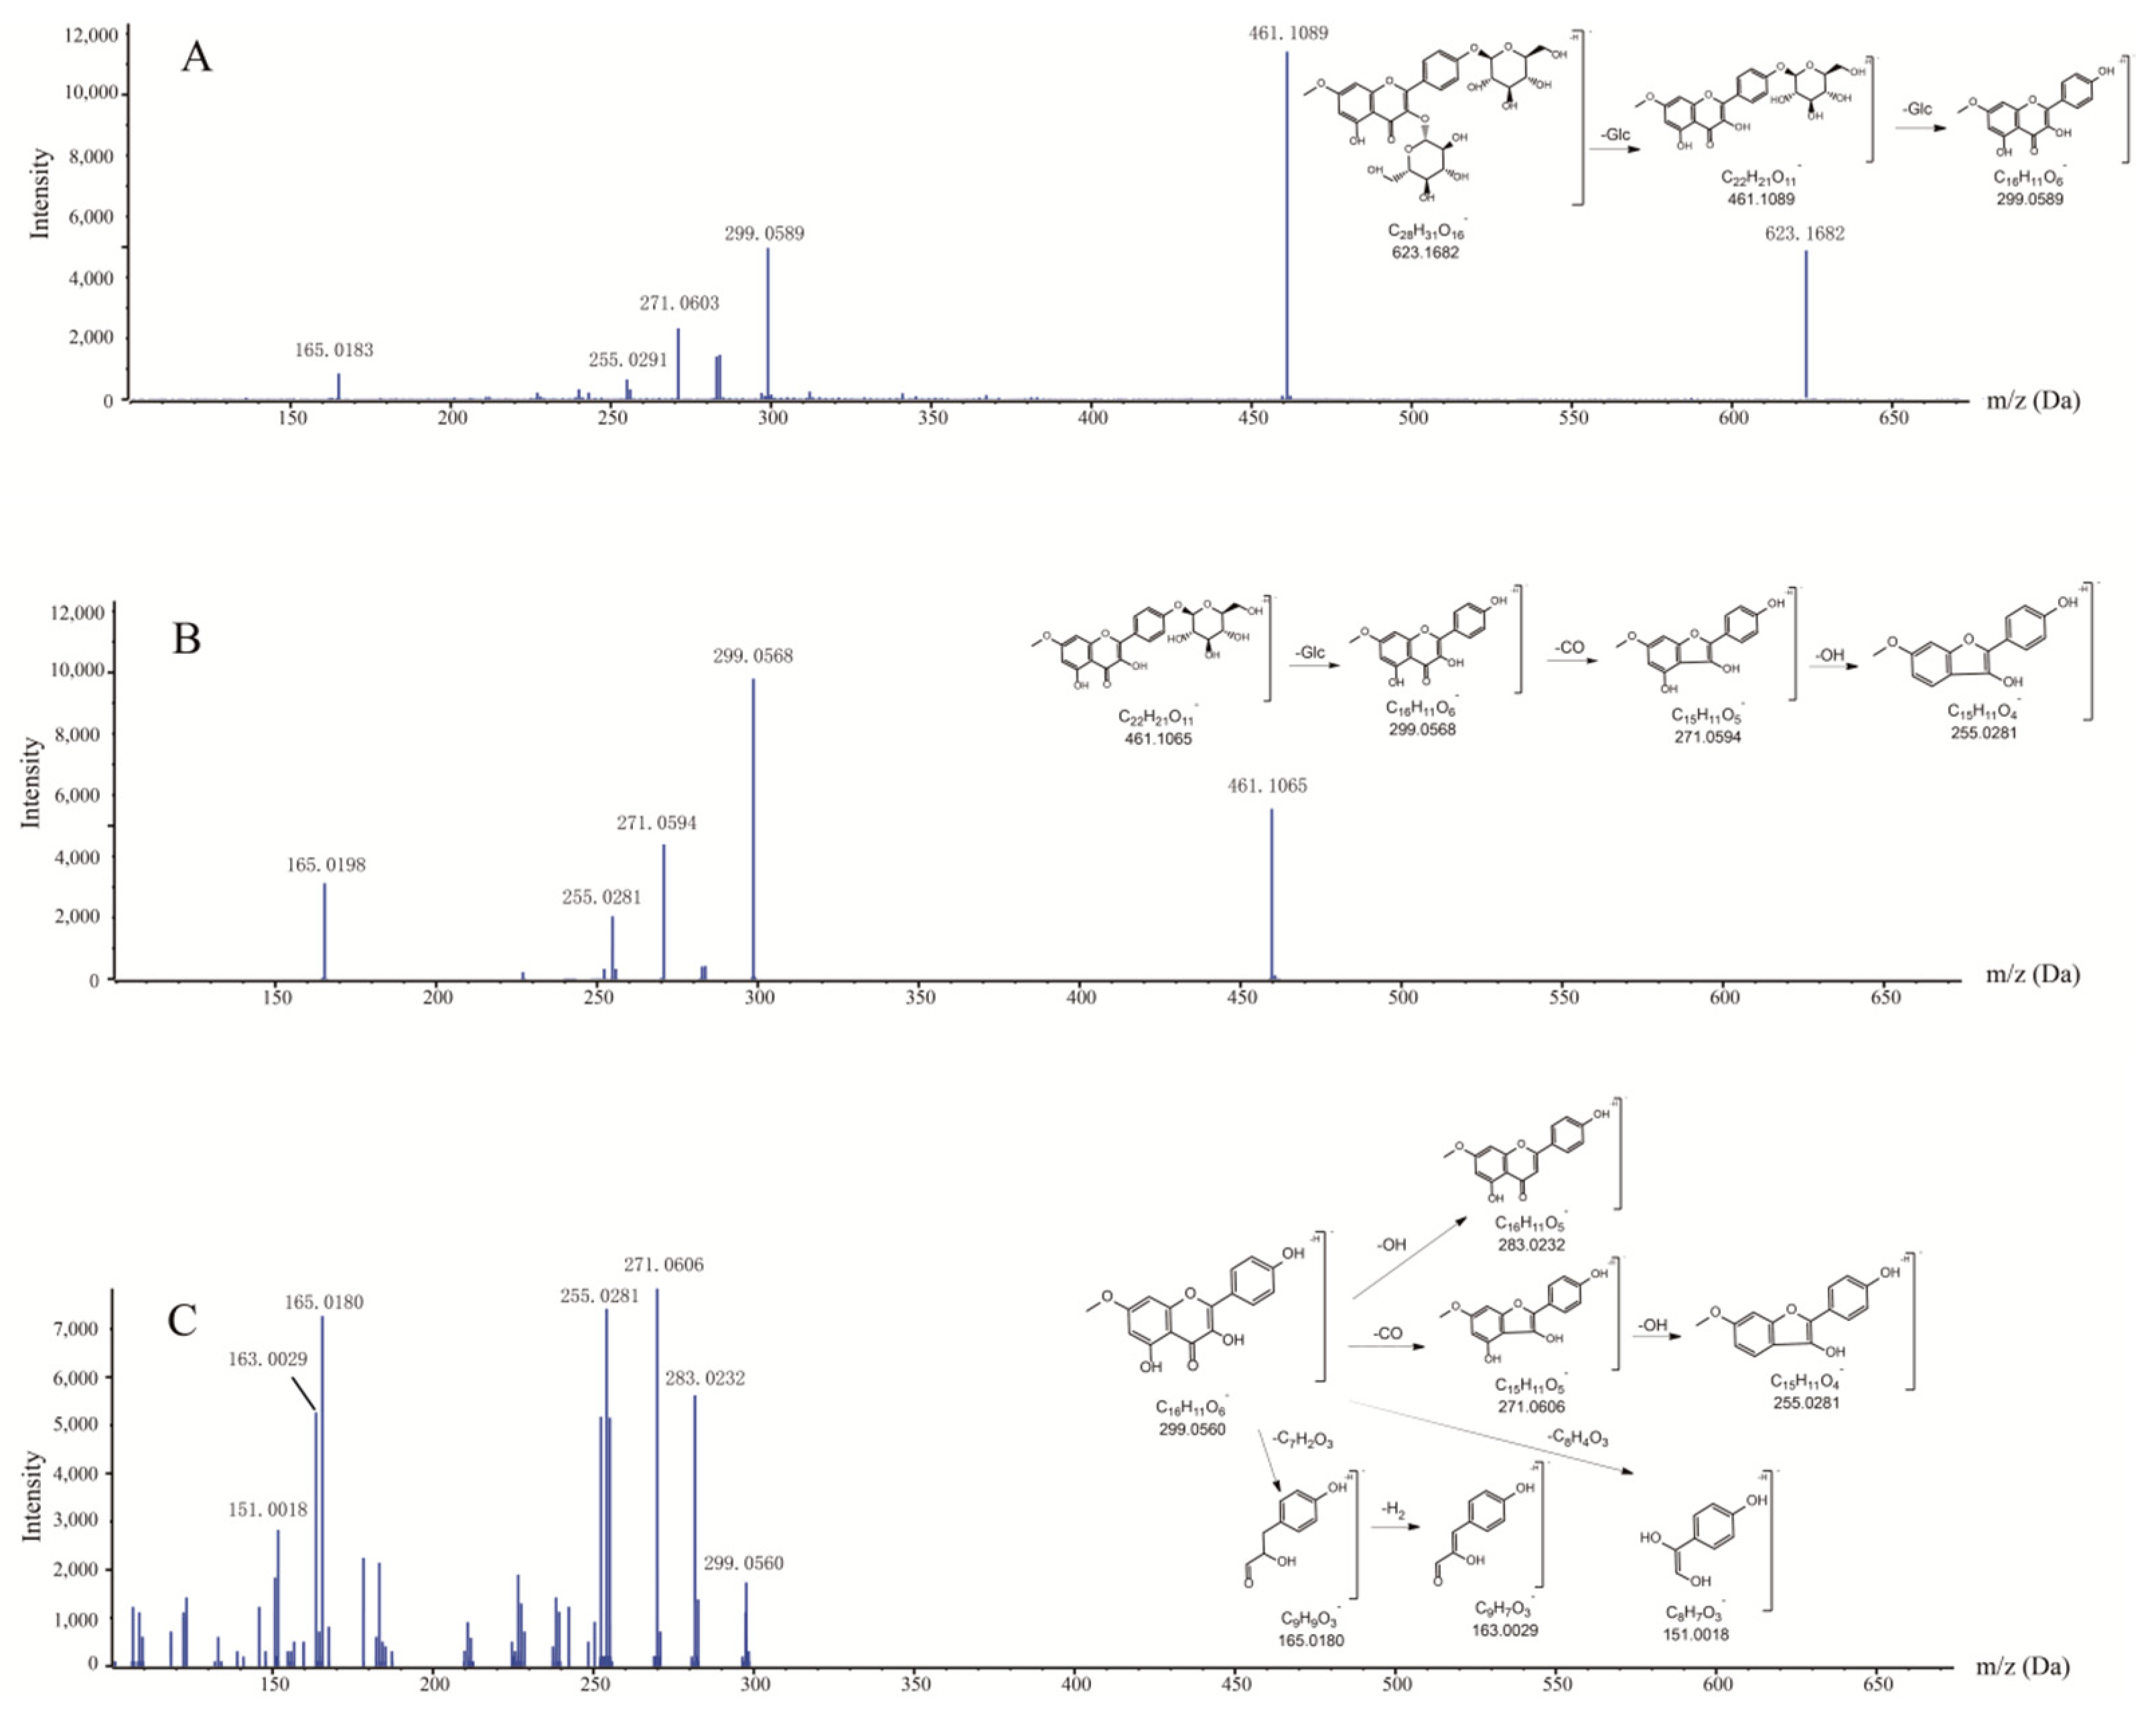
2.1.1. Fragmentation Studies of Complanatuside Standard

Metabolite identification using the UHPLC-Q-TOF-MS/MS method requires a comprehensive understanding of the fragmentation behaviors of the parent compound for reference. In this study, solutions of complanatuside, rhamnocitrin 3-O-β-glc, and rhamnocitrin prepared in 50% acetonitrile–water were used for the fragmentation pattern study, which is helpful in metabolite characterizations. Complanatuside (m/z 623.1682) produced ions at m/z 461.1089 (C22H21O11) by loss of the Glu moiety, which then produced ions at m/z 299.0589 (C16H11O6) by loss of the Glu moiety again, as shown in Figure 1A. For rhamnocitrin 3-O-β-glc moiety (m/z 461.1065) as shown in Figure 1B, fragment ions at 299.0568 (C16H11O6) were formed from the loss of the Glu moiety. The rhamnocitrin moiety produced ions at m/z 271.0594 (C15H11O5) and m/z 255.0281 (C15H11O4) through the loss of CO and OH, respectively. Similarly, rhamnocitrin (m/z 299.0560) yielded a product ion at 283.0232 (C16H11O5), which was probably due to the loss of OH moiety, as shown in Figure 1C. Meanwhile, the rhamnocitrin moiety also produced ions at m/z 271.0606 (C15H11O5) and m/z 255.0281 (C15H11O4) through the loss of CO and OH, respectively. Besides, the rhamnocitrin also produced ions at m/z 165.0180 (C9H9O3) and m/z 151.0018 (C8H7O3) via loss of C7H2O3 and C8H4O3 moiety, respectively.

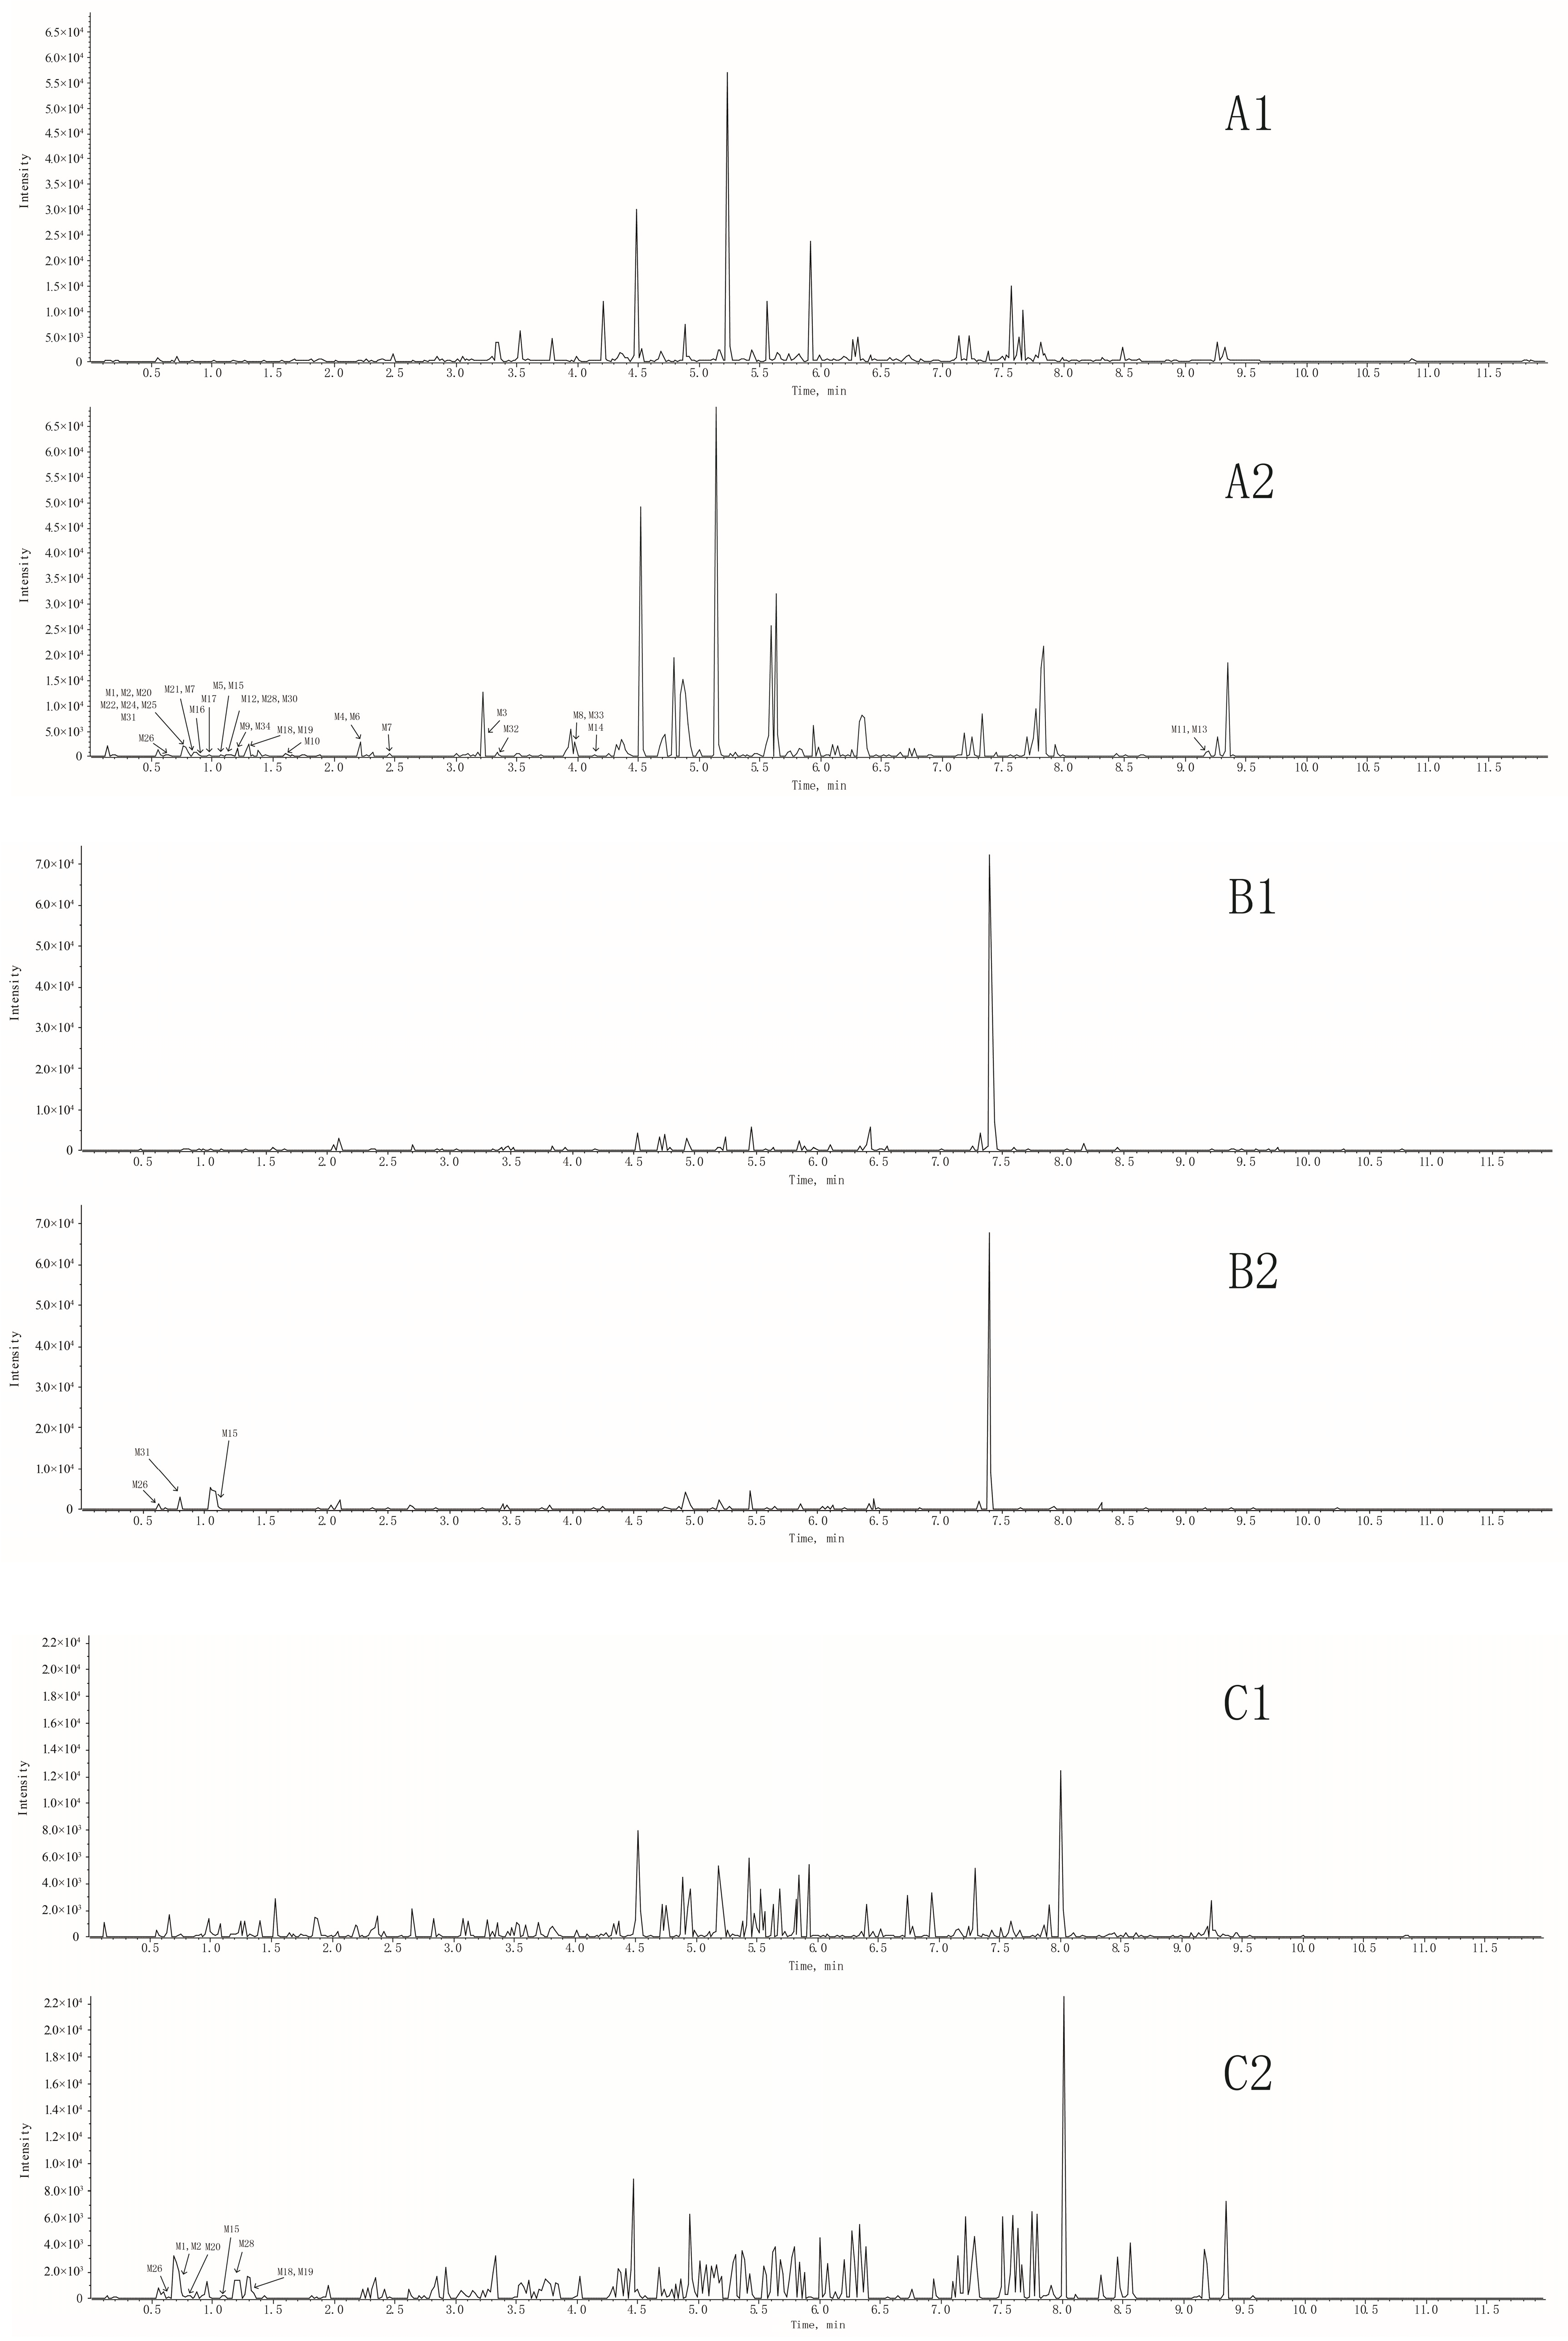
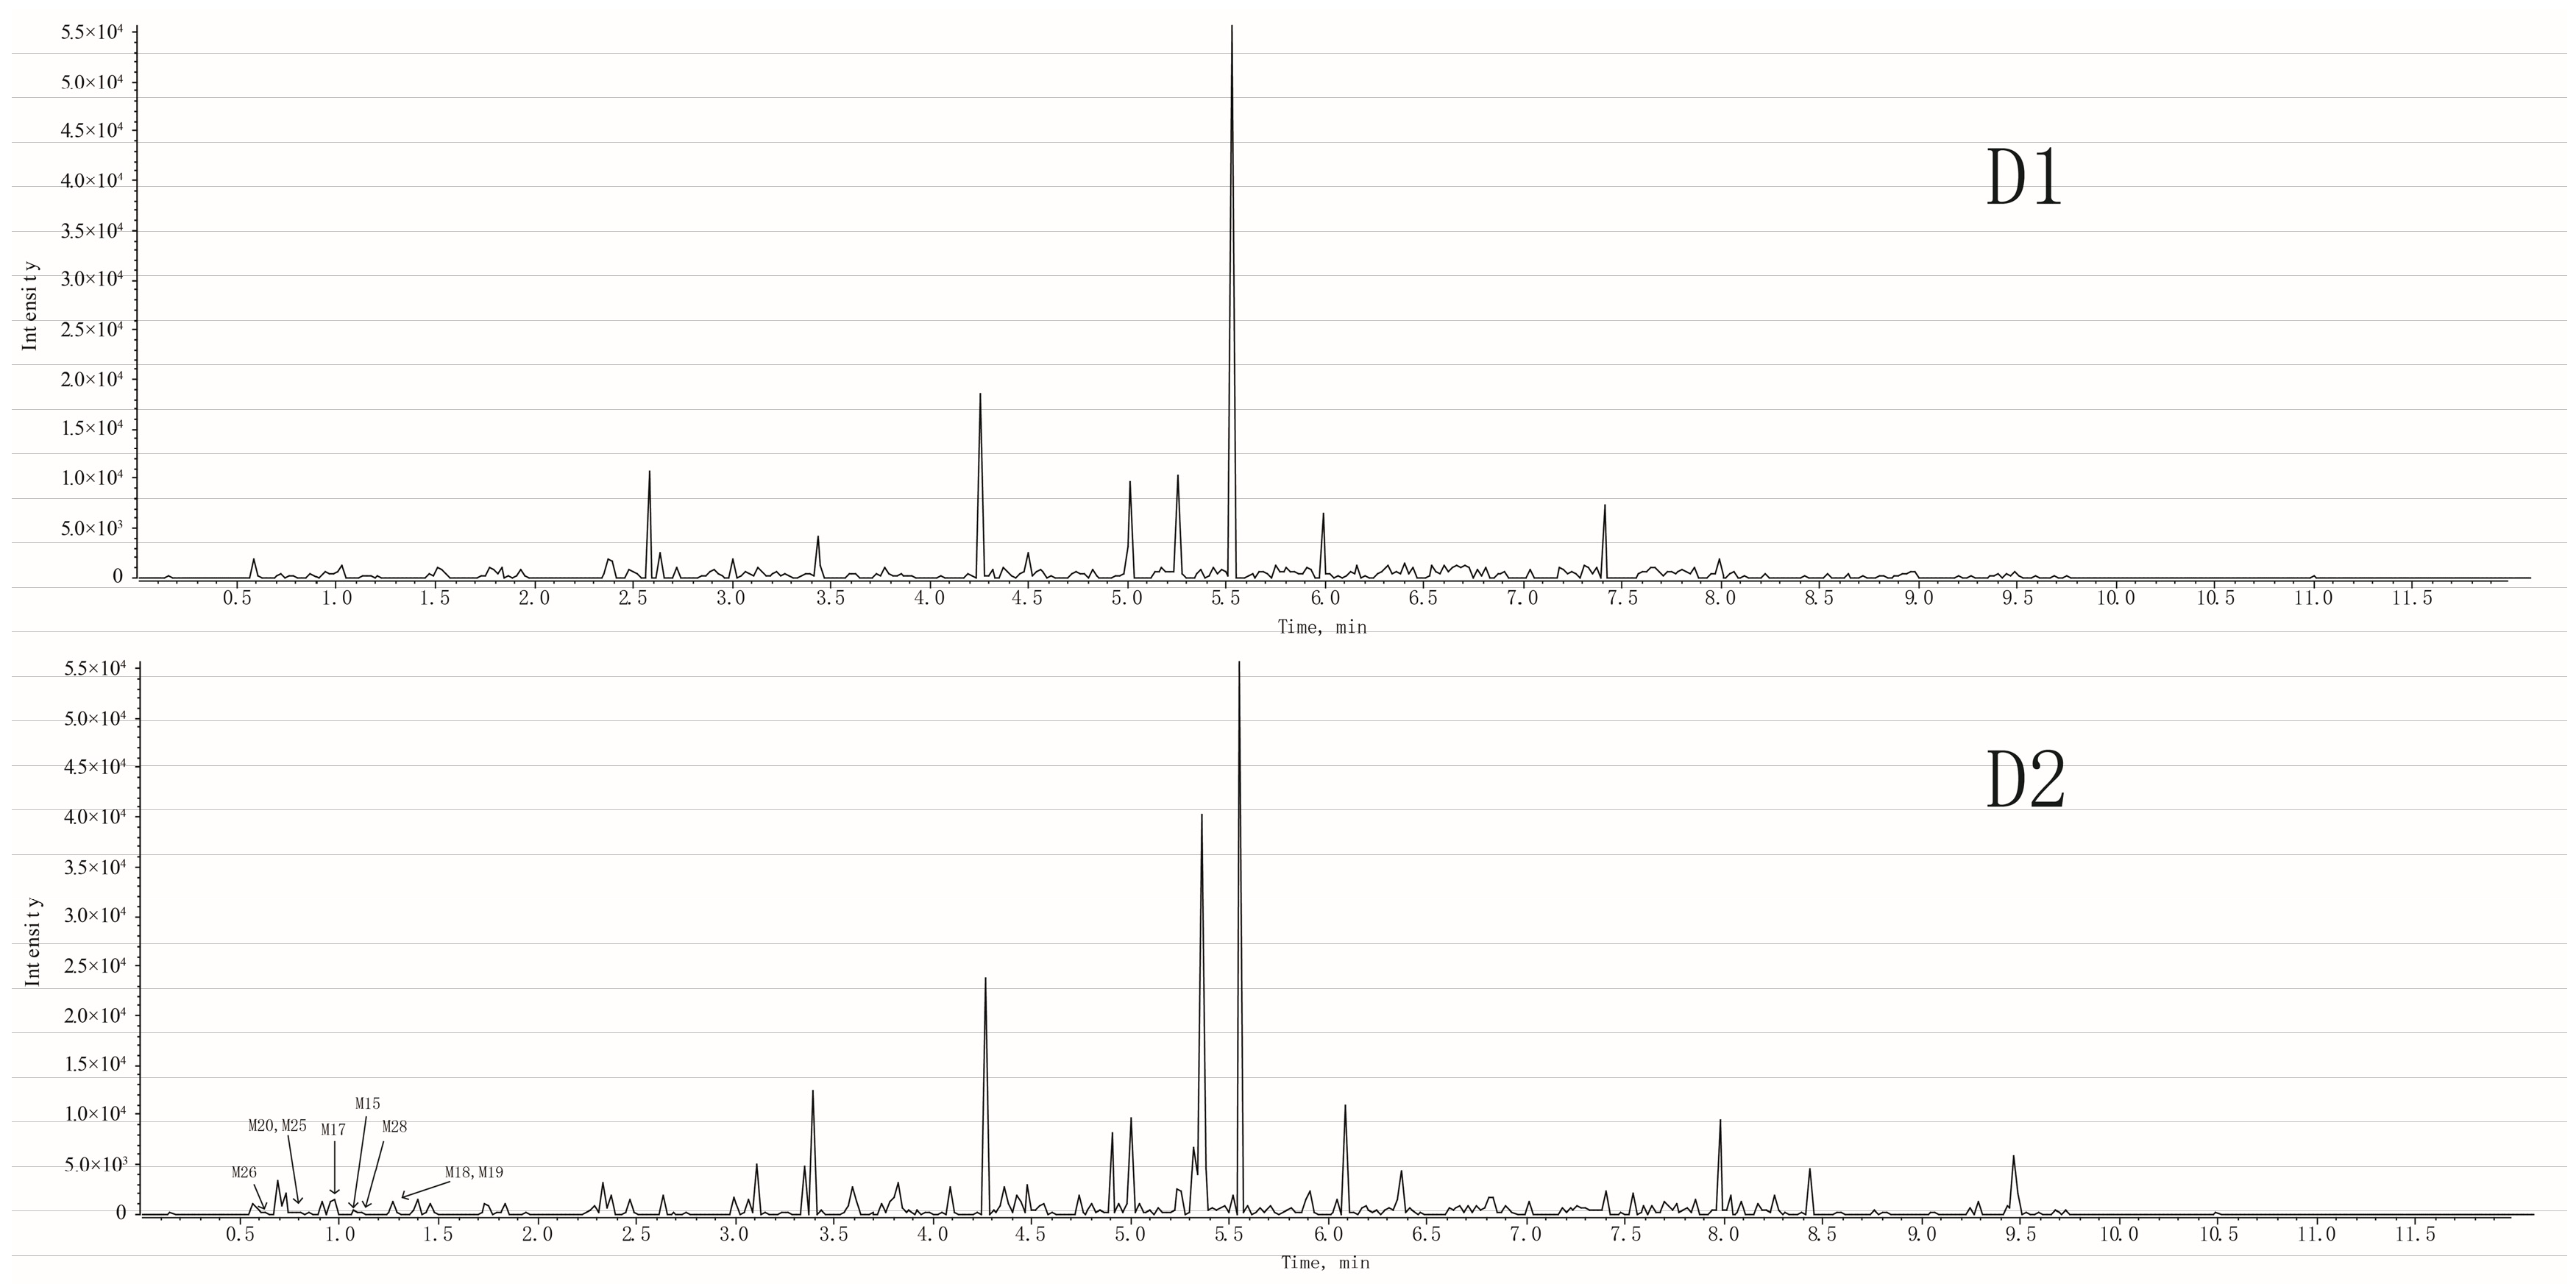
2.1.2. UHPLC–Q-TOF-MS/MS Analysis

The full scan mass spectrometry of rat plasma, bile, stool, and urine samples before and after oral administration of complanatuside were collected from UHPLC-Q-TOF-MS as shown in Figure 2. By carefully comparing the data of complanatuside-treated samples with those from their corresponding blank samples, 34 metabolites (M1M34) for complanatuside in vivo were confirmed as shown in Table 1, and the fragmentation pathways of it were proposed in Figure 3. All the metabolites were detected in plasma, figures are in the Supplementary Materials.

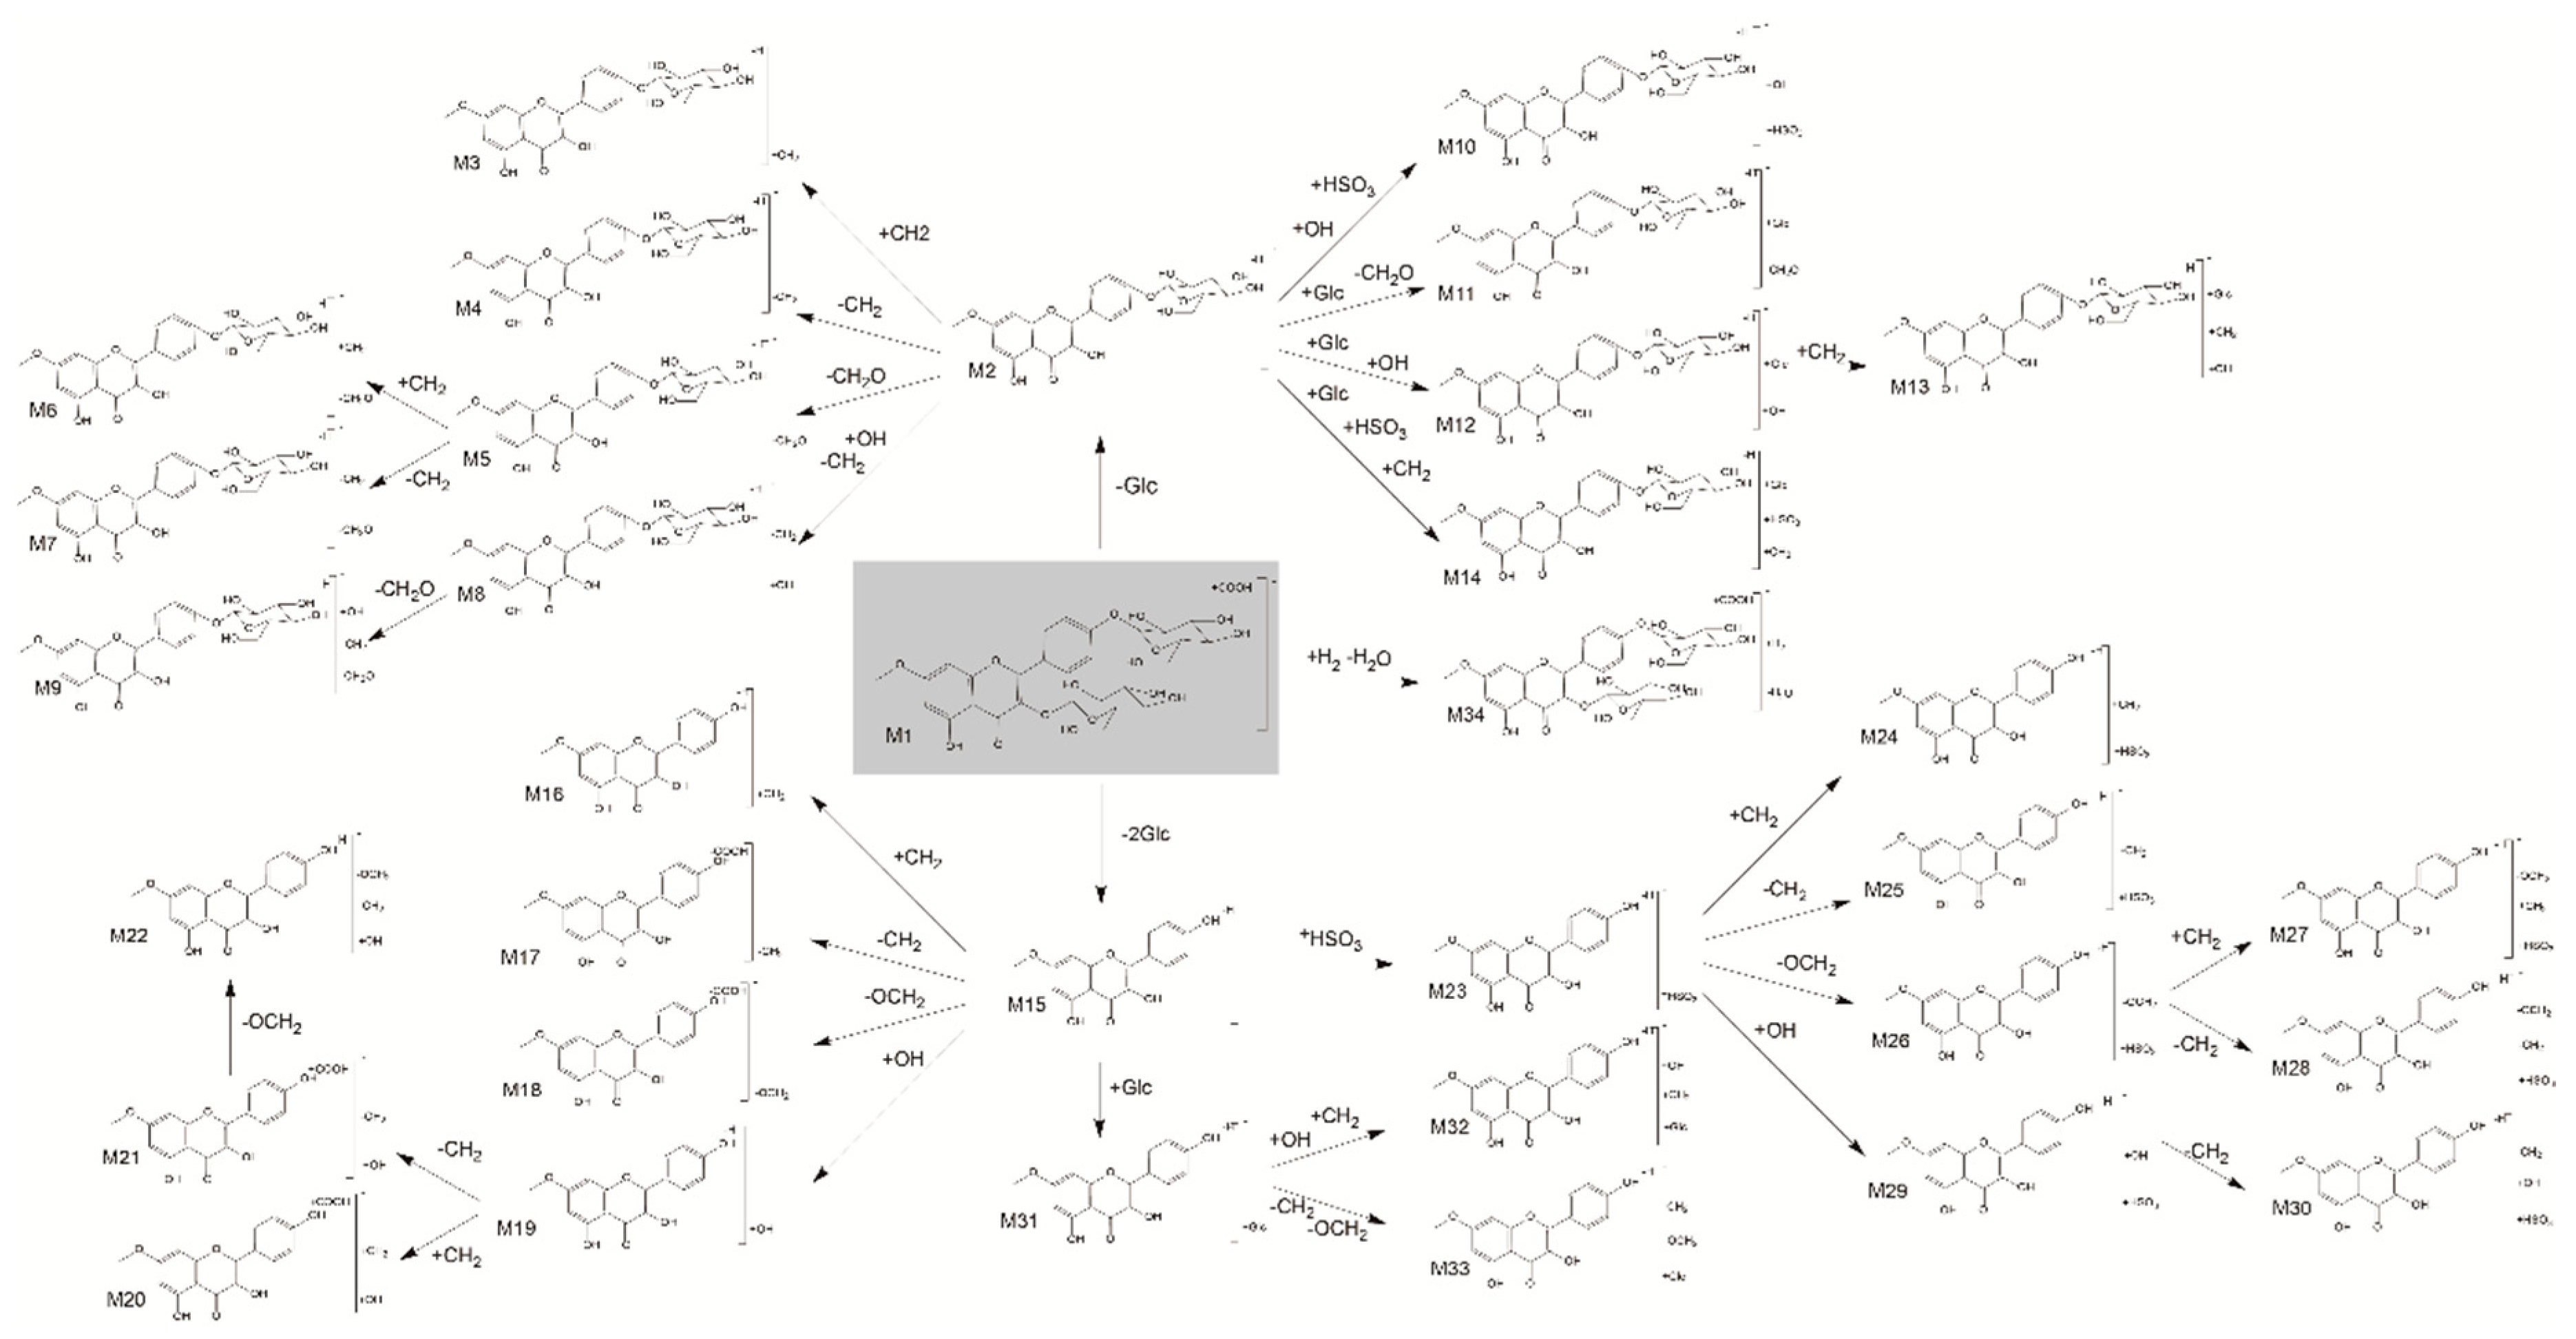
2.1.3. Parent Drug and Metabolites of the Parent Drug

Parent compound M1

Compound M1 was detected in rat plasma in a retention time of 0.79 min. M1 with m/z 669.1663 (C28H32O16) was 45 Da higher than m/z 624.1690 with an additional ion +COOH, indicating that M1 was the ion of the m/z 624.1690. The fragment ion at m/z 461.1089 was generated by deglycosylation from the loss of M1. Additionally, the fragment ion at m/z 299.0553 was generated by deglycosylation from the ion at m/z 461.1089. Based on the above statement, M1 was identified as complanatuside [20].

Metabolites M2 and M15

As shown in Figure 2 and Supplementary Figures, the [M − H] ion of M2 was m/z 461.1089 (C22H22O11), 162 Da lower than m/z 624.1690. The fragment ion at m/z 299.0550 (C16H12O6) was generated by deglycosylationfrom the loss of m/z 461.1089. Similarly, the [M − H] ion of M15 was 162 Da lower than the ion of M2. Therefore, M2 and M15 were identified as the deglucosylated metabolites rhamnocitrin 3-O-glucoside and rhamnocitrin [24], respectively.

2.1.4. Metabolites of the Degradation Products

Methylated metabolites (M3; M16)

In rat plasma, M3 with m/z 475.1246 (C23H24O11, retention time 3.20 min) and M16 with m/z 331.0460 (C15H10O6, retention time 0.92 min) were 14 Da (CH2) higher than M3 and M15, indicating that they were methylated metabolites of complanatuside. The fragment ion at m/z 429.2995 (M−H2O -CO) was generated from M3 and the fragment ion at m/z 285.0312 (M−CH2) was generated from M16. Therefore, M3 and M16 were identified as methylated metabolites of complanatuside.

Demethylated metabolites (M4; M17)

Two metabolic products M4 [M − H] and M17 [M – H] at m/z 447.0929 (C21H20O11) and 331.0460 (C15H10O6) were 14 Da (CH2) lower than that of M2 and M15, respectively. This finding suggested that M4 and M17 were demethylation products of complanatuside. The fragment ions at m/z 296.9979, 164.837, and 149.0965 also reviewed the same results.

Demethoxy metabolites (M5; M6; M7; M18)

Similar to the methylated/demethylated metabolites, the ions of M5 and M18 at m/z 431.0983 (C21H20O10) and 269.0449 (C15H10O5), were likely produced by the loss of methoxy after the metabolites of deglycosylation of complanatuside M2 and M15, respectively. Meanwhile, M6 and M7 can also be considered as metabolites of M3 and M4 after this transform, respectively.

Hydroxylated metabolites (M8; M9; M19; M20; M21; M22)

Several metabolites were generated from complanatuside by hydroxylation, including M8, M9, M19, M20, and M21, which were 16 Da higher than the metabolites M4, M7, M15, M16, and M17, respectively. Therefore, they were identified as complanatuside hydroxylated metabolites, and the metabolite M22 was obtained after hydroxylation of the demethoxy-demethylated metabolites.

Sulfonated metabolites (M10; M23; M24; M25; M26; M27; M28; M29; M30)

In rat biological metabolism, sulfonation is a very common metabolic process and its metabolites can be performed simultaneously with other metabolic modalities. We have already detected ninesulfonated metabolites in this experiment, marked as M10, M23, M24, M25, M26, M27, M28, M29, and M30.

Glucuronidated metabolites (M11; M12; M13; M14; M31; M32; M33)

In addition, the glucuronidated process is a common phenomenon of natural products. Many metabolites were generated after glucuronidation, including M11, M12, M13, M14, M31, M32, and M33, identified by secondary mass spectrometry, and some of them have different cleavage patterns due to the addition of glucuronic acid. No glucuronide conjugate of M1 complanatuside was detected in rat plasma.

Dehydrated metabolites (M34)

Dehydration is a common metabolic method of flavonoids. Compound M34 was detected in a retention time of 1.21 min. M34 with m/z 653.1761 (C28H32O15) was 45 Da (with additional ion +COOH) higher than m/z 608.1741, which showed that M34 was the ion of the m/z 608.1741. Meanwhile, the m/z 608.1741 was 16 Da lower than complanatuside m/z 624.1690. Metabolite M34 was identified as the dehydration of complanatuside.

2.2. Pharmacokinetic Study

2.2.1. Selection of Internal Standard

To determine the concentration of complanatuside, rhamnocitrin 3-O-glucoside, and rhamnocitrin in rat plasma after an oral administration of 72 mg/kg, quercetin was selected as the internal standard (IS) based on the similar chemical structures, chromatographic performance, and ionization under the same conditions.

2.2.2. Method Validation

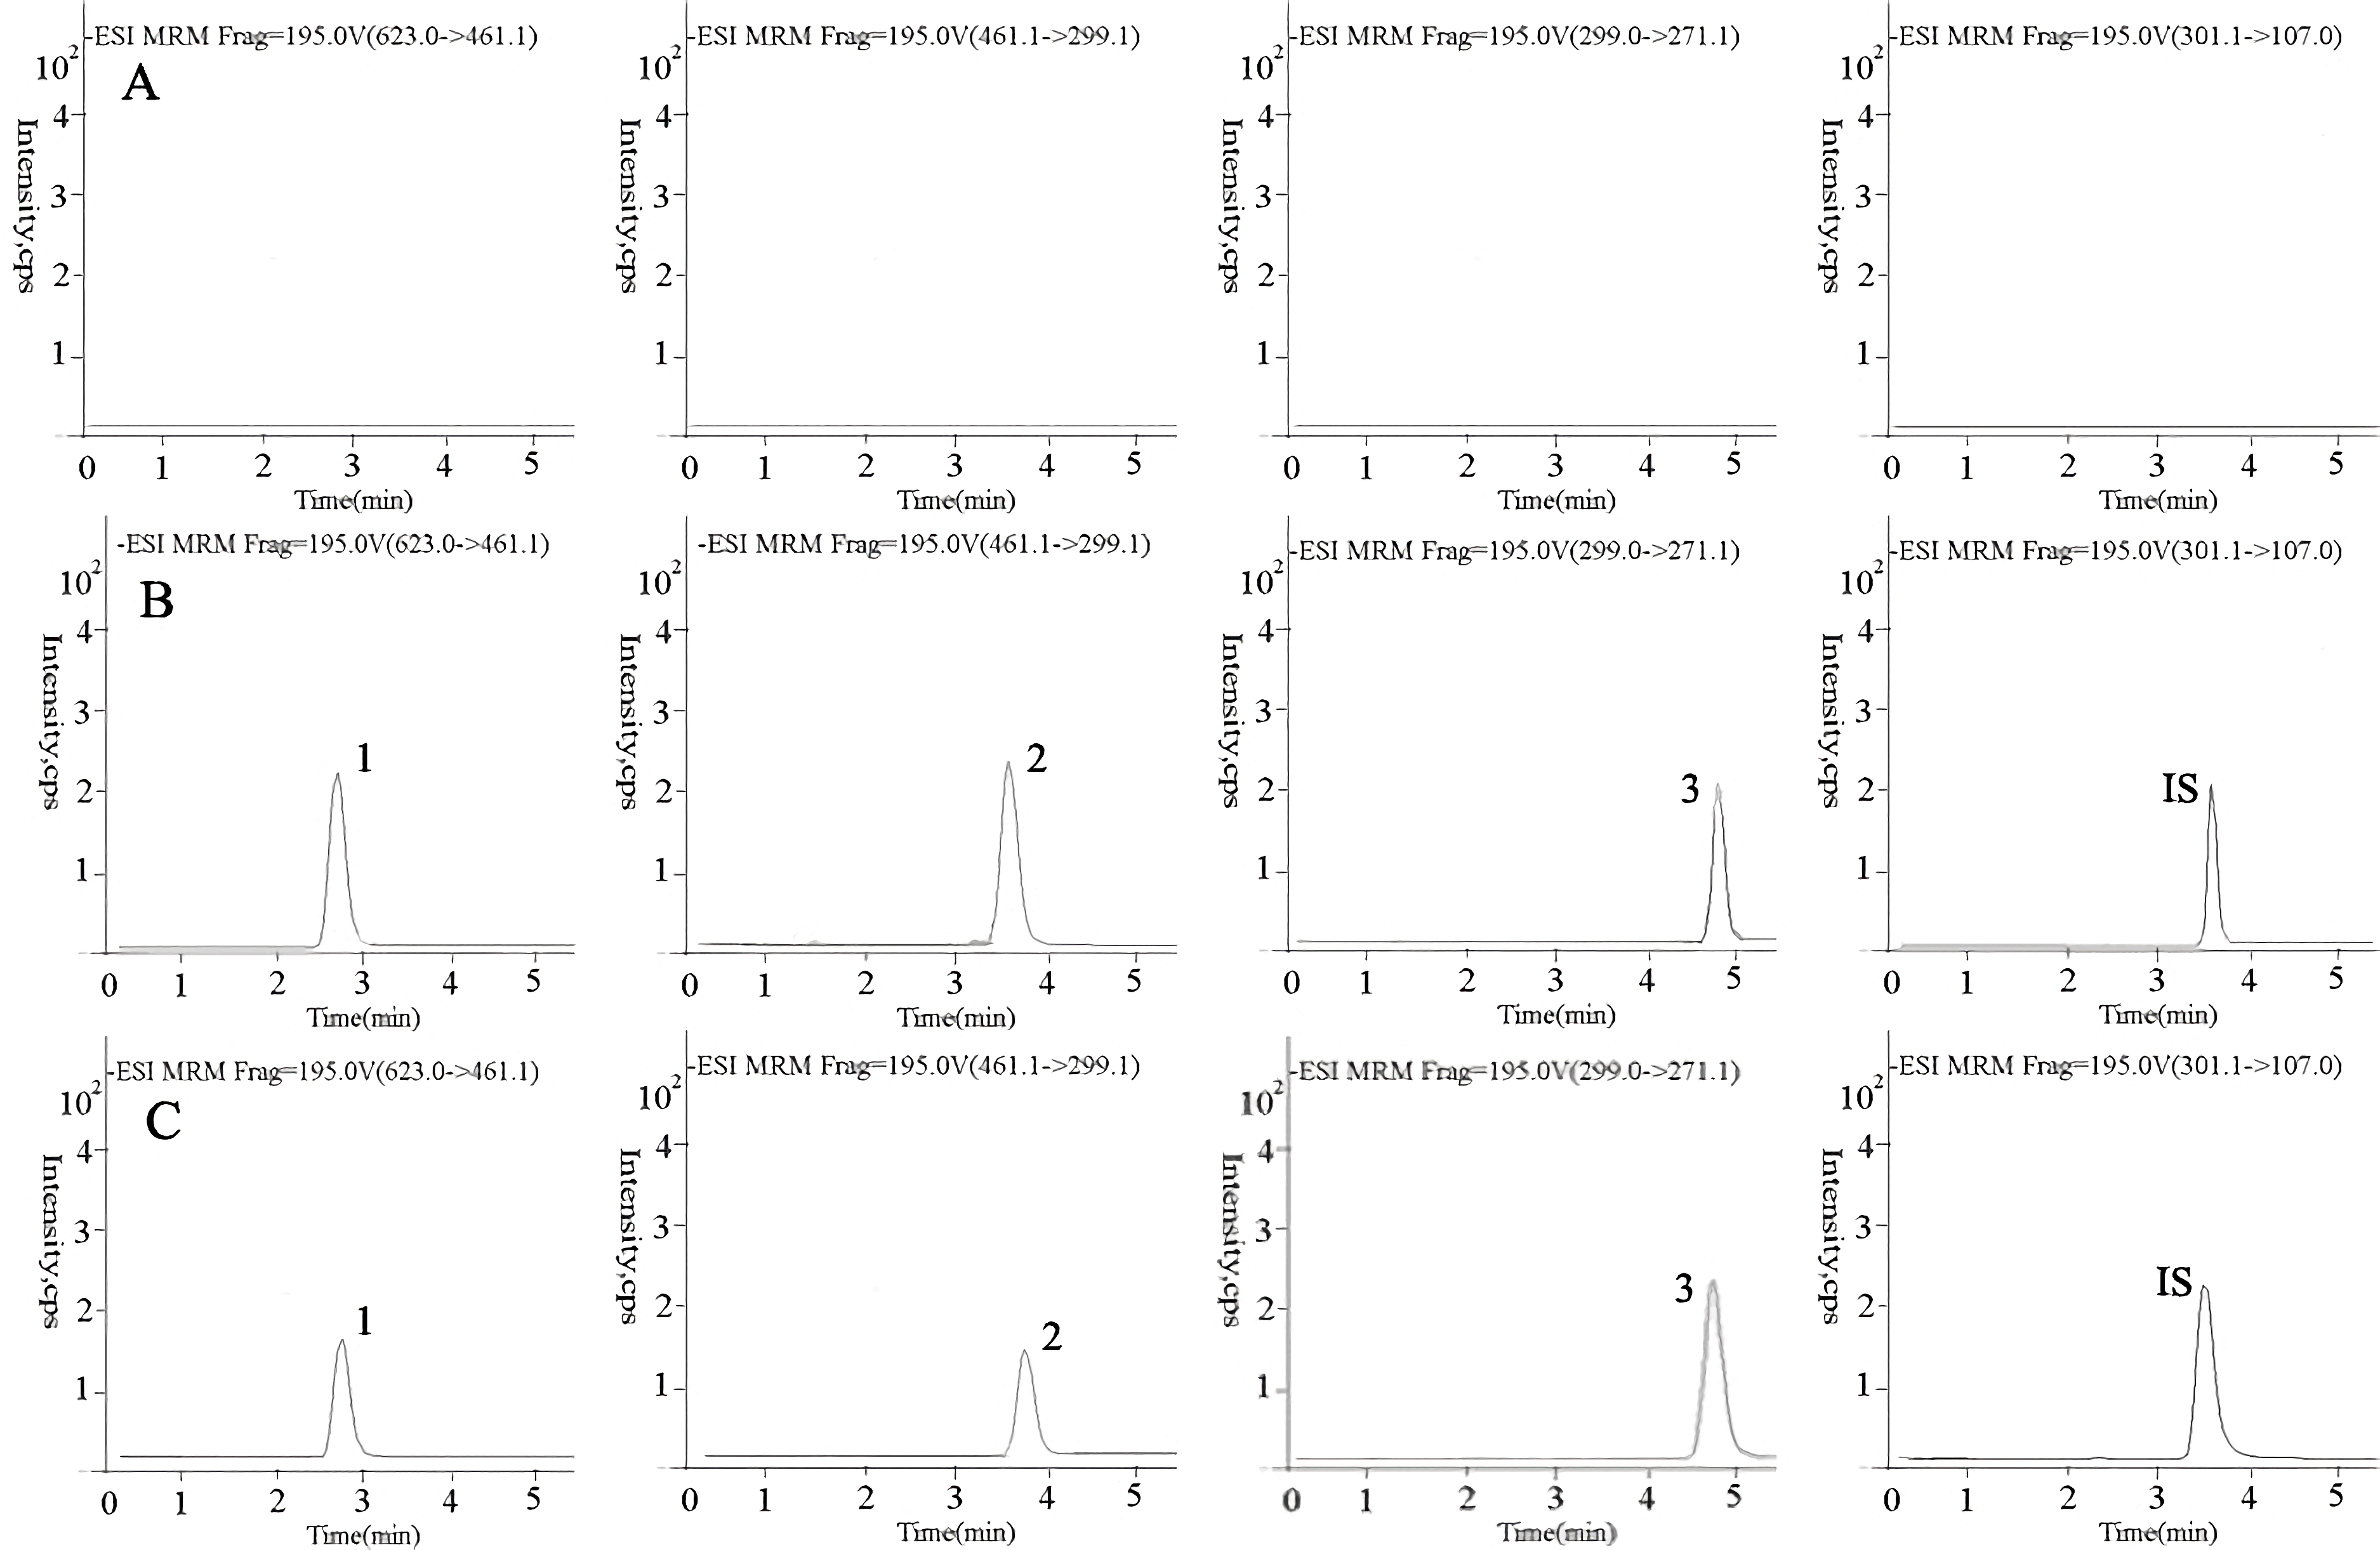
Selectivity and Carryover

The structural formula and MS/MS of blank plasma, as shown in Figure 4A, blank plasma spiked with the internal standard, as shown in Figure 4B, and the real plasma samples, as shown in Figure 4C, at 2 h are depicted in Figure 4. The retention times of complanatuside, rhamnocitrin 3-O-β-glc, rhamnocitrin, and IS were 2.9, 3.7, 3.6, and 4.9 min, respectively. There are no significant endogenous substances or metabolite interference was observed at the retention time of them.

Linearity and Sensitivity

The good linearity of complanatuside, rhamnocitrin 3-O-β-glc, and rhamnocitrin were achieved when the calibration curve was established by the peak area of analytes to IS (Y) versus analyte concentration (X) over the linear concertation rages (R2 > 0.99) and the lower limit of quantification (LLOQ) of them is 5.20 ng/mL, 2.04 ng/mL, and 1.02 ng/mL, respectively, as shown in Table 2, which were already adequate for the detection in the pharmacokinetic study.

Recovery and Matrix Effect

The extraction recoveries of complanatuside, rhamnocitrin 3-O-β-glc, and rhamnocitrin were obtained using a protein precipitating method. The average recovery of them at 20, 125, and 50 ng/mL was in the range of 73.5~90.3%. Moreover, the matrix effect at the three quality control (QC) samples were 102.1± 4.4, 92.7 ± 14.6, and 98.7 ± 2.9 ng/mL for complanatuside; 86.0 ± 7.5, 97.7 ± 2.1, and 98.2 ± 2.9 ng/mL for rhamnocitrin 3-O-β-glc, and 101.1 ± 4.3, 93.2 ± 2.3, and 95.6 ± 4.8 ng/mL for rhamnocitrin, respectively, as shown in Table 3.

Stability

The stability of three compounds in rat plasma (20, 125, and 500 ng/mL) under different conditions were stable, as shown in Table 4, and the relative standard deviations (RSDs) of them were lower than 15%.

Precision and Accuracy

The data of precision and accuracy of intra- and inter-day are listed in Table 5. The intra-day and inter-day precision of the three analytes were all in the range 2.7–5.8% and 1.7–10.1%. The accuracy values ranged from −0.9% to 4.0% for intra-day and from −1.2% to 6.5% for inter-day. The results indicated that the method was accurate, reliable, and precise.

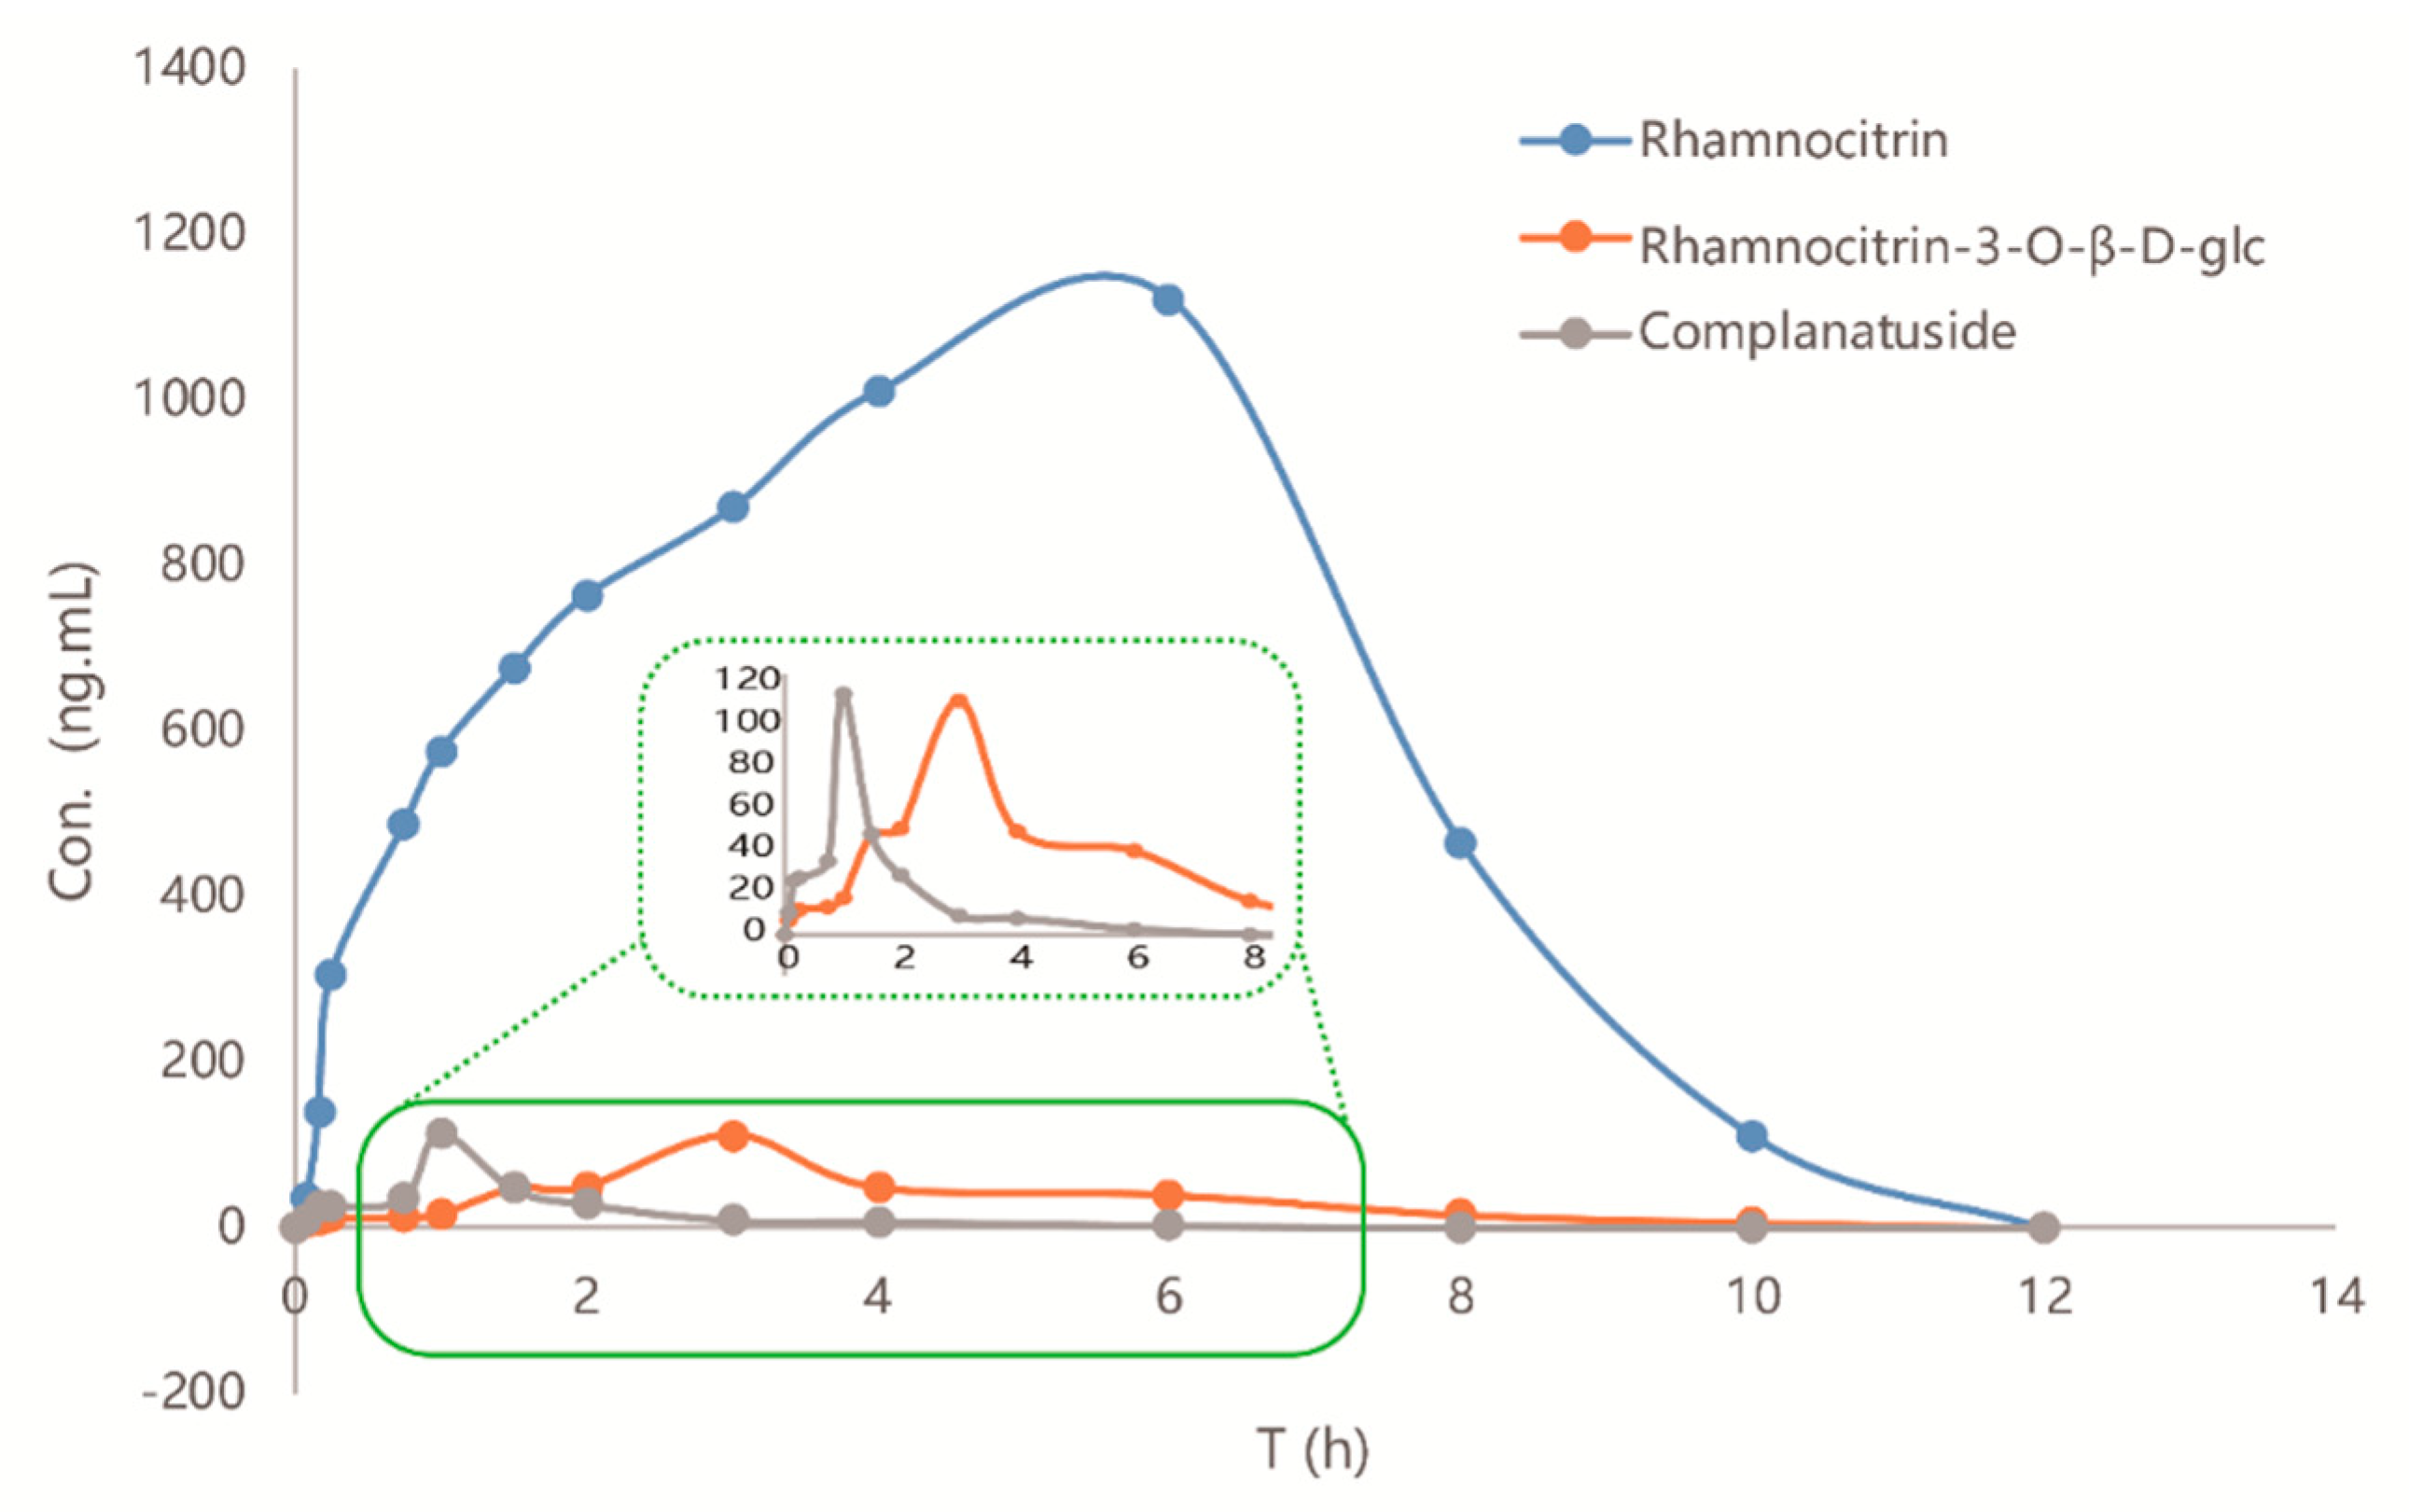
2.2.3. Pharmacokinetics of Complanatuside and Two Metabolites

A new LC-MS method was applied in the pharmacokinetic study of complanatuside and its two metabolites after successful oral administration of complanatuside in rats. The concentrations were calculated by the calibration curves, and pharmacokinetic parameters were counted with a non-compartment model according to the concentration-time data used in DAS 3.0 software. The concentration-time curve was depicted in Figure 5, and the pharmacokinetic parameters were shown in Table 6. The Tmax of complanatuside, rhamnocitrin 3-O-β-glc, and rhamnocitrin was 1 h, 3 h, and 5.3 h, respectively, while the T1/2 (MRT, mean residence times) were 0.5 h (1.72 h), 1.3 h (4.3 h), and 4.2 h (4.9 h), respectively, which indicated that the speeds of elimination of three analytes were complanatuside > rhamnocitrin 3-O-β-glc > rhamnocitrin. Furthermore, for complanatuside, rhamnocitrin 3-O-β-glc, and rhamnocitrin, the area under the curve was 143.52 ± 15.73 µg/L·h, 381.73 ± 24.13 µg/L·h, 6540.14 ± 433.70 µg/L·h, and the Cmax values were 119.15 ± 11.25 ng/mL, 111.64 ± 14.68 ng/mL, and 1122.18 ± 113.32 ng/mL, individually. It manifested that if the complanatuside absorbed as prototype in vivo, then it was rapidly suffered from biotransform as deglycosylation, then rhamnocitrin 3-O-β-glc and rhamnocitrin occurred successively. The Cmax and AUC0-∞ of rhamnocitrin were the highest among the three analytes, which indicated that it may be the real potential active ingredient after oral administration by complanatuside in vivo. The descriptions of pharmacokinetic characteristics of complanatuside and its metabolites contributed to clarifying the metabolic process of complanatuside in vivo. Although the bioavailability of complanatuside was low, the biotransform method was helpful to raise its availability.

3. Discussion

In this study, a strategy is described using ultra-high performance liquid chromatography quadrupole-time-of-flight mass spectrometry (UHPLC-Q-TOF/MS) with automated data analysis for the rapid analysis of the metabolic profile of complanatuside in rat plasma after oral administration. As a result, a total of 34 metabolites were identified and their characteristic fragmentations were summarized.
Flavonoids are extensively metabolized in vivo by phase II enzymes such as uridine-5-diphosphate glucuronosyltransferases (UGTs) and sulfotransferases (SULTs) to glucuronides and sulfonation metabolites [26]. The efficiency of glucuronidation of flavonoids was very high, followed by sulfonation, with only a very minor contribution by CYP-mediated oxidation. This metabolism rank could be proved by the most similar flavonoids known in other literature. On the other hand, the reason why the bioavailability of flavonoid glycosides is low is that it is rapidly transformed in vivo, so it is low to calculate the bioavailability with the prototype. Therefore, the bioavailability evaluation of flavonoid glycosides should be combined with the comprehensive bioavailability evaluation of metabolites.
In the pharmacokinetic analysis, an LC-MS method for quantification was developed and validated, and applied in a pharmacokinetic study after oral administration of complanatuside in rats. From the results, we can find that complanatuside was rapidly converted into rhamnocitrin 3-O-β-glc and rhamnocitrin because of degradation of glucosides in vivo, which cause a low bioavailability of complanatuside. This method will be useful to explain the metabolic behaviors of similarflavonoids in the body and to investigate the crucial medicinal substance of complanatuside.

4. Materials and Methods

4.1. Chemicals and Reagents

Complanatuside, rhamnocitrin 3-O-β-glc, rhamnocitrin, and internal standard (IS, quercetin) with a purity of more than 98% were provided by Institute of Clinical Pharmacology, Guangzhou University of Chinese Medicine (Guangzhou, China). Their structures were confirmed using MS and 1H- and 13C-nuclear magnetic resonance (NMR) spectroscopy [27]. The chemical structures of complanatuside and quercetin are shown in Figure 6. Deionized water was purified using a Millipore water purification system (Millipore, Billerica, MA, USA). Acetonitrile and methanol used in the study were all UPLC-MS pure grade (Fisher Chemical Company, Geel, Belgium). Formic acid was purchased from the company of Sigma-Aldrich. Other reagents of analytical grade were purchased from Guangzhou Chemical Reagent Factory (Guangzhou, China).
Complanatuside was dissolved in water to form a solution for oral administration with a concentration of 7.2 mg/mL. Blank rat plasma was prepared by our research group.

4.2. Animal Experiments

One hundred and sixty male Sprague-Dawley rats (200–250 g) obtained from the Laboratory Animal Center of Guangzhou University of Chinese Medicine were used for plasma collection. Animals were bred in a breeding room with a temperature of 24 ± 2 °C, relative humidity of 60 ± 5%, and 12 h dark-light cycle. They were given tap water and fed normal food ad libitum. Animal welfare and experimental procedures were strictly in accordance with the Guide for the Care and Use of Laboratory Animals (US National Research Council, 1996) and the related ethics regulations of this University (NO.712052), the table as shown in the Supplementary Materials.

4.3. Sample Preparation

4.3.1. Metabolism Study

The whole blood (150 μL) was collected at 0, 5, 15, 30 min, 1, 1.5, 3, 6, and 9 h after oral administration (72 mg/kg) of complanatuside solution from the fossa orbitalis vein. Additionally, all the blood samples were centrifuged (3800 r/min) for 15 min at 4 °C to obtain plasma. Plasma samples were mixed (50 μL) and pipetted into the 1.5 mL polythene tubes and then followed by methanol (200 μL). The mixture was vortexed for 3 min and centrifuged (13,000 r/min) for 10 min, and the supernatant was transferred and evaporated at 37 °C under a stream of nitrogen. The residue was reconstituted in the mobile phase (50 μL) and centrifuged (13,000 r/min) for 10 min and 2 μL was used for analysis.
Blank urine and dose urine were collected by using metabolism cages for 12 h after administration. After following by methanol (300 μL), each urine sample (400 μL) was centrifuged (13,000 r/min) for 10 min to obtain the supernatant which was transferred and evaporated at 37 °C under a stream of nitrogen. The residue was reconstituted and centrifuged, and 2 μL was used for analysis.
Blank and dose stool powder were also collected at the same time. After extracting each dried powder stool sample (100 mg) with 1 mL methanol, the mixture was ultrasonicated for 30 min in an ice water bath, which was then centrifuged (13,000 rpm, 4 °C, 10 min) to obtain the clear supernatant. Similarly, the supernatant was evaporated to a dried residue and supplemented with 500 µL of methanol to be reconstituted and centrifuged (13,000 rpm) for 10 min.
In terms of obtaining bile samples, the rats were anesthetized by urethane (1.0 g/kg). After abdominal incision surgery, aplastic cannula was inserted into the bile duct by surgery to collect bile. The blank and drug bile samples were collected for 12 h from the start of oral administration, and the treatment of them was consistent with the urine samples.

4.3.2. Pharmacokinetic Study

Whole blood samples (about 150 μL) were collected in heparinized polythene tubes at 0, 5, 10, 15, 45 min, 1, 1.5, 2, 3, 4, 6, 8, 10, and 12 h after oral administration (72 mg/kg) of complanatuside solution, and immediately centrifuged (3800 r/min) for 15 min at 4 °C to obtain plasma, and all samples were kept at −80 °C. Frozen rat plasma samples were thawed to room temperature prior to preparation. Plasma samples (50 μL) were pipetted into the 1.5 mL polythene tubes and then followed by methanol (200 μL). The mixture was vortexed for 3 min and centrifuged (13,000 r/min) for 10 min, and the supernatant was transferred and evaporated at 37 °C under a stream of nitrogen. The residue was reconstituted in the mobile phase (50 μL) and centrifuged (13,000 r/min) for 10 min and 2 μL was used for analysis.

4.4. Instruments and Experimental Conditions

4.4.1. UHPLC–Q-TOF-MS Conditions

Chromatographic analysis was performed using an UHPLC system (Shimadzu, Kyoto, Japan) consisting of Shimadzu LC-30AD binary pump, a Model SIL-30SD autosampler, an online degasser (DGU-20A5R), and a temperature controller for columns (CTO-30A). An Agilent C18 column (3.0 × 50 mm, 2.7 μm, Agilent Technologies Inc., USA) was carried out for separation. The column temperature was maintained at 25 °C. The autosampler was set at 4 °C. The mobile phase consisted of (A) acetonitrile and (B) water containing 0.1% formic acid using a gradient elution of 20–70% A at 0–12 min. The flow rate was 0.4 mL/min, injection volume was 2 μL.
An AB SCIEX TripleTOF 5600+ mass spectrometer (AB SCIEX, Foster City, CA, USA) was connected to the UHPLC system through an electro-spray ionization (ESI) interface. The ion source can be operated in negative mode, the ion spray voltage (ISFV) was set to −4500 V (negative ion mode); the turbo spray temperature (TEM) 550 °C; nebulizer gas (Gas 1), 55 psi; heater gas (Gas 2), 55 psi; and declustering potential (DP) −100 V, the spectra covered the range from m/z 100~1200 Da.
All data collected were processed using Analyst SoftwareTM 2.2 (AB SCIEX, Foster City, CA, USA).
Post-acquisition analyses were performed using PeakViewTM version 2.1 software (AB Sciex, Framingham, MA, USA) and MasterViewTM version 1.0 software (AB Sciex, Framingham, MA, USA) which employs a list of potential biotransformation target compounds, incombination with the built-in no-target screening.

4.4.2. LC-MS/MS Conditions

The analysis of pharmacokinetics was conducted using an LC-MS/MS system consisting of an Agilent 1260–6460 liquid chromatography instrument (Agilent, Agilent Technologies Inc., Palo Alto, CA, USA) equipped with a quaternary pump, a vacuum degasser, a thermo-stated column oven, and an autosampler (set at 4 °C), which were coupled to a triple quadrupole mass spectrometer. Separation was performed on an Agilent C18 column (3.0 × 50 mm, 2.7 μm) at 25 °C. The mobile phase consisted of (A) acetonitrile and (B) water containing 0.1% formic acid with a gradient elution program (20–30% A at 0–1 min; 30–50% A at 1–2 min; 50–60% A at 2–3 min; 60–70% A at 3–6 min). The flow rate was kept constant at 0.4 mL/min and the injection volume was 2 μL. The ion source was ESI- Agilent Jet S; the gas flow rate was set at 5 L/min; nebulizer 45 psi; sheath gas temperature 300 °C; sheath gas flow 11 L/min; capillary 3500 V; and nozzle voltage 500 V.
The MassHunterTM Workstation (Agilent, Waldbronn, Germany) was used for data collection and acquisition.

4.5. Method Validation

Validation of the analytical method was assessed on specificity, linearity, sensitivity, precision, accuracy, recovery, matrix effect, and stability compliance under the Food and Drug Administration of the United States (USFDA) guidelines.
Blank plasma from six different rats with and without analytes, and IS were used to evaluate the specificity, which is an indicator of whether endogenous interference has occurred. The calibration curves were created for quantitative analysis. Regression was accomplished using a linear equation with a weighting factor of 1/x2. The lower limit of quantification (LLOQ) was defined as the lowest concentration point of the calibration curve (S/N > 10). For evaluation of intra- and inter-day accuracy and precision, three concentration QC samples were analyzed repeatedly in a single day and three consecutive days along with the calibration curve. The variations of intra- and inter-day accuracy and precision were expressed as the relative standard deviation (RSD). The absolute recoveries were evaluated by comparing the peak area of the complanatuside in spiking extracted samples with the corresponding spiking un-extracted samples. Matrix effects were calculated by match spiking post-extracted blank plasma samples with corresponding standard clean solutions at three concentrations. The stability test of QCs in rat plasma was assessed in their store environment, including at room temperature (25 ± 1 °C) for 24 h, at −80 °C for 1 month, and three freeze (−20 °C) to thaw (room temperature) cycles. Measurements were taken six times.

4.6. Data Analysis of the Pharmacokinetic Study

According to DAS pharmacokinetic software package (version 3.2.8, Chinese Pharmacological Association, Anhui, China), the non-compartmental model was suitable to describe the pharmacokinetic parameters after oral administration. The main pharmacokinetic parameters such as the maximum plasma concentration (Cmax), the time to reach maximum drug concentration (Tmax), the area under the plasma concentration-time curve (AUC), half-life (t1/2), and mean residence time (MRT) were calculated.

5. Conclusions

In this study, the metabolism and pharmacokinetic studies of complanatuside were performed for the first time. A metabolic investigation of complanatuside was carried out through UHPLC-Q-TOF-MS/MS. The 34 metabolites and metabolic pathways were all characterized. In the pharmacokinetic analysis, a HPLC-MS/MS quantitative method for the main metabolites—rhamnocitrin 3-O-glucoside and rhamnocitrin—was developed and validated. The method was then successfully applied to the pharmacokinetic study after oral administration of 72 mg/kg of complanatuside. The results showed that complanatuside exhibited mild oral absorption (Tmax = 1.0 h), fast elimination (t1/2 = 0.51 h), and poor absolute bioavailability (AUC(0-t) = 143.52 µg/L·h). Overall, complanatuside metabolized as apro-drugand underwent further metabolism, and metabolized intothe main metabolites rhamnocitrin 3-O-glucoside and rhamnocitrin derivers. These findings could provide data and reference for further research and applications of complanatuside.

Supplementary Materials

The following are available online at https://www.mdpi.com/1420-3049/24/1/71/s1, Figure S1: The negative MS/MS spectra of the identified 34 metabolites from the sample of rats of complanatuside. Table S1: the ethical inspection of identification and pharmacokinetic studies on complanatuside and its major metabolites in rats.

Author Contributions

C.-Z.L. and C.-C.Z. conceived and designed the experiments; Y.-F.Y., F.-L.L., and Q.-Y.Z. performed the experiments; T.H., Y.-S.Z., and M.-Q.W. analyzed the data; R.-J.Z. contributed reagents/materials; Y.-F.Y. and C.-Z.L. wrote the manuscript; C.-C.Z. revised the manuscript.

Funding

This work was Financial supported by the National Natural Science Foundation of China (NO. 81373928, 81573566, 81673872 and 81873091) and Department of Education Guangdong of Province (No. YQ2013043). It is also supported by Pearl River S&T Nova Program of Guangzhou (NO. 2012J2200001).

Conflicts of interest

All the authors declare that there is no conflict of interest.

References

  1. Xu, P.; Zhang, W.B.; Cai, X.H.; Qiu, P.Y.; Hao, M.H.; Lu, D.D. Activating AKT to inhibit JNK by troxerutin antagonizes radiation-induced PTEN activation. Eur. J. Pharmacol. 2017, 795, 66–74. [Google Scholar] [CrossRef] [PubMed]
  2. Kalita, B.; Ranjan, R.; Singh, A.; Yashavarddhan, M.H.; Bajaj, S.; Gupta, M.L. A Combination of Podophyllotoxin and Rutin Attenuates Radiation Induced Gastrointestinal Injury by Negatively Regulating NF-κB/p53 Signaling in Lethally Irradiated Mice. PLoS ONE 2016, 11, e0168525. [Google Scholar] [CrossRef] [PubMed]
  3. Hafez, M.M.; Al-Harbi, N.O.; Al-Hoshani, A.R.; Al-Hosaini, K.A.; Al Shrari, S.D.; Al Rejaie, S.S.; Sayed-Ahmed, M.M.; Al-Shabanah, O.A. Hepato-protective effect of rutin via IL-6/STAT3 pathway in CCl4-induced hepatotoxicity in rats. Biol. Res. 2015, 48, 30. [Google Scholar] [CrossRef] [PubMed]
  4. Kim, S.C.; Byun, S.H.; Yang, C.H.; Kim, C.Y.; Kim, J.W.; Kim, S.G. Cytoprotective effects of Glycyrrhizae radix extract and its active component liquiritigenin against cadmium-induced toxicity (effects on bad translocation and cytochrome c-mediated PARP cleavage). Toxicology 2004, 197, 239–251. [Google Scholar] [CrossRef] [PubMed]
  5. Hou, Z.; Hu, Y.; Yang, X.; Chen, W. Antihypertensive effects of Tartary buckwheat flavonoids by improvement of vascular insulin sensitivity in spontaneously hypertensive rats. Food Funct. 2017, 8, 4217–4228. [Google Scholar] [CrossRef] [PubMed]
  6. Dower, J.I.; Geleijnse, J.M.; Gijsbers, L.; Schalkwijk, C.; Kromhout, D.; Hollman, P.C. Supplementation of the Pure Flavonoids Epicatechin and Quercetin Affects Some Biomarkers of Endothelial Dysfunction and Inflammation in (Pre)Hypertensive Adults: A Randomized Double-Blind, Placebo-Controlled, Crossover Trial. J. Nutr. 2015, 145, 1459–1463. [Google Scholar] [CrossRef] [PubMed] [Green Version]
  7. Jadoon, S.; Karim, S.; Bin Asad, M.H.H.; Akram, M.R.; Khan, A.K.; Malik, A.; Chen, C.Y.; Murtaza, G. Anti-Aging Potential of Phytoextract Loaded-Pharmaceutical Creams for Human Skin Cell Longetivity. Oxid. Med. Cell Longev. 2015, 709628. [Google Scholar] [CrossRef]
  8. Lephart, E.D. Skin aging and oxidative stress: Equol’s anti-aging effects via biochemical and molecular mechanisms. Ageing Res. Rev. 2016, 31, 36–54. [Google Scholar] [CrossRef]
  9. Irakli, M.N.; Samanidou, V.F.; Biliaderis, C.G.; Papadoyannis, I.N. Simultaneous determination of phenolic acids and flavonoids in rice using solid-phase extraction and RP-HPLC with photodiode array detection. J. Sep. Sci. 2012, 35, 1603–1611. [Google Scholar] [CrossRef]
  10. Qiu, L.; Jiao, Y.; Xie, J.Z.; Huang, G.K.; Qiu, S.L.; Miao, J.H.; Yao, X.S. Five new flavonoid glycosides from Nerviliafordii. J. Asian Nat. Prod. Res. 2013, 15, 589–599. [Google Scholar] [CrossRef]
  11. Wiczkowski, W.; Romaszko, J.; Bucinski, A.; Szawara-Nowak, D.; Honke, J.; Zielinski, H.; Piskula, M.K. Quercetin from shallots (Allium cepa L. var. aggregatum) is more bioavailable than its glucosides. J. Nutr. 2008, 138, 885–888. [Google Scholar] [PubMed]
  12. Terao, J. Factors modulating bioavailability of quercetin-related flavonoids and the consequences of their vascular function. Biochem. Pharmacol. 2017, 139, 15–23. [Google Scholar] [CrossRef] [PubMed]
  13. Hu, S.C.; Hong, K.; Song, Y.C.; Liu, J.Y.; Tan, R.X. Biotransformation of soybean isoflavones by a marine Streptomyces sp 060524 and cytotoxicity of the products. World J. Microb. Biot. 2009, 25, 115–121. [Google Scholar] [CrossRef]
  14. Teng, J.; Li, Y.L.; Yu, W.Z.; Zhao, Y.L.; Hu, X.Q.; Tao, N.P.; Wang, M.F. Naringenin, a common flavanone, inhibits the formation of AGEs in bread and attenuates AGEs-induced oxidative stress and inflammation in RAW264.7 cells. Food Chem. 2018, 269, 35–42. [Google Scholar] [CrossRef] [PubMed]
  15. Zhang, G.; Chen, S.S.; Zhou, W.; Meng, J.; Deng, K.; Zhou, H.N.; Hu, N.; Suo, Y.R. Rapid qualitative and quantitative analyses of eighteen phenolic compounds from Lyciumruthenicum Murray by UPLC-Q-Orbitrap MS and their antioxidant activity. Food Chem. 2018, 269, 150–156. [Google Scholar] [CrossRef] [PubMed]
  16. Fernandes, I.; Perez-Gregorio, R.; Soares, S.; Mateus, N.; Freitas, V. Wine Flavonoids in Health and Disease Prevention. Molecules 2017, 22, 292. [Google Scholar] [CrossRef] [PubMed]
  17. Yang, J.; Wang, A.Q.; Li, X.J.; Fan, X.; Yin, S.S.; Lan, K. A chemical profiling strategy for semi-quantitative analysis of flavonoids in Ginkgo extracts. J. Pharm. Biomed. Anal. 2016, 123, 147–154. [Google Scholar] [CrossRef]
  18. Zhang, J.J.; Yan, X.L.; Zhang, Y.J.; Wang, Y.P.; Zhang, Q.J.; Zeng, F.Y.; Li, W.; Ou, L.N. Determination of complanatoside A in semen Astragali complanati by HPLC. China J. Chin. Mater. Med. 2005, 30, 600–602. [Google Scholar]
  19. National Pharmacopoeia Committee. Pharmacopoeia of People’s Republic of China; China Medical Science and Technology Press: Beijing, China, 2010; pp. 181–182. [Google Scholar]
  20. Li, N.; Liu, Y.; Cao, Y.C.; Wei, Z.X.; Pang, L.; Wang, J.M. Quantification of complanatoside A in rat plasma using LC-MS/MS and its application to a pharmacokinetic study. Biomed. Chromatogr. 2016, 30, 888–893. [Google Scholar] [CrossRef]
  21. Fang, S.H.; Rao, Y.K.; Tzeng, Y.M. Anti-oxidant and inflammatory mediator’s growth inhibitory effects of compounds isolated from Phyllanthusurinaria. J. Ethnopharmacol. 2008, 116, 333–340. [Google Scholar] [CrossRef]
  22. Zhoua, X.F.; Tong, G.T.; Wang, X.W.; He, Y. Anti-proliferative constituents from Selaginellamoellendorffii. Nat. Prod. Commun. 2016, 11, 623–626. [Google Scholar] [PubMed]
  23. Miao, X.; Wang, J.; Chen, L.; Peng, Z.; Chen, Y. Identification of in vivo and in vitro metabolites of 4,5-dimethoxycanthin-6-one by HPLC-Q-TOF-MS/MS. J. Chromatogr. B Analyt. Technol. Biomed. Life. Sci. 2016, 1020, 78–84. [Google Scholar] [CrossRef] [PubMed]
  24. Li, Y.; Wang, C.; Li, H.; Yu, T.; Tan, L. Simultaneous Determination of Formononetin, Calycosin and Rhamnocitrin from Astragalus Complanatus by UHPLC-MS-MS in Rat Plasma: Application to a Pharmacokinetic Study. J. Chromatogr. Sci. 2016, 54, 1605–1612. [Google Scholar] [CrossRef] [PubMed]
  25. Lin, P.; Qin, Z.; Yao, Z.; Wang, L.; Zhang, W.; Yu, Y.; Dai, Y.; Zhou, H.; Yao, X. Metabolites profile of GualouXiebaiBaijiu decoction (a classical traditional Chinese medicine prescription) in rats by ultra-performance liquid chromatography coupled with quadrupole time-of-flight tandem mass spectrometry. J. Chromatogr. B Analyt. Technol. Biomed. Life. Sci. 2018, 1085, 72–88. [Google Scholar] [CrossRef] [PubMed]
  26. Chen, Z.; Zheng, S.; Li, L.; Jiang, H. Metabolism of flavonoids in human: A comprehensive review. Curr. Drug. Metab. 2014, 15, 48–61. [Google Scholar] [CrossRef] [PubMed]
  27. Zhang, L.; Zhu, C.C.; Zhao, Z.X.; Lin, C.Z. Simultaneous determination of seven flavonoids in Nerviliafordii with HPLC. Acta. Pharm. Sin. 2011, 46, 1237–1240. [Google Scholar]
Sample Availability: Samples of the compounds are not available from the authors.
Figure 1. Proposed fragmentation pathways of complanatuside (A), RNG (B), and RNC (C). Abbreviation notes: RNG: rhamnocitrin 3-O-β-glc; RNC: rhamnocitrin.
Molecules 24 00071 g001
Figure 2. Total ion chromatograms of complanatuside in rat samples; (A1) blank plasma, (A2) plasma sample after oral administration; (B1) blank bile, (B2) bile sample after oral administration; (C1) blank stool, (C2) stool sample after oral administration; (D1) blank urine, (D2) urine sample after oral administration.
Molecules 24 00071 g002aMolecules 24 00071 g002b
Figure 3. Proposed metabolic pathways of complanatuside.
Molecules 24 00071 g003
Figure 4. Representative multiple reaction monitoring (MRM) chromatograms of analytes in blank plasma samples (A); blank plasma samples spiked with the internal standard (B); the real plasma samples (C). (1) Complanatuside, (2) rhamnocitrin 3-O-β-glc, (3) rhamnocitrin, and (IS) quercetin. ESI: electro-spray ionization; IS:internal standard.
Molecules 24 00071 g004
Figure 5. Time-concentration curves of CPS, RNG, and RNC in plasma from rats after oral administration of complanatuside. CPS: complanatuside; RNG: rhamnocitrin 3-O-β-glc; RNC: rhamnocitrin.
Molecules 24 00071 g005
Figure 6. Chemical structures of complanatuside (A), rhamnocitrin 3-O-β-glc (B), rhamnocitrin (C), and quercetin (D, IS).
Molecules 24 00071 g006
Table 1. Accurate mass measurements and metabolite description of complanatuside.
No.Time (min)Formula (M − H/+HCOO)Experimental (Da)Fragment Ion (Da)Metabolite DescriptionError (ppm)Samples
M1 *0.79C28H32O16669.1663461.1089299.0553Parent0.62P, S *
M20.82C22H22O11461.1089299.0558283.0236Deglycosylation1.20P, S
M33.20C23H24O11475.1246429.2995 M2 methylation1.18P
M42.20C21H20O11447.0929429.2978149.0019M2 demethylation0.36P
M51.04C21H20O10431.0983299.1995148.9996M2 demethylation1.11P
M62.19C22H22O10445.1140296.9965 M2 demethylation1.18P
M72.46C20H18O10463.0871391.0617152.9916M2 demethylation1.32P
M83.99C21H20O12463.0882431.1391355.1693M2 hydroxylation1.18P
M91.23C20H18O11479.0825391.2848227.2567M2 hydroxylation0.15P
M101.58C22H22O15S557.0607255.2311181.9966M2 sulfonation1.05P
M119.20C27H28O16653.1348421.3522175.0235M2 glucuronidation0.97P
M121.14C28H30O18653.1359447.1223335.2226M2 glucuronidation0.78P
M139.23C29H32O18713.1560653.3056447.1289M2 glucuronidation0.78P
M144.12C29H32O20S731.1135317.2127299.1980M2 glucuronidation0.77P
M151.08C16H12O6299.0559285.0312271.0606Deglycosylation of M21.12P, B *,S, U *
M160.92C17H14O6313.0718285.1236269.1281M15 methylation1.87P
M171.09C15H10O6331.0460269.1902149.0965M15 demethylation2.12P, U
M181.35C15H10O5269.0449241.0491225.0540M15 demethoxylation0.36P, S, U
M191.28C16H12O7315.0510300.0264165.0183M15 hydroxylation1.65P, S, U
M200.82C17H14O7375.0711316.1675285.1854M15 hydroxylation1.66P, S, U
M210.91C15H10O7347.0398285.2577135.1503M15 hydroxylation1.68P
M220.78C14H8O6271.0248255.0763 M15 hydroxylation2.01P
M232.86C16H12O9S379.0129299.0564271.0616M15 sulfonation1.37P
M240.76C17H14O9S393.0315313.1804299.1640M15 sulfonation1.39P
M250.77C15H10O9S411.0017287.1634 M15 sulfonation1.49P, U
M260.63C15H10O8S349.0024331.2625 M15 sulfonation1.56P, B, S, U
M270.90C16H12O8S363.0180285.0581257.1902M15 sulfonation1.47P
M281.17C14H8O8S334.9845255.1022240.0785M15 sulfonation4.95P, S, U
M290.76C16H12O10S395.0078347.2233331.2281M15 sulfonation1.38P
M301.17C15H10O10S380.9922195.1384181.1232M15 sulfonation1.43P
M310.81C22H20O12475.0877299.0553284.0332M15 glucuronidation0.10P, B
M323.36C23H22O13505.0988447.1352 M15 glucuronidation1.15P
M334.07C20H16O11431.0620355.1686 M15 glucuronidation1.30P
M341.21C28H32O15653.1761447.1342285.1258M1 dehydration7.11P
* P: plasma; S: stool; B: bile; U: urine; M1M34: 34 metabolites of complanatuside.
Table 2. The linear equation, correlation coefficients (R2), linear ranges, and lower limit of quantification (LLOQ) of CPS, RNG, and RNC in rat plasma.
AnalytesLinear EquationR2Linear Range (ng/mL)LLOQ (ng/mL)
CPSY = 0.0137X + 0.21180.99755.20–520.005.20
RNGY = 0.2714X − 0.43550.99512.04–510.002.04
RNCY = 0.2656X + 1.14380.99481.02–510.001.02
CPS: complanatuside; RNG: rhamnocitrin 3-O-β-glc; RNC: rhamnocitrin.
Table 3. The extraction recovery and matrix effect of CPS, RNG, and RNC in rat plasma (n = 6). RSD:relative standard deviation.
AnalystsQC Concentration (ng/mL)Extraction RecoveryMatrix Effect
Accuracy (%)RSD (%)Accuracy (%)RSD (%)
CPS2073.5 ± 8.75.5102.1 ± 4.411.3
12581.0 ± 5.16.092.7 ± 14.68.3
50076.7 ± 4.36.498.7 ± 2.97.4
RNG2083.7 ± 2.812.686.0 ± 7.55.4
12583.3 ± 1.96.797.7 ± 2.15.9
50083.2 ± 5.16.198.2 ± 2.93.8
RNC2090.3 ± 3.77.5101.1 ± 4.34.8
12589.0 ± 5.56.493.2 ± 2.33.3
50088.7 ± 3.79.895.6 ± 4.82.4
CPS: complanatuside; RNG: rhamnocitrin 3-O-β-glc; RNC: rhamnocitrin.
Table 4. The stability test of CPS, RNG, and RNC in rat plasma (n = 6).
AnalytesQC Concentration (ng/mL)Post Preparation StabilityShort-Term StabilityLong-Term StabilityFreeze-Thaw Stability
Mean (ng/mL)RSD (%)Mean (ng/mL)RSD (%)Mean (ng/mL)RSD (%)Mean (ng/mL)RSD (%)
CPS2018.6 ± 1.37.018.5 ± 1.47.617.4 ± 1.37.517.4 ± 1.26.9
125124.4 ± 11.29.0124.1 ± 6.25.0124.2 ± 9.17.3122.1 ± 5.54.5
500489.3 ± 22.64.6469.2 ± 12.52.7486.5 ± 26.25.4487.3 ± 23.74.9
RNG2019.3 ± 1.47.319.2 ± 1.36.818.7 ± 1.37.018.8 ± 0.94.8
125124.7 ± 10.98.7123.6 ± 6.75.4123.4 ± 10.68.6123.5 ± 7.66.2
500491.5 ± 23.44.8486.9 ± 23.34.8479.4 ± 24.85.2479.7 ± 12.82.7
RNC2019.2 ± 1.26.319.0 ± 1.15.819.7 ± 1.15.619.1 ± 0.84.1
125124.1 ± 10.58.5124.0 ± 5.94.6125.5 ± 6.95.5124.7 ± 9.77.8
500476.3 ± 33.67.1473.1 ± 25.15.3495.3 ± 20.54.1482.3 ± 14.33.1
CPS: complanatuside; RNG: rhamnocitrin 3-O-β-glc; RNC: rhamnocitrin.
Table 5. Intra-day and inter-day precision and accuracy of CPS, RNG, and RNC in rat plasma (n = 6).
AnalytesQC Concentration
(ng/mL)
Intra-DayInter-Day
Actual Conc.
(ng/mL)
Precision
(RSD, %)
Accuracy
(RE, %)
Actual Conc.
(ng/mL)
Precision
(RSD, %)
Accuracy
(RE, %)
CPS2019.6 ± 0.63.12.019.8 ± 1.99.61.0
125124.8 ± 7.35.80.2124.8 ± 6.25.00.2
500504.7 ± 24.24.8−0.9494.8 ± 17.93.61.0
RNG2019.2 ± 1.15.74.018.8 ± 1.79.06.0
125123.2 ± 5.84.71.4125.4 ± 2.191.7−0.3
500504.7 ± 21.44.2−0.9498.6 ± 18.23.70.3
RNC2019.3 ± 1.05.23.518.7 ± 1.910.16.5
125125.8 ± 4.93.9−0.6122.4 ± 10.58.62.1
500496.9 ± 13.62.70.6505.8 ± 13.52.7−1.2
CPS: complanatuside; RNG: rhamnocitrin 3-O-β-glc; RNC: rhamnocitrin.RE: relative error.
Table 6. The pharmacokinetic parameters of CPS, RNG, and RNC in rats after oral administration of complanatuside ( X ¯ ± S , n = 8).
AnalytesCmax (ng/mL)Tmax (h)t1/2 (h)AUC(0-t) (µg/L·h)AUC(0-∞) (µg/L·h)MRT(0-t) (h)
CPS119.15 ± 11.251.00 ± 0.360.51 ± 0.04143.52 ± 15.73143.52 ± 15.731.72 ± 0.19
RNG111.64 ± 14.683.00 ± 0.251.33 ± 0.55381.73 ± 24.13387.21 ± 28.064.28 ± 0.55
RNC1122.18 ± 113.325.33 ± 0.634.15 ± 0.496540.14 ± 433.706627.61 ± 471.834.99 ± 0.11
CPS: complanatuside; RNG: rhamnocitrin 3-O-β-glc; RNC: rhamnocitrin; Cmax: the maximum plasma concentration; Tmax: the time to reach the maximum drug concentration; t1/2: half-life; AUC: the area under the plasma concentration-time curve; MRT: the mean residence time.

