
Quality Evaluation of Tricholoma matsutake Based on the Nucleic Acid Compounds by UPLC-TOF/MS and UPLC-QqQ/MS

 and
and
Abstract
:1. Introduction
2. Results and Discussion
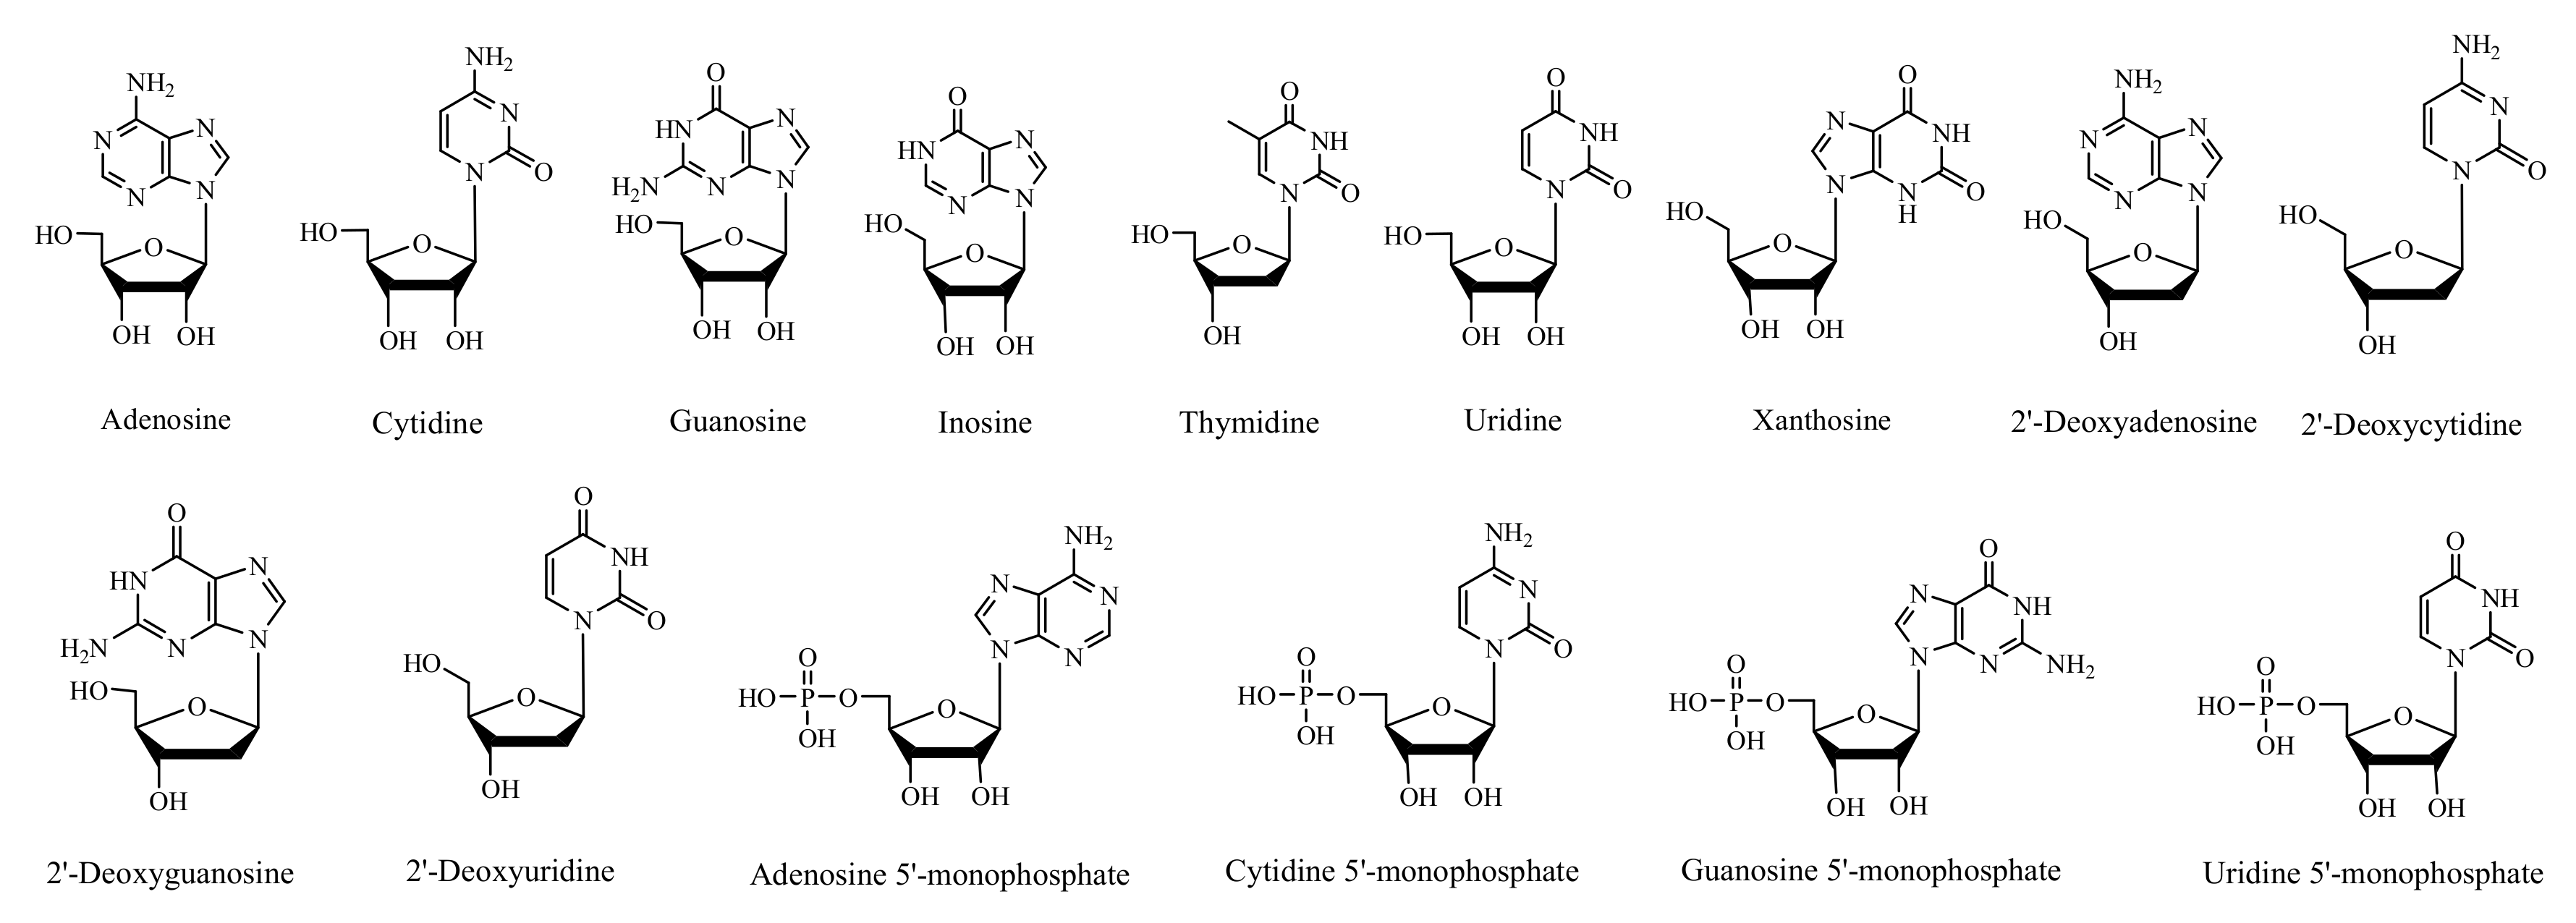
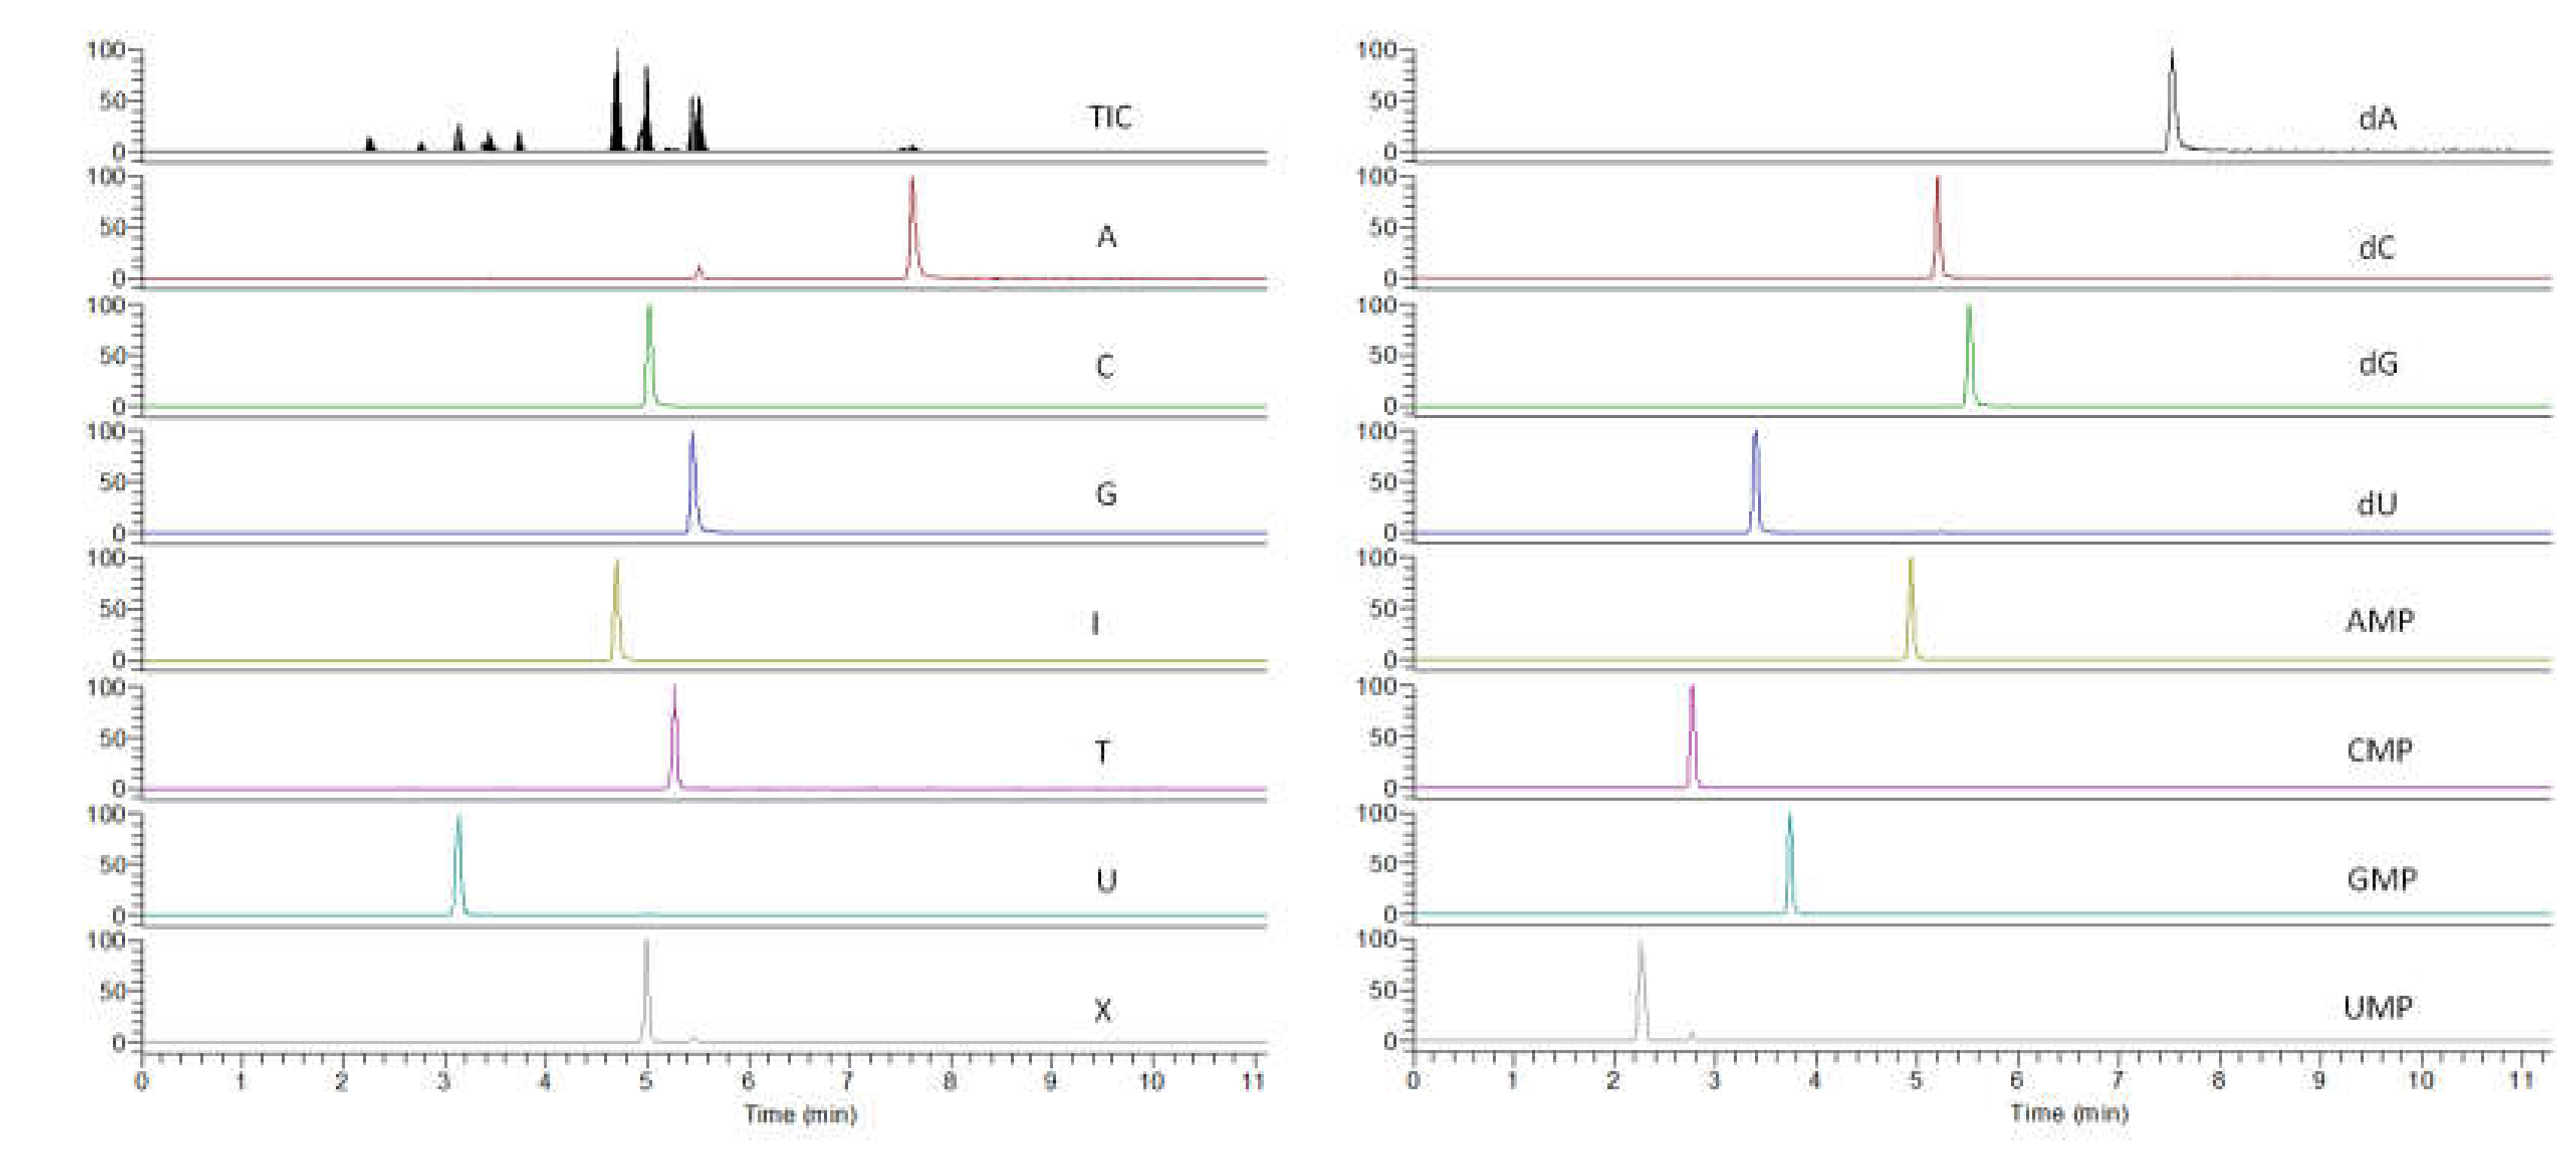
2.1. Scanning and Identification of Nucleic Acid Compounds by UPLC-TOF/MS
2.2. Determination of Nucleic Acid Compounds by UPLC-QqQ/MS
2.2.1. Optimization of the UPLC-QqQ/MS Condition
2.2.2. Analytical Figures of Merit
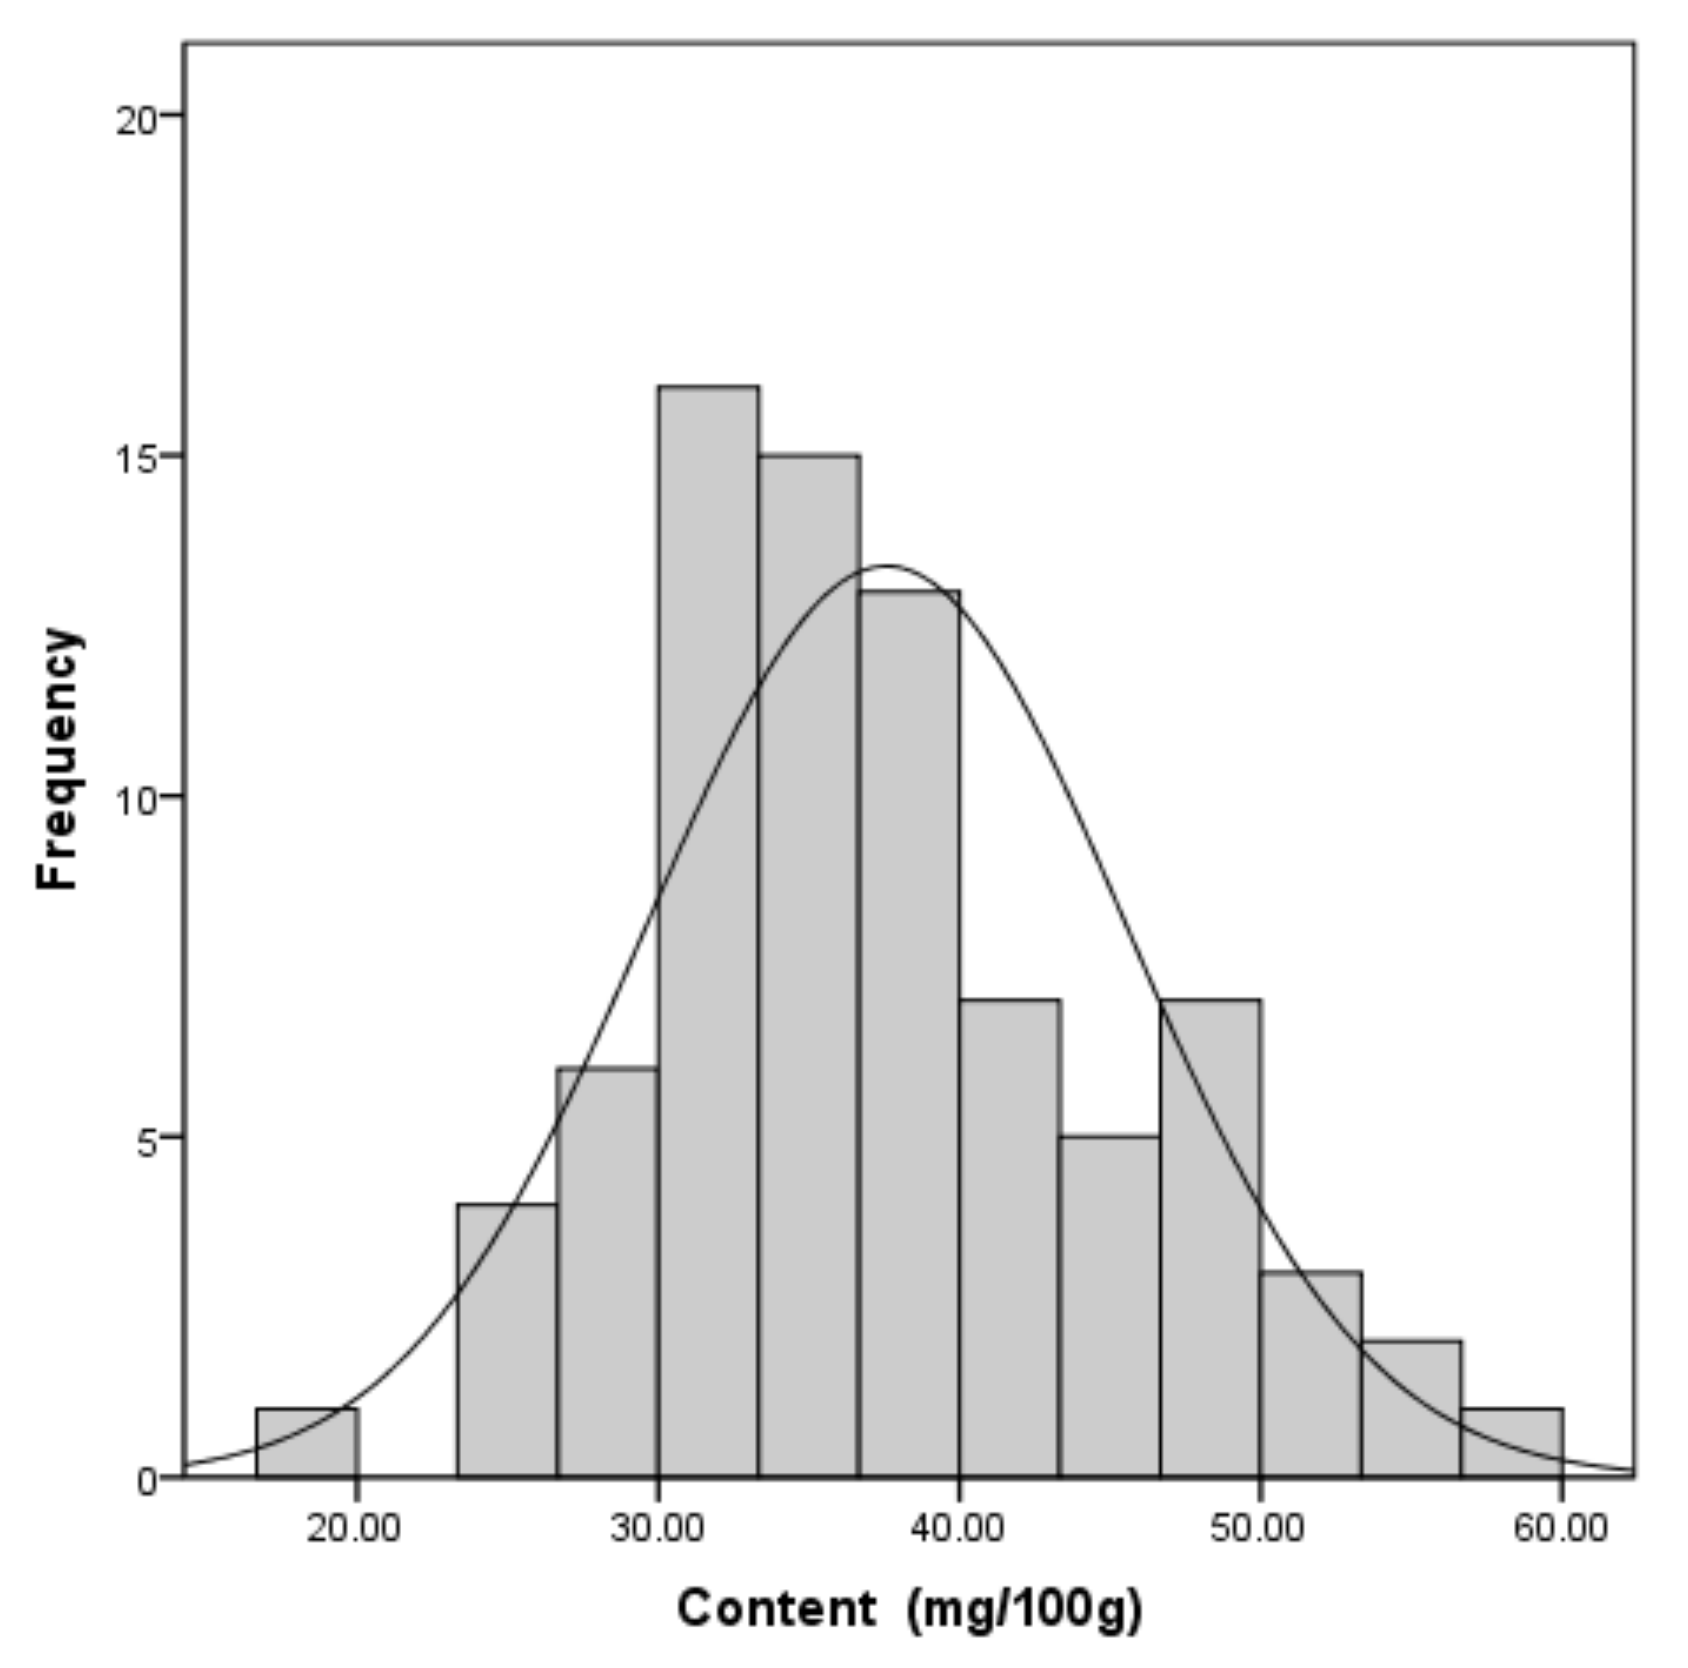
2.3. Quality Evaluation of T. matsutake Samples
3. Material and Methods
3.1. Chemicals and Reagents
3.2. Preparation of Standard Solution
3.3. Sample Preparation
3.4. Scanning and Identification of Nucleic Acid Compounds by UPLC-TOF/MS
3.5. Determination of Nucleic Acid Compounds by UPLC-QqQ/MS
4. Conclusions
Supplementary Materials
Author Contributions
Funding
Conflicts of Interest
References
- Kim, S.S.; Lee, J.S.; Cho, J.Y.; Kim, Y.E.; Hong, E.K. Process development for mycelial growth and polysaccharide production in Tricholoma matsutake liquid culture. J. Biosci. Bioeng. 2010, 109, 351–355. [Google Scholar] [CrossRef] [PubMed]
- Chen, Y.; Du, X.J.; Zhang, Y.; Liu, X.H.; Wang, X.D. Ultrasound extraction optimization, structural features, and antioxidant activity of polysaccharides from Tricholoma matsutake. J. Zhejiang Univ.-Sci. B 2017, 18, 674–684. [Google Scholar] [CrossRef] [PubMed]
- Hoshi, H.; Iijima, H.; Ishihara, Y.; Yasuhara, T.; Matsunaga, K. Absorption and tissue distribution of an immunomodulatory α-d-glucan after oral administration of Tricholoma matsutake. J. Agric. Food Chem. 2008, 56, 7715–7720. [Google Scholar] [CrossRef] [PubMed]
- Li, Q.; Wang, Y.Z.; Chen, Y.L.; Teng, M.Y.; He, J.; Wang, X.H.; Kong, F.G.; Teng, L.R.; Wang, D. Investigation of the immunomodulatory activity of Tricholoma matsutake mycelium in cyclophosphamide-induced immunosuppressed mice. Mol. Med. Rep. 2017, 16, 4320–4326. [Google Scholar] [CrossRef] [PubMed]
- Ikekawa, T.; Uehara, N.; Maeda, Y.; Nakanishi, M.; Fukuoka, F. Antitumor activity of aqueous extracts of edible mushrooms. Cancer Res. 1969, 29, 734–735. [Google Scholar] [PubMed]
- Yang, S.; Ren, X.; Sheng, J.; Lu, J.; Li, T.; Tang, F.; Wang, Y.; Meng, L.; Meng, Q.; Teng, L. Preparation and the antitumor activity in vitro of polysaccharides from Tricholoma matsutake. World J. Microb. Biotechnol. 2010, 26, 497–503. [Google Scholar] [CrossRef]
- Ying, X.H.; Ma, J.F.; Liang, Q.L.; Wang, Y.M.; Bai, G.; Luo, G.A. Identification and analysis of the constituents in an aqueous extract of Tricholoma matsutake by HPLC coupled with diode array detection/electrospray ionization mass spectrometry. J. Food Sci. 2013, 78, C1173–C1182. [Google Scholar] [CrossRef] [PubMed]
- Jacobson, K.A.; Costanzi, S.; Ohno, M.; Joshi, B.V.; Besada, P.; Xu, B.; Tchilibon, S. Molecular recognition at purine and pyrimidine nucleotide (P2) receptors. Curr. Top. Med. Chem. 2004, 4, 805–819. [Google Scholar] [CrossRef] [PubMed]
- Wachowius, F.; Attwater, J.; Holliger, P. Nucleic acids: Function and potential for abiogenesis. Q. Rev. Biophys. 2017, 50, e4. [Google Scholar] [CrossRef] [PubMed]
- Local Standards for the Safety of Tricholoma Matsutake and Its Products, DBS 51/006-2018, Health Commission of Sichuan Province & Sichuan Food and Drug Administration. Available online: http://www.scwst.gov.cn/xx/gsgg/201807/t20180704_17504.html (accessed on 20 July 2018).
- Chen, C.; Xue, Y.; Li, Q.-M.; Wu, Y.; Liang, J.; Qing, L.-S. Neutral loss scan—based strategy for integrated identification of amorfrutin derivatives, new peroxisome proliferator-activated receptor gamma agonists, from Amorpha Fruticosa by UPLC-QqQ-MS/MS and UPLC-Q-TOF-MS. J. Am. Soc. Mass Spectrom. 2018, 29, 685–693. [Google Scholar] [CrossRef] [PubMed]
- Qing, L.-S.; Xue, Y.; Liu, Y.-M.; Liang, J.; Xie, J.; Liao, X. Rapid magnetic solid-phase extraction for the selective determination of isoflavones in soymilk using baicalin-functionalized magnetic nanoparticles. J. Agric. Food Chem. 2013, 61, 8072–8078. [Google Scholar] [CrossRef] [PubMed]
- Geis-Asteggiante, L.; Nuñez, A.; Lehotay, S.J.; Lightfield, A.R. Structural characterization of product ions by electrospray ionization and quadrupole time-of-flight mass spectrometry to support regulatory analysis of veterinary drug residues in foods. Rapid Commun. Mass Spectrom. 2014, 28, 1061–1081. [Google Scholar] [CrossRef] [PubMed]
- Chen, Y.J.; Liang, Z.T.; Zhu, Y.; Xie, G.Y.; Tian, M.; Zhao, Z.Z.; Qin, M.J. Tissue-specific metabolites profiling and quantitative analyses of flavonoids in the rhizome of Belamcanda chinensis by combining laser-microdissection with UHPLC-Q/TOF-MS and UHPLC-QqQ-MS. Talanta 2014, 130, 585–597. [Google Scholar] [CrossRef] [PubMed]
- Gross, M.L. Accurate masses for structure confirmation. J. Am. Soc. Mass Sp. 1994, 5, 57. [Google Scholar] [CrossRef]
- Sun, W.-X.; Zhang, Z.-F.; Xie, J.; He, Y.; Cheng, Y.; Ding, L.-S.; Luo, P.; Qing, L.-S. Determination of a astragaloside IV derivative LS-102 in plasma by ultra-performance liquid chromatography-tandem mass spectrometry in dog plasma and its application in a pharmacokinetic study. Phytomedicine 2019, 53, 243–251. [Google Scholar] [CrossRef]
- Xie, J.; Li, J.; Liang, J.; Luo, P.; Qing, L.-S.; Ding, L.-S. Determination of contents of catechins in oolong teas by quantitative analysis of multi-components via a single marker (QAMS) method. Food Anal. Methods 2017, 10, 363–368. [Google Scholar] [CrossRef]
- Kinnamon, S.C. Umami taste transduction mechanisms. Am. J. Clin. Nutr. 2009, 90, S753–S755. [Google Scholar] [CrossRef] [PubMed]
- Tricholoma matsutake, GB/T 23188-2008, National Standard of the People’s Republic of China. Available online: http://www.gb688.cn/bzgk/gb/newGbInfo?hcno=EE887FA3F6717085FB88AFF35C8D092B (accessed on 1 June 2009).
Sample Availability: Samples of the all compounds are available from the authors. |

| Analyte | TOF/MS | QqQ/MS | ||
|---|---|---|---|---|
| Quasi-Molecular Ion (m/z) | Error (ppm) | Parent Ion (m/z) | Product Ion (m/z) | |
| A | 266.09019 | 2.7 | 266 | 134 *, 107 # |
| C | 242.07717 | −4.4 | 242 | 152 #, 109 * |
| G | 282.08436 | −0.1 | 282 | 133 #, 150 * |
| I | 267.07231 | −4.4 | 267 | 135 *, 92 # |
| T | 241.08235 | −2.7 | 241 | 151 *, 125 # |
| U | 243.06279 | 2.2 | 243 | 152 #, 110 * |
| X | 283.06741 | −3.5 | 283 | 151 *, 108 # |
| dA | 250.09446 | −0.4 | 250 | 160 #, 134 * |
| dC | 226.08297 | −1.6 | 226 | 135 #, 93 * |
| dG | 266.08899 | −1.8 | 266 | 150 *, 133 # |
| dU | 227.06625 | −4.8 | 227 | 184 *, 94 # |
| AMP | 346.05423 | −4.6 | 346 | 211 #, 79 * |
| CMP | 322.04404 | −1.7 | 322 | 211 #, 79 * |
| GMP | 362.0499 | −2.3 | 362 | 211 #, 79 * |
| UMP | 323.02825 | −1.1 | 323 | 211 #, 79 * |
| Analyte | Regression Equation | Linear Range (ng/L) | LOD | LOQ | Precision (RSD, n = 6) | Repeatability (n = 6) | Recovery (n = 6) | |||
|---|---|---|---|---|---|---|---|---|---|---|
| (y = ax + b, r2) | (ng) | (ng) | Intra-Day (%) | Inter-Day (%) | Mean (mg/100g) | RSD (%) | Mean (%) | RSD (%) | ||
| A | y = 240.695 + 6301.38x, 0.9998 | 0.12~11.15 | 0.04 | 0.12 | 2.71 | 3.99 | 12.29 | 0.77 | 99.1 | 2.33 |
| C | y = 264.791 + 9060.44x, 0.9997 | 0.10~9.95 | 0.01 | 0.03 | 2.68 | 2.95 | 3.48 | 1.35 | 97.2 | 3.01 |
| G | y = 1363.37 + 47042.3x, 0.9999 | 0.10~9.87 | 0.01 | 0.03 | 2.85 | 3.32 | 11.68 | 0.83 | 98.5 | 2.70 |
| I | y = 5409.88 + 74348.5x, 0.9998 | 0.12~11.68 | 0.01 | 0.03 | 2.51 | 3.62 | 1.54 | 2.27 | 98.9 | 2.67 |
| T | y = 166.893 + 2164.58x, 0.9992 | 0.10~9.92 | 0.03 | 0.09 | 1.38 | 2.60 | 0.20 | 3.01 | 96.3 | 4.38 |
| U | y = −591.107 + 18137.6x, 0.9993 | 0.09~8.91 | 0.03 | 0.09 | 2.93 | 3.33 | 7.30 | 1.01 | 98.6 | 2.39 |
| X | y = 3103.68 + 57804.6x, 0.9998 | 0.10~9.83 | 0.01 | 0.03 | 1.82 | 2.04 | 0.12 | 2.68 | 100.06 | 4.88 |
| dA | y = 295.259 + 5284.18x, 0.9997 | 0.12~11.50 | 0.04 | 0.12 | 1.50 | 2.99 | 0.99 | 3.32 | 98.5 | 3.29 |
| dC | y = 157.122 + 4241.14x, 0.9971 | 0.09~8.80 | 0.03 | 0.09 | 3.70 | 4.29 | 0.23 | 3.40 | 96.9 | 3.98 |
| dG | y = 1235.86 + 44695.6x, 1.0000 | 0.09~8.77 | 0.01 | 0.03 | 2.87 | 3.28 | 0.42 | 2.88 | 97.7 | 3.74 |
| dU | y = − 13.5999 + 1756.23x, 0.9988 | 0.09~9.16 | 0.03 | 0.09 | 2.48 | 3.58 | 0.37 | 3.95 | 100.12 | 4.05 |
| AMP | y = 440.578 + 8906.34x, 0.9989 | 0.10~10.40 | 0.01 | 0.03 | 3.25 | 3.97 | 0.75 | 3.45 | 97.7 | 4.46 |
| CMP | y = − 264.393 + 5715.24x, 0.9998 | 0.10~9.88 | 0.01 | 0.03 | 3.56 | 4.42 | 2.74 | 1.65 | 99.6 | 3.59 |
| GMP | y = 467.242 + 6476.87x, 0.9978 | 0.11~11.28 | 0.01 | 0.03 | 3.46 | 4.49 | 3.80 | 1.83 | 98.4 | 3.03 |
| UMP | y = − 47.7751 + 7174.29x, 0.9996 | 0.12~11.48 | 0.01 | 0.03 | 2.64 | 2.92 | 0.41 | 2.36 | 95.8 | 4.20 |
| No. | Location | A | C | G | I | T | U | X | dA | dC | dG | dU | AMP | CMP | GMP | UMP | Total |
|---|---|---|---|---|---|---|---|---|---|---|---|---|---|---|---|---|---|
| S-01 | Jiulong | 8.41 | 2.49 | 6.97 | 1.07 | 0.01 | 5.09 | 0.78 | 0.21 | 0.29 | 0.87 | 2.32 | 3.06 | 0.52 | 32.08 ± 2.73 | ||
| S-02 | Jiulong | 8.11 | 2.45 | 7.41 | 1.16 | 0.24 | 5.47 | 0.60 | 0.14 | 0.32 | 0.06 | 0.88 | 2.31 | 3.24 | 0.47 | 32.87 ± 2.75 | |
| S-03 | Jiulong | 12.83 | 3.40 | 10.90 | 1.24 | 0.15 | 7.56 | 0.69 | 0.34 | 0.88 | 3.16 | 4.69 | 0.53 | 46.39 ± 4.35 | |||
| S-04 | Jiulong | 15.22 | 3.56 | 11.32 | 1.26 | 0.03 | 7.61 | 0.86 | 0.38 | 0.24 | 0.86 | 3.22 | 4.62 | 0.50 | 49.67 ± 4.79 | ||
| S-05 | Jiulong | 12.29 | 3.48 | 11.68 | 1.54 | 0.20 | 7.30 | 0.12 | 0.99 | 0.23 | 0.42 | 0.37 | 0.75 | 2.74 | 3.80 | 0.41 | 46.33 ± 4.11 |
| S-06 | Jiulong | 9.11 | 2.71 | 7.92 | 0.91 | 5.56 | 0.58 | 0.14 | 0.32 | 0.29 | 0.67 | 1.15 | 1.61 | 0.29 | 31.25 ± 3.09 | ||
| S-07 | Jiulong | 7.89 | 1.93 | 6.10 | 0.94 | 4.70 | 0.37 | 0.02 | 0.19 | 0.95 | 2.31 | 2.74 | 0.58 | 28.71 ± 2.55 | |||
| S-08 | Jiulong | 14.53 | 3.28 | 11.02 | 1.38 | 7.67 | 0.61 | 0.05 | 0.32 | 0.33 | 0.87 | 2.54 | 3.87 | 0.40 | 46.87 ± 4.64 | ||
| S-09 | Jiulong | 14.19 | 3.03 | 11.56 | 1.27 | 7.29 | 0.75 | 0.09 | 0.39 | 0.26 | 0.90 | 3.94 | 5.24 | 0.53 | 49.43 ± 4.62 | ||
| S-10 | Jiulong | 10.44 | 2.97 | 8.17 | 1.15 | 6.09 | 0.87 | 0.29 | 0.43 | 0.22 | 1.07 | 2.92 | 4.06 | 0.54 | 39.22 ± 3.32 | ||
| S-11 | Jiulong | 12.00 | 2.83 | 9.38 | 1.06 | 0.49 | 6.66 | 0.92 | 0.08 | 0.36 | 0.20 | 0.46 | 1.69 | 2.96 | 0.39 | 39.46 ± 3.80 | |
| S-12 | Jiulong | 13.09 | 2.88 | 10.00 | 1.23 | 6.69 | 0.71 | 0.05 | 0.31 | 0.11 | 1.97 | 4.85 | 6.62 | 0.58 | 49.09 ± 4.21 | ||
| S-13 | Jiulong | 7.84 | 1.90 | 6.61 | 0.86 | 4.35 | 0.47 | 0.00 | 0.24 | 0.10 | 1.62 | 2.88 | 3.24 | 0.53 | 30.65 ± 2.55 | ||
| S-14 | Jiulong | 13.66 | 3.12 | 10.77 | 1.13 | 0.37 | 5.83 | 0.77 | 0.28 | 0.10 | 1.32 | 3.82 | 5.94 | 0.51 | 47.62 ± 4.34 | ||
| S-15 | Jiulong | 14.70 | 2.50 | 10.99 | 1.11 | 6.88 | 1.01 | 0.17 | 0.34 | 1.72 | 5.67 | 8.16 | 0.72 | 53.99 ± 4.79 | |||
| S-16 | Jiulong | 10.64 | 2.73 | 9.31 | 1.22 | 0.67 | 5.92 | 0.94 | 0.49 | 0.15 | 0.82 | 2.43 | 3.41 | 0.45 | 39.17 ± 3.49 | ||
| S-17 | Jiulong | 14.93 | 3.32 | 12.35 | 1.58 | 0.16 | 8.24 | 0.03 | 0.91 | 0.17 | 0.41 | 0.15 | 1.12 | 3.66 | 4.88 | 0.48 | 52.38 ± 4.73 |
| S-18 | Jiulong | 12.40 | 2.57 | 9.52 | 1.11 | 0.37 | 6.24 | 0.77 | 0.43 | 0.75 | 2.42 | 3.35 | 0.47 | 40.40 ± 3.98 | |||
| S-19 | Jiulong | 10.72 | 2.58 | 9.85 | 0.85 | 6.93 | 0.80 | 0.40 | 0.19 | 1.20 | 2.87 | 3.53 | 0.41 | 40.34 ± 3.75 | |||
| S-20 | Jiulong | 5.58 | 1.09 | 3.56 | 0.48 | 0.03 | 3.12 | 0.20 | 0.09 | 0.49 | 1.07 | 1.49 | 0.48 | 17.68 ± 1.73 | |||
| S-21 | Jiulong | 10.71 | 2.33 | 9.31 | 1.15 | 0.37 | 6.04 | 0.70 | 0.30 | 0.10 | 1.04 | 2.81 | 4.42 | 0.55 | 39.82 ± 3.56 | ||
| S-22 | Jiulong | 11.06 | 2.54 | 8.82 | 1.06 | 6.13 | 1.09 | 0.21 | 0.47 | 0.94 | 2.78 | 3.29 | 0.48 | 38.87 ± 3.57 | |||
| S-23 | Jiulong | 15.45 | 2.97 | 11.81 | 1.17 | 0.21 | 7.98 | 0.01 | 1.21 | 0.38 | 1.50 | 6.67 | 8.79 | 0.72 | 58.88 ± 5.10 | ||
| S-24 | Jiulong | 11.68 | 2.81 | 9.08 | 1.04 | 6.10 | 0.95 | 0.10 | 0.33 | 0.17 | 1.18 | 3.95 | 5.94 | 0.62 | 43.96 ± 3.77 | ||
| S-25 | Jiulong | 11.92 | 3.76 | 11.02 | 1.14 | 0.44 | 7.40 | 0.89 | 0.21 | 0.42 | 0.05 | 0.23 | 1.39 | 2.06 | 0.36 | 41.30 ± 4.11 | |
| S-26 | Jiulong | 14.04 | 2.82 | 10.35 | 1.32 | 7.14 | 0.64 | 0.33 | 0.30 | 1.64 | 5.45 | 8.18 | 0.70 | 52.92 ± 4.59 | |||
| S-27 | Jiulong | 12.63 | 2.11 | 8.23 | 1.12 | 5.49 | 0.19 | 0.84 | 0.08 | 0.32 | 2.18 | 8.02 | 8.97 | 0.94 | 51.12 ± 4.22 | ||
| S-28 | Jiulong | 14.93 | 3.37 | 11.71 | 1.37 | 0.40 | 7.87 | 0.00 | 1.18 | 0.18 | 0.48 | 0.29 | 5.23 | 6.38 | 0.62 | 54.04 ± 4.78 | |
| S-29 | Jiulong | 10.35 | 3.53 | 6.95 | 1.61 | 0.49 | 6.23 | 0.05 | 1.42 | 0.12 | 0.48 | 0.35 | 2.70 | 5.36 | 6.59 | 0.66 | 46.90 ± 3.22 |
| S-30 | Jiulong | 8.55 | 2.87 | 6.22 | 1.49 | 0.19 | 7.48 | 0.06 | 0.82 | 0.37 | 0.36 | 2.70 | 3.86 | 5.41 | 0.77 | 41.15 ± 2.91 | |
| S-31 | Xiaojin | 9.30 | 2.19 | 6.76 | 1.28 | 7.64 | 0.44 | 0.03 | 0.28 | 0.71 | 1.74 | 2.82 | 0.26 | 33.44 ± 3.24 | |||
| S-32 | Xiaojin | 9.55 | 2.24 | 7.52 | 1.62 | 0.13 | 8.27 | 0.00 | 0.47 | 0.19 | 0.24 | 0.79 | 1.66 | 2.37 | 0.16 | 35.22 ± 3.33 | |
| S-33 | Xiaojin | 6.52 | 1.25 | 5.90 | 1.21 | 5.52 | 0.04 | 0.62 | 0.33 | 0.75 | 1.48 | 2.47 | 0.28 | 26.37 ± 2.38 | |||
| S-34 | Xiaojin | 9.40 | 2.27 | 7.71 | 1.82 | 8.49 | 0.08 | 0.44 | 0.08 | 0.32 | 0.74 | 1.68 | 2.44 | 0.21 | 35.69 ± 3.42 | ||
| S-35 | Xiaojin | 10.06 | 2.20 | 8.31 | 2.21 | 11.26 | 0.03 | 0.30 | 0.10 | 0.35 | 0.14 | 0.77 | 1.61 | 2.51 | 0.19 | 40.03 ± 3.94 | |
| S-36 | Xiaojin | 8.95 | 2.15 | 7.18 | 1.66 | 0.28 | 8.45 | 0.05 | 0.46 | 0.09 | 0.28 | 0.64 | 0.96 | 1.71 | 0.15 | 33.01 ± 3.25 | |
| S-37 | Xiaojin | 9.20 | 2.04 | 7.22 | 1.84 | 0.38 | 10.02 | 0.06 | 0.44 | 0.25 | 0.11 | 0.47 | 1.05 | 1.71 | 0.12 | 34.93 ± 3.53 | |
| S-38 | Xiaojin | 9.51 | 2.32 | 7.14 | 1.83 | 0.17 | 7.96 | 0.02 | 0.34 | 0.21 | 0.75 | 1.45 | 2.25 | 0.18 | 34.13 ± 3.31 | ||
| S-39 | Xiaojin | 7.79 | 2.11 | 6.04 | 1.05 | 0.27 | 6.66 | 0.41 | 0.10 | 0.24 | 0.65 | 0.84 | 0.13 | 26.30 ± 2.88 | |||
| S-40 | Xiaojin | 7.48 | 1.73 | 5.71 | 1.07 | 0.23 | 6.41 | 0.25 | 0.04 | 0.18 | 0.03 | 0.35 | 0.53 | 0.80 | 0.11 | 24.91 ± 2.64 | |
| S-41 | Xiaojin | 7.92 | 2.02 | 6.72 | 1.64 | 0.26 | 6.98 | 0.22 | 0.06 | 0.20 | 0.64 | 1.28 | 1.80 | 0.19 | 29.94 ± 2.89 | ||
| S-42 | Xiaojin | 6.48 | 2.04 | 5.67 | 1.45 | 0.41 | 6.09 | 0.50 | 0.32 | 0.05 | 0.68 | 0.89 | 0.14 | 24.72 ± 2.49 | |||
| S-43 | Xiaojin | 10.13 | 2.14 | 8.16 | 1.76 | 0.25 | 9.41 | 0.38 | 0.08 | 0.26 | 0.77 | 1.58 | 2.44 | 0.16 | 37.52 ± 3.72 | ||
| S-44 | Xiaojin | 9.54 | 1.87 | 7.14 | 1.49 | 0.24 | 8.51 | 0.12 | 0.50 | 0.10 | 0.33 | 1.53 | 2.62 | 4.11 | 0.31 | 38.41 ± 3.30 | |
| S-45 | Xiaojin | 8.80 | 1.99 | 5.93 | 1.23 | 7.44 | 0.08 | 0.33 | 0.02 | 0.17 | 0.07 | 0.40 | 1.06 | 1.71 | 0.18 | 29.41 ± 2.99 | |
| S-46 | Xiaojin | 8.99 | 2.05 | 7.43 | 1.49 | 0.39 | 8.33 | 0.01 | 0.47 | 0.13 | 0.21 | 0.14 | 0.96 | 1.83 | 2.60 | 0.22 | 35.26 ± 3.17 |
| S-47 | Xiaojin | 8.71 | 2.22 | 6.82 | 1.46 | 0.59 | 7.12 | 0.30 | 0.21 | 0.08 | 0.59 | 1.28 | 2.04 | 0.20 | 31.61 ± 3.03 | ||
| S-48 | Xiaojin | 10.60 | 2.40 | 7.67 | 1.76 | 0.28 | 9.31 | 0.02 | 0.37 | 0.15 | 0.26 | 0.10 | 0.61 | 1.51 | 2.80 | 0.18 | 38.02 ± 3.60 |
| S-49 | Xiaojin | 9.17 | 1.83 | 7.13 | 2.11 | 0.46 | 8.24 | 0.38 | 0.08 | 0.31 | 0.23 | 1.08 | 1.78 | 2.73 | 0.23 | 35.76 ± 3.18 | |
| S-50 | Xiaojin | 8.72 | 2.11 | 7.22 | 1.41 | 0.35 | 7.26 | 0.64 | 0.09 | 0.45 | 0.29 | 0.57 | 1.53 | 2.24 | 0.21 | 33.10 ± 3.01 | |
| S-51 | Xiaojin | 7.93 | 1.79 | 6.37 | 1.31 | 0.34 | 7.78 | 0.33 | 0.10 | 0.26 | 0.31 | 1.00 | 1.55 | 2.33 | 0.21 | 31.60 ± 2.87 | |
| S-52 | Xiaojin | 9.73 | 2.02 | 6.90 | 1.89 | 0.23 | 9.44 | 0.07 | 0.43 | 0.07 | 0.31 | 0.09 | 1.33 | 2.36 | 3.46 | 0.28 | 38.60 ± 3.37 |
| S-53 | Xiaojin | 8.80 | 1.96 | 5.95 | 1.71 | 0.21 | 7.79 | 0.01 | 0.38 | 0.03 | 0.16 | 0.15 | 0.41 | 0.89 | 1.42 | 0.22 | 30.09 ± 2.97 |
| S-54 | Xiaojin | 7.80 | 1.89 | 6.73 | 2.13 | 0.08 | 8.20 | 0.04 | 0.25 | 0.02 | 0.21 | 0.15 | 0.66 | 1.43 | 1.75 | 0.19 | 31.52 ± 2.94 |
| S-55 | Xiaojin | 6.92 | 1.95 | 6.17 | 1.04 | 0.17 | 6.33 | 0.49 | 0.33 | 0.08 | 0.72 | 1.17 | 1.91 | 0.24 | 27.52 ± 2.56 | ||
| S-56 | Xiaojin | 8.44 | 1.96 | 6.63 | 1.27 | 0.45 | 7.73 | 0.03 | 0.45 | 0.14 | 0.24 | 0.21 | 0.58 | 1.18 | 2.11 | 0.19 | 31.63 ± 2.93 |
| S-57 | Xiaojin | 7.17 | 1.86 | 6.33 | 1.62 | 0.50 | 5.89 | 0.26 | 0.11 | 0.21 | 0.26 | 0.72 | 1.10 | 1.53 | 0.19 | 27.74 ± 2.51 | |
| S-58 | Xiaojin | 7.94 | 1.62 | 6.10 | 1.47 | 0.15 | 8.19 | 0.27 | 0.18 | 0.07 | 0.66 | 1.32 | 1.64 | 0.16 | 29.75 ± 3.01 | ||
| S-59 | Xiaojin | 10.36 | 2.36 | 8.51 | 2.06 | 9.45 | 0.11 | 0.42 | 0.03 | 0.36 | 0.17 | 0.99 | 2.31 | 3.65 | 0.23 | 41.01 ± 3.71 | |
| S-60 | Lixian | 8.41 | 2.49 | 6.97 | 1.07 | 0.01 | 5.09 | 0.78 | 0.21 | 0.29 | 0.87 | 2.32 | 3.06 | 0.52 | 32.09 ± 2.74 | ||
| S-61 | Lixian | 8.11 | 2.45 | 7.41 | 1.16 | 0.24 | 5.47 | 0.6 | 0.14 | 0.32 | 0.06 | 0.88 | 2.31 | 3.24 | 0.47 | 32.86 ± 2.75 | |
| S-62 | Lixian | 8.24 | 2.16 | 6.87 | 1.09 | 0.15 | 6.87 | 0.54 | 0.11 | 0.30 | 0.03 | 0.73 | 2.14 | 2.97 | 0.25 | 32.45 ± 2.87 | |
| S-63 | Lixian | 9.34 | 2.38 | 8.57 | 1.26 | 0.22 | 6.51 | 0.02 | 0.41 | 0.16 | 0.33 | 0.11 | 0.81 | 1.92 | 3.87 | 0.19 | 36.10 ± 3.20 |
| S-64 | Lixian | 8.15 | 2.61 | 7.12 | 1.18 | 0.15 | 5.95 | 0.01 | 0.32 | 0.07 | 0.19 | 0.09 | 0.67 | 1.59 | 2.18 | 0.16 | 30.44 ± 2.76 |
| S-65 | Lixian | 9.42 | 2.34 | 6.93 | 1.02 | 0.24 | 6.81 | 0.04 | 0.27 | 0.05 | 0.26 | 0.10 | 0.89 | 1.85 | 2.63 | 0.21 | 33.06 ± 3.03 |
| S-66 | Muli | 12.83 | 3.4 | 10.9 | 1.24 | 0.15 | 7.56 | 0.69 | 0.34 | 0.88 | 3.16 | 4.69 | 0.53 | 46.37 ± 4.35 | |||
| S-67 | Muli | 15.22 | 3.56 | 11.32 | 1.26 | 0.03 | 7.61 | 0.86 | 0.38 | 0.24 | 0.86 | 3.22 | 4.62 | 0.5 | 49.68 ± 4.79 | ||
| S-68 | Muli | 12.64 | 2.14 | 9.76 | 1.01 | 0.08 | 8.29 | 0.02 | 0.35 | 0.03 | 0.39 | 0.33 | 0.91 | 2.37 | 3.34 | 0.36 | 42.02 ± 4.05 |
| S-69 | Muli | 13.95 | 2.17 | 8.79 | 1.76 | 0.17 | 9.73 | 0.37 | 0.31 | 0.05 | 0.72 | 2.51 | 5.31 | 0.18 | 46.02 ± 4.53 | ||
| S-70 | Kangding | 9.3 | 2.19 | 6.76 | 1.28 | 7.64 | 0.44 | 0.03 | 0.28 | 0.71 | 1.74 | 2.82 | 0.26 | 33.45 ± 3.24 | |||
| S-71 | Kangding | 9.55 | 2.24 | 7.52 | 1.62 | 0.13 | 8.27 | 0.47 | 0.06 | 0.27 | 0.24 | 0.79 | 1.66 | 2.37 | 0.16 | 35.35 ± 3.33 | |
| S-72 | Kangding | 10.34 | 1.99 | 6.93 | 1.37 | 0.3 | 9.78 | 0.07 | 0.54 | 0.15 | 0.33 | 0.18 | 0.93 | 1.46 | 3.57 | 0.23 | 38.17 ± 3.54 |
| S-73 | Kangding | 7.99 | 2.07 | 8.25 | 1.82 | 0.24 | 8.73 | 0.02 | 0.49 | 0.11 | 0.24 | 0.36 | 0.85 | 2.87 | 2.28 | 0.19 | 36.51 ± 3.18 |
| S-74 | Kangding | 8.34 | 1.68 | 7.61 | 1.46 | 0.26 | 8.26 | 0.32 | 0.37 | 0.27 | 0.67 | 1.98 | 2.72 | 0.19 | 34.13 ± 3.20 | ||
| S-75 | Luding | 9.54 | 2.11 | 8.38 | 2.21 | 0.15 | 7.96 | 0.44 | 0.09 | 0.21 | 0.15 | 0.82 | 2.74 | 1.78 | 0.85 | 37.43 ± 3.35 | |
| S-76 | Luding | 8.83 | 2.17 | 8.18 | 1.84 | 0.28 | 6.67 | 0.07 | 0.54 | 0.1 | 0.19 | 0.27 | 0.77 | 2.93 | 1.9 | 0.34 | 35.08 ± 3.03 |
| S-77 | Luding | 8.14 | 2.53 | 9.34 | 1.49 | 0.07 | 8.29 | 0.06 | 0.47 | 0.14 | 0.31 | 0.33 | 0.59 | 2.35 | 2.34 | 0.56 | 37.01 ± 3.29 |
| S-78 | Yajiang | 8.92 | 1.97 | 8.16 | 1.05 | 0.21 | 8.31 | 0.39 | 0.18 | 0.09 | 0.83 | 1.67 | 1.1 | 0.66 | 33.54 ± 3.40 | ||
| S-79 | Yajiang | 9.37 | 2.28 | 7.38 | 1.83 | 0.02 | 9.27 | 0.03 | 0.5 | 0.08 | 0.3 | 0.29 | 0.91 | 1.92 | 3.65 | 0.48 | 38.31 ± 3.35 |
| S-80 | Yajiang | 8.16 | 2.54 | 7.91 | 1.17 | 0.19 | 8.99 | 0.02 | 0.51 | 0.05 | 0.28 | 0.24 | 0.56 | 1.85 | 2.91 | 0.53 | 35.91 ± 3.22 |
| 10.08 ± 2.40 | 2.40 ± 0.55 | 8.11 ± 1.84 | 1.38 ± 0.35 | 0.25 ± 0.15 | 7.32 ± 1.42 | 0.05 ± 0.04 | 0.58 ± 0.26 | 0.10 ± 0.06 | 0.30 ± 0.08 | 0.18 ± 0.10 | 0.92 ± 0.45 | 2.39 ± 1.38 | 3.34 ± 1.80 | 0.37 ± 0.20 |
© 2018 by the authors. Licensee MDPI, Basel, Switzerland. This article is an open access article distributed under the terms and conditions of the Creative Commons Attribution (CC BY) license (http://creativecommons.org/licenses/by/4.0/).
Share and Cite
Xue, Y.; Jin, W.; Xu, X.-S.; Yong, L.; Hu, B.; Xiong, J.; Hu, X.-M.; Qing, L.-S.; Xie, J. Quality Evaluation of Tricholoma matsutake Based on the Nucleic Acid Compounds by UPLC-TOF/MS and UPLC-QqQ/MS. Molecules 2019, 24, 34. https://doi.org/10.3390/molecules24010034
Xue Y, Jin W, Xu X-S, Yong L, Hu B, Xiong J, Hu X-M, Qing L-S, Xie J. Quality Evaluation of Tricholoma matsutake Based on the Nucleic Acid Compounds by UPLC-TOF/MS and UPLC-QqQ/MS. Molecules. 2019; 24(1):34. https://doi.org/10.3390/molecules24010034
Chicago/Turabian StyleXue, Ying, Wei Jin, Xian-Shun Xu, Li Yong, Bin Hu, Jing Xiong, Xue-Mei Hu, Lin-Sen Qing, and Jing Xie. 2019. "Quality Evaluation of Tricholoma matsutake Based on the Nucleic Acid Compounds by UPLC-TOF/MS and UPLC-QqQ/MS" Molecules 24, no. 1: 34. https://doi.org/10.3390/molecules24010034
APA StyleXue, Y., Jin, W., Xu, X.-S., Yong, L., Hu, B., Xiong, J., Hu, X.-M., Qing, L.-S., & Xie, J. (2019). Quality Evaluation of Tricholoma matsutake Based on the Nucleic Acid Compounds by UPLC-TOF/MS and UPLC-QqQ/MS. Molecules, 24(1), 34. https://doi.org/10.3390/molecules24010034